Article

Crystal Form Diversity of 2-(4-(Diphenylamino)benzylidene) Malononitrile

1
Department of Chemistry, Zhejiang University, Hangzhou 310058, China
2
Shanghai Pinghe School, Shanghai 201206, China
*
Author to whom correspondence should be addressed.
Crystals 2025, 15(4), 380; https://doi.org/10.3390/cryst15040380
Submission received: 28 March 2025 / Revised: 18 April 2025 / Accepted: 19 April 2025 / Published: 21 April 2025
(This article belongs to the Section Crystal Engineering)

Abstract

:
In the present work, we report the synthesis and characterization of 2-(4-(diphenylamino)benzylidene) malononitrile (DPAM) via a piperidine-catalyzed Knoevenagel condensation reaction. Two distinct crystal forms (A-1 and A-2) of this product were obtained by controlling the crystallization conditions, exhibiting orthorhombic and monoclinic crystal systems, respectively. Single-crystal X-ray diffraction revealed that both forms exhibited highly twisted benzene rings, which suppressed exciplex or excimer formation, enhancing luminescence. Crystal A-1, with a higher density, showed stronger hydrogen bonding and more rigid molecular packing, while A-2, with a lower density, exhibited weaker π–π interactions. Both crystals demonstrated high thermal stability. Notably, the A-2 crystal displayed a mechanochromic behavior: grinding or applying pressure induced a structural transformation into A-1, accompanied by a fluorescence shift from red to yellow. This transformation was attributed to increased steric hindrance and changes in molecular packing. This study highlights the relationship between crystal structure and optoelectronic properties, offering insights into the design of organic crystalline materials for applications in pressure sensing, anti-counterfeiting, and information encryption.

1. Introduction

Organic semiconductors have revolutionized modern electronics by offering a unique combination of flexibility, tunability, and cost-effectiveness, bridging the gap between traditional inorganic semiconductors and next-generation optoelectronic technologies [1,2,3,4,5,6,7]. Among these materials, triphenylamine (TPA) derivatives stand out as a cornerstone of organic semiconductor research due to their distinctive star-shaped molecular architecture, characterized by a central nitrogen atom covalently bonded to three phenyl rings. This molecular design not only imparts exceptional electron-donating capabilities but also enables efficient intramolecular charge transfer (ICT), a phenomenon driven by the spatial separation of electron-donating (D) and electron-accepting (A) groups connected through π-conjugated systems [8]. The ICT behavior in TPA derivatives is further amplified by their non-planar conformation, which arises from the steric hindrance between the phenyl rings and the sp³-hybridized nitrogen center. This three-dimensional geometry suppresses molecular aggregation, a common drawback in planar π-conjugated systems, while facilitating efficient charge transport, making TPA derivatives indispensable in organic electronics [9,10]. Their optoelectronic properties, including high hole mobility, broad spectral absorption, and tunable energy levels, are precisely modulated through substituent engineering, where functional groups such as methoxy, cyano, or carbazole are strategically introduced to adjust the highest occupied molecular orbital (HOMO) and lowest unoccupied molecular orbital (LUMO) levels [11,12]. These attributes have propelled TPA derivatives into diverse applications, ranging from light-emitting diodes (OLEDs) and perovskite solar cells (PSCs) to chemosensors for metal ion detection and bioimaging probes for cellular processes.
The versatility of TPA derivatives is exemplified by their applications in light-emitting diodes (OLEDs) [13,14,15], where they serve as high-performance hole-transporting layers (HTLs) and emissive materials. Their high hole mobility ensures efficient charge injection into emissive layers, while their amorphous nature mitigates crystallization-induced device degradation. In perovskite solar cells (PSCs) [16,17,18,19], TPA derivatives such as spiro-OMeTAD have become industry standards due to their optimal energy level alignment with perovskite absorbers like CH₃NH₃PbI₃. The star-shaped TPA core facilitates isotropic charge transport, while methoxy substituents passivate surface defects at the perovskite/HTL interface, reducing non-radiative recombination. Fluorinated TPA derivatives have further enhanced moisture resistance, addressing one of the critical stability issues of PSCs. Beyond energy conversion, TPA derivatives excel as chemosensors [20,21,22,23,24], leveraging their electron-rich nature to detect metal ions and nitroaromatic explosives through fluorescence quenching or colorimetric changes. The integration of TPA derivatives into organic field-effect transistors (OFETs) highlights their potential in flexible electronics [25,26,27,28]. Asymmetric TPA oligomers with branched alkyl chains demonstrate balanced ambipolar charge transport, maintaining solution processability while achieving switching frequencies of >1 MHz in complementary logic circuits. However, the commercialization of TPA-based technologies faces hurdles, including the scalability of synthesis and environmental durability. In conclusion, TPA derivatives epitomize the synergy between molecular design and functional performance in organic electronics, offering a versatile platform for applications spanning energy, sensing, and biomedicine. While challenges in stability and scalability persist, interdisciplinary advances in chemistry, materials science, and engineering hold the key to unlocking their full potential, positioning TPA-based materials at the forefront of sustainable, next-generation optoelectronic technologies.
The synthesis of TPA derivatives typically employs Buchwald–Hartwig amination [29] or Ullmann coupling [30] reactions, with substituent engineering (e.g., methoxy, cyano, or carbazole groups) allowing the precise modulation of the highest occupied molecular orbital (HOMO) levels. Despite these advances, challenges persist in balancing solubility, thermal stability, and environmental resistance, necessitating further molecular design innovations.
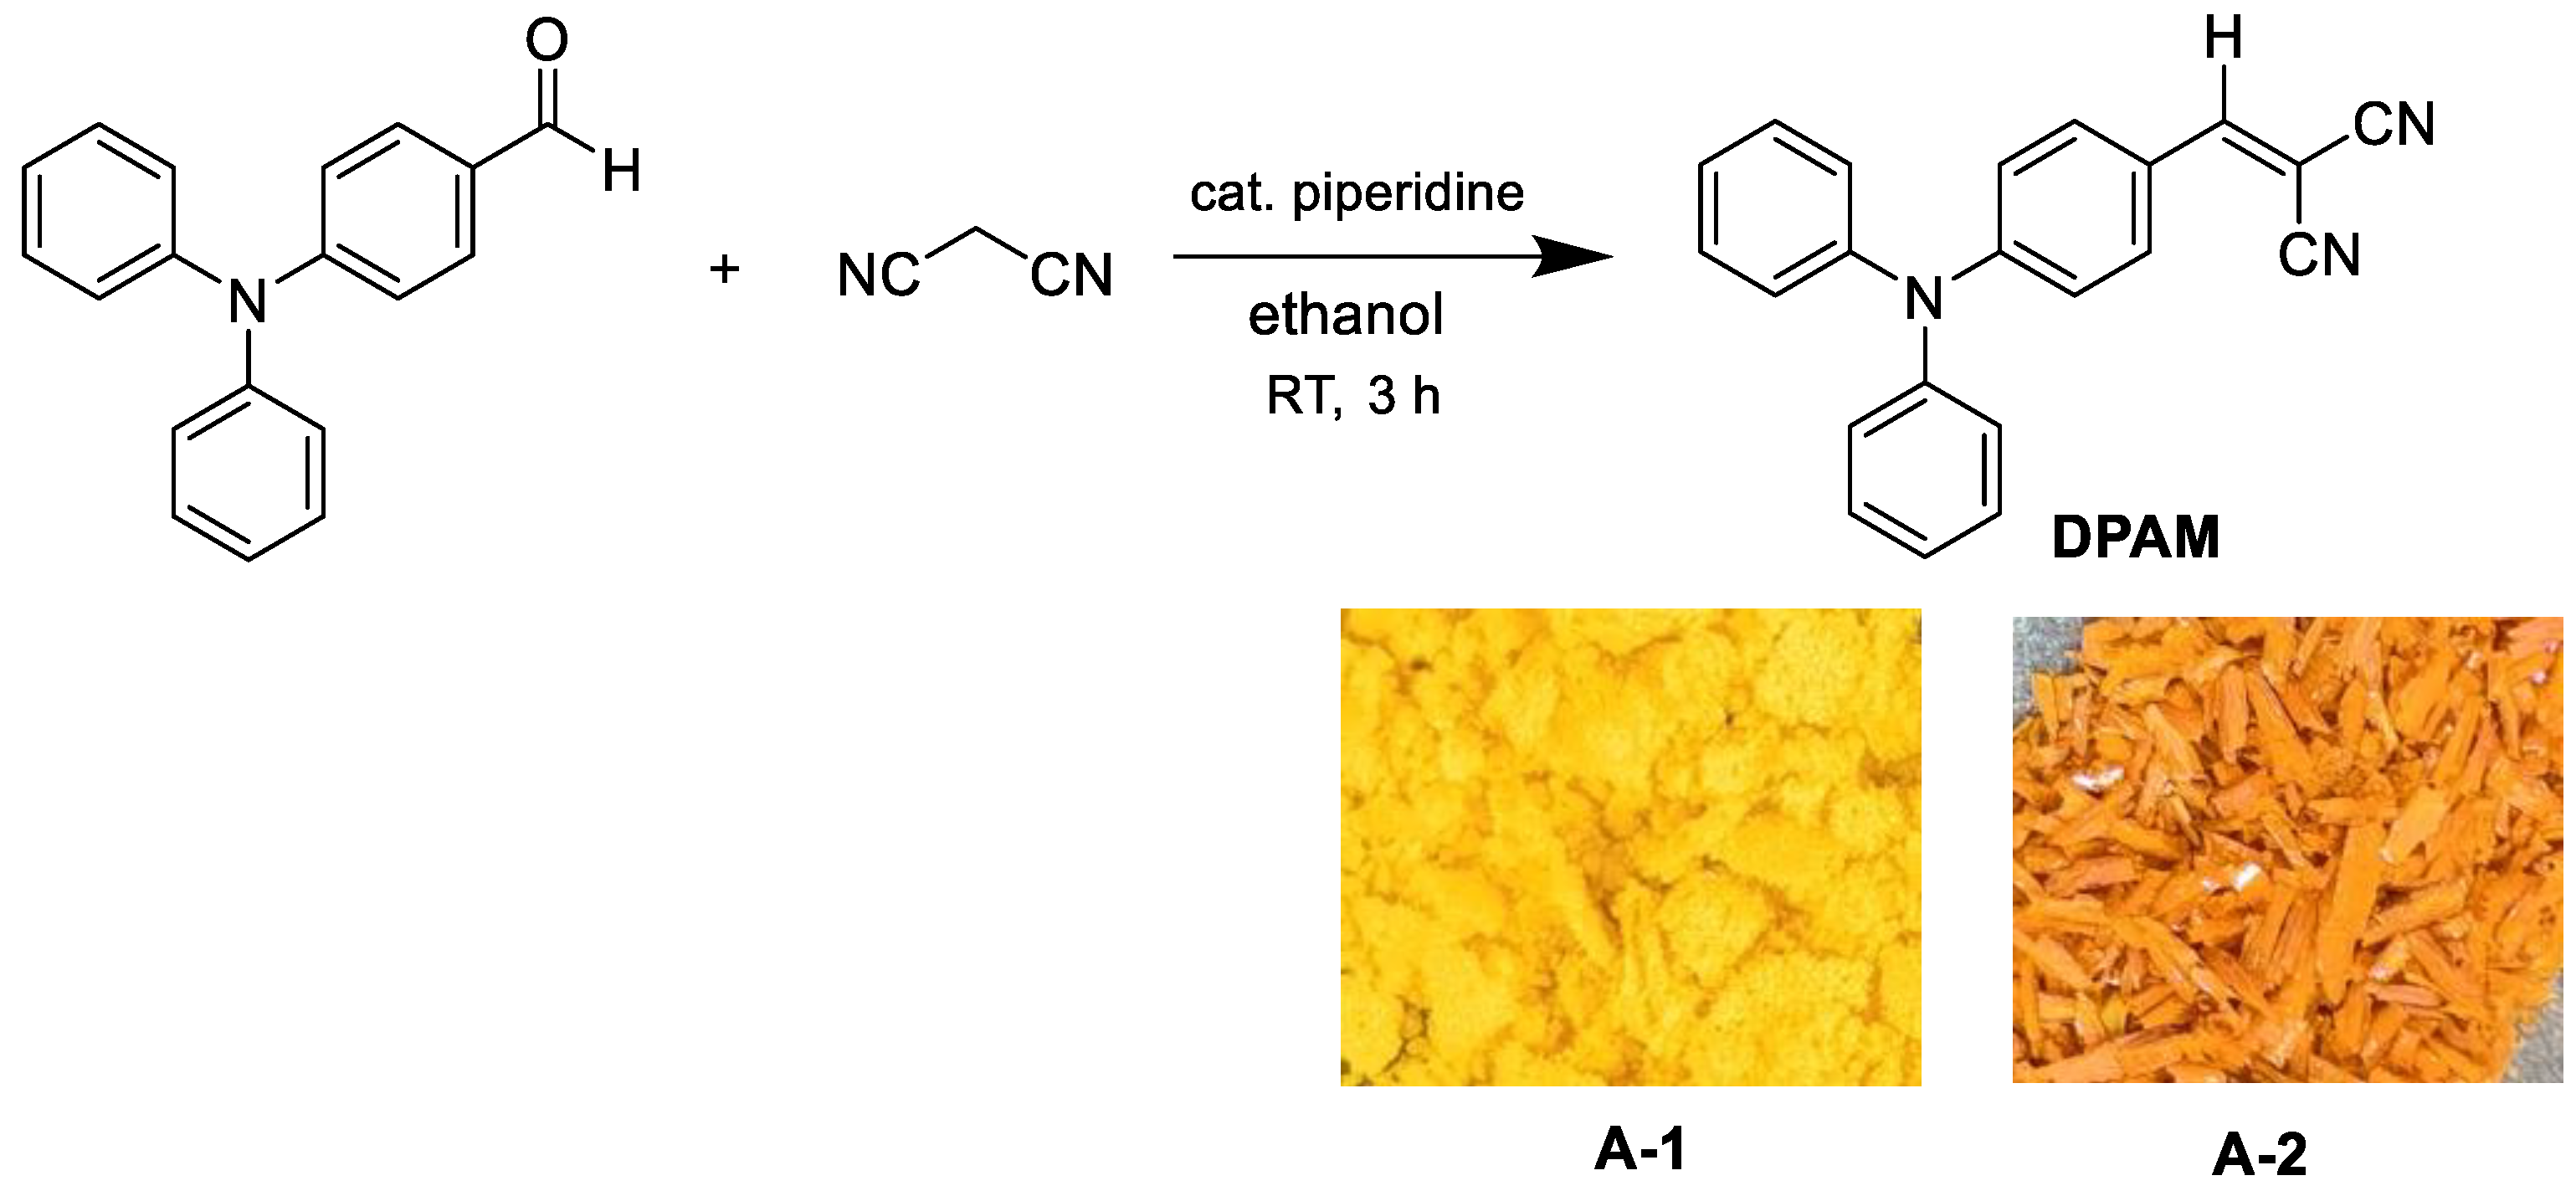
2-(4-(diphenylamino)benzylidene) malononitrile (DPAM) is a kind of triphenylamine derivative, which was first reported by Kuroda in 2003 [31], as shown in Figure 1. In this molecule, the triphenylamine group acts as the electron-donating unit, while the dicyano group serves as the electron-accepting unit, connected by a vinyl bond [32,33]. However, the relationship between the crystal structure, morphology, and mechanochromic phenomenon of DPAM has not been thoroughly investigated, let alone the exploration of new crystal forms. The crystal form diversity of DMAP was obtained in this study. In addition, the characterization, crystal structure, and mechanochromic phenomenon were studied.

2. Experimental Section

2.1. Materials

4-diphenylaminobenzaldehyde (96%) was purchased from Bidepharm (Shanghai, China), while Energy Chemical (Shanghai, China) supplied the remaining chemicals. All chemicals were used without any further purification. All solvents were purchased with HPLC-grade quality, also from Energy Chemical (Shanghai, China).

2.2. Synthesis of DPAM

2-(4-diphenylamino-benzylidene)-malononitrile (DPAM) was synthesized by a piperidine-catalyzed Knoevenagel condensation reaction between 4-diphenylaminobenzaldehyde and malononitrile. As shown in Scheme 1, 4 drops of piperidine were added to a solution of 4-(diphenylamino) benzaldehyde (2.74 g; 10 mmol) and malononitrile (1.48 mL; 10 mmol) in ethanol (40 mL). The solution was stirred at room temperature for 3 h, and water (40 mL) was added to the reaction mixture. The DPAM product was precipitated as an orange-red crystal (A-2) and obtained in a 95% yield (3.04 g) by filtering and drying at 110 °C for 3 h. The above DPAM product (1.52 g) was completely dissolved in ethanol (30 mL) under reflux, and water (8 mL) was added. Then, the mixture solution was poured into ice water (100 mL) to precipitate a yellow crystal (A-1), which was obtained in a 90% yield (1.37 g) by filtering and drying at 110 °C for 3 h.
A-1: 3.04 g, 95% yield; yellow solid, m.p. 137.6–138.6 °C; 1H NMR (CDCl3, 400 MHz): δ = 7.78–7.66 (m, 2H), 7.51 (s, 1H), 7.38 (dd, J = 10.8, 4.9 Hz, 4H), 7.27–7.14 (m, 7H), and 7.00–6.87 (m, 2H); 13C NMR (CDCl3, 101 MHz): δ = 157.88, 153.49, 145.16, 132.98, 129.96, 126.72, 126.13, 122.80, 118.49, 115.18, 114.07, and 75.59; IR (film): γ = 3052 (w), 2651 (w), 2219 (s), 1567 (s), 1506 (s), 1487 (s), 1352 (s), 1191 (s), and 826 (w) cm−1; HRMS (ESI): calcd. for C22H15N3 [M+H]+ 322.1344, found 322.1340; [M+Na]+ 344.1164, found 344.1157 (for the results, see Figures S1–S3 in the SI).
A-2: 1.37 g, 90% yield; orange solid, m.p. 139.2–139.9 °C; 1H NMR (CDCl3, 400 MHz): δ = 7.78–7.66 (m, 2H), 7.51 (s, 1H), 7.38 (dd, J = 10.8, 4.9 Hz, 4H), 7.27–7.14 (m, 7H), and 7.00–6.87 (m, 2H); 13C NMR (CDCl3, 101 MHz): δ = 157.88, 153.49, 145.16, 132.98, 129.96, 126.72, 126.13, 122.80, 118.49, 115.18, 114.07, and 75.59; IR (film): γ = 3060 (w), 2655 (w), 2219 (s), 1565 (s), 1504 (s), 1486 (s), 1350 (s), 1190 (s), and 825 (w) cm−1; HRMS (ESI): calcd. for C22H15N3 [M+H]+ 322.1344, found 322.1340; [M+Na]+ 344.1164, found 344.1157 (for the results, see Figures S1–S3 in the SI).

2.3. Single-Crystal X-Ray Crystallography

Single-crystal X-ray diffraction data were collected using a Bruker D8 Venture Ims3.0 single-crystal X-ray diffractometer (Bruker, Berlin, Germany) with Mo Kα (λ = 0.71073) for cell determination and subsequent data collection. The A-1 crystal was kept at 170.00 K, and the A-2 crystal was kept at 302.00 K during the data collection. Using Olex2 [34], the structure was solved with the SHELXT [35] structure solution program using intrinsic phasing and refined with the SHELXL [36] refinement package using least squares minimization.

2.4. Other Physicochemical Measurements

1H NMR and 13C NMR spectra were recorded with a Bruker AVANCE 400M superconducting NMR spectrometer at 25 °C, with deuterated chloroform as the lock solvent. The working solution concentration for NMR was 20 mg/mL. All chemical shifts are given in the ppm scale and refer to the nondeuterated proportion of the solvent. The infrared (IR) spectra were recorded with a Nicolet iS10 spectrometer with an attenuated total reflectance (ATR) (Thermo Fisher Scientific, Waltham, MA, USA) in the range of 4000 to 400 cm−1 and with a resolution of approximately 4 cm−1. HRMS were obtained using an Agilent 6230 TOF mass spectrometer (Agilent, Waldbronn, Germany) with electron spray ionization (ESI). The thermogravimetric analysis (TG) of the compounds was conducted using a DSC Q100 thermal analysis system (TA Instruments, New Castle, DE, USA). The TG test was performed under a nitrogen atmosphere, heating from 25 °C to 400 °C at a rate of 10 °C·min−1, with weight–temperature curves recorded. The differential scanning calorimetry (DSC) test was performed in the temperature range of 20–200 °C, at a heating rate of 10 °C·min−1, with heat flow–temperature curves recorded. The X-ray powder diffraction data were collected with a Bruker D8 Discover diffractometer with parafocusing Bragg–Brentano geometry and a one-dimensional LynxEye XE-T detector (Bruker, Karlsruhe, Germany) using Cu Kα radiation (λ = 1.5418 Å) and operated at 42 kV and 100 mA at room temperature. The scan 2θ range was from 2° to 50° at a rate of 1°/min.

3. Results and Discussion

3.1. Description of Crystal Structure

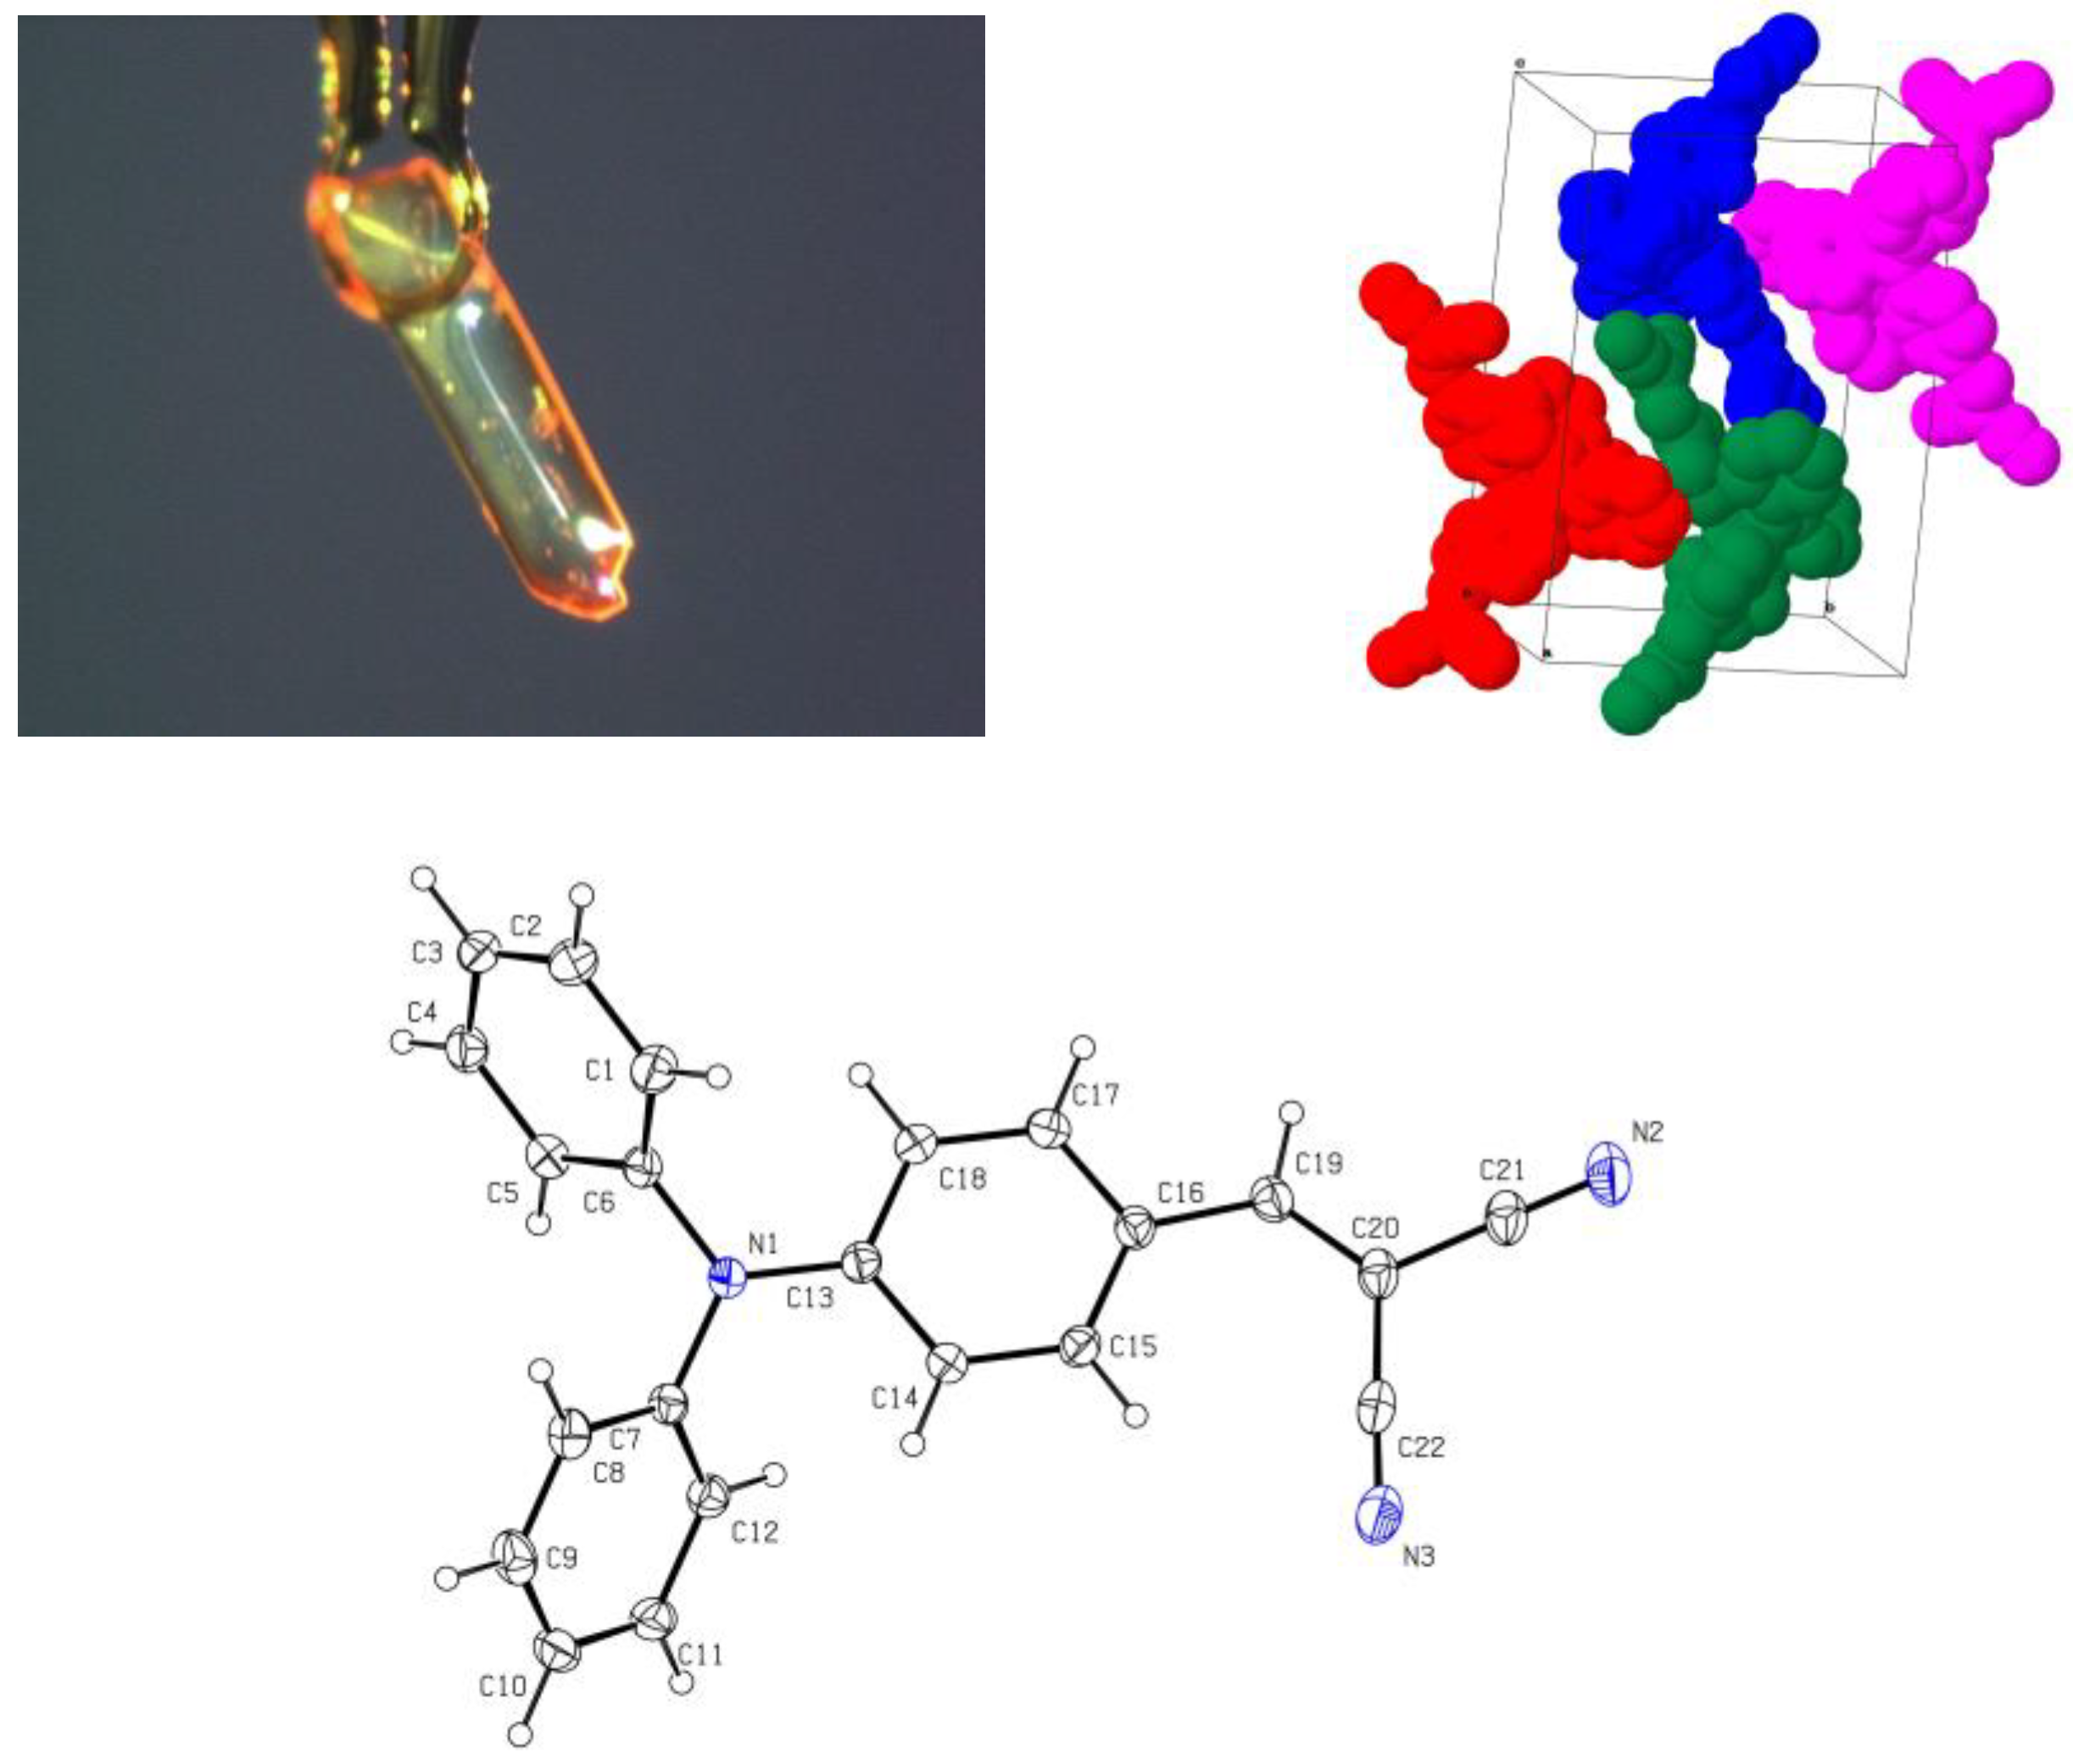
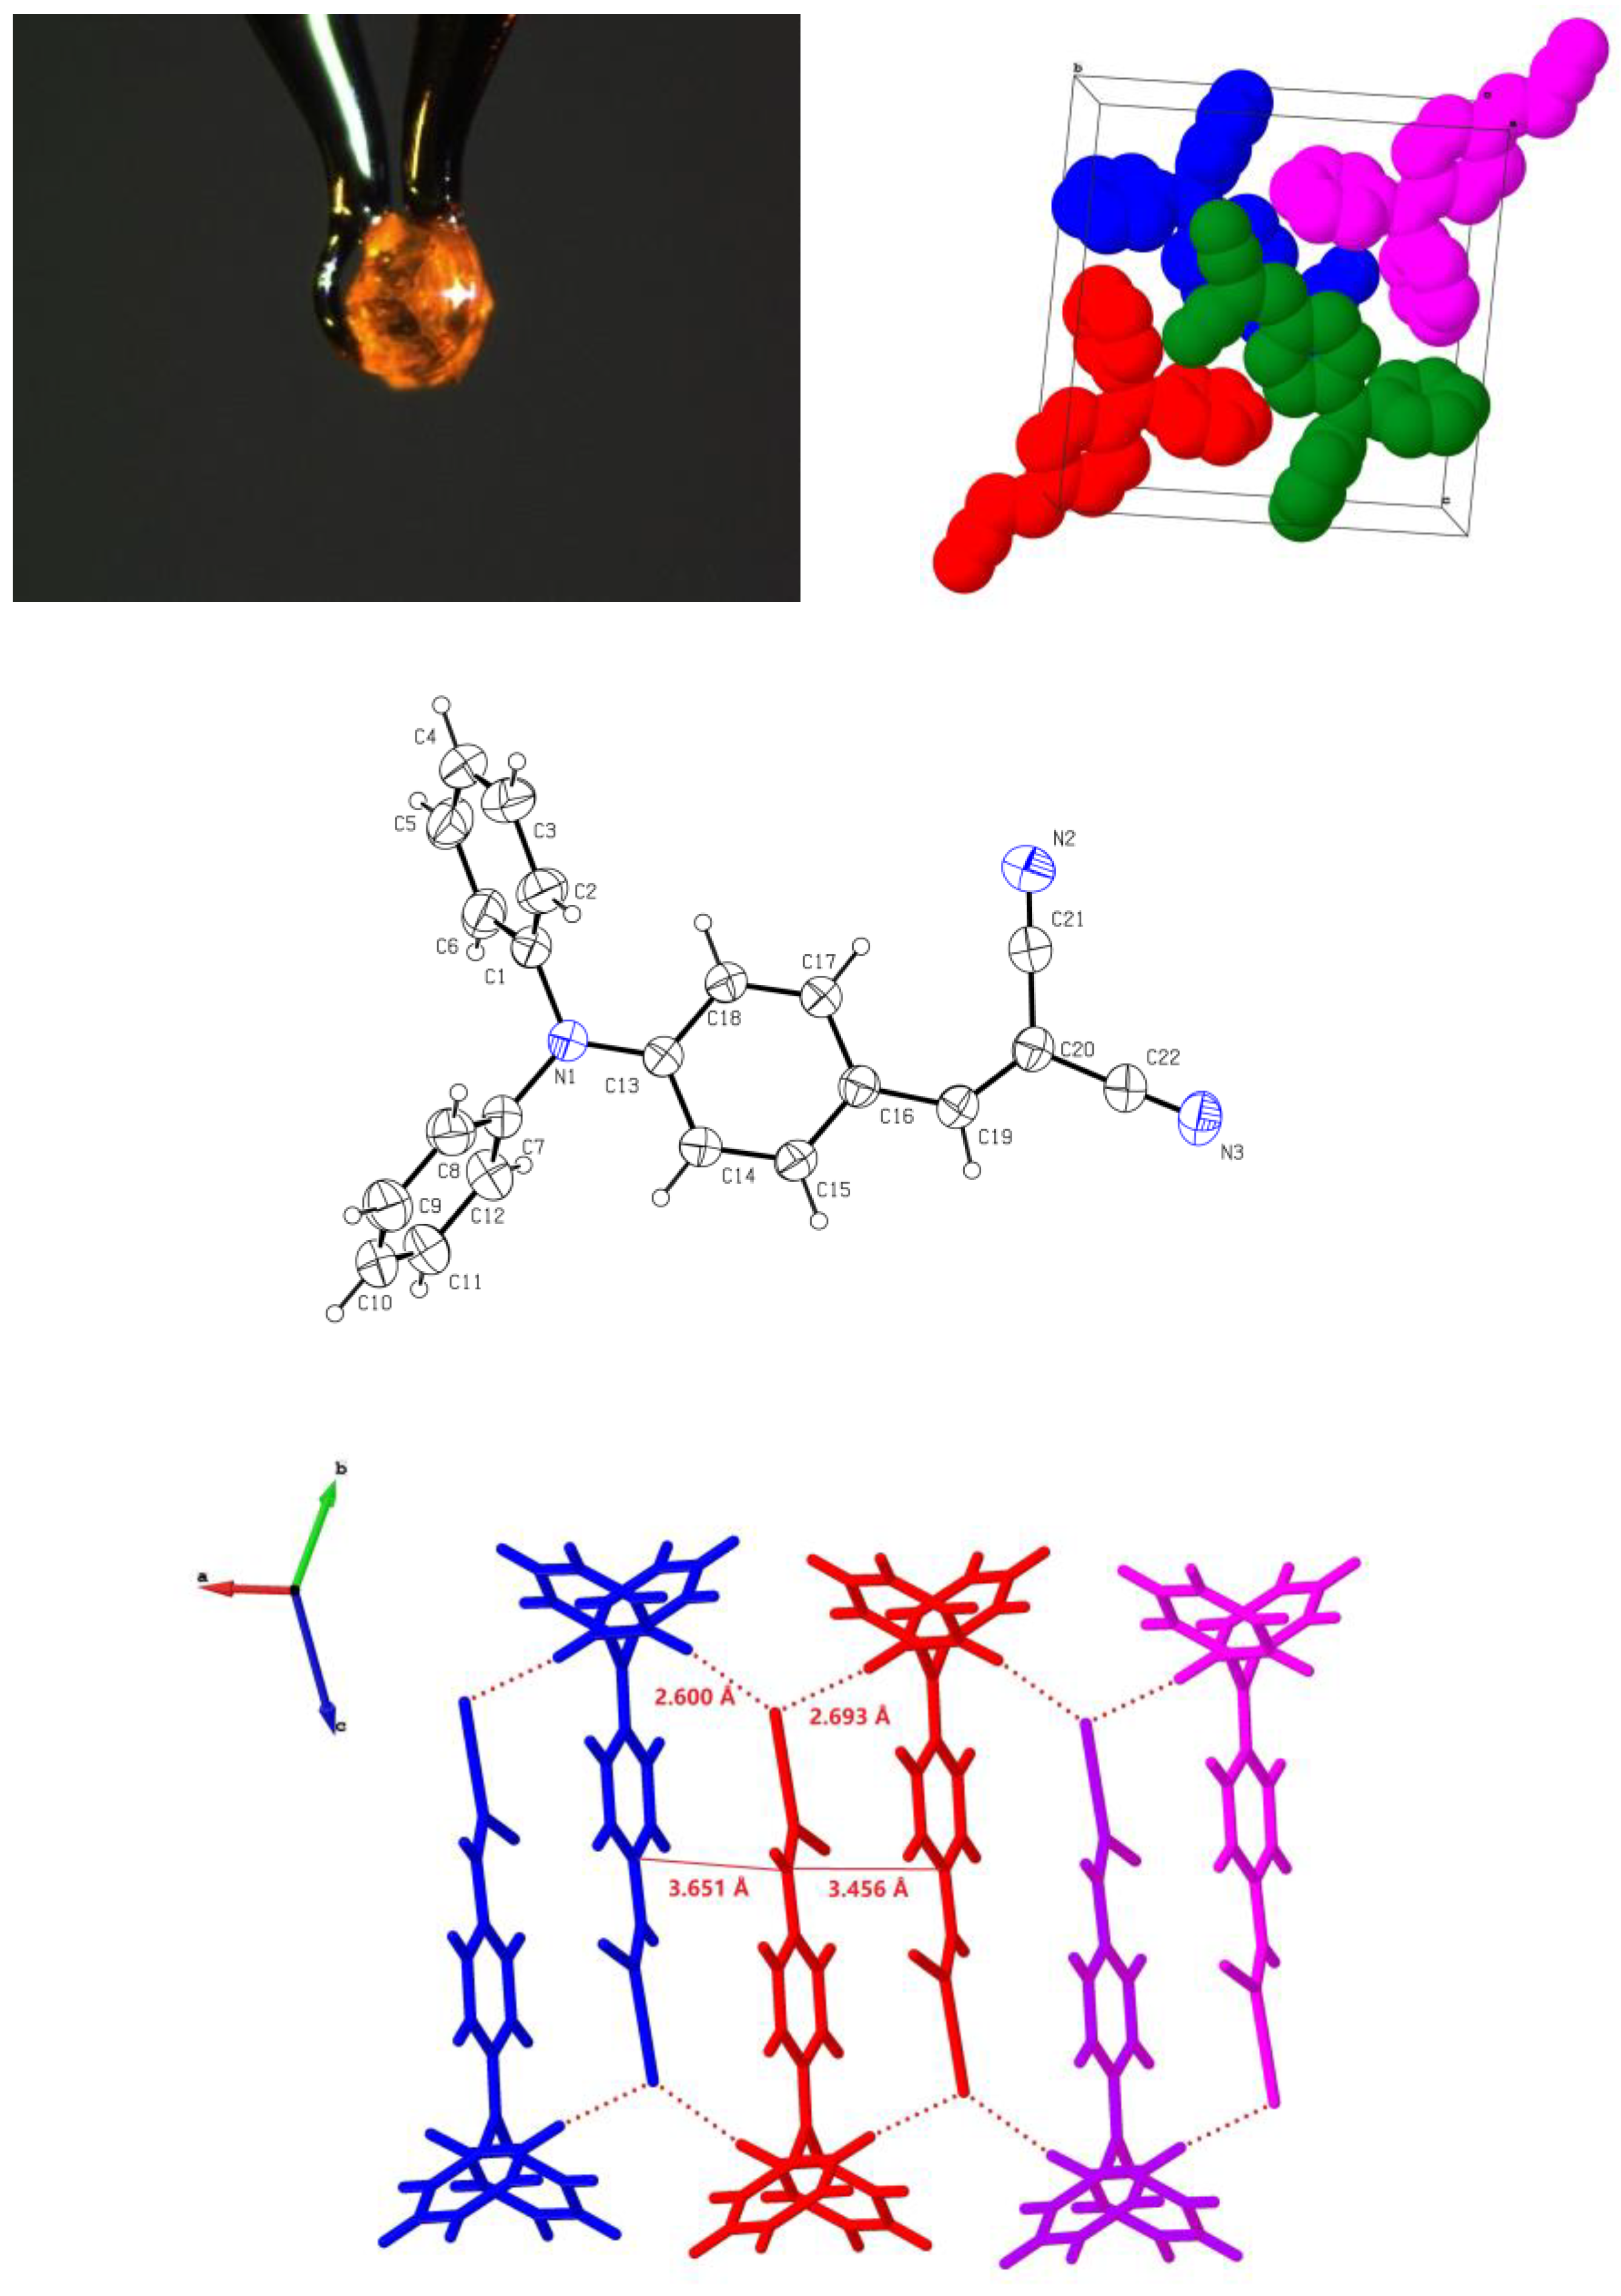
The color of a substance is primarily determined by its molecular crystalline structure, as the molecular structure dictates its light absorption and reflection properties. Therefore, studying the relationship between a substance’s color and its molecular crystalline structure helps us gain a deeper understanding of the substance’s physical and chemical properties. To gain insight into the molecular organization of DPAM, the yellow needle-shaped single crystal A-1, suitable for structural analysis, was obtained by the slow evaporation of an ethanol and water mixed solution of DPAM at room temperature for one week. The orange-red block-shaped single crystal A-2, suitable for structural analysis, was obtained by cooling the hot solution of DPAM in ethanol at room temperature for 6 h. The crystal data, collection procedures, and refinement results of A-1 and A-2 are summarized in Table 1. The A-1 crystal was confirmed as a new crystal form with an orthorhombic crystal system (Figure 2). The results indicate that the A-1 molecular crystal existed in the orthorhombic space group Pbca with a = 11.2205 (6) Å, b = 14.6394 (10) Å, c = 20.9226 (16) Å, and β = 90°. A-2 was a crystal form with a monoclinic crystal system (Figure 3).The results indicate that the A-2 molecular crystal existed in the monoclinic space group P2(1)/c with a = 7.0262 (9) Å, b = 15.9319 (16) Å, c = 16.1075 (19) Å, and β = 95.169 (5)°. The space group of A-2 was one of the most prevalent space groups, first discovered and reported by the Son group in 2009 [33], whereas the crystal structure of A-1 has not been previously reported. A comparison drawn from Table 1 revealed that A-2 had a density of 1.189 g/cm3, whereas A-1 had a density of 1.242 g/cm3. A-2 exhibited a lower density than A-1; the crystal structure of the A-2 compound was, therefore, more porous.
Table 2 and Table 3 list the selected bond distances and angles. As can be observed from Table 2, in both compounds, the carbon-carbon double-bond lengths of C19-C20 increased, and the carbon-carbon single-bond lengths of C20-C21 shortened, while the bond length of the two carbon-nitrogen triple bonds, N2-C21 and N3-C22, decreased. This was attributed to the formation of conjugation through electron delocalization, leading to changes in bond length. In Table 3, the bond angles of the three bonds for A-1 (C7-N1-C6, C13-N1-C6, and C13-N1-C7) and the three bonds for A-2 (C1-N1-C7, C13-N1-C1, and C13-N1-C7) were all approximately 120°, suggesting that the N atom at the center of triphenylamine was close to sp2 hybridization. Meanwhile, the bond angle of C22-C20-C21 in both configurations was around 114°, which was less than 120°, indicating that the C20 atom in the double bond did not exhibit standard sp2 hybridization. This deviation was likely due to the compression exerted by the adjacent triphenylamine group on the carbon–carbon double bond, resulting in increased steric hindrance.
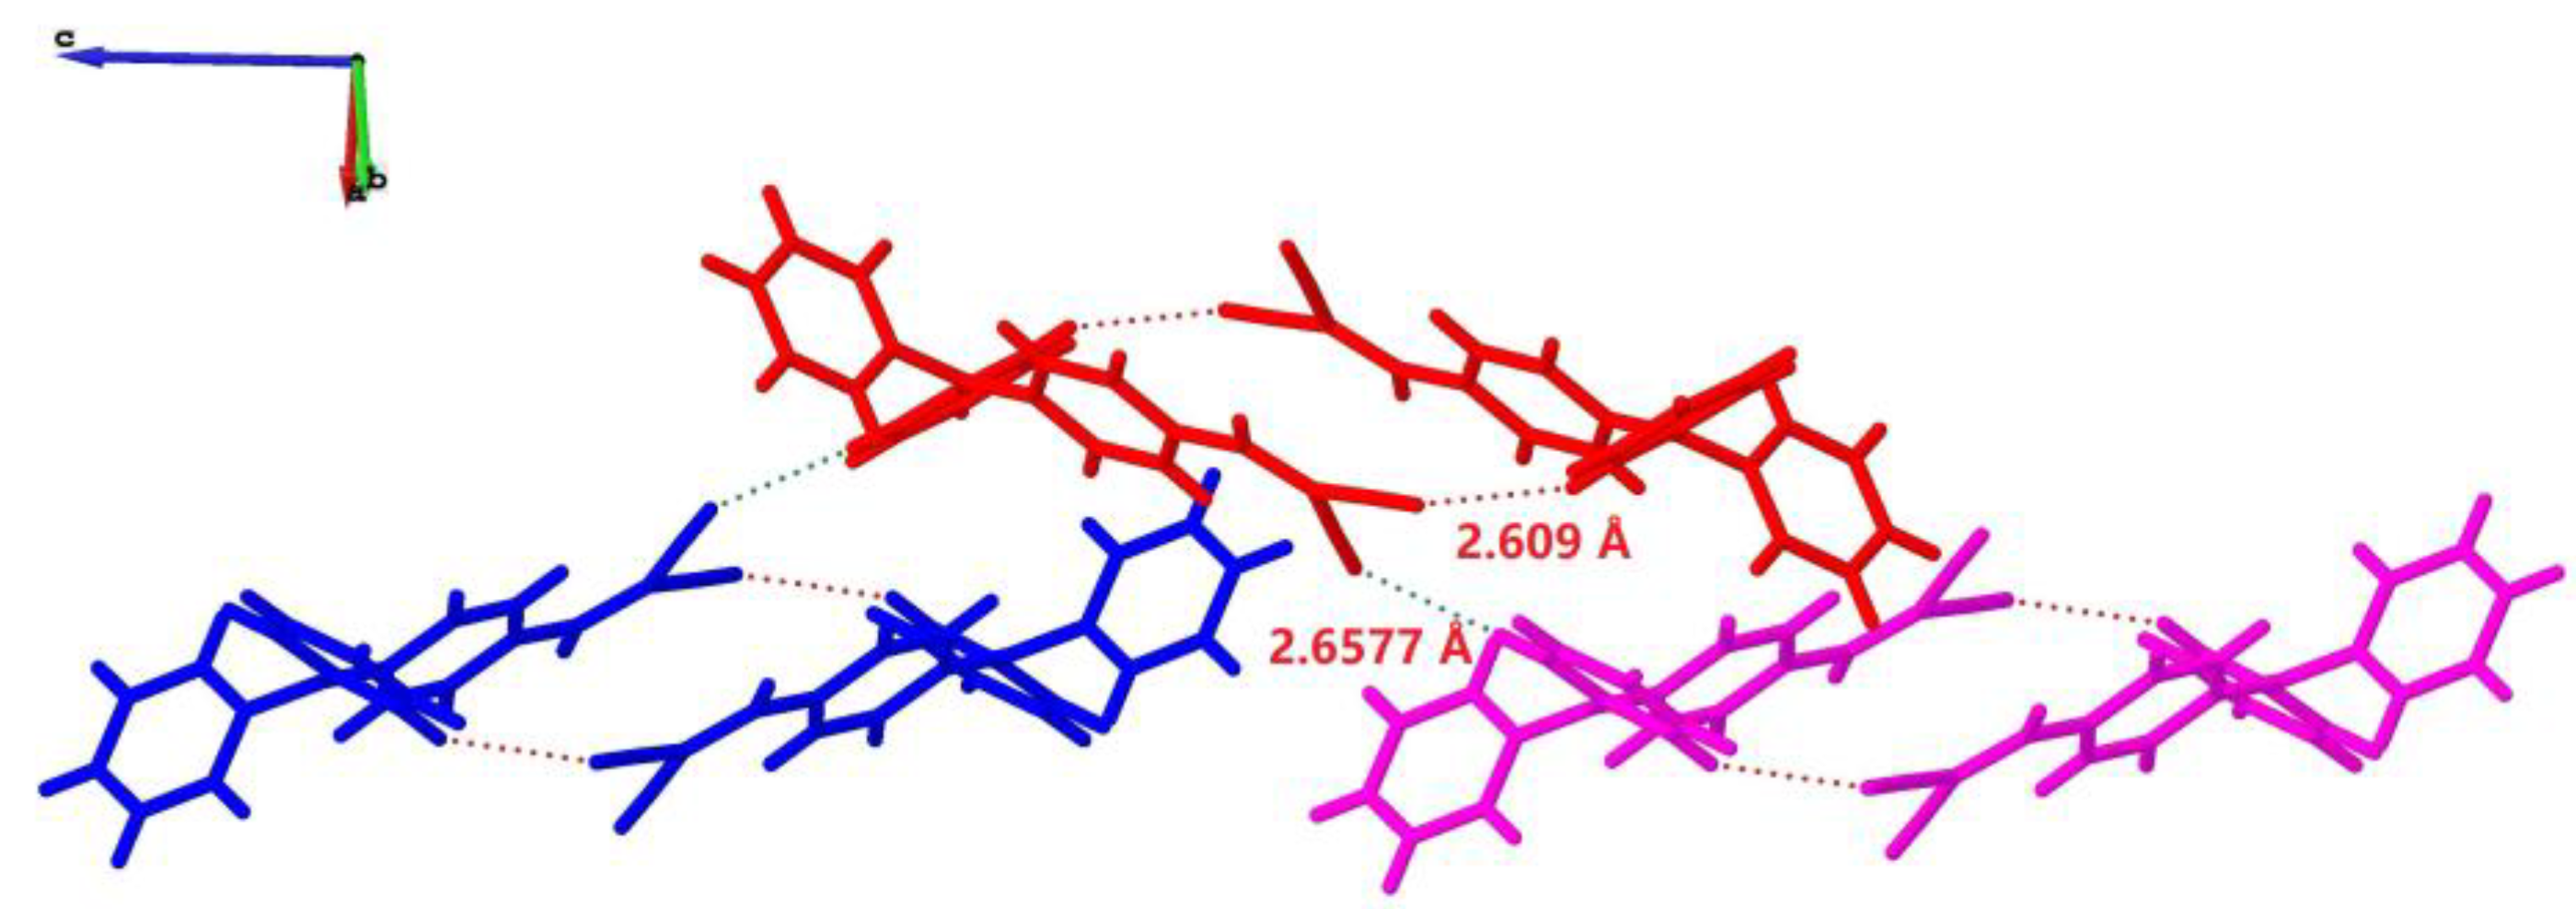
The choice of crystallization solvents had a significant impact on the macro-scale morphology of the crystals. The yellow crystal, A-1, belonging to the orthorhombic crystal system, was obtained from a mixed solvent of ethanol and water. In contrast, the orange-red crystal, A-2, which had a monoclinic crystal system, was obtained from pure ethanol. The crystalline structure revealed that the molecule of A-1 was arranged in antiparallel patterns characterized by hydrogen bonds. The highly twisted benzene rings within the crystal structure inhibited the formation of exciplexes or excimers, further promoting increased emissions. The crystalline structure revealed that the molecule of A-2 was arranged in parallel patterns characterized by π…π weaker interactions and hydrogen bonds. This arrangement helped to stabilize the conformations of the molecules, leading to enhanced emissions. The highly twisted stacking architecture resulted in shorter effective conjugation lengths, producing bluer emissions, while the planar conformation increased the effective lengths, yielding redder emissions.

3.2. IR Spectra

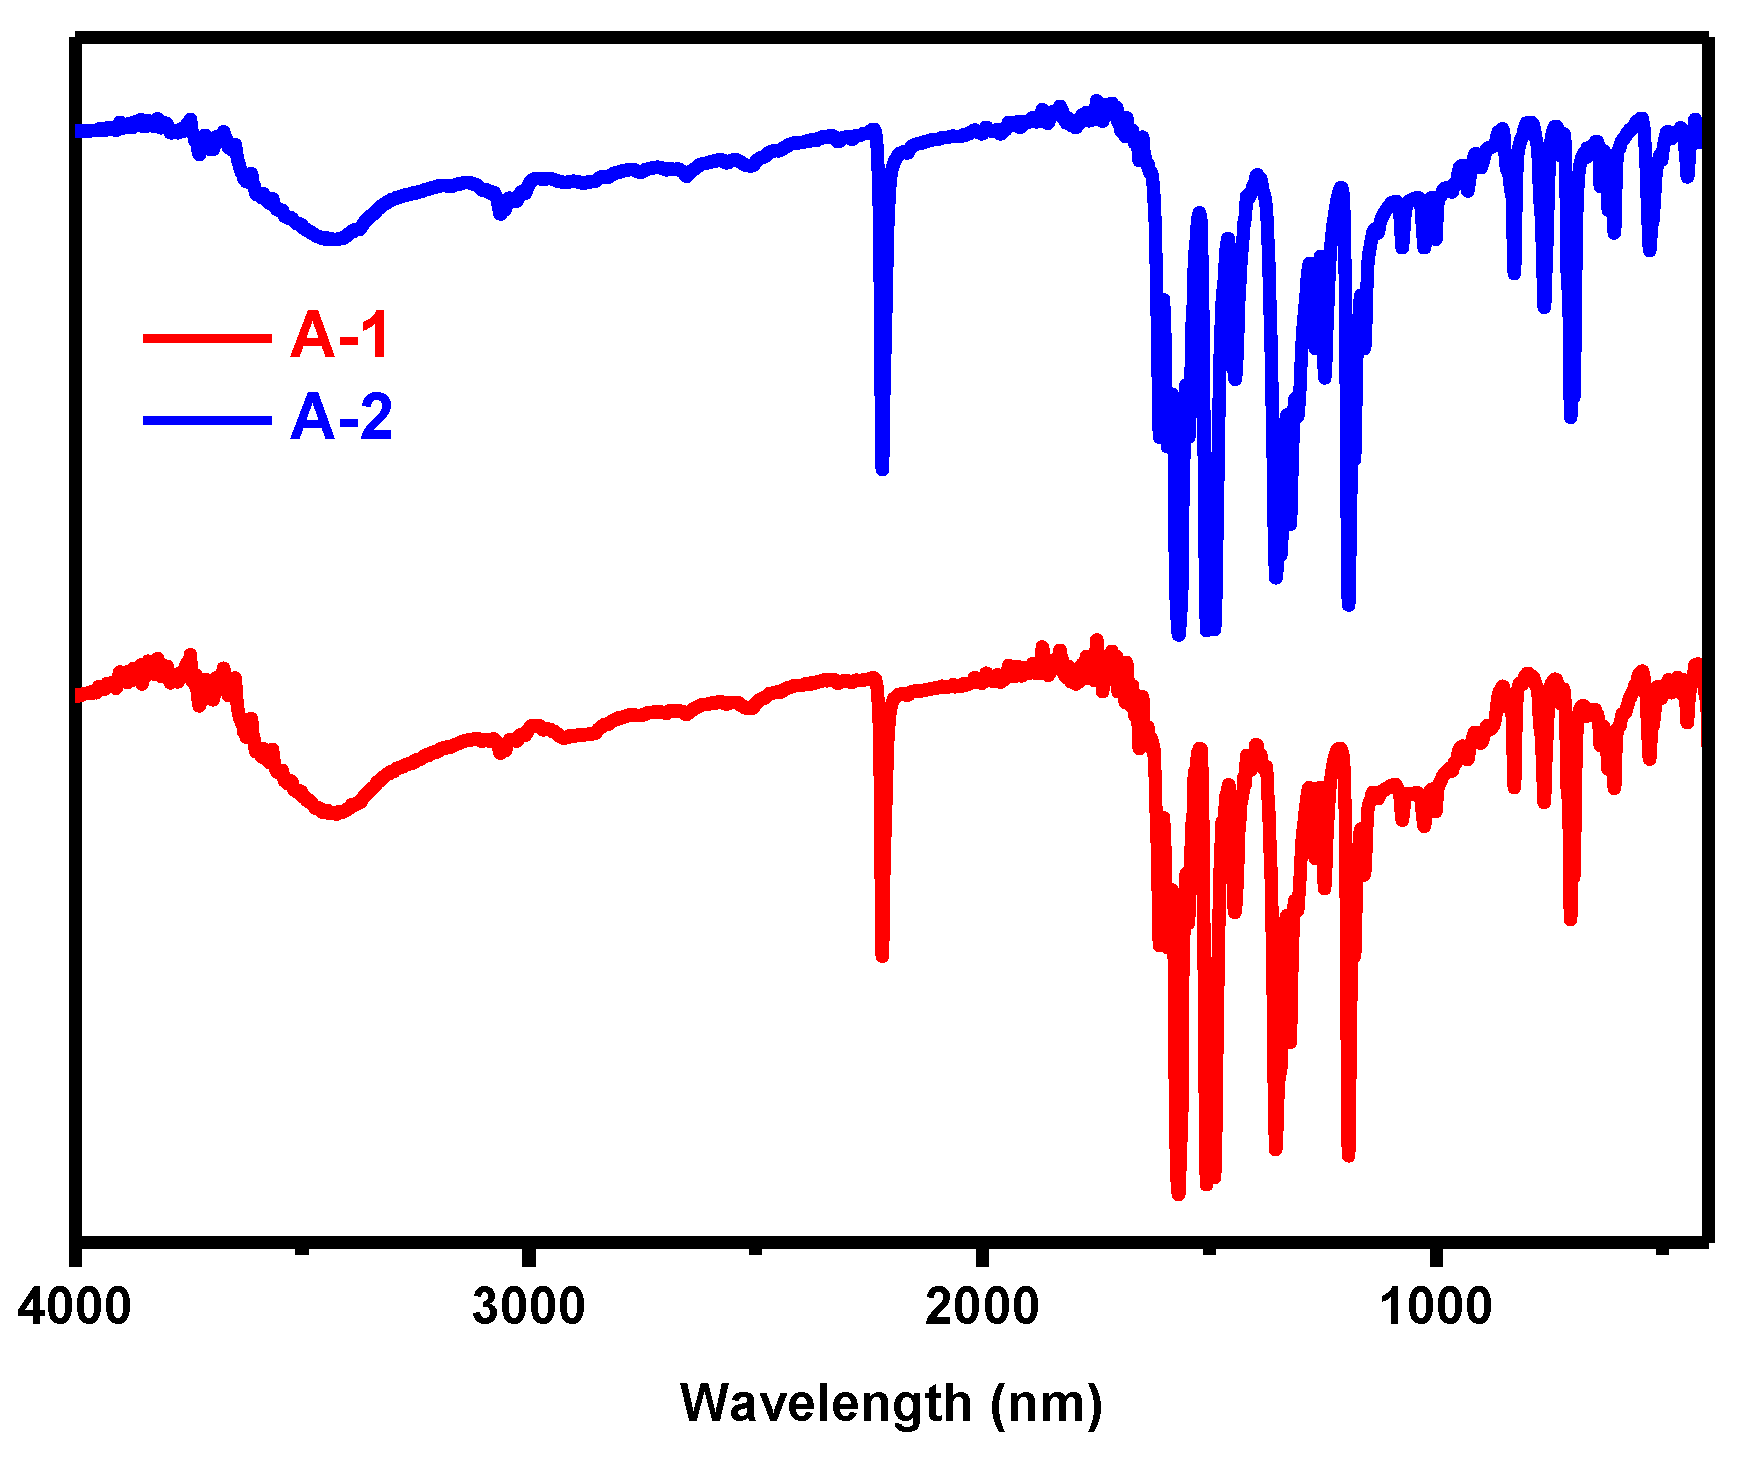
Infrared spectroscopy is effective in identifying specific functional groups and molecular vibrations in crystalline materials. The attenuated total reflectance (ATR) is particularly useful for crystal samples without the need to crush or grind them into a powder. This is particularly advantageous for maintaining the integrity and original structure of the samples [37]. The IR spectra of A-1 and A-2 exhibited small differences in the 4000–400 cm−1 region (Figure 4 and Table 4). Both of the compounds displayed the same a strong absorption band at 2219 cm−1, attributed to the C≡N stretching vibration. But the spectrum of the A-1 crystal displayed a weak absorption band at 3052 cm−1 and 1487 cm−1, attributed to the C-H stretching vibration, while the A-2 crystal exhibited a slightly shifted peak at 3060 cm−1 and 1486 cm−1, indicating a possible interaction with different molecular environments.

3.3. Thermal Properties

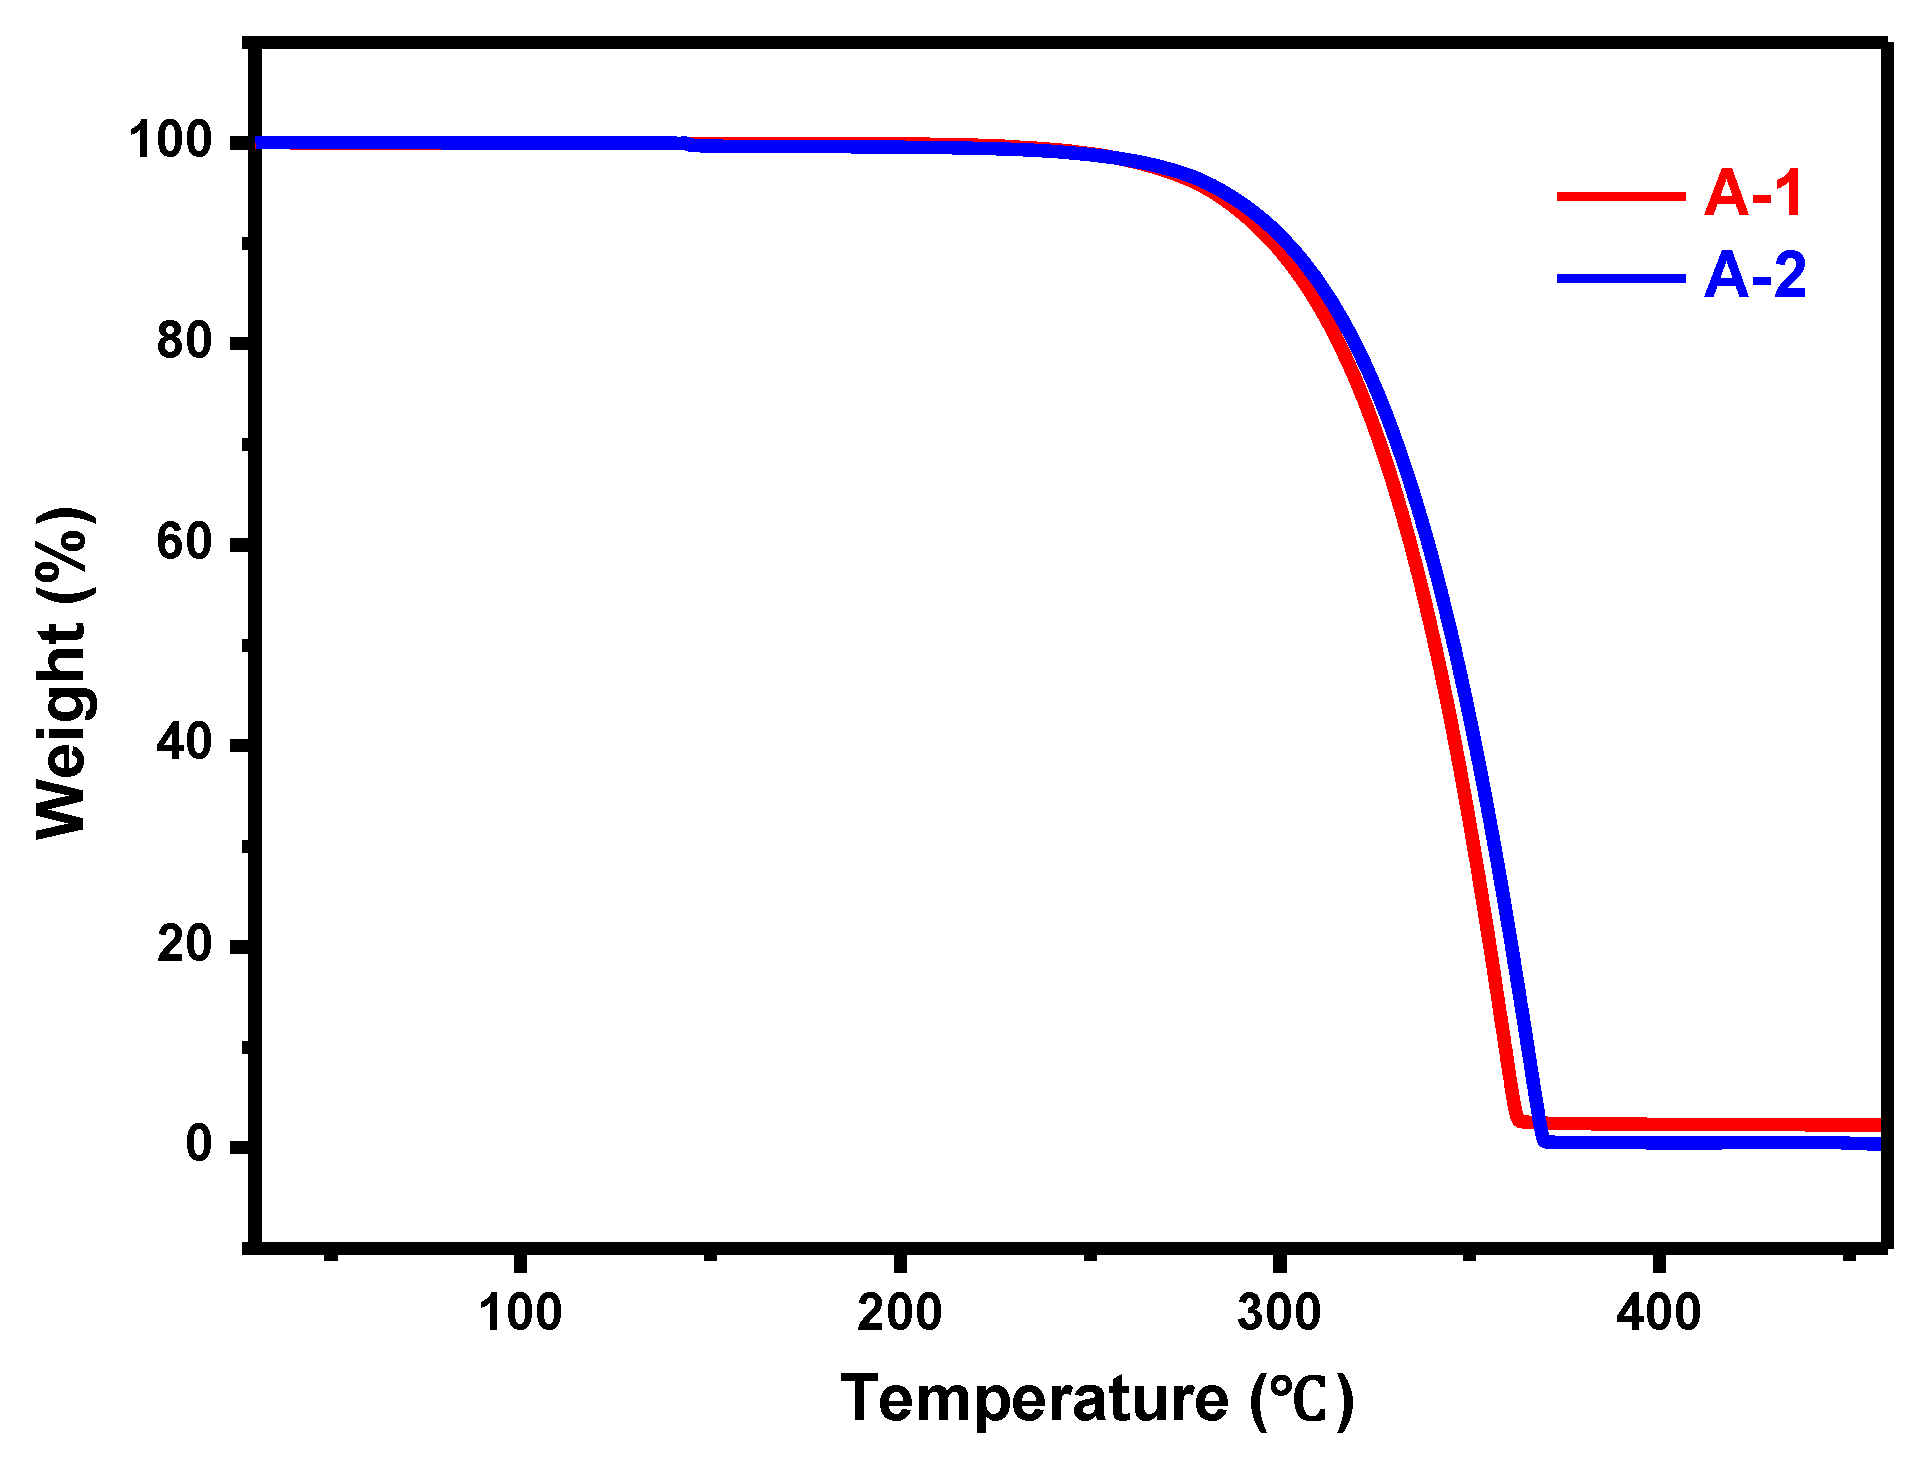
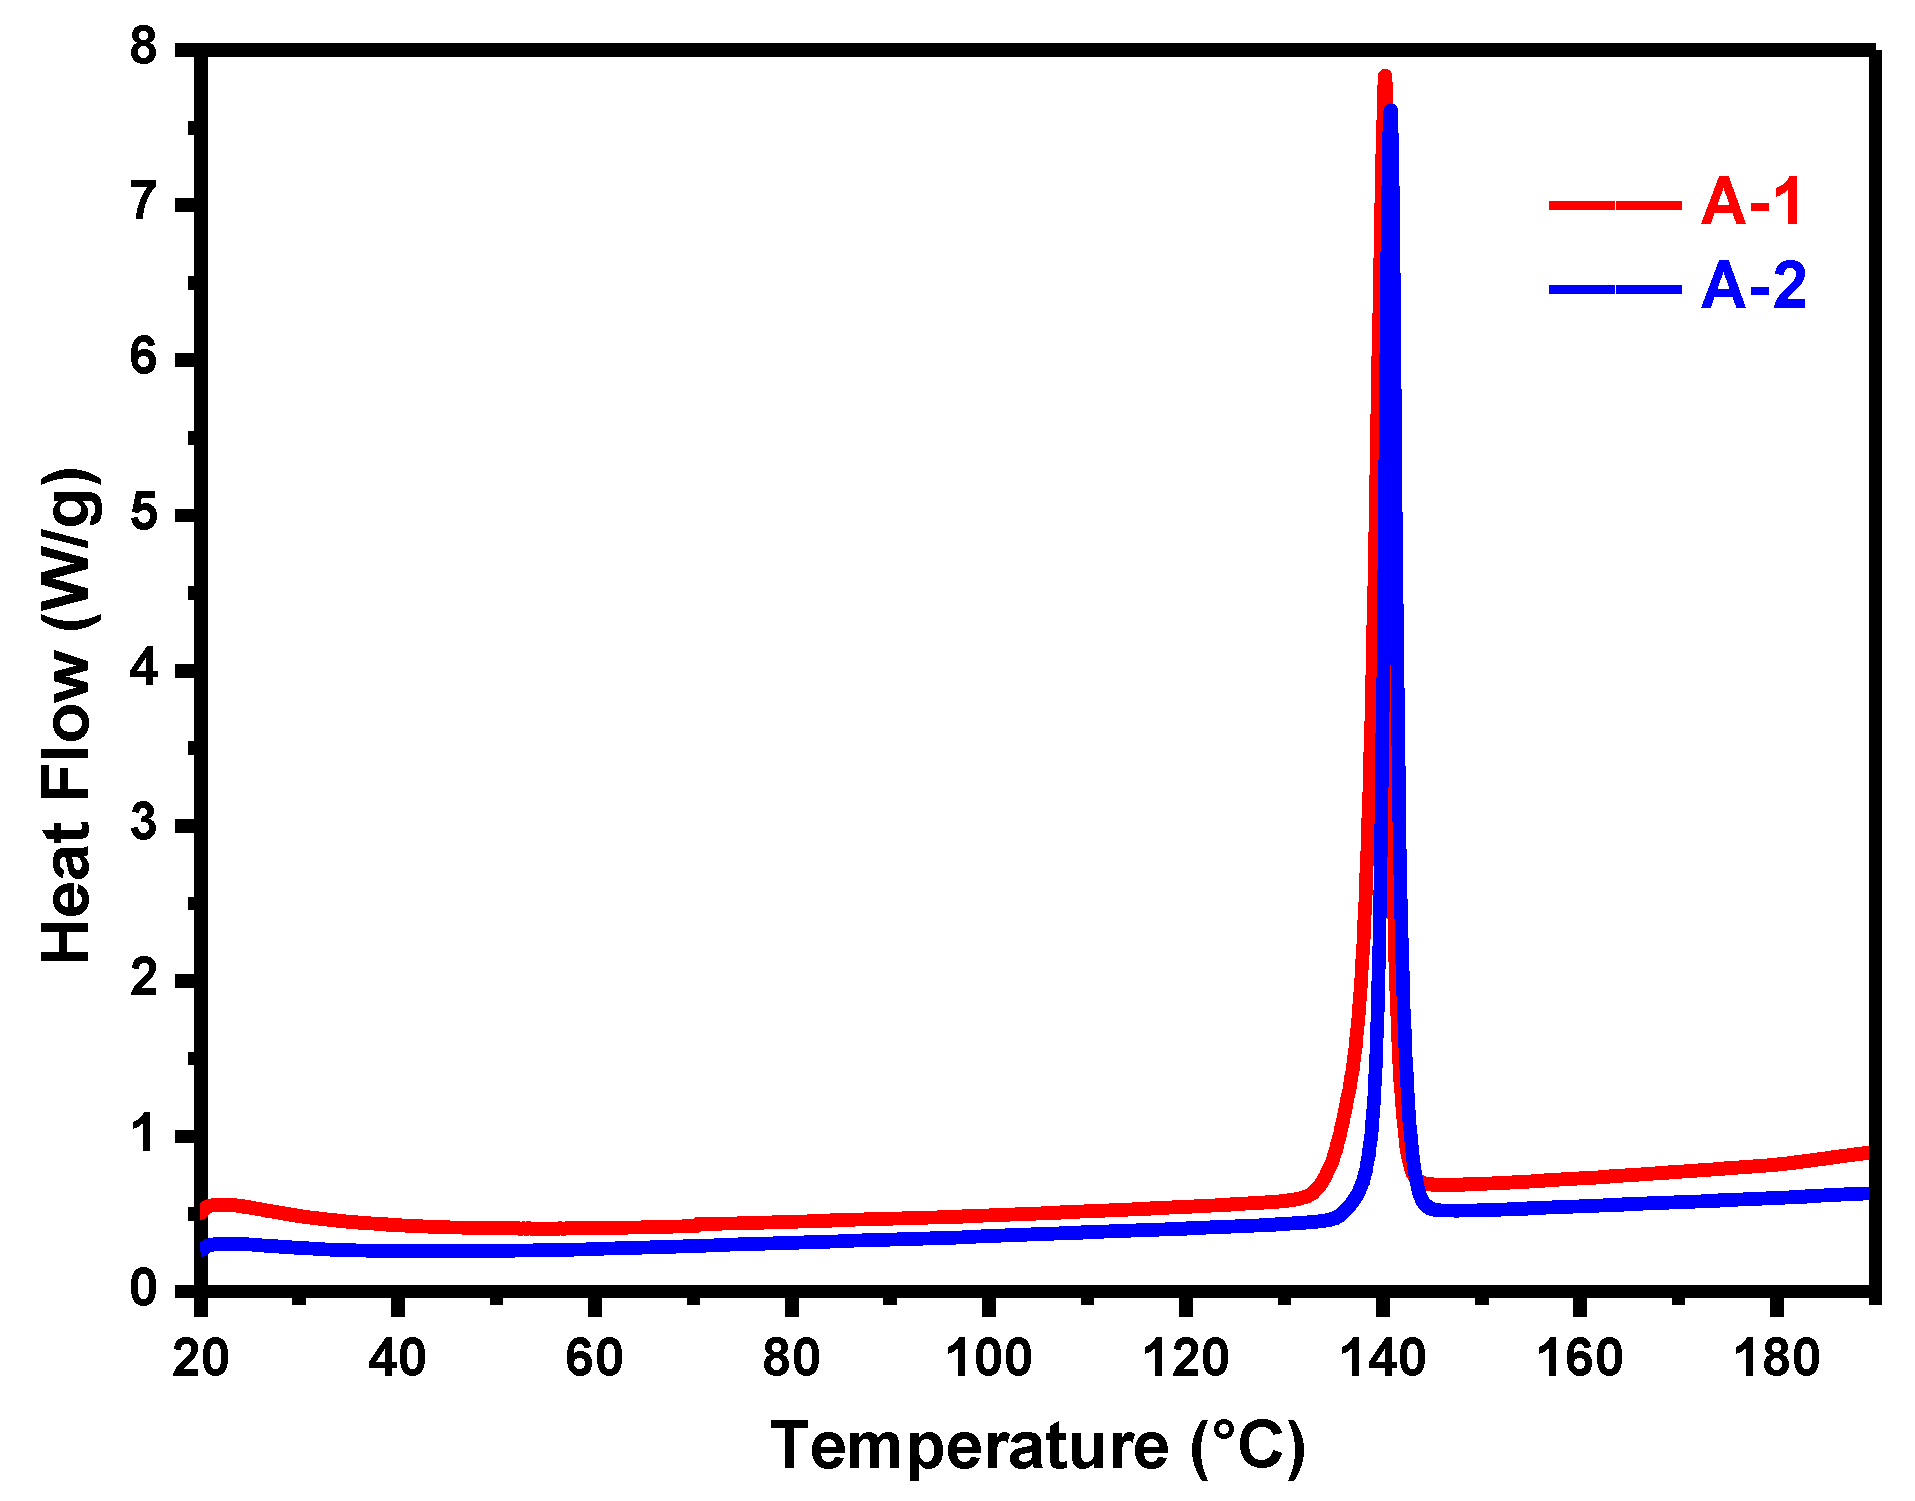
Thermal stability is an important property of organic crystal materials [38,39]. The TG/DSC techniques were used to study the thermal properties of compounds A-1 and A-2 in a nitrogen atmosphere. The results are presented in Figure 5 and Figure 6 (see also Figures S4–S7 in the SI). A-1 and A-2 exhibited high thermal stability. It can be observed that the A-1 crystal exhibited significant mass loss for the quickest decomposition only after reaching 319.88 °C, while the A-2 crystal exhibited little mass loss (0.37%) after reaching 175.00 °C, and exhibited significant mass loss for the quickest decomposition after reaching 324.22 °C. The DSC test curves for A-1 and A-2 show that the A-1 crystal exhibited a melting point at around 138.02 °C, and the A-2 crystal exhibited a melting point at around 139.43 °C. The results are consistent with the melting point measurement. From the DSC curves, it can be calculated that the enthalpy of A-1 was 25.4 kJ/mol, while A-2’s enthalpy was 26.1 kJ/mol. The higher enthalpy of compound A-2 suggested superior crystallization behavior, aligning with the observation that A-2’s decomposition temperature (324.22 °C) exceeded A-1’s (319.88 °C). However, as illustrated in Figure 5 and Figure 6, the thermal properties of both crystals exhibited a high degree of similarity. This similarity was primarily attributed to the intermolecular hydrogen bonds, with A-1 possessing hydrogen bonds of 2.609 Å and 2.6577 Å, and A-2 featuring hydrogen bonds of 2.600 Å and 2.693 Å. The comparable hydrogen bonds between the two compounds accounted for their similar thermal properties. Additionally, it is crucial to note that when A-2 was subjected to heating, it did not transition to the A-1 configuration. This was due to the fact that heating caused the compound’s volume to expand and its density to decrease, while A-2’s density was greater than A-1’s, and heating did not induce a conformational change from A-2 to A-1.

3.4. X-Ray Powder Diffraction

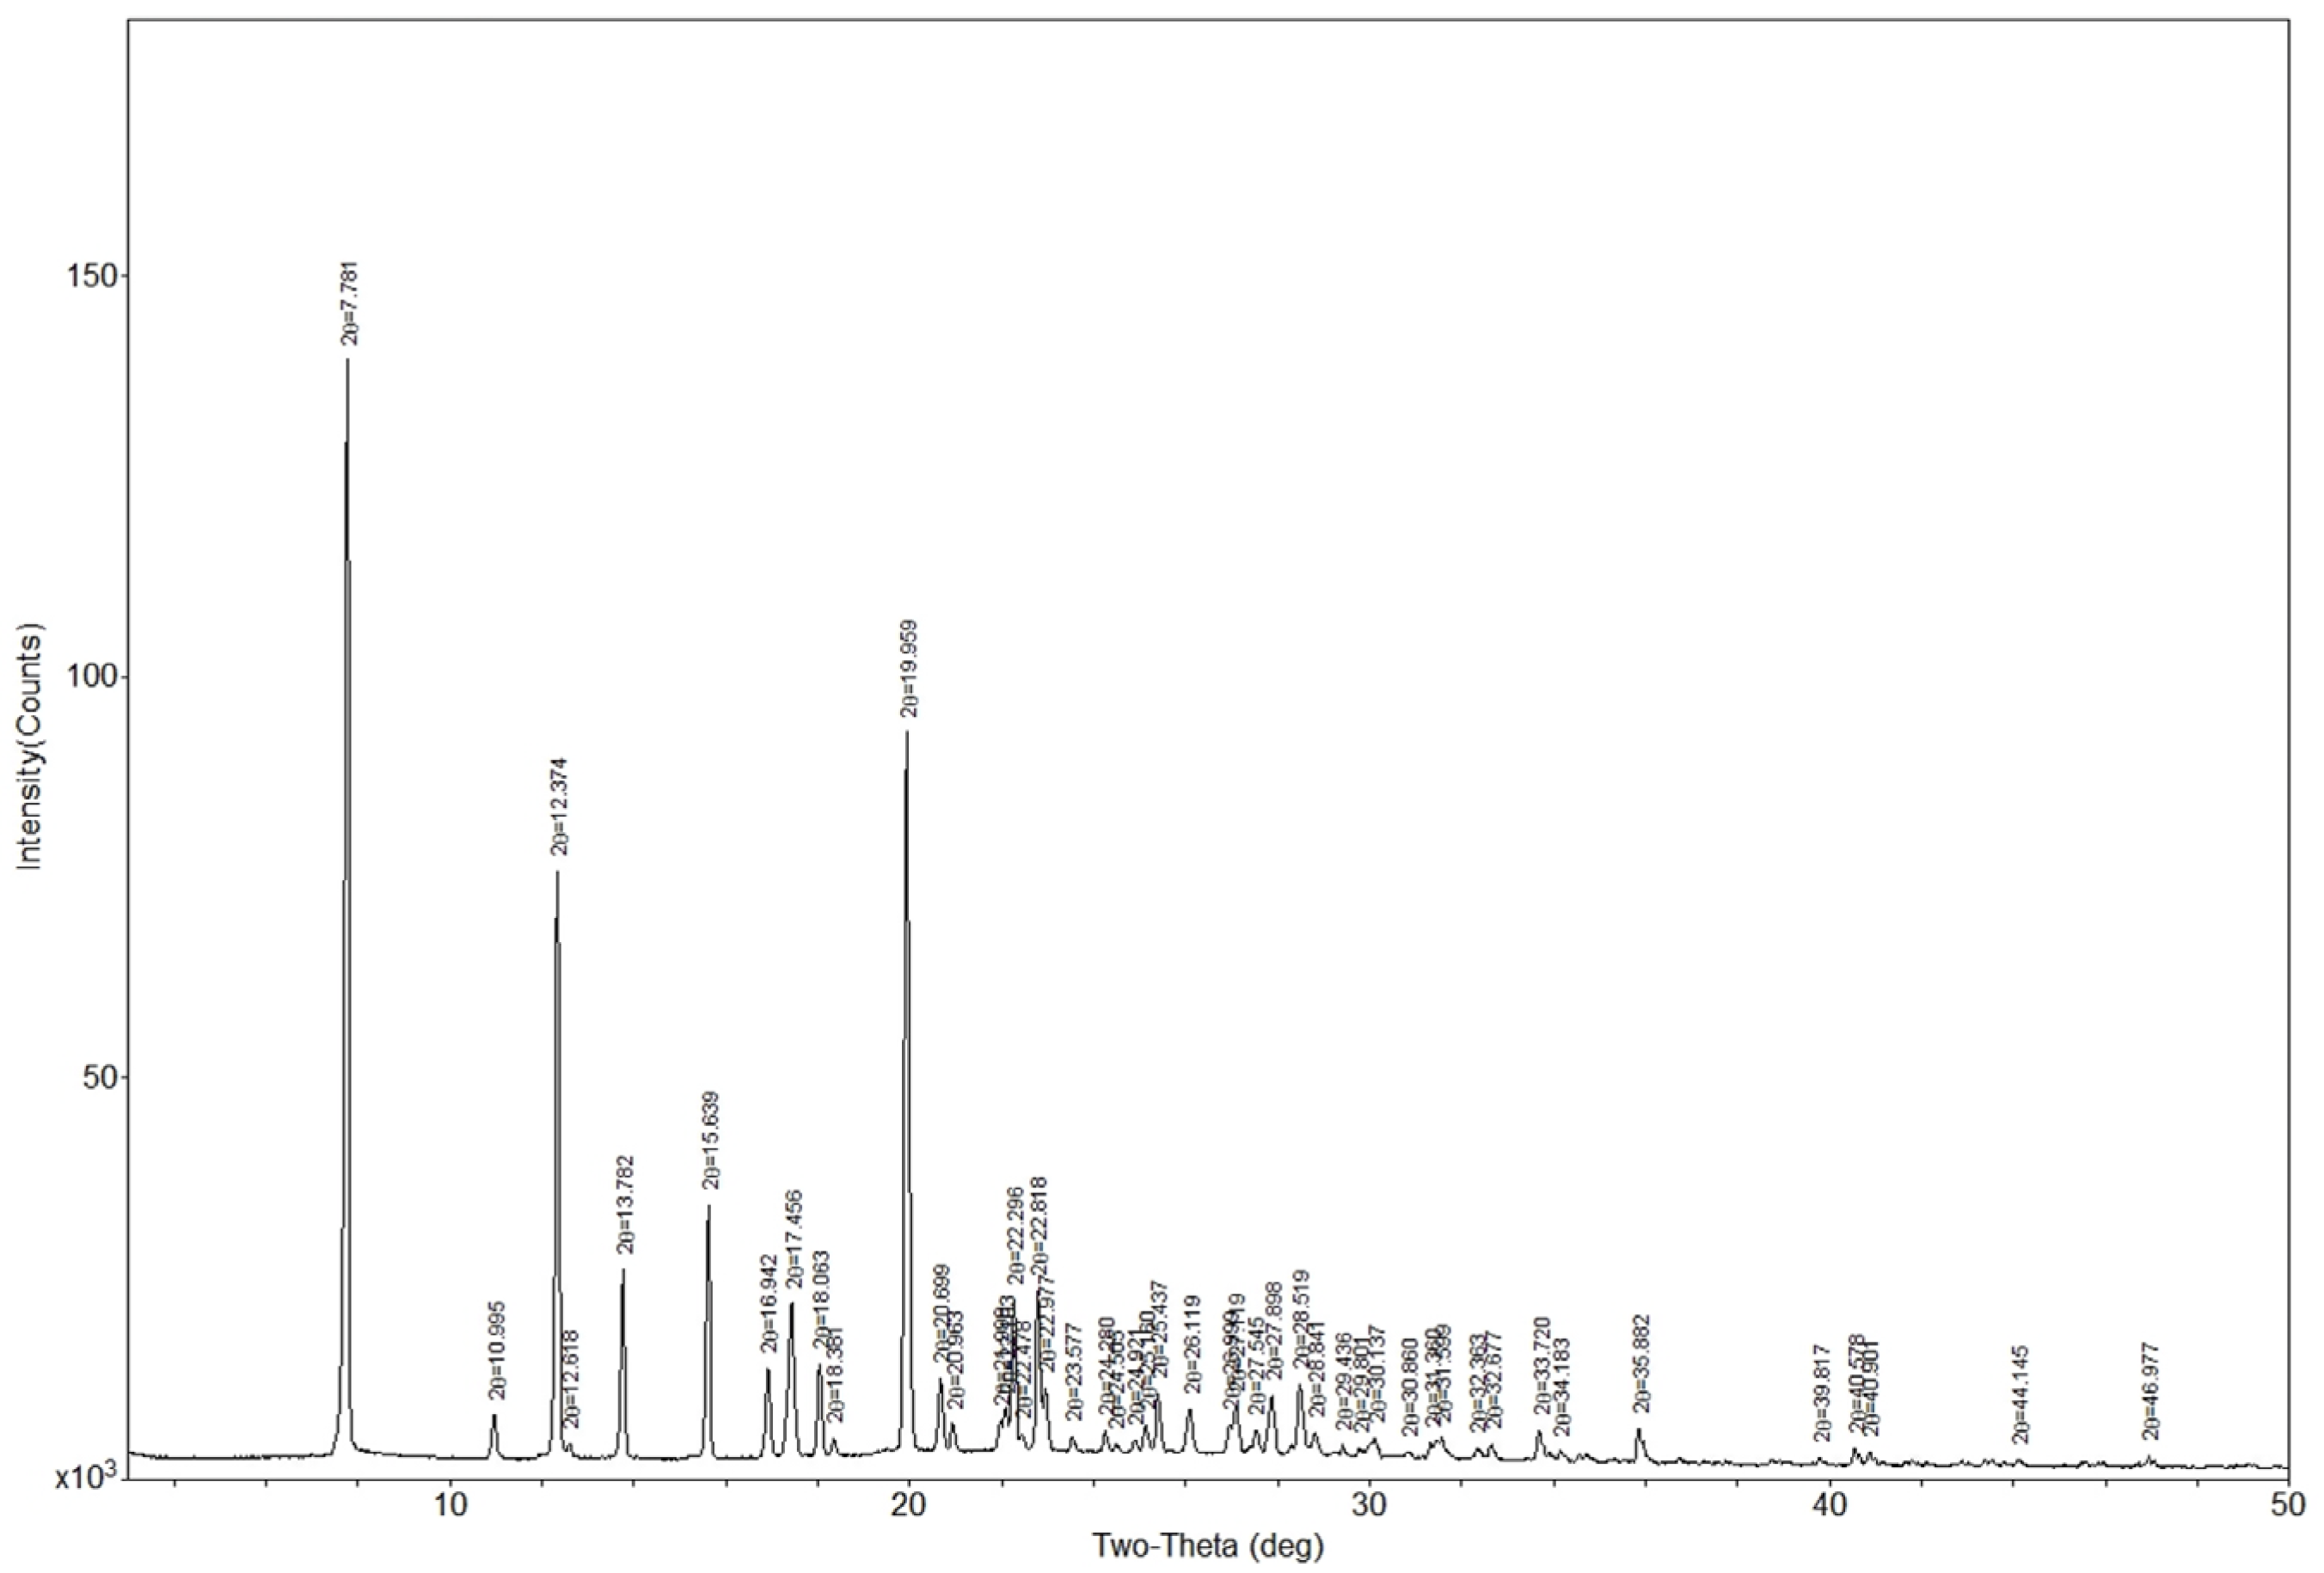
X-ray powder diffraction represents a pivotal method in the analysis of crystal structures. The powder diffraction results for A-1 and A-2 are presented in Figure 7 and Figure 8, respectively. Additionally, the numerical values of the five most significant 2θ angles for both compounds are tabulated in Table 5. Upon examining the data, it was evident that the 2θ angles of A-2 were slightly larger compared with those of A-1. Furthermore, the difference in peak intensity between 2θ1 and 2θ2-5 for A-2 was larger than that for compound A-1, indicating that A-2 was not adequately ground during powder diffraction, resulting in a certain degree of orientation in the crystal.

3.5. Mechanochromic Phenomenon

In recent years, mechanochromically luminescent crystalline organic materials, which can reversibly alter the color of their solid-state emissions in response to mechanical stimuli, have garnered significant attention due to their diverse potential applications [40,41,42,43,44]. These materials have a wide range of applications in fields such as rewritable paper, anti-counterfeiting ink, pressure sensing, and optical sensors. After grinding the orange-red A-2 crystal in a mortar for 10 min, its color changed to yellow, as shown in Figure 9. Under excitation with UV light at 254 nm, the fluorescence color of A-2 shifted from red to yellow. This change may be attributed to alterations in the twisting angles of the three benzene rings within its crystalline structure due to the grinding process, resulting in the formation of the yellow crystal form of A-1. Furthermore, when the A-2 crystal was subjected to a pressure of 10 MPa for 15 min, affording the yellow crystal A-1, the enhanced fluorescence property was also observed under 254 nm UV light. The mechanism behind the mechanically induced change in the emission color was attributed to the transition of the crystal form. To verify whether compound A-2 truly transformed into A-1 after being subjected to high pressure, we conducted X-ray powder diffraction tests on A-2 after thorough grinding (Figure 10). Upon comparing Figure 10 with Figure 7, it became evident that the powder diffraction pattern of A-2 after high pressure closely resembled that of A-1, suggesting that A-2 underwent a transformation into compound A-1 upon extensive grinding. This transformation occurred due to an increase in the compound’s density after high pressure, leading to a shift from a configuration with low symmetry to one with high symmetry. Given that the density of A-2 was lower than that of A-1, it transitioned to the configuration of A-1 upon high pressure. Additionally, high pressure disrupted the electron delocalization of A-2, leading to an increased energy difference between the HOMO and LUMO orbitals. Consequently, the emission wavelength shortened, resulting in a shift in fluorescence from red to yellow.

4. Conclusions

In summary, 2-(4-diphenylamino-benzylidene)malononitrile (DPAM) was synthesized in a high yield via a piperidine-catalyzed Knoevenagel condensation reaction. The crystal form diversity of DMAP was observed through the careful selection of crystallization solvents. Two distinct crystal forms (A-1 and A-2) of this product were obtained, exhibiting orthorhombic and monoclinic crystal systems, respectively. A systematic study encompassing the preparation process, spectroscopic data, thermal stability, single-crystal X-ray diffraction, and mechanochromism of the ICT-type organic crystal material DPAM allowed us to derive significant structure–property relationships. Based on the single-crystal X-ray diffraction analysis, the highly twisted benzene rings within these crystal structures inhibited the formation of exciplexes or excimers, thereby promoting enhanced emissions. The results of the mechanochromism study indicate that the mechanism underlying the mechanically induced changes in emission color was attributed to the transition of the crystal form. The results contribute to our understanding of the relationships between molecular structure, weak interactions, orientation growth processes, and self-assembly morphology. This research presents a promising organic crystalline material for applications in pressure sensing, anti-counterfeiting, and information encryption.

Supplementary Materials

The following supporting information can be downloaded at https://www.mdpi.com/article/10.3390/cryst15040380/s1. Figure S1: 1H NMR spectra of A-1 and A-2; Figure S2: 13C NMR spectra of A-1 and A-2; Figure S3: HRMS (ESI) spectra of A-1 and A-2; Figure S4: TG curve of A-1; Figure S5: TG curve of A-2; Figure S6: DSC curve of A-1; Figure S7: DSC curve of A-2. CIF files of the structures were deposited by the Cambridge Crystallographic Data Centre: 2434289 (DMAP A-1) and 2434473 (DMAP A-2). The copy can be obtained free of charge upon written application to CCDC, 12 Union Road, Cambridge, CB2 1EZ, UK (fax: +44-1223 336033) or by access to http://www.ccdc.cam.ac.uk (accessed on 26 and 27 March 2025).

Author Contributions

Conceptualization, H.G. and Q.L.; methodology, H.G.; validation, H.G. and Q.L.; investigation, H.G. and Q.L.; writing—original draft preparation, H.G. and Q.L.; writing—review and editing, H.G.; supervision, H.G.; project administration, H.G. All authors have read and agreed to the published version of the manuscript.

Funding

This research received no external funding.

Data Availability Statement

The original contributions presented in the study are included in the article/Supplementary Materials, further inquiries can be directed to the corresponding author.

Conflicts of Interest

The authors declare no conflicts of interest.

References

  1. Poriel, C.; Rault-Berthelot, J. Dihydroindenofluorenes as building units in organic semiconductors for organic electronics. Chem. Soc. Rev. 2023, 52, 6754–6805. [Google Scholar] [CrossRef] [PubMed]
  2. Shim, H.; Jang, S.; Yu, C.J. High-resolution patterning of organic semiconductors toward industrialization of flexible organic electronics. Matter 2022, 5, 23–25. [Google Scholar] [CrossRef]
  3. He, Z.R.; Bi, S.; Asare-Yeboah, K. Hybrid System of Polystyrene and Semiconductor for Organic Electronic Applications. Processes 2024, 12, 1944. [Google Scholar] [CrossRef]
  4. Morab, S.; Sundaram, M.M.; Pivrikas, A. Review on Charge Carrier Transport in Inorganic and Organic Semiconductors. Coatings 2023, 13, 1657. [Google Scholar] [CrossRef]
  5. Wang, Z.; Wu, X.; Zhang, S.; Yang, S.; Gao, P.; Huang, P.; Xiao, Y.; Shen, X.; Yao, X.; Zeng, D.; et al. Breaking the mobility–stability dichotomy in organic semiconductors through adaptive surface doping. Proc. Natl. Acad. Sci. USA 2025, 122, e2419673122. [Google Scholar] [CrossRef] [PubMed]
  6. Xie, Z.Y.; Liu, D.; Zhang, X.T.; Dong, H.L.; Hu, W.P. High Mobility Emissive Organic Semiconductors for Optoelectronic Devices. J. Am. Chem. Soc. 2025, 147, 2239–2256. [Google Scholar] [CrossRef] [PubMed]
  7. Ajayan, J.; Sreejith, S.; Ravindran, A.; George, A.; Mounika, B. Recent developments in organic photodetectors for future industrial applications: A review. Sens. Actuators A Phys. 2025, 387, 116459. [Google Scholar] [CrossRef]
  8. Hindson, J.C.; Ulgut, B.; Friend, R.H.; Greenham, N.C.; Norder, B.; Kotlewski, A.; Dingemans, T.J. All-aromatic liquid crystal triphenylamine-based poly(azomethine)s as hole transport materials for opto-electronic applications. J. Mater. Chem. 2010, 20, 937–944. [Google Scholar] [CrossRef]
  9. Gonzalez-Rabade, A.; Morteani, A.C.; Friend, R.H. Correlation of Heterojunction Luminescence Quenching and Photocurrent in Polymer-Blend Photovoltaic Diodes. Adv. Mater. 2009, 21, 38–39. [Google Scholar] [CrossRef]
  10. Liu, B.; Li, X.Y.; Liu, M.Y.; Ning, Z.J.; Zhang, Q.; Li, C.; Müllen, K.; Zhu, W.H. Photovoltaic performance of solid-state DSSCs sensitized with organic isophorone dyes: Effect of dye-loaded amount and dipole moment. Dye. Pigment. 2012, 94, 23–27. [Google Scholar] [CrossRef]
  11. Yang, K.; Zhang, X.H.; Harbuzaru, A.; Wang, L.; Wang, Y.; Koh, C.W.; Guo, H.; Shi, Y.Q.; Chen, J.H.; Sun, H.L.; et al. Stable Organic Diradicals Based on Fused Quinoidal Oligothiophene Imides with High Electrical Conductivity. J. Am. Chem. Soc. 2020, 142, 4329–4340. [Google Scholar] [CrossRef] [PubMed]
  12. Lian, X.J.; Zhao, Z.; Cheng, D.J. Recent progress on triphenylamine materials: Synthesis, properties, and applications. Mol. Cryst. Liq. Cryst. 2017, 648, 223–235. [Google Scholar] [CrossRef]
  13. Kuehne, A.J.C.; Gather, M.C. Organic Lasers: Recent Developments on Materials, Device Geometries, and Fabrication Techniques. Chem. Rev. 2016, 116, 12823–12864. [Google Scholar] [CrossRef] [PubMed]
  14. Nayak, S.R.; Girase, J.D.; Nagar, M.R.; Jou, J.H.; Vaidyanathan, S. Solution Processable Deep-Blue OLEDs Based on Benzimidazole-TPA Conjugated through 9,9-Diethyl Fluorene (D-π-A) Luminophore with a Hybridized Local and Charge Transfer Excited State. J. Phys. Chem. C 2023, 127, 10291–10302. [Google Scholar] [CrossRef]
  15. Park, S.; Lee, H.; Kang, S.; Kim, J.; Kwon, H.; Mahendra, G.; Jillella, R.; Park, J. Electroluminescent property of new chrysene derivatives having bulky side group of aromatic amine moiety. Mol. Cryst. Liq. Cryst. 2023, 762, 13–20. [Google Scholar] [CrossRef]
  16. Vijayaraghavan, S.N.; Khawaja, K.; Wall, J.; Xiang, W.J.; Yan, F. Photo-accelerated oxidation of spiro-OMeTAD for efficient carbon-based perovskite solar cells. Energy Adv. 2024, 3, 1054–1061. [Google Scholar] [CrossRef]
  17. Wang, R.Q.; Wang, R.; Chen, X.; Wu, C.Y.; Wu, F.; Liu, X.R. Side-chain engineering on triphenylamine derivative-based hole-transport materials for perovskite solar cells: Theoretical simulation and experimental exploration. Dye. Pigment. 2023, 212, 111097. [Google Scholar] [CrossRef]
  18. Sun, Y.; Zhao, C.D.; Zhang, J.X.; Peng, Y.L.; Ghadari, R.; Hu, L.H.; Kong, F.T. Multifunctional organic semiconductor for dopant-free perovskite solar cells. Synth. Met. 2022, 285, 117027. [Google Scholar] [CrossRef]
  19. Azmi, R.; Lee, U.; Wibowo, F.T.A.; Eom, S.H.; Yoon, S.C.; Jang, S.; Jung, I.H. Performance Improvement in Low-Temperature-Processed Perovskite Solar Cells by Molecular Engineering of Porphyrin-Based Hole Transport Materials. ACS Appl. Mater. Interfaces 2018, 10, 35404–35410. [Google Scholar] [CrossRef]
  20. Lu, S.; Fan, W.T.; Liu, H.; Gong, L.L.; Xiang, Z.X.; Wang, H.M.; Yang, C.Y. Four imidazole derivative AIEE luminophores: Sensitive detection of NAC explosives. New J. Chem. 2021, 45, 6889–6894. [Google Scholar] [CrossRef]
  21. Zhang, A.H.; Luan, N.; Wang, W.J.; Leng, J.C.; Zhang, Y.J. Theoretical study on a series of naphthalimide-contained two-photon fluorescent hypochlorite probe targeting endoplasmic reticulum: Response mechanism and receptor effect. J. Mol. Model. 2022, 28, 335. [Google Scholar] [CrossRef]
  22. Zhao, Q.; Li, L.J.; Bi, D.Q.; Wang, H.W.; Liu, D.T.; Wei, Y.P.; Xing, X.J.; Yang, C.X.; Qiu, D.F.; Zhou, G. Manipulating Intramolecular Charge Transfer in Terpyridine Derivatives Towards “Turn-On” Fluorescence Chemosensors for Zn2+. Chem.-Asian J. 2025, 20, e202401247. [Google Scholar] [CrossRef] [PubMed]
  23. Yang, P.C.; Wen, H.W.; He, H.J. Synthesis and chemosensory properties of triphenylamine-substituted conjugated polyfluorene containing a terminal di(2-picolyl)amine moiety. RSC Adv. 2015, 5, 101826–101833. [Google Scholar] [CrossRef]
  24. Juang, R.S.; Wen, H.W.; Chen, M.T.; Yang, P.C. Enhanced sensing ability of fluorescent chemosensors with triphenylamine-functionalized conjugated polyfluorene. Sensor Actuat. B-Chem. 2016, 231, 399–411. [Google Scholar] [CrossRef]
  25. Agrawa, H.G.; Giri, P.S.; Meena, P.; Rath, S.N.; Mishra, A.K. A Neutral Flavin–Triphenylamine Probe for Mitochondrial Bioimaging under Different Microenvironments. ACS Med. Chem. Lett. 2023, 14, 1857–1862. [Google Scholar] [CrossRef] [PubMed]
  26. Jiang, Y.H.; Zhang, S.; Wang, B.X.; Qian, T.; Jin, C.; Wu, S.S.; Shen, J. Novel triphenylamine-based fluorescent probe for specific detection and bioimaging of OCl. Tetrahedron 2018, 74, 5733–5738. [Google Scholar] [CrossRef]
  27. Matsuda, S.; Itagaki, C.; Tatsuguchi, K.; Ito, M.; Sasaki, H.; Umeda, M. Highly efficient hole injection from Au electrode to fullerene-doped triphenylamine derivative layer. Sci. Rep. 2022, 12, 7294. [Google Scholar] [CrossRef]
  28. Tao, J.W.; Liu, D.; Jing, J.B.; Dong, H.L.; Liu, L.J.; Xu, B.; Tian, W.J. Organic Single Crystals with High Photoluminescence Quantum Yields Close to 100% and High Mobility for Optoelectronic Devices. Adv. Mat. 2021, 33, 2105466. [Google Scholar] [CrossRef]
  29. Nagahora, N.; Goto, S.; Tokumaru, H.; Matsubara, K.; Shioji, K.; Okuma, K. Buchwald–Hartwig Amination of Phosphinines and the Effect of Amine Substituents on Optoelectronic Properties of the Resulting Coupling Products. J. Org. Chem. 2018, 83, 6373–6381. [Google Scholar] [CrossRef]
  30. Zhang, S.L.; Li, W.; Feng, W.H.; Wang, T.Y.; Liu, D.Z.; Zhou, X.Q. Synthesis and Properties of a Novel Triphenylamine Hole Transport Material. Chem. Ind. Eng. 2020, 37, 23–30. [Google Scholar]
  31. Kawakami, H.; Kato, H.; Iwamoto, T.; Kuroda, M. Electrical bistable behaviors of organic materials in a single-layer structure. Org. Field Eff. Transistors II 2003, 5217, 71–79. [Google Scholar]
  32. Lee, J.S.; Vlaisavljevich, B.; Britt, D.K.; Brown, C.M.; Haranczyk, M.; Neaton, J.B.; Smit, B.; Long, J.R.; Queen, W.L. Understanding Small-Molecule Interactions in Metal–Organic Frameworks: Coupling Experiment with Theory. Adv. Mater. 2015, 27, 5785–5796. [Google Scholar] [CrossRef]
  33. Li, X.C.; Lim, W.T.; Kim, S.H.; Son, Y.A. Crystal structure of 2-(4-(diphenylamino)benzylidene)malononitrile, C22H15N3. Z Krist. NCS 2009, 224, 493–494. [Google Scholar] [CrossRef]
  34. Dolomanov, O.V.; Bourhis, L.J.; Gildea, R.J.; Howard, J.A.K.; Puschmann, H. OLEX2: A Complete Structure Solution, Refinement and Analysis Program. J. Appl. Crystallogr. 2009, 42, 339–341. [Google Scholar] [CrossRef]
  35. Sheldrick, G.M. SHELXT-Integrated Space-Group and Crystal-Structure Determination. Acta Crystallogr. Sect. A Found. Adv. 2015, 71, 3–8. [Google Scholar] [CrossRef]
  36. Sheldrick, G.M. Crystal Structure Refinement with SHELXL. Acta Crystallogr. Sect. C Struct. Chem. 2015, 71, 3–8. [Google Scholar] [CrossRef]
  37. Tanabe, I.; Yamada, Y.; Ozaki, Y. Far- and Deep-UV Spectroscopy of Semiconductor Nanoparticles Measured Based on Attenuated Total Reflectance spectroscopy. ChemPhysChem 2016, 17, 516–519. [Google Scholar] [CrossRef]
  38. Zhang, L.H.; Kang, T.T.; Zhao, F.H.; Wang, D.L.; Shen, C.Y.; Wang, J.Y. Growth and Property Investigations of Two Organic–Inorganic Hybrid Molecular Crystals with High Thermal Stability: 4-Iodoanilinium perchlorate 18-crown-6 and 4-Iodoanilinium Borofluorate 18-crown-6. Crystals 2019, 9, 207. [Google Scholar] [CrossRef]
  39. Abozeed, A.A.; Sami, H.; Al-Hossainy, A.F.; Tsutsumi, O.; Younis, O. Exploring the multi-state photoluminescence of a thermally stable and liquid crystalline organic molecule. J. Lumin. 2024, 269, 120523. [Google Scholar] [CrossRef]
  40. Girish, Y.R.; Prashantha, K.; Byrappa, K. Recent advances in aggregation-induced emission of mechanochromic luminescent organic materials. Emergent Mater. 2021, 4, 673–724. [Google Scholar]
  41. Xue, P.C.; Ding, J.P.; Wang, P.P.; Lu, R. Recent progress in the mechanochromism of phosphorescent organic molecules and metal complexes. J. Mater. Chem. C 2016, 4, 6688–6706. [Google Scholar] [CrossRef]
  42. Ma, Z.Y.; Wang, Z.J.; Teng, M.J.; Xu, Z.J.; Jia, X.R. Mechanically Induced Multicolor Change of Luminescent Materials. ChemPhysChem 2015, 16, 1811–1828. [Google Scholar] [PubMed]
  43. Ito, S.; Nagai, S.; Ubukata, T.; Ueno, T.; Uekusa, H. Relationship between Crystal Structure, Crystal Morphology, and Mechanochromic Luminescence of Triphenylimidazolylbenzothiadiazole Derivatives. Cryst. Growth Des. 2020, 20, 4443–4453. [Google Scholar]
  44. Wang, X.Y.; Lv, L.Q.; Sun, L.; Hou, Y.; Hou, Z.H.; Chen, Z. Recent Advances in Mechanochromism of Metal-Organic Compounds. Front. Chem. 2022, 10, 865198. [Google Scholar] [CrossRef]
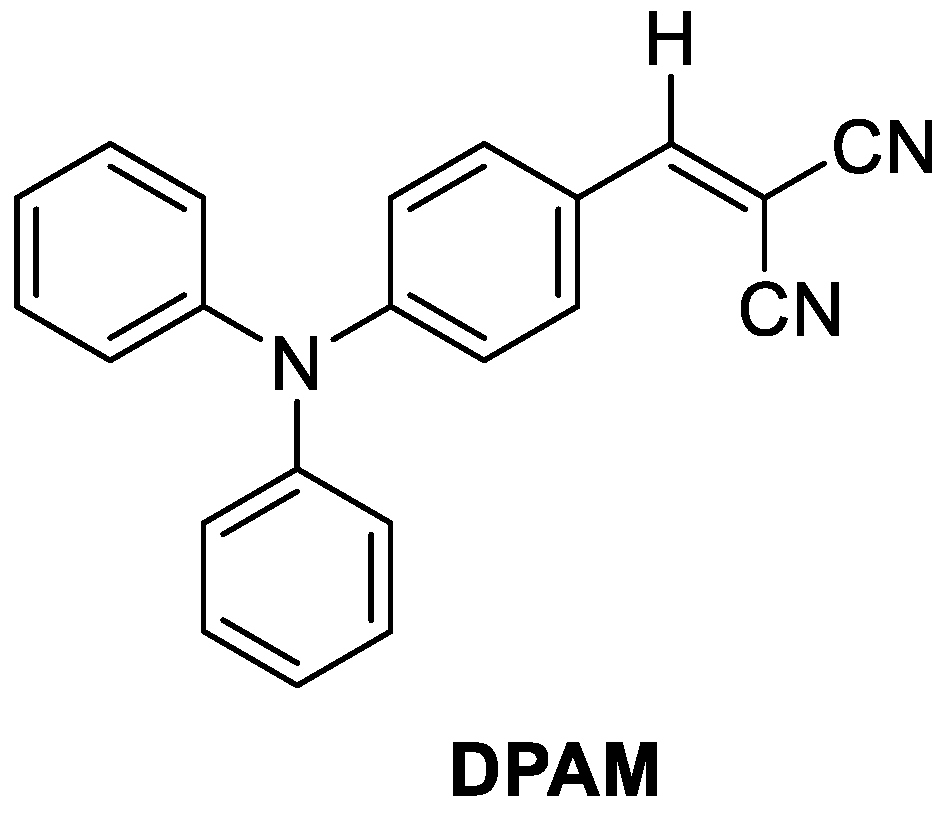
Figure 1. Molecular structure of DPAM.
Crystals 15 00380 g001
Scheme 1. Synthesis of DPAM.
Crystals 15 00380 sch001
Figure 2. The single-crystal and X-ray diffraction pattern of A-1.
Crystals 15 00380 g002aCrystals 15 00380 g002b
Figure 3. The single-crystal and X-ray diffraction pattern of A-2.
Crystals 15 00380 g003
Figure 4. IR spectra of A-1 and A-2.
Crystals 15 00380 g004
Figure 5. TG curves of thermal decomposition of compounds A-1 and A-2 in nitrogen.
Crystals 15 00380 g005
Figure 6. DSC curves of thermal decomposition of compounds A-1 and A-2 in nitrogen.
Crystals 15 00380 g006
Figure 7. X-ray powder diffraction data of A-1 crystal.
Crystals 15 00380 g007
Figure 8. X-ray powder diffraction data of A-2 crystal.
Crystals 15 00380 g008
Figure 9. Mechanochromism of A-2 crystal.
Crystals 15 00380 g009
Figure 10. X-ray powder diffraction data of A-2 crystal after grinding.
Crystals 15 00380 g010
Table 1. Crystal data and structural refinement of compounds A-1 and A-2.
CompoundA-1A-2
Empirical formulaC22H15N3C22H15N3
Formula weight321.37321.37
Temperature (K)170.0302.00
Crystal systemOrthorhombicMonoclinic
Space groupPbcaP21/c
a (Å)11.2205(6)7.0262(9)
b (Å)14.6394(10)15.9319(16)
c (Å)20.9226(16)16.1075(19)
α (°)9090
β (°)9095.169(5)
γ (°)9090
Volume (Å3)3436.8(4)1795.8(4)
Z84
ρcalc (g·cm−3)1.2421.189
μ (mm−1)0.0750.072
F(000)1344.0672.0
Crystal size (mm3)0.48 × 0.05 × 0.020.35 × 0.2 × 0.15
RadiationMoKα (λ = 0.71073)MoKα (λ = 0.71073)
2θ range for data collection (°)4.972 to 54.2525.078 to 56.686
Index ranges−14 ≤ h ≤ 13, −18 ≤ k ≤ 17, −26 ≤ l ≤ 26−9 ≤ h ≤ 9, −21 ≤ k ≤ 21, −21 ≤ l ≤ 21
Reflections collected2380037280
Independent reflections3802 (Rint = 0.0672, Rsigma = 0.0419)4468 (Rint = 0.0397, Rsigma = 0.0241)
Data/restraints/parameters3802/0/2264468/0/226
Goodness-of-fit on F21.0581.163
Final R indexes [I >= 2σ (I)]R1 = 0.0434, wR2 = 0.0901R1 = 0.0888, wR2 = 0.2343
Final R indexes [all data]R1 = 0.0698, wR2 = 0.1058R1 = 0.1317, wR2 = 0.3143
Largest diff. peak/hole (e.Å−3)0.13/−0.190.20/−0.30
Table 2. Bond lengths for compounds A-1 and A-2.
Bond/Distance (Å)A-1A-2
N1-C61.4370(18)1.435(3)
N1-C71.4335(17)1.438(3)
N1-C131.3885(18)1.375(3)
N2-C211.146(2)1.149(4)
N3-C221.150(2)1.148(4)
C1-C21.385(2)1.371(4)
C1-C61.388(2)1.379(4)
C2-C31.379(2)1.386(4)
C3-C41.378(2)1.360(6)
C4-C51.386(2)1.371(5)
C5-C61.381(2)1.380(5)
C7-C81.391(2)1.364(4)
C7-C121.389(2)1.379(4)
C8-C91.390(2)1.388(5)
C9-C101.384(2)1.366(5)
C10-C111.379(2)1.352(5)
C11-C121.386(2)1.387(4)
C13-C141.4099(19)1.408(3)
C13-C181.4071(19)1.401(3)
C14-C151.3751(19)1.370(3)
C15-C161.408(2)1.402(3)
C16-C171.402(2)1.405(3)
C16-C191.438(2)1.432(3)
C17-C181.373(2)1.369(3)
C19-C201.358(2)1.355(4)
C20-C211.438(2)1.423(4)
C20-C221.429(2)1.431(4)
Table 3. Bond angles for compounds A-1 and A-2.
Angles of A-1 (°)A-1Angles of A-2 (°)A-2
C7-N1-C6117.59(11)C1-N1-C7117.8(2)
C13-N1-C6120.80(11)C13-N1-C1120.8(2)
C13-N1-C7121.33(12)C13-N1-C7121.3(2)
C2-C1-C6120.02(15)C2-C1-N1120.2(2)
C3-C2-C1120.27(15)C2-C1-C6120.1(3)
C4-C3-C2119.70(15)C6-C1-N1119.7(3)
C3-C4-C5120.38(15)C1-C2-C3119.5(3)
C6-C5-C4120.07(14)C4-C3-C2120.5(4)
C1-C6-N1120.69(13)C3-C4-C5119.9(3)
C5-C6-N1119.75(13)C4-C5-C6120.3(3)
C5-C6-C1119.55(14)C1-C6-C5119.6(3)
C8-C7-N1119.57(13)C8-C7-N1120.2(3)
C12-C7-N1120.39(13)C8-C7-C12119.5(3)
C12-C7-C8120.03(13)C12-C7-N1120.3(3)
C9-C8-C7119.16(15)C7-C8-C9119.9(3)
C10-C9-C8120.74(15)C10-C9-C8120.2(3)
C11-C10-C9119.75(15)C11-C10-C9120.3(3)
C10-C11-C12120.29(15)C10-C11-C12120.0(3)
C11-C12-C7119.99(15)C7-C12-C11120.1(3)
N1-C13-C14121.47(13)N1-C13-C14121.6(2)
N1-C13-C18120.74(13)N1-C13-C18120.8(2)
C18-C13-C14117.78(13)C18-C13-C14117.6(2)
C15-C14-C13121.14(13)C15-C14-C13120.4(2)
C14-C15-C16121.37(14)C14-C15-C16122.4(2)
C15-C16-C19125.72(14)C15-C16-C17116.6(2)
C17-C16-C15116.85(13)C15-C16-C19118.5(2)
C17-C16-C19117.43(13)C17-C16-C19124.9(2)
C18-C17-C16122.54(14)C18-C17-C16121.5(2)
C17-C18-C13120.31(14)C17-C18-C13121.4(2)
C20-C19-C16131.58(15)C20-C19-C16130.9(2)
C19-C20-C21119.85(15)C19-C20-C21125.7(2)
C19-C20-C22125.64(14)C19-C20-C22119.7(2)
C22-C20-C21114.46(14)C21-C20-C22114.6(2)
N2-C21-C20178.90(19)N2-C21-C20179.1(3)
N3-C22-C20177.76(18)N3-C22-C20179.0(3)
Table 4. The major IR spectra of A-1 and A-2 (cm−1).
Compoundsv (C-H)v (C≡N)v (C-H)
A-1305222191487
A-2306022191486
Table 5. The major angles of 2θ of A-1 and A-2 (°).
2θ (°)12345
A-17.78012.35913.77915.62219.942
A-27.82012.38213.81515.63319.983
Disclaimer/Publisher’s Note: The statements, opinions and data contained in all publications are solely those of the individual author(s) and contributor(s) and not of MDPI and/or the editor(s). MDPI and/or the editor(s) disclaim responsibility for any injury to people or property resulting from any ideas, methods, instructions or products referred to in the content.