Article

Enhanced Fenton-like Catalytic Activation of Peroxymonosulfate over Macroporous LaFeO3 for Water Remediation

Department of Inorganic Chemistry, Faculty of Chemistry and Pharmacy, St. Kl. Ohridski University of Sofia, J. Bourchier 1, 1164 Sofia, Bulgaria
*
Author to whom correspondence should be addressed.
Crystals 2025, 15(5), 394; https://doi.org/10.3390/cryst15050394
Submission received: 18 March 2025 / Revised: 19 April 2025 / Accepted: 21 April 2025 / Published: 24 April 2025
(This article belongs to the Special Issue Rare Earths-Doped Materials (3rd Edition))

Abstract

:
Four different-sized carbon microspheres, CS, obtained by a facile hydrothermal method, are applied as a hard template for the preparation of a series of macroporous LaFeO3. The average particle size of the CS obtained is between 0.350 and 0.700 µm. The macroporous LaFeO3 are tested in a Fenton-like activation of peroxymonosulfate, PMS, for oxidation of tetracycline hydrochloride, TCH, in model water solution under visible-light irradiation. The effect of parameters such as type of irradiation, temperature of the reaction, and type of the water matrixes was tested. The oxidation of the pollutant TCH is evaluated by total organic carbon and organic nitrogen measurements. The results showed the superior catalytic activity of macroporous LaFeO3 in comparison to pure LaFeO3. Rate constants between 0.036 and 0.184 min−1 at 25 °C were obtained. The activation energy for the process with the most active macroporous LaFeO3 was 33.88 kJ/mol, a value lower than for the catalytic process with PMS only, proving the positive role of the macroporous LaFeO3 for TCH degradation. Radical scavenger measurements showed that singlet oxygen, produced during the catalytic degradation process, was responsible for the performance of macroporous LaFeO3/PMS/visible light for TCH degradation. The catalysts proved to be efficient and recyclable.

1. Introduction

Carbon spheres, CS, are nanostructured materials used in different applications such as catalyst supports for methanol oxidation [1,2], preparation of electrodes [3,4], hydrogen storage [3], etc. They can be synthesized by different procedures like chemical vapor deposition (CVD) [5,6,7], arc-discharge [8], laser ablation [9], etc., all leading to materials with different properties. One of the methods for synthesis, namely hydrothermal carbonization (HTC), as an autoclave process for CS production, operates under mild conditions without employing organic solvents or catalysts. At the same time, it is an attractive, low-cost step of carbonization prior to pyrolysis [10,11,12]. The parameters of the process influences the structural characteristics of CS, as well as the possible mechanisms of the carbon spheres’ formation [13,14]. Different sources such as carbohydrates (glucose, fructose, xylose, sucrose, cellulose, starch biomass, sewage sludge, etc.) have been tested for HTC carbon sphere production. The processing temperature affects both the average diameter of CS particles and the size distribution; higher temperatures lead to a uniform particle diameter and a more homogeneous average size [11]. Synthesis of mesoporous CS with a size of 0.5–1 μm from biomass residue via ultrasonic spray pyrolysis [3]; with an average size of 1–2 μm by HTC of pure sucrose [10]; with a size of about 1.0 µm by HTC of a 1 M D-glucose solution [13] are some of the results to mention. Data on the CS particle sizes depending on the method of synthesis are summarized in [12].
The application of CS as pore tuning templates is an addition to those mentioned above [15]. CS are known to be suitable as hard templates in hollow metal oxide constructions due to the functional groups on the surface. The combination of solution combustion with CS hard templates is a classical approach for the synthesis of porous- and hollow-structured metal oxides, as well as bimetal oxides such as CeO2-MnOx [15] and doped lanthanum perovskite Ce/LaCo0.5Cu0.5O3 [16]. This experimental approach can be tested for porous LaFeO3 synthesis as well. Our interest was focused on LaFeO3 because, alongside all the useful physical properties and applications, the material is known as an activator for peroxydisulfate (PDS)/peroxymonosulfate (PMS) in Fenton-like processes [17,18,19,20]. The Fenton reaction for water treatment is a promising catalytic reaction for complete oxidation of organic pollutants [21]. At the same time, some disadvantages of the reaction such as insufficient separation and recovery of the iron species, narrow optimal pH range, and production of secondary pollutants such as ferric hydroxide can be overcome by the use of metal oxides in Fenton-like processes [21]. It is known that metal oxides also have some disadvantages, such as a low specific surface area limiting the atoms participating in the reaction and leading to low catalytic activity. The latter could be overcome by applying a combustion process for the synthesis of a mixed metal oxide in the presence of CS as a template.
In the work presented, we used a modified citrate-nitrate, auto-combustion, sol–gel technique to prepare pure LaFeO3 as well as LaFeO3 in the presence of CS as a hard template, produced by the hydrothermal carbonization (HTC) of D-glucose. The samples obtained were tested as activators for PMS at the conditions of a Fenton-like reaction in order to investigate the influence of CS on the properties of LaFeO3. In spite of the huge number of iron-based catalysts for the activation of PMS, a study on LaFeO3 produced in the presence of CS as a hard template is not found in the literature available. Tetracycline hydrochloride is a commonly used antibiotic [22], also known as a common antibiotic pollutant [23] causing environmental problems due to its toxicity and chemical stability [24,25]. That is why it was chosen as a model pollutant in water solutions, and its decomposition in the catalytic reaction was investigated. The mechanism of the reaction of TCH decomposition by LaFeO3/PMS/visible-light irradiation was determined by a series of experiments involving radical quenchers. The influence of different factors like water matrices, temperature, and type of irradiation was evaluated.

2. Materials and Methods

2.1. Materials

D-glucose (≥99.5%, Sigma-Aldrich, Milwaukee, WI, USA); CTAB (≥99%, p.a., Sigma-Aldrich, Milwaukee, WI, USA); La(NO3)3·6H2O (p.a., Sigma-Aldrich, Milwaukee, WI, USA); Fe(NO3)3∙9H2O (p.a., Sigma-Aldrich, Milwaukee, WI, USA); KHSO5 (Oxone®, Sigma-Aldrich, Milwaukee, WI, USA); NaN3 (≥99%, p.a., Sigma-Aldrich, Milwaukee, WI, USA); 2-propanol (≥99.8%, ACS reagent, Supelco®, Bellefonte, PA, USA); and methanol (≥99.8%, ACS reagent, HPLC grade, Sigma-Aldrich, Milwaukee, WI, USA) were obtained.

2.2. Synthesis

2.2.1. Carbon Microsphere Preparation

The carbon microspheres’ hard template was synthesized by hydrothermal carbonization (HTC) of D-glucose. The molar concentration of the glucose solution was determined experimentally by conducting parallel experiments with solutions in the concentration interval 0.1–1 M. The solutions with a concentration lower than 0.5 M did not produce carbon spheres, while those with a concentration higher than 0.5 M produced carbon spheres with a very broad particle size distribution. Briefly, in a typical experiment 0.5 M D-glucose solution was prepared by dissolving the appropriate amount of D-glucose in 60 mL of ultrapure water (18.2 MΩ) followed by adding 5 wt % of (with respect to the D-glucose) CTAB as a surfactant to narrow the size distribution of the obtained carbon spheres. After electromagnetic-stirring for 30 min, the solution was transferred into a 90 mL, PTFE-lined, stainless steel autoclave and treated at 180 °C for different periods of time, i.e., 6, 8, 10, or 12 h. The brown–black precipitate was separated by centrifugation at 6000 rpm and washed with water/ethanol (1:1) mixture until a transparent filtrate was obtained. The samples were dried at 60 °C overnight and labeled as CS-X, where X represents the time in hours of HTC duration (Figure 1a).

2.2.2. Macroporous LaFeO3 Preparation

In order to prepare macroporous LaFeO3, a modified citrate-nitrate, auto-combustion sol–gel method was applied. Briefly, 200 mg of the carbon spheres were dispersed under ultrasound for 1 h in 50 mL of ultrapure water, followed by adding stoichiometric amounts of La(NO3)3∙6H2O and Fe(NO3)3∙9H2O (molar ratio of La:Fe = 1:1) and magnetic stirring for 2 h. The calculated amount of the final LaFeO3 in respect to the carbon spheres was fixed at 30 wt % for all samples. After dissolution of the metal nitrates, the citric acid was added (molar ratio of metal ions to citric acid 1:1), and the mixture was additionally magnetically stirred at 80 °C for 2 h under reflux followed by keeping it at 80 °C until the gel formation in an open flask. The obtained gel was then treated at 400 °C for 2 h followed by calcination at 850 °C for 3 h. Hereafter, the samples obtained are mentioned in the text as LFO-CS-X, where X represents the time in hours of HTC for CS preparation, as stated above in Section 2.2.1. The same procedure was applied for the preparation of LaFeO3 without carbon microspheres (Figure 1b), mentioned in the text simply as LaFeO3.

2.3. Methods of Characterization

X-ray diffraction to determine the crystal structure of the samples was performed using a PANalytical Empyrean X-ray diffractometer in the 2θ range of 15–90° by CuKα radiation (λ = 0.15405 nm), with steps of 0.01° and 20 s exposure time at each step. The structural and microstructural (crystallite size and microstrains) information was extracted by a full-profile Rietveld method using the FullProf Suite software (version April 2025) [26,27].
The transmitting electron microscope (TEM) images were obtained by a JEM 2100 (JEOL, Tokyo, Japan), 200 kV, and up to 1,500,000 times magnification.
UV-Vis absorption spectroscopy was applied using an Evolution 300 UV-Vis spectrometer (Thermo Scientific, Waltham, MA, USA) for measuring the absorption of the samples in the range of 200–900 nm.
Band gap energy was calculated from the UV-Vis absorption spectra. The UV-Vis data were analyzed for the relation between the optical band gap, absorption coefficient, and energy (hν) of the incident photon for near edge optical absorption in semiconductors. The band gap energy was calculated using the measured curves by fits according to Tauc’s equation αhν = A(hν − Eg)n/2, where A is a constant independent of hν, Eg is the semiconductor band gap, and n depends on the type of transition [28]. The value used for n was 2, reflecting an indirect transition.

2.4. Catalytic Reaction for Degradation of TCH

Catalytic experiments were performed under fixed conditions regardless of the catalyst. The contaminant concentration was 20 mg/L for the antibiotic TCH with a dose of catalyst 200 mg/L and a persulfate KHSO5 (Oxone®) concentration of 1 mM (concentration of 1 mM to the final volume). As a light source, a Schott KL 2500 LED was used, emitting only in the visible region of the spectrum at a controlled temperature of 25 °C ± 0.1. As a reaction quencher, 0.01 M Na2S2O3 was used. In the experiments with UV light, a Sylvania 18 W BLB T8 light source with an emission in the 345–400 nm region with a maximum at 365 nm was used. The experiments with ultrasound (32 kHz) were performed with an ultrasonic bath (Siel, model UST2.8-100).
The procedure for the catalytic experiments was as follows: to a double-jacked Pyrex reactor, a standard solution of TCH was added, followed by the catalyst. After a 60 min ”dark” period, the equilibrium of the sorption process was assumed to be established. Then, KHSO5 (Oxone®) oxidant was added, which is widely used in various oxidation processes, but its activation (most often thermally) is slow and ineffective. A sample of 2.5 mL was taken and filtered through a 0.22 µm membrane filter to remove the catalyst; 150 µL of a 0.05 M solution of Na2S2O3 was used to quench the reaction.
The data were plotted in coordinates (C/C0)/t and −ln(C/C0)/t (where C0 is the concentration after the “dark” period and C is the concentration after t min irradiation), and apparent rate constants of the degradation process were determined assuming first-order kinetics. The degradation at moment t is determined by the formula as follows: degradation, % = (A0 − At)/A0 × 100, where A0 is the initial absorption of the TCH solution at t = 0 min and At is the absorption at t min. The determination of the rate constant was performed according to the Langmuir–Hinshelwood kinetic model, with the reaction order assumed to be first (or pseudo-first).
The mechanism of the reactions was determined by a series of experiments involving radical quenchers. The concentration of TCH after the reaction was determined by UV/Vis absorption spectroscopy by monitoring the peak at 354 nm, as well as by determination of the total organic carbon and organic nitrogen (TOC and TNb) at 850 °C for catalytic oxidation.

3. Results and Discussion

3.1. Characterization of the Samples

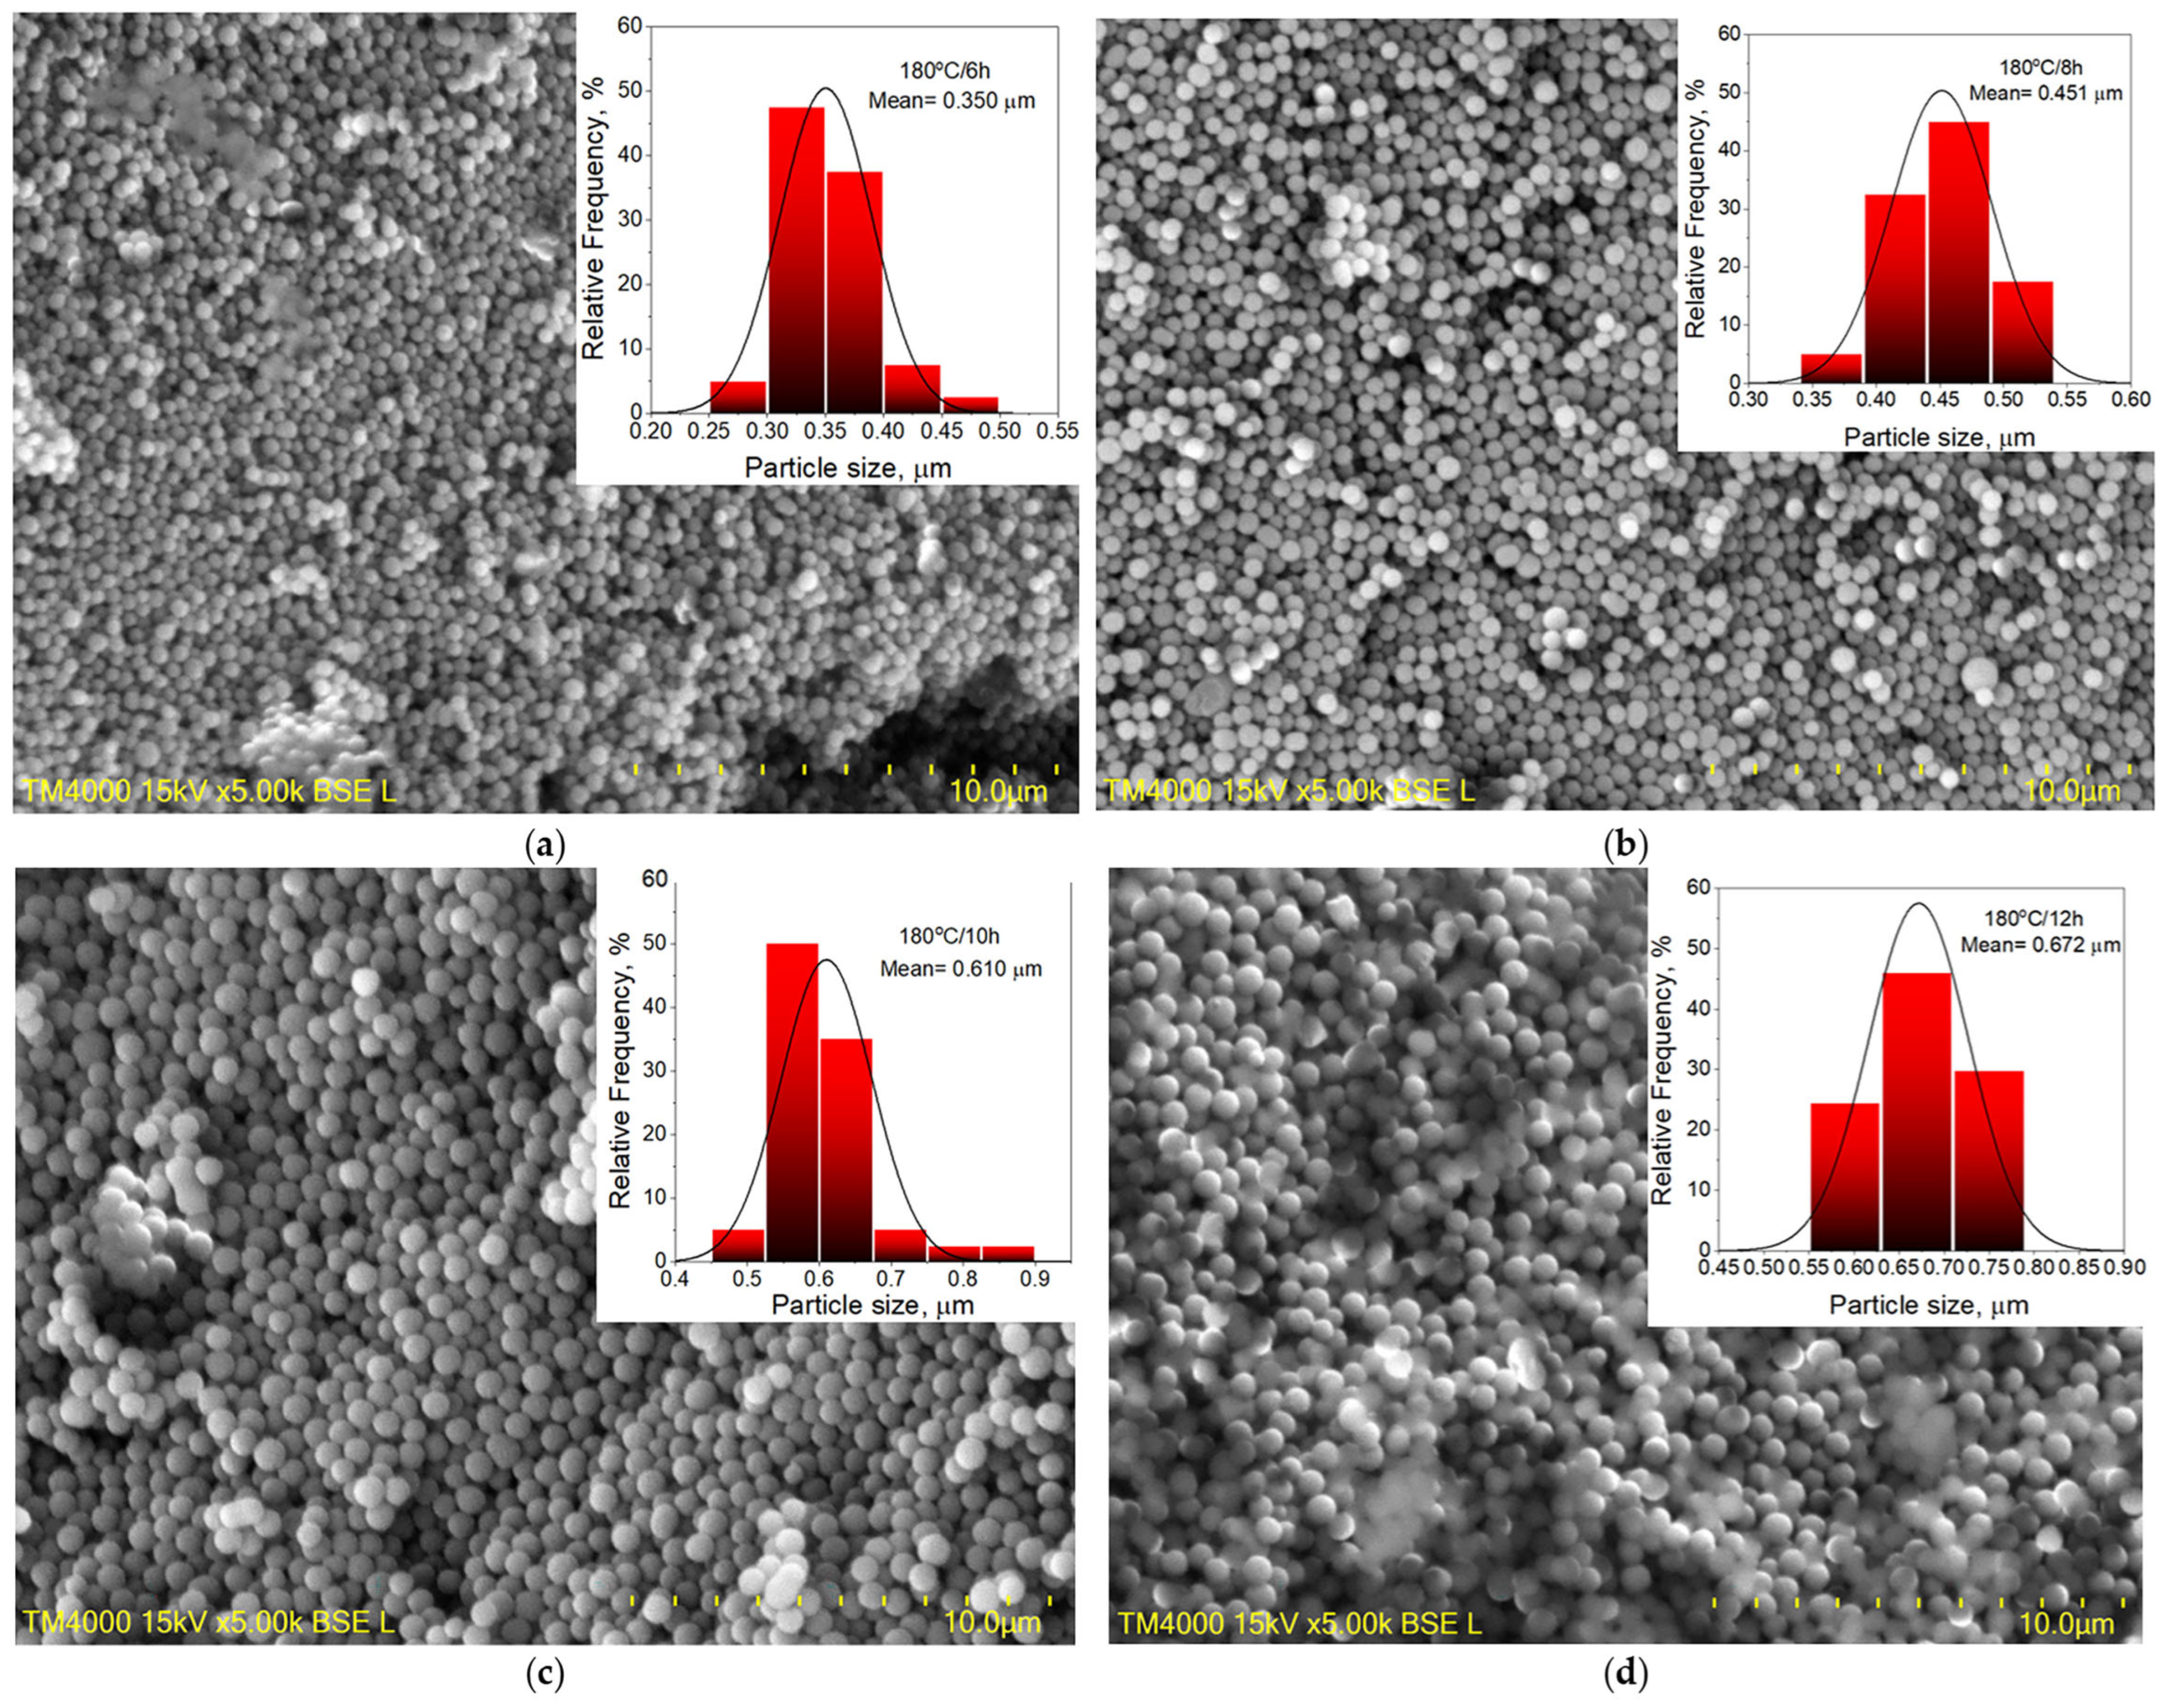
3.1.1. Carbon Spheres, CS

Scanning electron microscopy, SEM, was used to characterize the carbon spheres synthesized. Typical SEM images as well as the particle size distribution of the spheres are shown in Figure 2. The photographs show that the resulting particles appear to be smooth and spherical and have a relatively narrow size distribution. Some of the spheres are linked to each other by necks and appear to form chains. This is more noticeable for the samples CS-8 and CS-10. The data show that the carbon microspheres have a mean particle size in the range of 0.350–0.700 µm, which is increasing with the duration of the hydrothermal treatment from 6 to 12 h, respectively. At higher temperatures, a longer HTC time (260 °C/24 h) and a higher concentration of D-glucose H2O solution (1 M), larger CS (1 µm) have been reported in [13]. Based on the results, we can confirm that using a 0.5 M H2O solution of D-glucose as well as a reaction time of HTC up to 12 h can ensure a CS particle size below 1 µm.

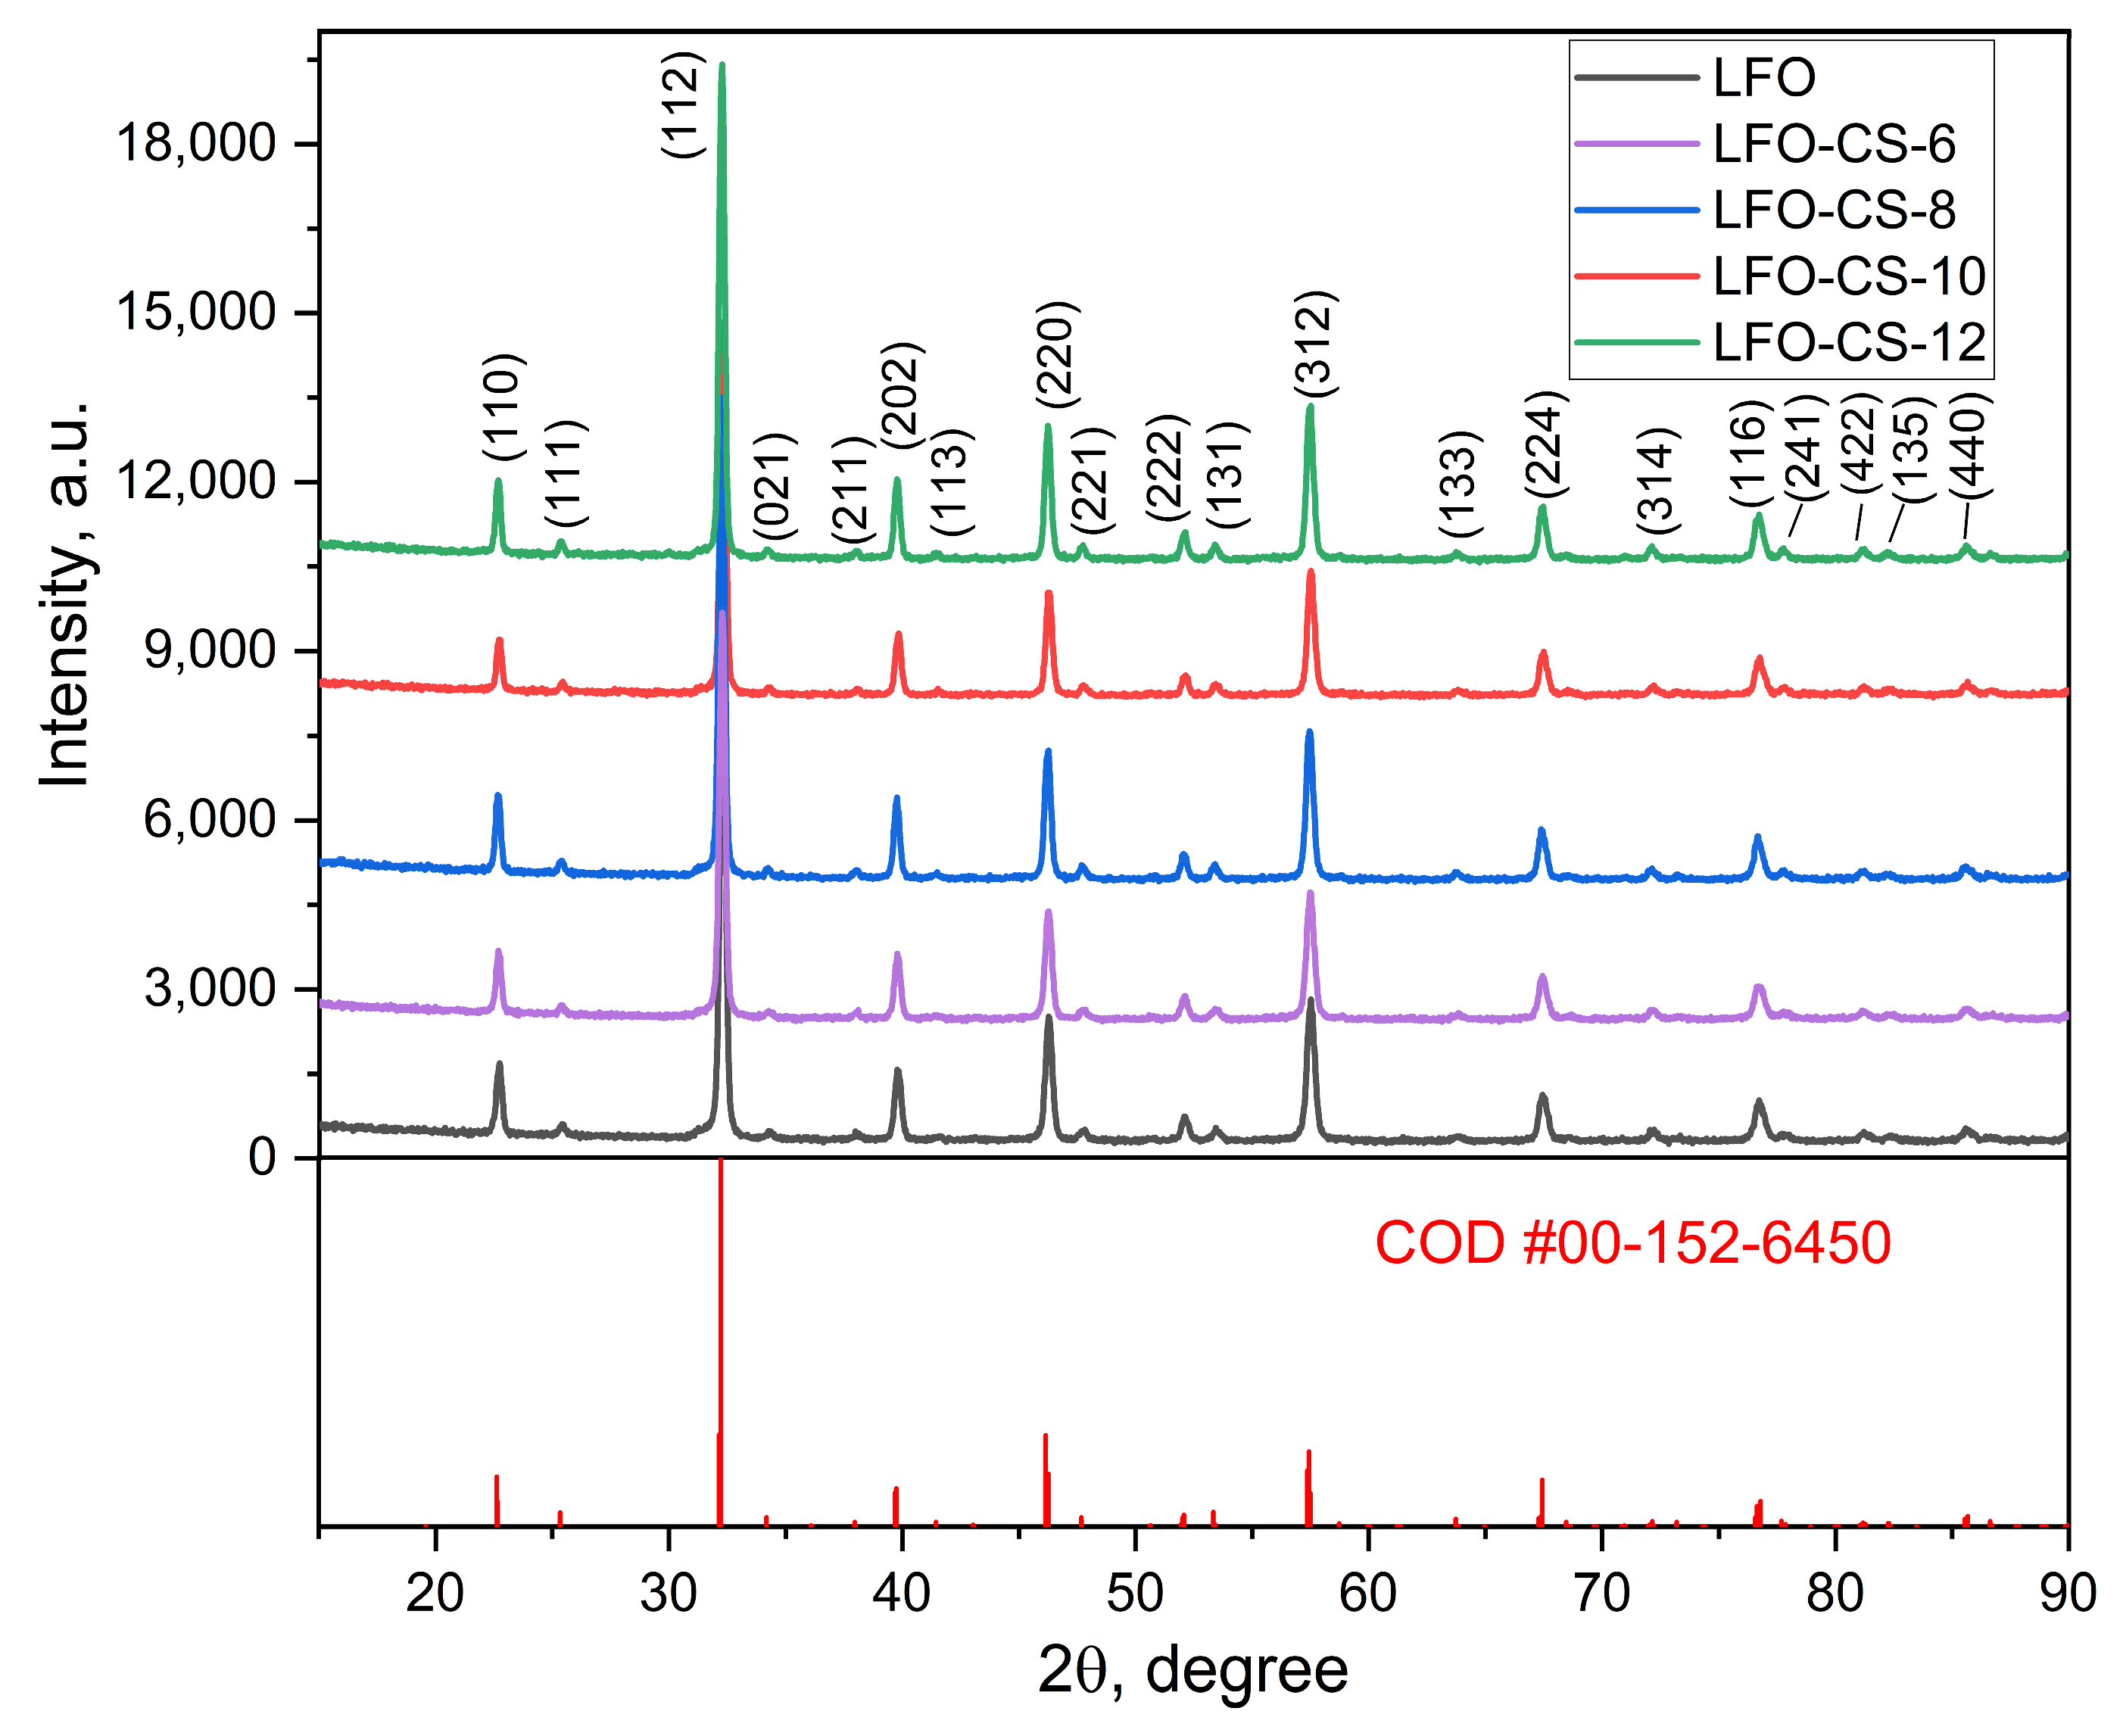
3.1.2. XRD of LaFeO3 and LFO-CS-X (LaFeO3, Synthesized in Presence of CS-X)

Typical diffractograms of the pure LaFeO3 and of the samples LFO-CS-X are shown in Figure 3. The phase composition of all samples remains unchanged, but some changes in the microstructural characteristics are observed (Table 1). The addition of carbon microspheres leads to a continuous increase in the average crystallite size from 88 nm for the pure LaFeO3 to 98 nm for LFO-CS-6 and up to 128 nm for LFO-CS-12, whereas the amount of microstrain decreases. A monotonic dependence on time is observed: the average crystallite size increases with the increased time for the synthesis of CS, i.e., with the increased mean particle size of the carbon microspheres.

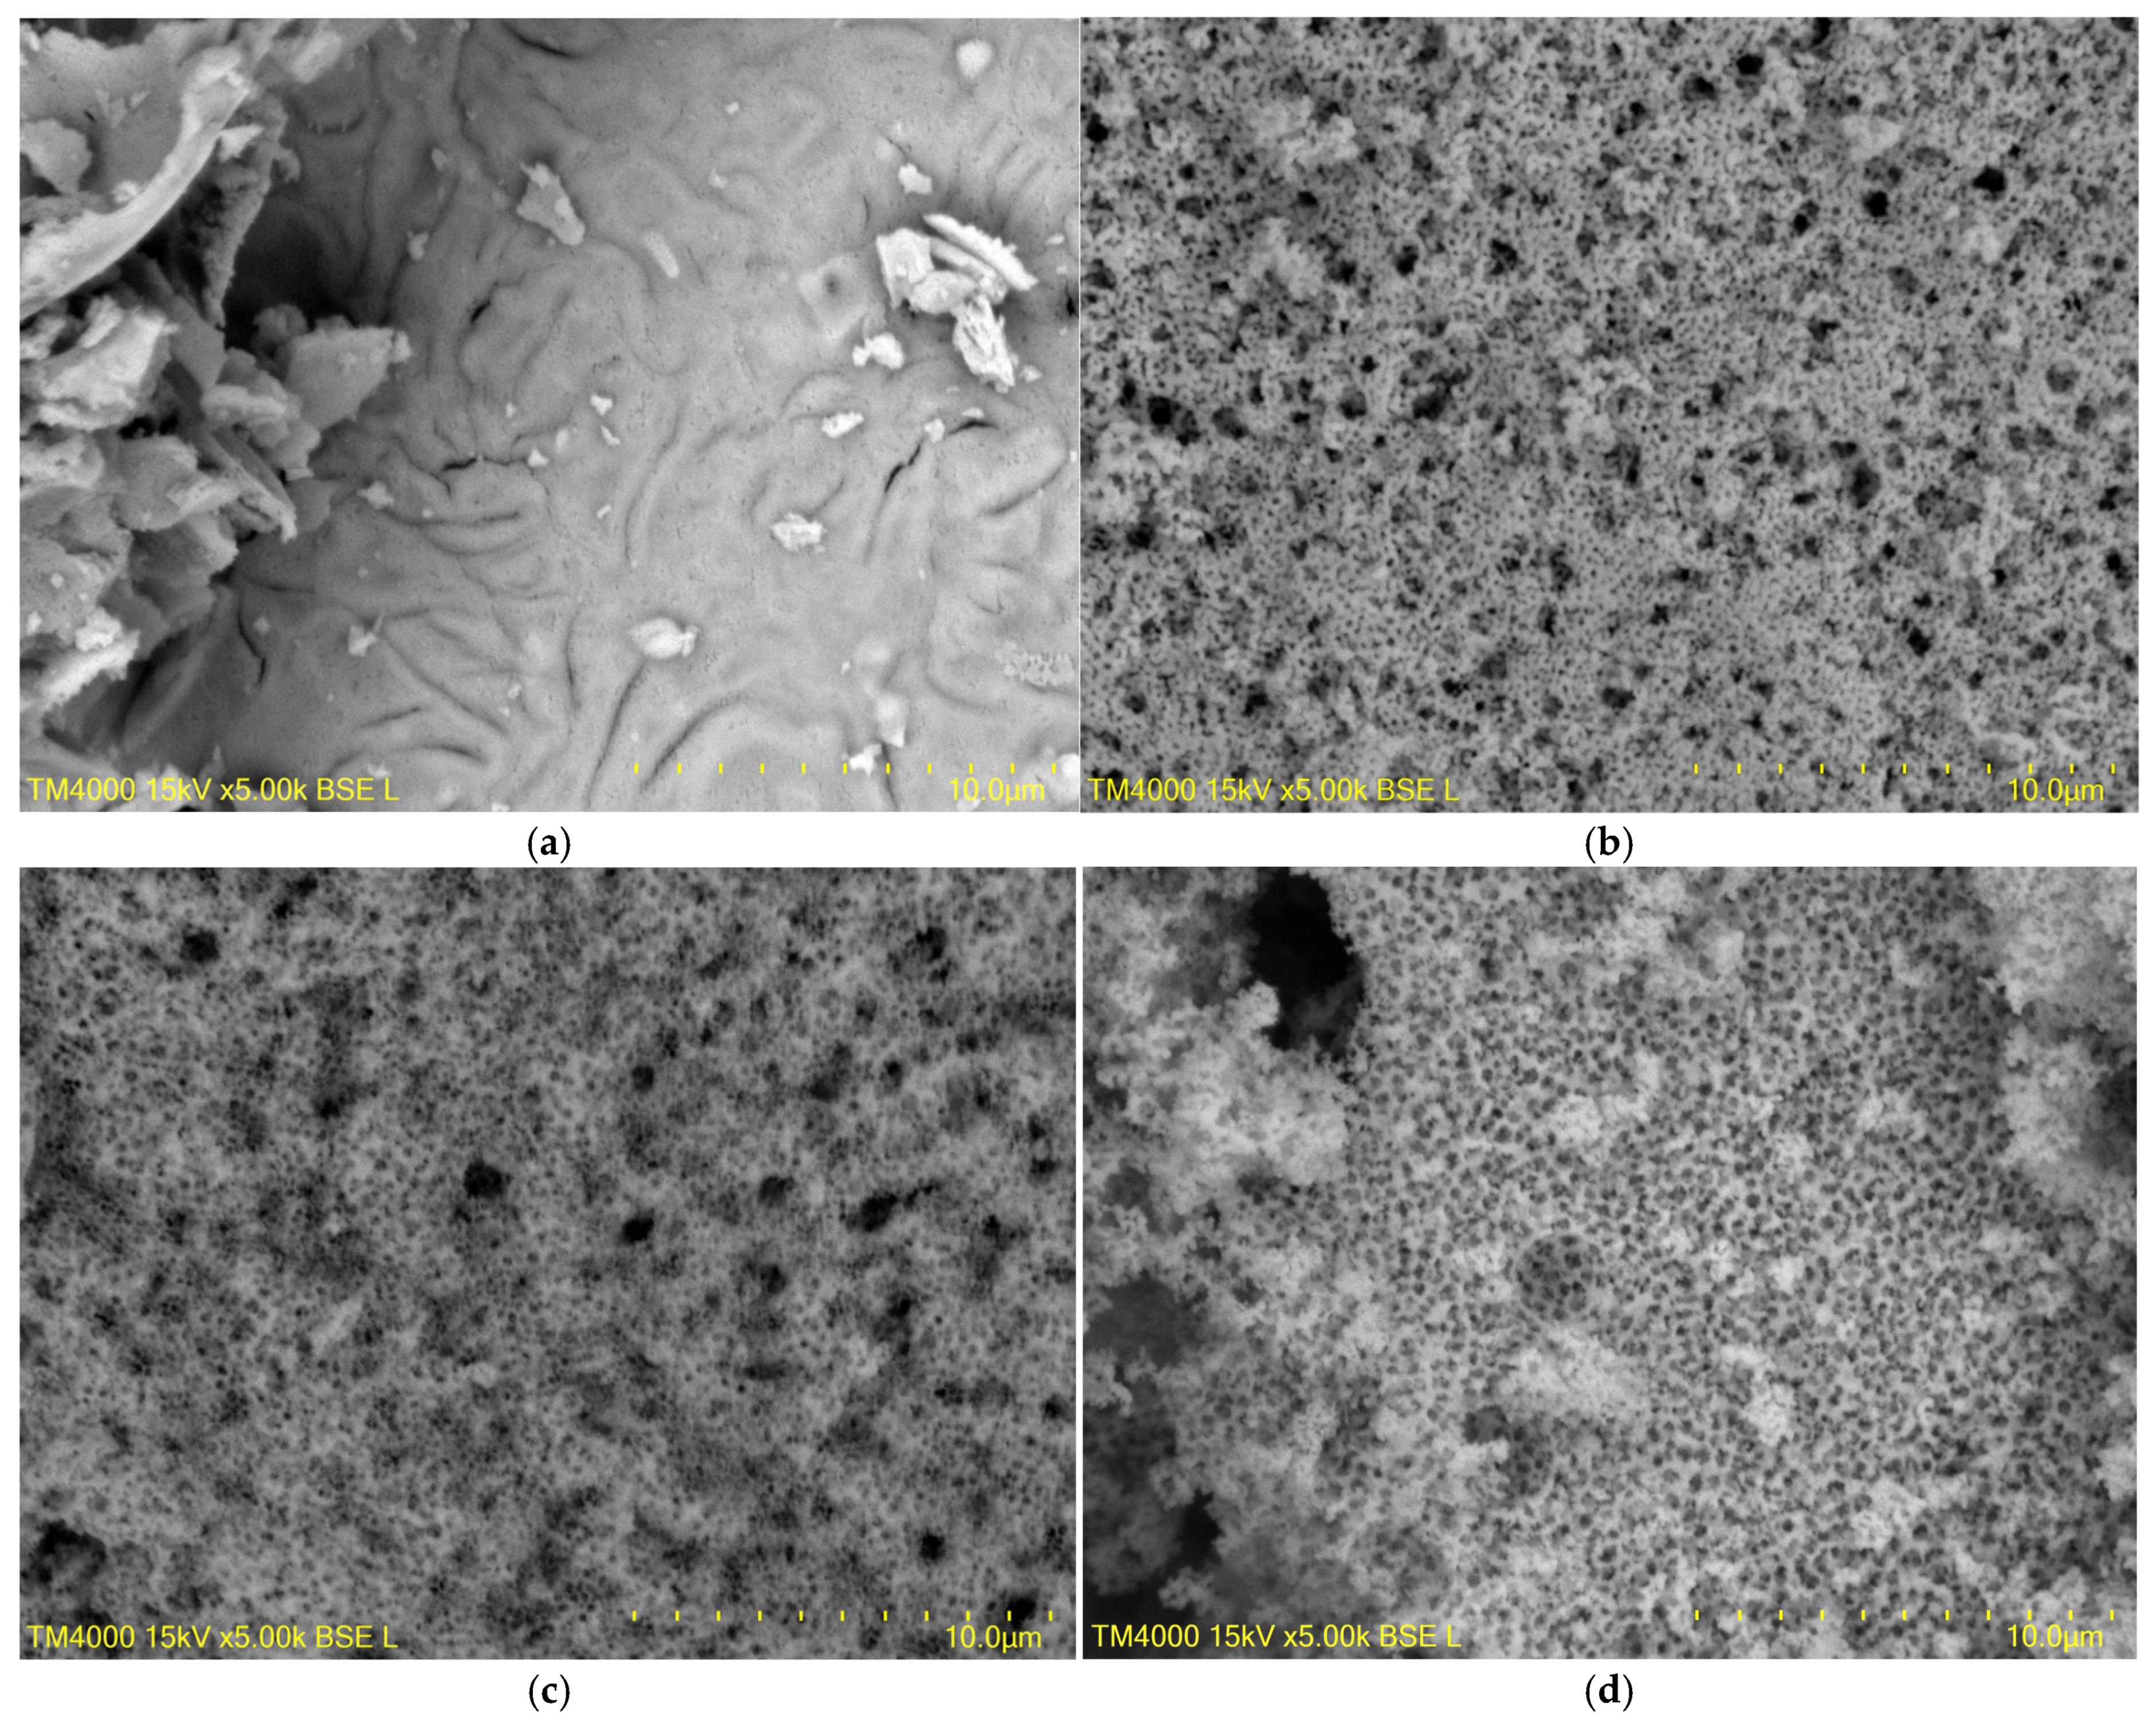
3.1.3. Morphology of Pure LaFeO3 and Macroporous LFO-CS-X

Figure 4 shows SEM images of four samples, i.e., pure LaFeO3 and LFO-CS-X (X = 8, 10, 12) with magnification 5k× (Figure 4). The SEM images of those samples from Figure 4 as well as from Figure S1 (magnification 10k×) show that by adding CS during the synthesis of LaFeO3, well-developed meso- and macro- structures of LFO-CS-X are synthesized. The pore sizes of LFO-CS-X are smaller than the size of the CS used: a shrinking of approx. 30% is observed in comparison to the CS size, which is quite likely due to the crystallization processes at the high-temperature treatment (Figure 4). As can be seen in Figure S1, the sample LFO-CS-6 does not show a macropore structure. The sample LFO-CS-6 was synthesized in the presence of CS-6 with a mean sphere size below 0.400 µm. It appears that CS with a minimum size of 0.400–0.450 µm are needed for CS to successfully function as a hard template for the development of a macroporous pore structure of LFO-CS-X.
TEM images (Figure S2) reveal that in addition to the macroporous structure, which is a result of CS adding, the samples possess a mesoporous structure as well. Quite likely, the mesopore structure is a result of CO2 gas emission when the organic component is burned.

3.1.4. Optical Properties of LaFeO3 and Macroporous LFO-CS-X (LaFeO3 Synthesized in CS Presence)

UV-Vis spectra of the macroporous LFO-CS-X are presented in Figure 5. All samples absorb light in the 300–600 nm region. The differences in color of the as-prepared samples were also easily observed with naked eye. The samples not possessing a macroporous structure, namely LFO and LFO-CS-6, were brown, while the others were orange (Figure S3). The absorption spectra (Figure 5a) show a significant decrease in the absorption in the region 600–800 nm.
The band gap energy was calculated, assuming both direct and indirect types. No significant change in the width of the band gaps was observed for the macroporous LFO-CS-X; the values are in the interval 2.15–2.16 eV, corresponding to the wavelength 573–575 nm for the indirect type of band gap and in the range 2.54–2.57 corresponding to 482–488 nm for the direct type (Table 2). Interestingly, in both cases the band gap energy of the non-porous LFO samples is slightly narrower, which is in a good correlation with the observed color of the materials. Nevertheless, the band gap of all obtained materials is narrow enough for them to be activated under visible-light irradiation. The band edge positions were estimated as well, using the empirical equations [29,30]: EVB = X − E0 + 0.5Eg and ECB = EVB − Eg, where ECB, EVB, and X are as follows: the conduction band (CB) potential, valence band (VB) potential, and the electronegativity of LaFeO3, which is defined as the geometric average of the absolute electronegativity of the constituent atoms. E0 is the energy of the free electrons on the hydrogen scale (about 4.5 eV) [31]. The values for ECB and EVB do not change monotonously, especially those for the valence band energy (Table 2).

3.2. Catalytic Experiments

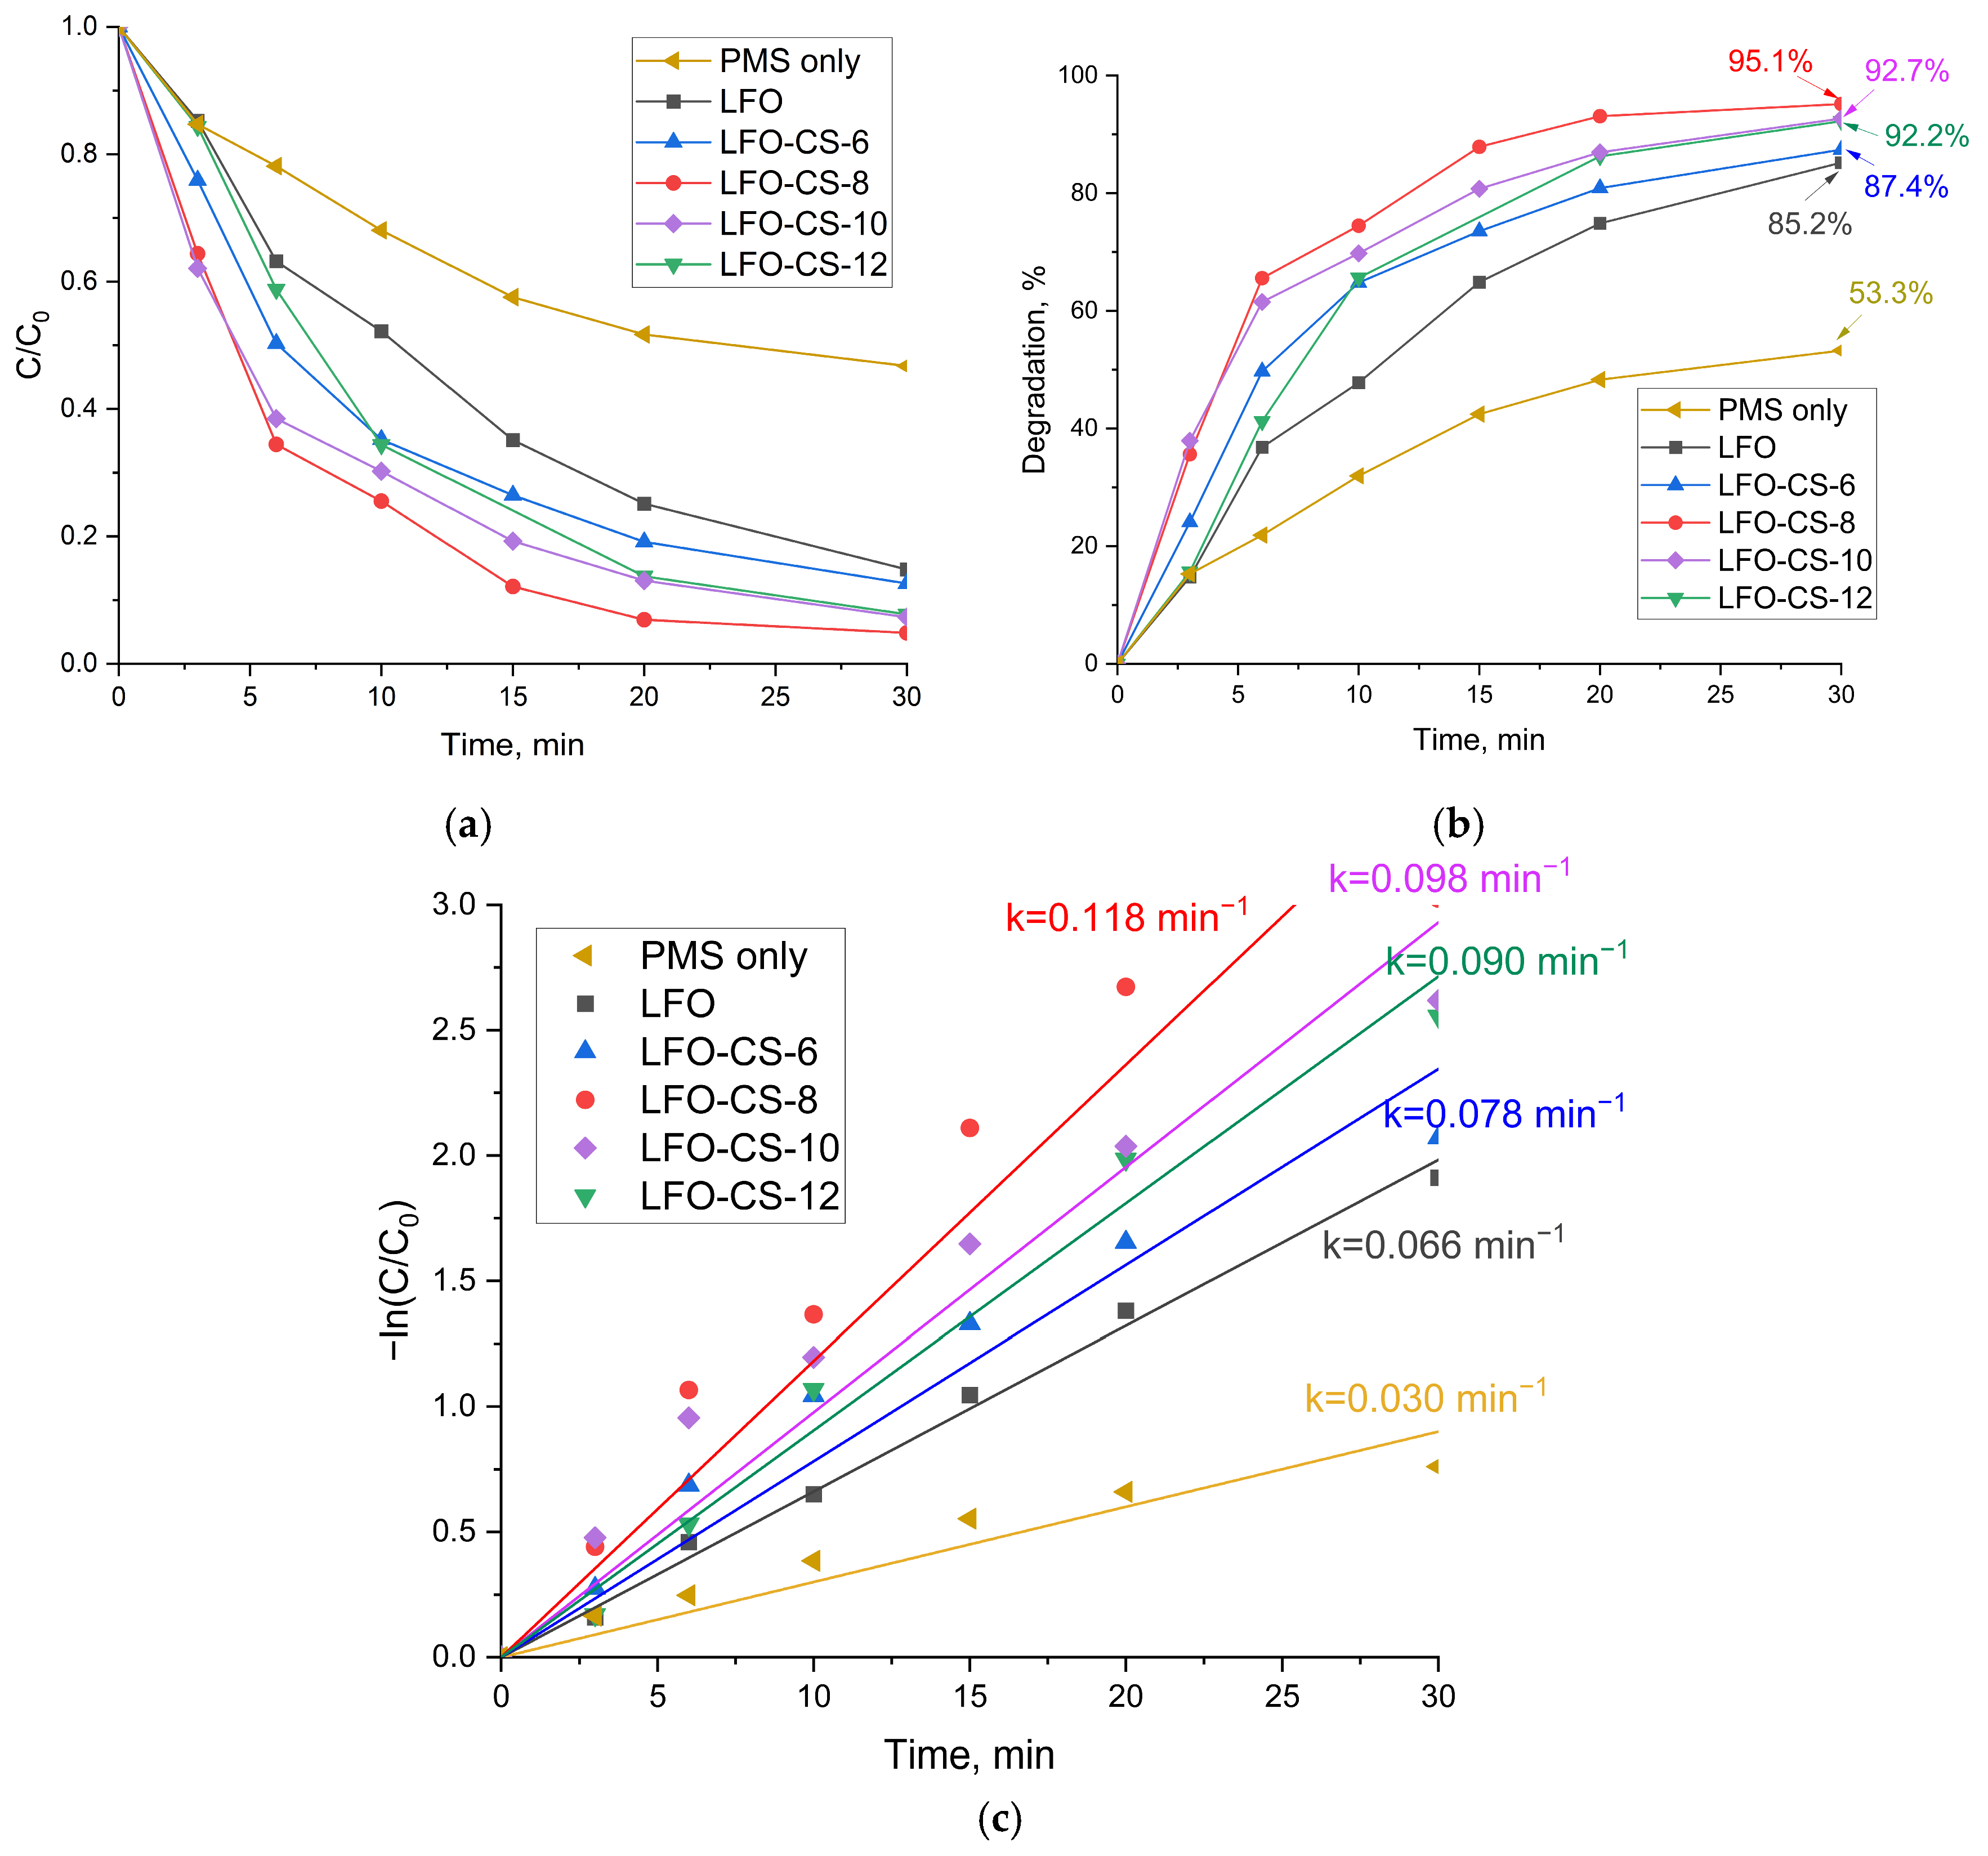
3.2.1. Degradation of the Pollutant TCH Under Visible-Light Irradiation in the Presence of PMS and the Activator LFO-CS-X

The concentration of THC as a function of time in the absence and presence of the catalysts is shown in Figure 6a. In the presence of only peroxymonosulfate PMS, approx. 53% of the antibiotic is oxidized after 30 min (Figure 6b). The degradation increases substantially when the catalysts LFO-CS-X are added to the process: for the most active catalyst LFO-CS-8, approx. 95% degradation is reached. The beneficial effects of the catalysts are even more clear when the rate constants are compared: an increase of approx. four times is observed when the oxidation process with PMS only is compared with that with PMS activated by LFO-CS-8 (Figure 6c). The catalytic process with the pure LaFeO3 as the activator shows a rate constant of 0.066 min−1, whereas the rate constant is 0.090 min−1 with activator LFO-CS-12 and 0.098 min−1 with LFO-CS-10, and the highest value of 0.118 min−1 is with LFO-CS-8 activating PMS.
Tracking the pollutant degradation with UV-Vis spectroscopy does not point to the extent of the organic matter mineralization, and so experiments for determining the total organic carbon in the solutions (before and at the end of the catalytic reaction) were conducted. The degrees of mineralization of TCH in the catalytic reaction are shown in Figure 7. The highest degree of mineralization was observed for TOCr and TNbr (r refers to the total removed carbon, by sorption + catalysis) in the presence of the activator LFO-CS-8: 78 and 71.7%, respectively. The significant degree of mineralization observed, reaching up to 78% for the most active catalyst, is lower than the conversion of TCH determined by UV-Vis spectroscopy. This is an indication of the complex mechanism of the antibiotic oxidation, namely the generation of secondary organic substances that are oxidized slower than TCH itself. Using LC-MS, Wang et al. reported that in the presence of peroxymonosulfate activated by oxygen-doped C3N4, TCH can be degraded to a number of intermediate products through two possible pathways. The toxicity of the possible products were then evaluated, and it was found that all (except one of them) have lower LD50 than TCH [32]. It is important to note that the catalytic conditions that Wang et al. used involve much higher PMS concentrations for their standard experiments ([PMS] = 4 mM, while the catalyst dosage and TCH concentration are like ours) which led to only a 33.9% mineralization as found by TOC. Similar findings were reported in a study by Zhang et al., where the lower toxicity of the products was proven by rice seed germination experiments [33].

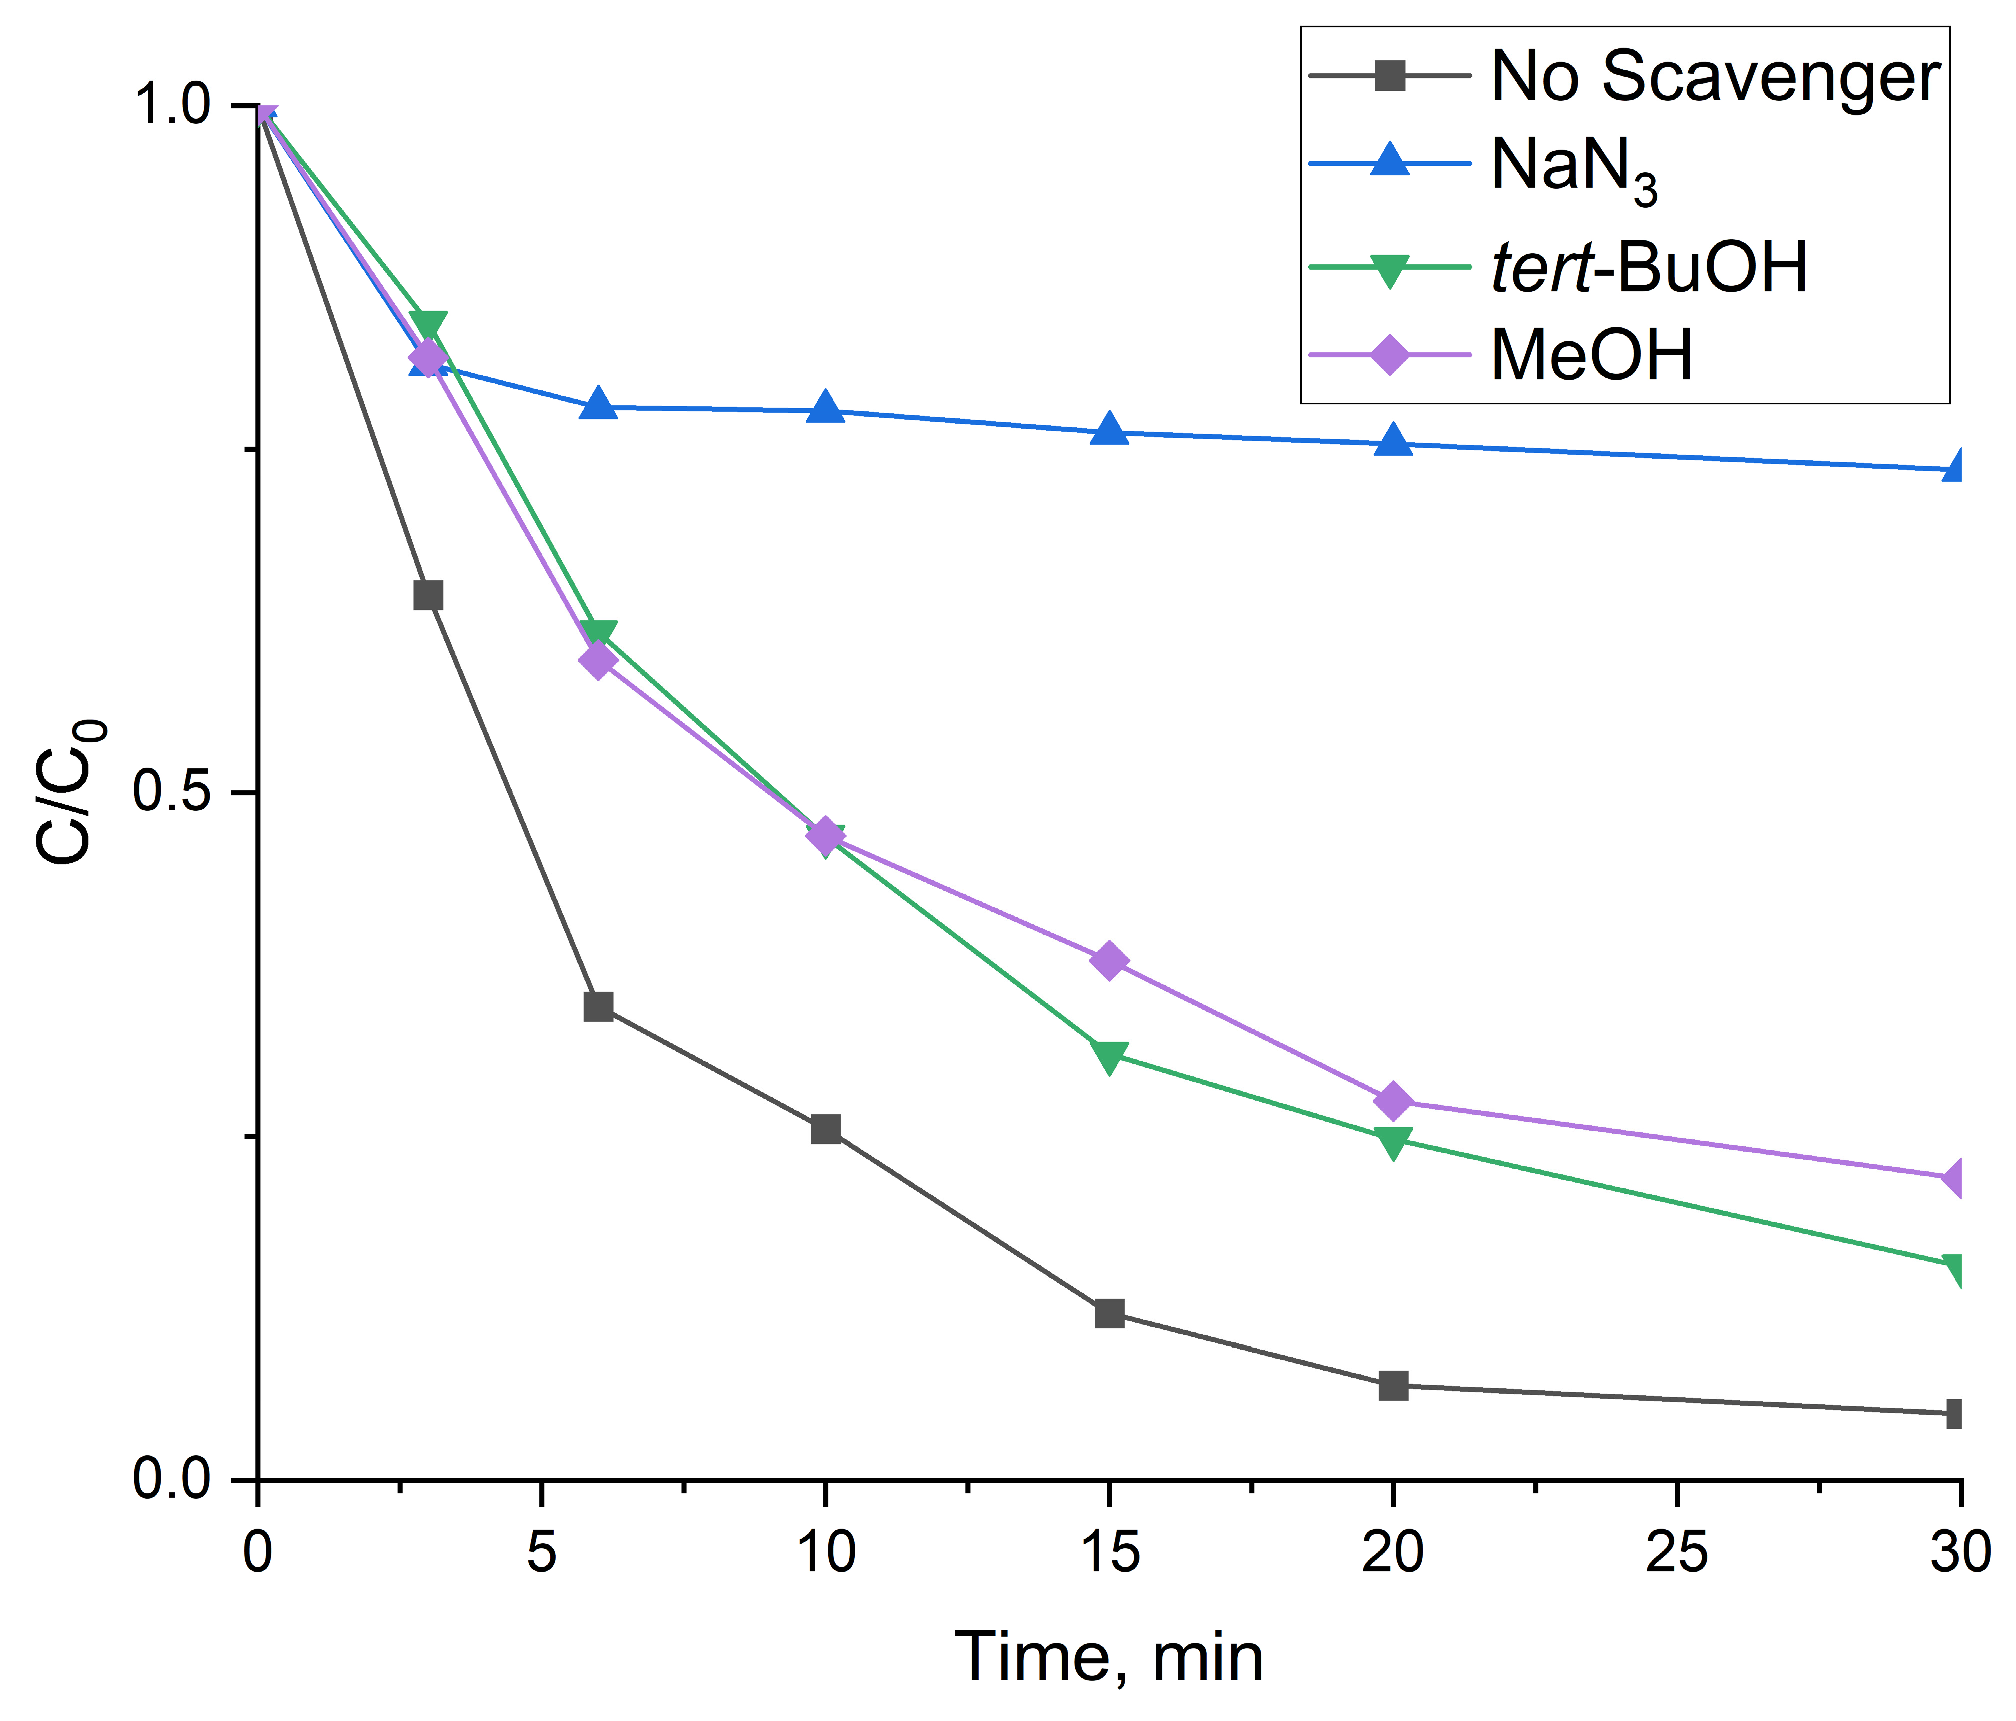
3.2.2. Reaction Mechanism

In order to determine the active radicals during the degradation process and the reaction mechanism, experiments with scavengers were performed. The most active catalyst (LFO-CS-8) was used in all of the experiments, and the experimental conditions were identical to the experiments under visible-light irradiation. The scavengers are considered to react fast and selectively with a certain radical, which by that produces a stable species that does not affect the reaction but is eliminating the effect of the radical in the degradation [34]. Alcohols, such as methanol and tert-butanol (TBA), are applied as hydroxyl radical scavengers, azide ions (N3−) as scavengers for singlet oxygens, even though it is not a radical [35], and ascorbic acids as scavengers for superoxide anion radicals, O2•− [36], in photo-assisted processes. As can be seen in Figure 8, the degradation of TCH is reduced in the presence of sodium azide, from which it can be concluded that the singlet oxygen is the most significant radical involved in the process.
A likely visible-light-assisted PMS activation mechanism is proposed below, showing that Fe ions were involved in the generation of singlet oxygen.
≡Fe2+ + HSO5→Fe3+ + SO4•− + OH
≡Fe3+ + HSO5→Fe2+ + SO5•− + H+
SO4•− + OH → SO42− + OH
SO4•− + H2O → SO42− + OH + H+
HSO5 + SO52- → HSO4 + SO42− + 1O2
SO5•− + 2H2O → 4H+ + 4SO4 + 31O2
The scheme of the mechanism is presented in Figure S4.

3.3. Factors Influencing the Process of the Decomposition of TCH

The effect of the water matrix and the temperature presented below was studied for the degradation of TCH in the system LFO-CS-8/PMS under visible-light irradiation.

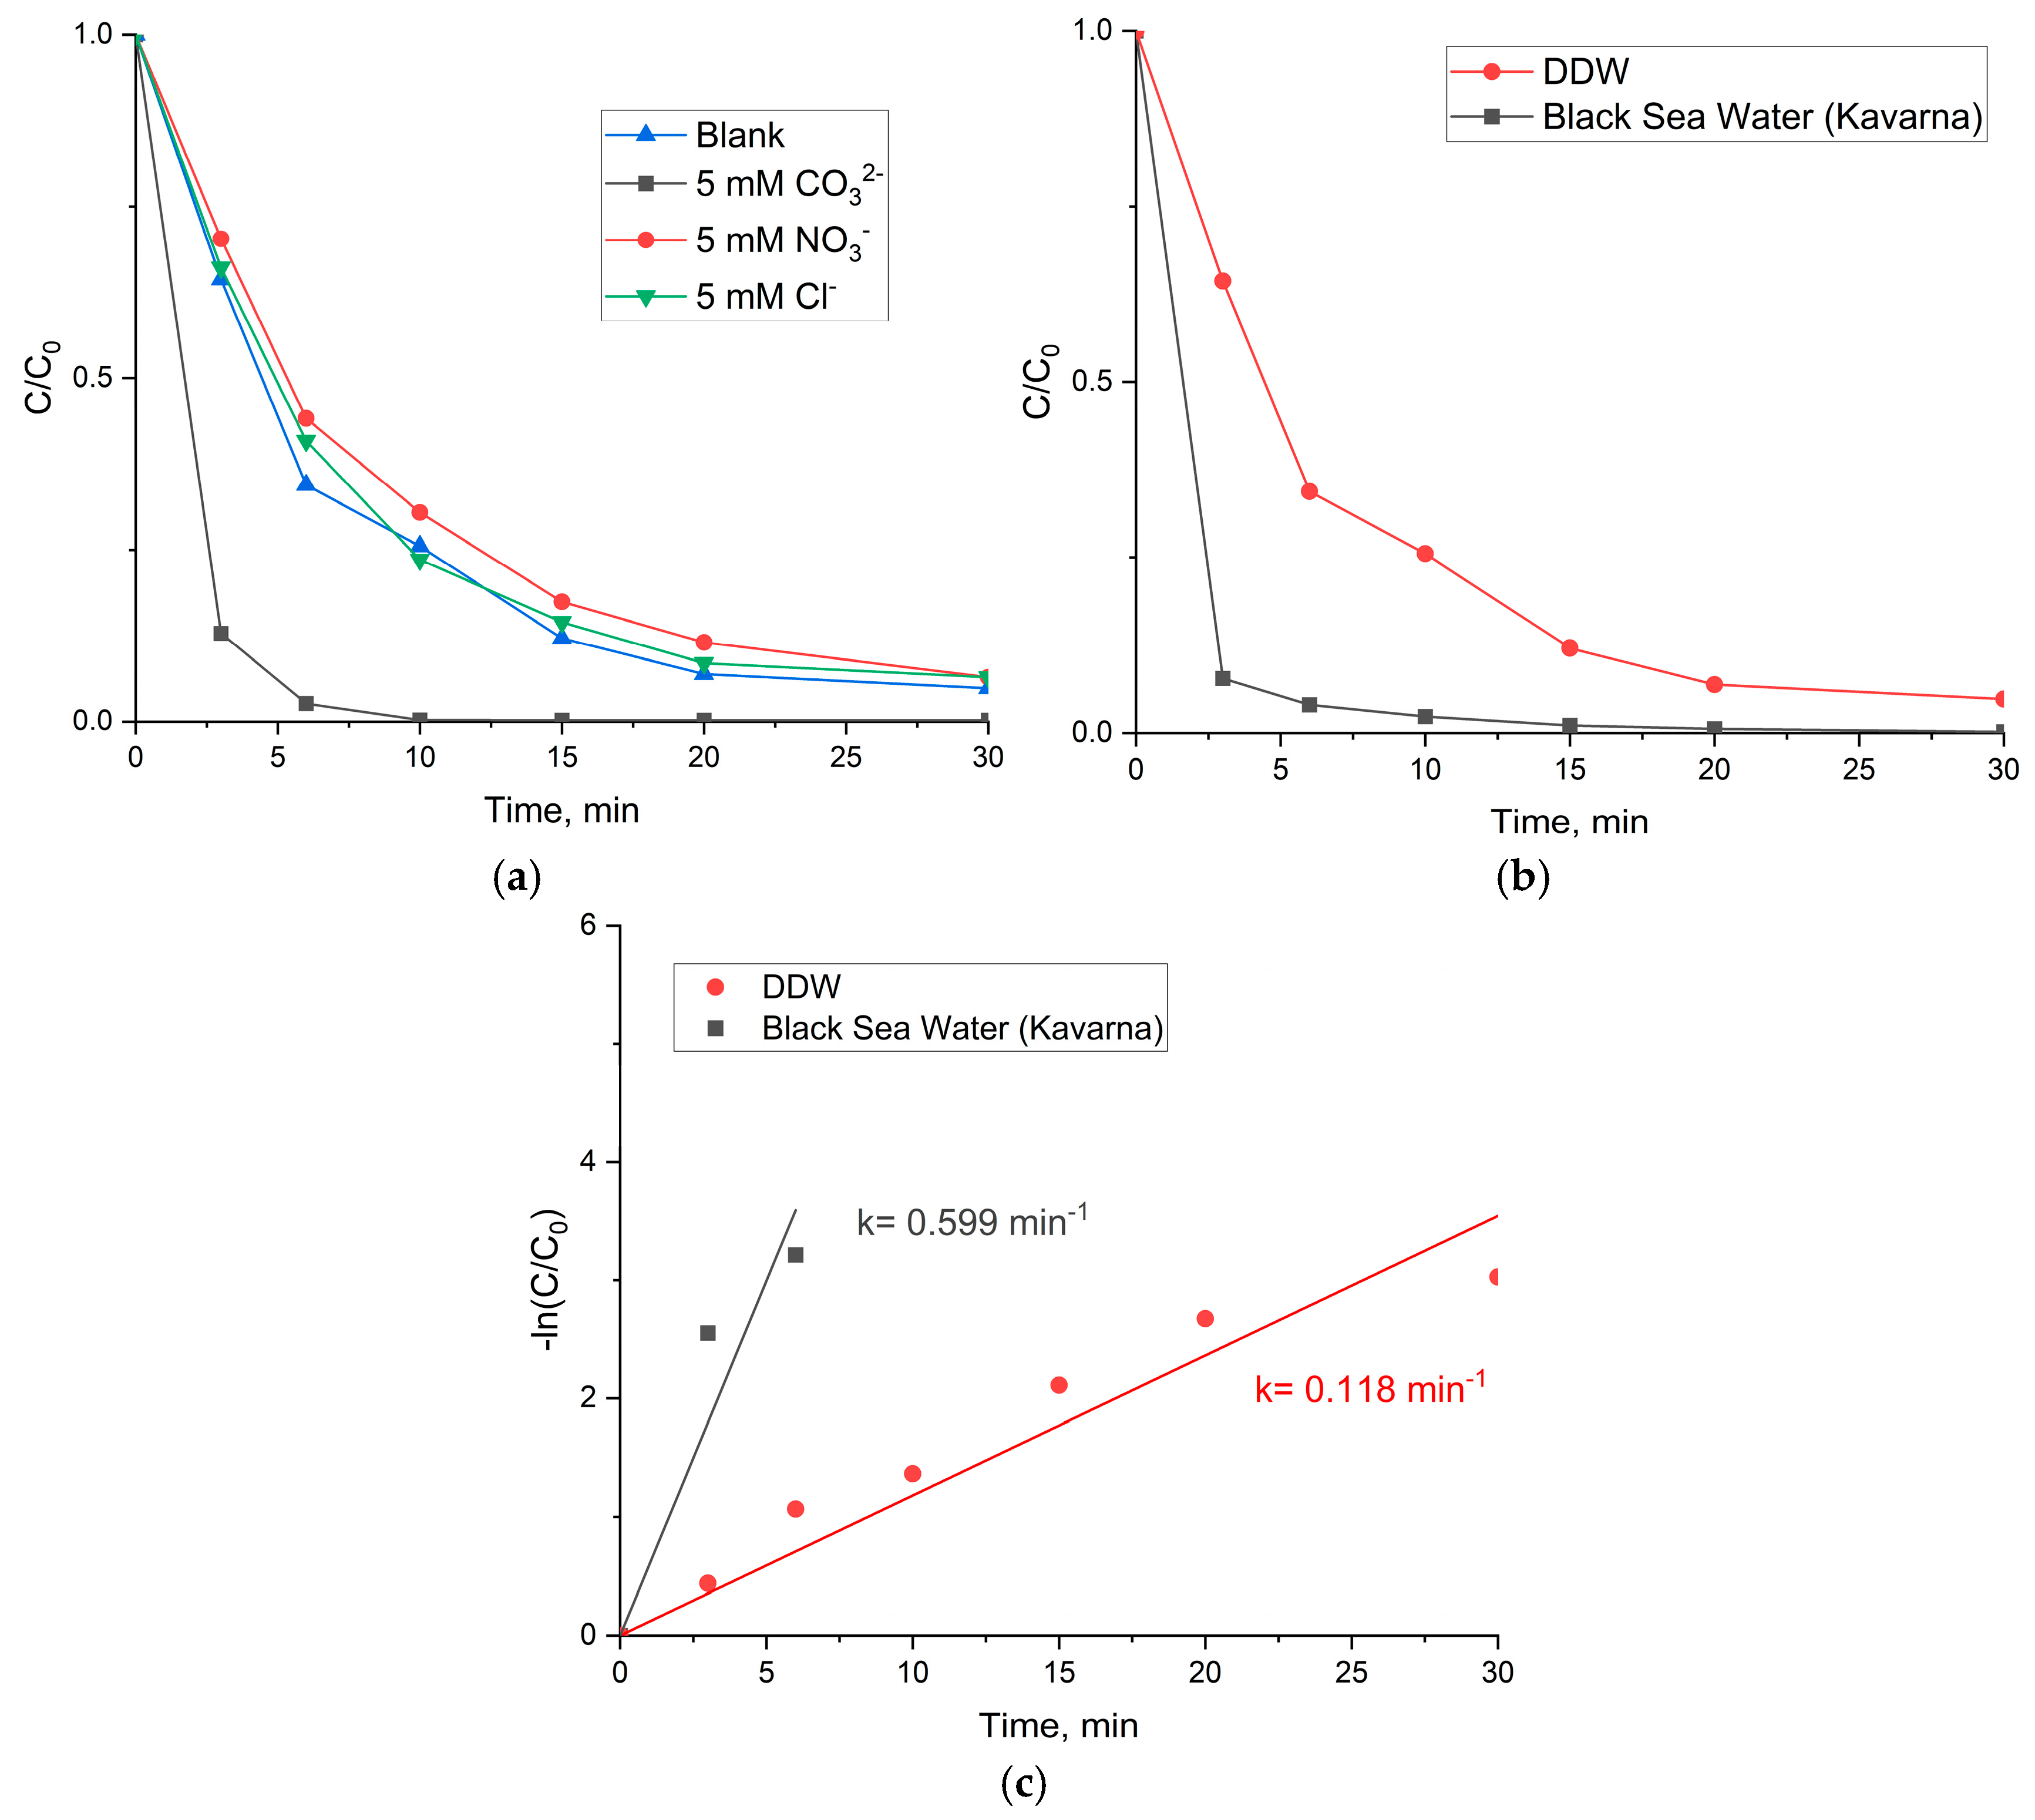
3.3.1. Influence of the Water Matrix

Water samples, containing carbonate, nitrate, and chloride ions, each of them with a concentration of 5 mM, were used for testing as well as Black Sea water (Kavarna region) and double distilled water (DDW). The influence of the water matrix is shown for the kinetic curves in Figure 9. The rate constants of the process show values of 0.599 min−1 for Black Sea water (Kavarna region) and 0.118 min−1 for DDW, showing the positive effect of the ions present in the sea water. The degradation of TCH was completed in 10 min in the presence of the carbonate ions in water. The carbonate ions showed an accelerating effect while the nitrate and chloride ions showed an insignificant effect. Our results confirmed that the different ions have a different effect on degradation activity [37].

3.3.2. Influence of the Kind of Irradiation and of the Application of Ultrasound

The experiments for the degradation of TCH were performed with PMS in the presence of the most effective activator LFO-CS-8, without irradiation in dark, by irradiation with visible (420–700 nm) and UV (365 nm) light, as well as by using ultrasound (32 kHz). The rate constants of the processes are in the range 0.066 (in dark), 0.085 (with ultrasound), 0.087 (under visible light), and 0.095 min−1 (under UV light) (Figure 10). The positive influence of the high-energetic UV light on the degradation of TCH is noticeable. As a difference with the previous discussed experiments (Section 3.2.1), where a 200 mg/L catalyst loading was used, in this part the experiments were performed with a catalyst dose of 120 mg/L in order to slow down the reaction for better comparison. This is the reason for the lower rate constant of 0.087 min−1 under visible light obtained here in comparison with 0.118 min−1 reported in Section 3.2.1 (Figure 6c).

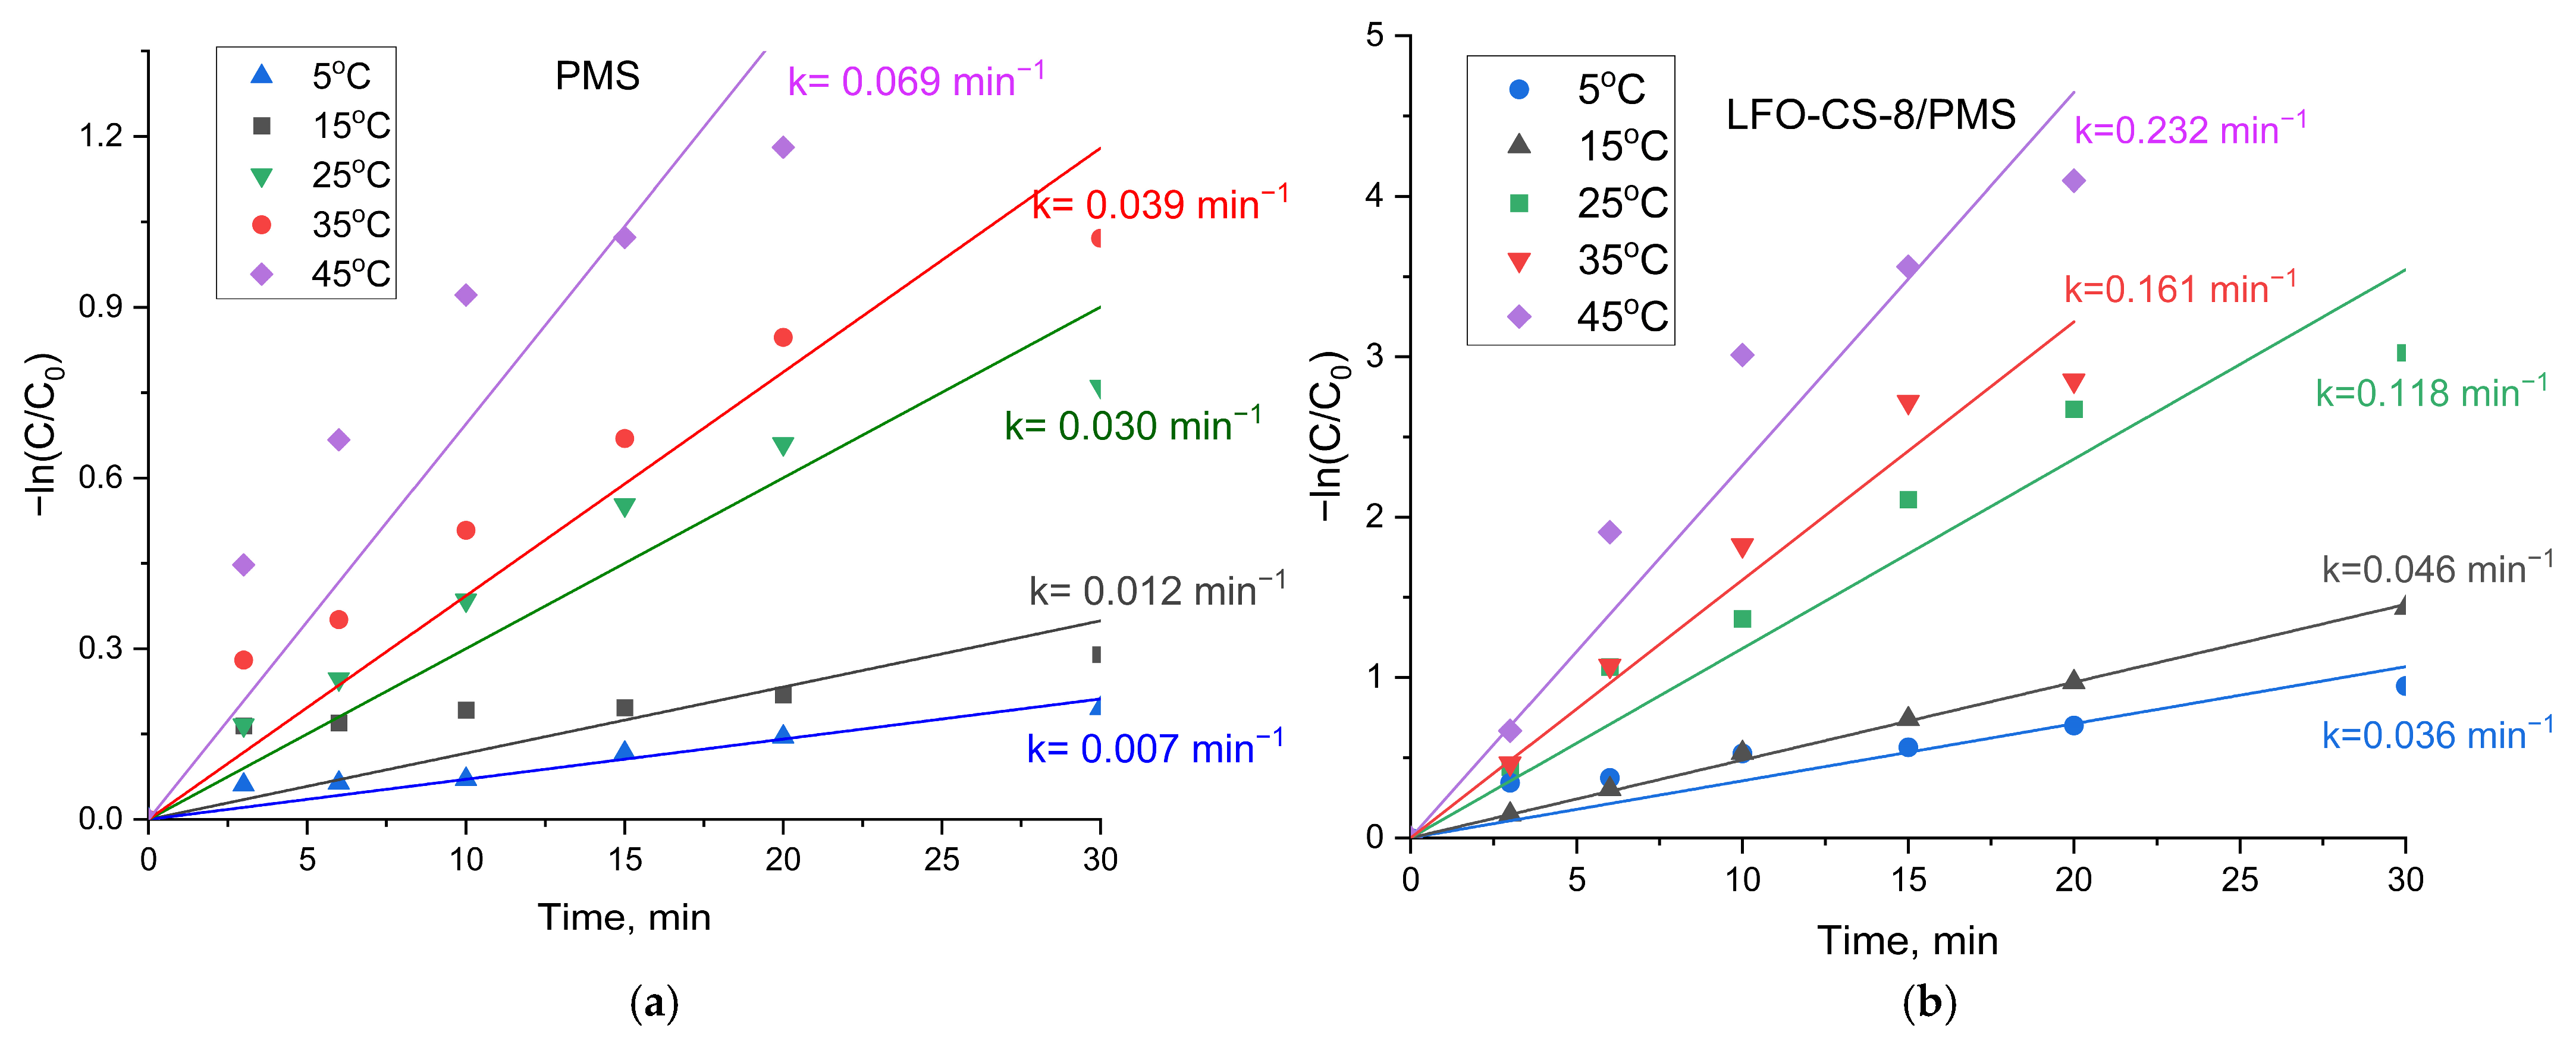
3.3.3. Influence of the Temperature

According to literature data, the typical temperature applied for Fenton-like processes is 25–30 °C [38]. Experiments at higher temperatures, above 40 °C, have been made with the intention to provide more energy to the reaction and accelerate it [39]. Some conclusions point that the specific optimum temperature should be determined experimentally as different catalysts could show different performances for the reaction rate of organic degradation. The effect of the temperature on the catalytic activity was studied by us in experiments at several different temperatures in the interval 5–45 °C with a step of 10 °C (Figure 11). Our results show that the temperature apparently causes a monotonous increase in the rate constant for the oxidation process with PMS only; values between 0.007 and 0.069 min−1 were obtained, with an increase by an order of magnitude between 5 and 45 °C (Figure 11a). The same tendency was observed when LFO-CS-8 was applied for the activation of PMS, but the values of the rate constants obtained were higher, between 0.036 and 0.232 min−1 (Figure 11b). The results proved the significant effect of the temperature on the oxidation capacity of the Fenton-like reagent, particularly on the activation of PMS.
Based on the rate constants at different temperatures, the values for the activation energy were calculated; the Arrhenius plots for activation energy calculation are presented in Figure S4. For the oxidation process of TCH with only PMS, the activation energy was found to be 42.18 kJ/mol, while for the process with both PMS and the activator LFO-CS-8, it was 33.88 kJ/mol. The difference in the values shows the positive role of the catalyst LFO-CS-8 for the degradation of TCH. By the addition of LFO-CS-8, more active radicals were generated under visible-light irradiation, and by that the energy barrier of the catalytic reaction was decreased.

3.4. Recycling of the Catalysts

In order to check the recyclability of our catalysts, experiments were conducted for three consecutive runs. After each catalytic experiment, the catalyst was vacuum-filtered through a MCE membrane filter (pore size 0.22 μm, FiltraTech, Saint-Jean-de-Braye, France), washed several times with ultrapure water and ethanol, and dried at 80 °C. The recycling experiments included three cycles with the most active catalyst, LFO-CS-8. The catalyst proved to be efficient and recyclable. The reusability study showed an 89% degradation of the TCH after three cycles, indicating the good reusability of the catalyst. The rate constants changed from 0.118 min−1 for the first run to 0.075 min−1 after the third run, i.e., a decrease between the 1st and 3rd cycle was noticed (Figure 12).

4. Conclusions

A series of LaFeO3-type macroporous catalysts LFO-CS-X were successfully synthesized using carbon microspheres as a hard template. The resulting materials exhibit improved catalytic activity for the activation of peroxymonosulfate in the catalytic degradation of the antibiotic TCH in water under visible-light irradiation. Through a series of experiments with quencher molecules, the mechanism of the reaction, which proceeds with a dominant non-radical oxidation with the participation of singlet oxygen, was established. The influence of a number of parameters on the catalytic reaction such as the influence of the water matrix, light irradiation, and temperature was observed. The positive effect of the ions present in the sea water was detected, particularly the presence of carbonate anions in the water matrix, which caused a twofold increase in the catalytic oxidation of tetracycline; a synergistic effect was suggested. The significant effect of the presence of the macroporous LaFeO3, during increasing temperatures in the interval 5–45 °C, on the activation of PMS was observed, including the decrease in the activation energy. The generation of more active radicals under visible-light irradiation is suggested; the latter causes a decrease in the energy barrier of the catalytic reaction. The catalysts are recyclable with a slight decreasing of the rate constants between the first and third cycle.

Supplementary Materials

The following supporting information can be downloaded at https://www.mdpi.com/article/10.3390/cryst15050394/s1, Figure S1: SEM images of pure LaFeO3 and LFO-CS –X (X = 12, 10, 8, 6); Figure S2: TEM images of (a) LFO and (b) LFO-CS-6; Figure S3: Photographs of (a) LFO and (b) LFO-CS-12; Figure S4: Arrhenius plot: the activation energy of the catalytic process of TCH degradation under visible light: (a) with PMS and (b) with PMS and the activator LFO-CS-8. Figure S5: Proposed reaction mechanism for the photo-assisted activation of PMS over LFO-CS-8.

Author Contributions

Conceptualization, M.T. and E.E.; methodology, M.T.; software, M.T.; validation, M.T. and E.E.; formal analysis, S.K. and E.E.; investigation, S.K. and E.E.; resources, M.T.; data curation, E.E.; writing—original draft preparation, M.T. and M.M.; writing—review and editing, M.T. and M.M.; supervision, M.T.; project administration, M.T.; funding acquisition, M.T. All authors have read and agreed to the published version of the manuscript.

Funding

This research received funding by the European Union-Next Generation EU through the National Recovery and Resilience Plan of the Republic of Bulgaria, Project SUMMIT BG-RRP-2.004-0008-C01 (Grant No. 70-123-486).

Data Availability Statement

The original data of this study is included in the article. Further inquiries can be directed at the corresponding author.

Acknowledgments

The support of Project BG05M2OP001-1.002-0019, “Clean technologies for a sustainable environment—waters, wastes, energy for a circular economy”, as well as by the European Union-Next Generation EU through the National Recovery and Resilience Plan of the Republic of Bulgaria, Project SUMMIT BG-RRP-2.004-0008-C01, is highly appreciated.

Conflicts of Interest

The authors declare no conflicts of interest.

References

  1. Zhang, Y.; Liu, Y.; Liu, W.; Li, X.; Mao, L. Synthesis of Honeycomb-like Mesoporous Nitrogen-Doped Carbon Nanospheres as Pt Catalyst Supports for Methanol Oxidation in Alkaline Media. Appl. Surf. Sci. 2017, 407, 64–71. [Google Scholar] [CrossRef]
  2. Zhao, X.; Li, W.; Kong, F.; Chen, H.; Wang, Z.; Liu, S.; Jin, C. Carbon Spheres Derived from Biomass Residue via Ultrasonic Spray Pyrolysis for Supercapacitors. Mater. Chem. Phys. 2018, 219, 461–467. [Google Scholar] [CrossRef]
  3. Roberts, A.D.; Li, X.; Zhang, H. Porous Carbon Spheres and Monoliths: Morphology Control, Pore Size Tuning and Their Applications as Li-Ion Battery Anode Materials. Chem. Soc. Rev. 2014, 43, 4341–4356. [Google Scholar] [CrossRef] [PubMed]
  4. Zarezadeh Mehrizi, M.; Abdi, J.; Rezakazemi, M.; Salehi, E. A Review on Recent Advances in Hollow Spheres for Hydrogen Storage. Int. J. Hydrogen Energy 2020, 45, 17583–17604. [Google Scholar] [CrossRef]
  5. Deshmukh, A.A.; Mhlanga, S.D.; Coville, N.J. Carbon Spheres. Mater. Sci. Eng. R Rep. 2010, 70, 1–28. [Google Scholar] [CrossRef]
  6. Panickar, R.; Sobhan, C.B.; Chakravorti, S. Chemical Vapor Deposition Synthesis of Carbon Spheres: Effects of Temperature and Hydrogen. Vacuum 2020, 172, 109108. [Google Scholar] [CrossRef]
  7. Kumar, R.; Singh, R.K.; Dubey, P.K.; Yadav, R.M.; Singh, D.P.; Tiwari, R.S.; Srivastava, O.N. Highly Zone-Dependent Synthesis of Different Carbon Nanostructures Using Plasma-Enhanced Arc Discharge Technique. J. Nanopart. Res. 2015, 17, 24. [Google Scholar] [CrossRef]
  8. Ganash, E.A.; Al-Jabarti, G.A.; Altuwirqi, R.M. The Synthesis of Carbon-Based Nanomaterials by Pulsed Laser Ablation in Water. Mater. Res. Express 2020, 7, 015002. [Google Scholar] [CrossRef]
  9. Sanchez-Sanchez, A.; Braghiroli, F.L.; Izquierdo, M.T.; Parmentier, J.; Celzard, A.; Fierro, V. Synthesis and Properties of Carbon Microspheres Based on Tannin–Sucrose Mixtures Treated in Hydrothermal Conditions. Ind. Crops Prod. 2020, 154, 112564. [Google Scholar] [CrossRef]
  10. Falco, C.; Baccile, N.; Titirici, M.-M. Morphological and Structural Differences between Glucose, Cellulose and Lignocellulosic Biomass Derived Hydrothermal Carbons. Green Chem. 2011, 13, 3273. [Google Scholar] [CrossRef]
  11. Titirici, M.-M.; Antonietti, M. Chemistry and Materials Options of Sustainable Carbon Materials Made by Hydrothermal Carbonization. Chem. Soc. Rev. 2010, 39, 103–116. [Google Scholar] [CrossRef] [PubMed]
  12. Li, R.; Wang, L.; Shahbazi, A. A Review of Hydrothermal Carbonization of Carbohydrates for Carbon Spheres Preparation. Trends Renew. Energy 2015, 1, 43–56. [Google Scholar] [CrossRef]
  13. Tooming, T.; Thomberg, T.; Romann, T.; Palm, R.; Jänes, A.; Lust, E. Carbon Materials for Supercapacitor Application by Hydrothermal Carbonization of D-Glucose. IOP Conf. Ser. Mater. Sci. Eng. 2013, 49, 012020. [Google Scholar] [CrossRef]
  14. Hu, Y.; Zhou, Y.; Wang, J.; Shao, Z. Preparation and Characterization of Macroporous LiNi1/3Co1/3Mn1/3O2 Using Carbon Sphere as Template. Mater. Chem. Phys. 2011, 129, 296–300. [Google Scholar] [CrossRef]
  15. Chen, G.; Song, G.; Zhao, W.; Gao, D.; Wei, Y.; Li, C. Carbon Sphere-Assisted Solution Combustion Synthesis of Porous/Hollow Structured CeO2-MnOx Catalysts. Chem. Eng. J. 2018, 352, 64–70. [Google Scholar] [CrossRef]
  16. Wang, Y.; Yu, L.; Wang, R.; Wang, Y.; Zhang, X. Reactivity of Carbon Spheres Templated Ce/LaCo0.5Cu0.5O3 in the Microwave Induced H2O2 Catalytic Degradation of Salicylic Acid: Characterization, Kinetic and Mechanism Studies. J. Colloid Interface Sci. 2020, 574, 74–86. [Google Scholar] [CrossRef]
  17. Humayun, M.; Ullah, H.; Usman, M.; Habibi-Yangjeh, A.; Tahir, A.A.; Wang, C.; Luo, W. Perovskite-Type Lanthanum Ferrite Based Photocatalysts: Preparation, Properties, and Applications. J. Energy Chem. 2022, 66, 314–338. [Google Scholar] [CrossRef]
  18. Andoulsi, R.; Horchani-Naifer, K.; Férid, M. Preparation of Lanthanum Ferrite Powder at Low Temperature. Cerâmica 2012, 58, 126–130. [Google Scholar] [CrossRef]
  19. Bhargav, K.K.; Ram, S.; Majumder, S.B. Physics of the Multi-Functionality of Lanthanum Ferrite Ceramics. J. Appl. Phys. 2014, 115, 204109. [Google Scholar] [CrossRef]
  20. Tsvetkov, M.; Encheva, E.; Petrova, S.; Spassova, I.; Milanova, M. Mechanochemically Synthesized Solid Solutions La1−xCexFeO3+x/2 for Activation of Peroxydisulfate in Catalytical Reaction for Tetracycline Degradation. Crystals 2023, 13, 769. [Google Scholar] [CrossRef]
  21. Hao, L.; Guo, C.; Hu, Z.; Guo, R.; Liu, X.; Liu, C.; Tian, Y. Single–Atom Catalysts Based on Fenton-like/Peroxymonosulfate System for Water Purification: Design and Synthesis Principle, Performance Regulation and Catalytic Mechanism. Nanoscale 2022, 14, 13861–13889. [Google Scholar] [CrossRef]
  22. Liu, J.; Zhou, B.; Zhang, H.; Ma, J.; Mu, B.; Zhang, W. A Novel Biochar Modified by Chitosan-Fe/S for Tetracycline Adsorption and Studies on Site Energy Distribution. Bioresour. Technol. 2019, 294, 122152. [Google Scholar] [CrossRef] [PubMed]
  23. Danner, M.-C.; Robertson, A.; Behrends, V.; Reiss, J. Antibiotic Pollution in Surface Fresh Waters: Occurrence and Effects. Sci. Total Environ. 2019, 664, 793–804. [Google Scholar] [CrossRef] [PubMed]
  24. Xiong, H.; Dong, S.; Zhang, J.; Zhou, D.; Rittmann, B.E. Roles of an Easily Biodegradable Co-Substrate in Enhancing Tetracycline Treatment in an Intimately Coupled Photocatalytic-Biological Reactor. Water Res. 2018, 136, 75–83. [Google Scholar] [CrossRef]
  25. Xiong, H.; Zou, D.; Zhou, D.; Dong, S.; Wang, J.; Rittmann, B.E. Enhancing Degradation and Mineralization of Tetracycline Using Intimately Coupled Photocatalysis and Biodegradation (ICPB). Chem. Eng. J. 2017, 316, 7–14. [Google Scholar] [CrossRef]
  26. Rodríguez-Carvajal, J. Recent Advances in Magnetic Structure Determination by Neutron Powder Diffraction. Phys. B Condens. Matter. 1993, 192, 55–69. [Google Scholar] [CrossRef]
  27. Datt, G.; Raja, M.M.; Abhyankar, A.C. Steering of Magnetic Interactions in Ni0.5Zn0.5Fe2–x(Mn)xO4 Nanoferrites via Substitution-Induced Cationic Redistribution. J. Phys. Chem. C 2021, 125, 10693–10707. [Google Scholar] [CrossRef]
  28. Tauc, J.; Grigorovici, R.; Vancu, A. Optical Properties and Electronic Structure of Amorphous Germanium. Phys. Status Solidi (B) 1966, 15, 627–637. [Google Scholar] [CrossRef]
  29. Hernández-Laverde, M.; Morante, N.; Gutiérrez, B.L.; Murcia, J.J.; Monzillo, K.; Sannino, D.; Vaiano, V. Solar Light Elimination of Bacteria, Yeast and Organic Pollutants by Effective Photocatalysts Based on Ag/Cr-TiO2 and Pd/Cr-TiO2. Nanomaterials 2024, 14, 1730. [Google Scholar] [CrossRef]
  30. Butler, M.A.; Ginley, D.S. Prediction of Flatband Potentials at Semiconductor-Electrolyte Interfaces from Atomic Electronegativities. J. Electrochem. Soc. 1978, 125, 228–232. [Google Scholar] [CrossRef]
  31. Peng, J.; Xu, J.; Wang, Z.; Ding, Z.; Wang, S. Developing an Efficient NiCo2S4 Cocatalyst for Improving the Visible Light H2 Evolution Performance of CdS Nanoparticles. Phys. Chem. Chem. Phys. 2017, 19, 25919–25926. [Google Scholar] [CrossRef]
  32. Wang, L.; Li, R.; Zhang, Y.; Gao, Y.; Xiao, X.; Zhang, Z.; Chen, T.; Zhao, Y. Tetracycline Degradation Mechanism of Peroxymonosulfate Activated by Oxygen-Doped Carbon Nitride. RSC Adv. 2023, 13, 6368–6377. [Google Scholar] [CrossRef]
  33. Zhang, Q.; Yu, M.; Liu, H.; Tang, J.; Yu, X.; Wu, H.; Jin, L.; Sun, J. Efficient Degradation of Tetracycline by Peroxymonosulfate Activated with Ni-Co Bimetallic Oxide Derived from Bimetallic Oxalate. Toxics 2024, 12, 816. [Google Scholar] [CrossRef]
  34. Schneider, J.T.; Firak, D.S.; Ribeiro, R.R.; Peralta-Zamora, P. Use of Scavenger Agents in Heterogeneous Photocatalysis: Truths, Half-Truths, and Misinterpretations. Phys. Chem. Chem. Phys. 2020, 22, 15723–15733. [Google Scholar] [CrossRef] [PubMed]
  35. Rodríguez, E.M.; Márquez, G.; Tena, M.; Álvarez, P.M.; Beltrán, F.J. Determination of Main Species Involved in the First Steps of TiO2 Photocatalytic Degradation of Organics with the Use of Scavengers: The Case of Ofloxacin. Appl. Catal. B 2015, 178, 44–53. [Google Scholar] [CrossRef]
  36. Nimse, S.B.; Pal, D. Free Radicals, Natural Antioxidants, and Their Reaction Mechanisms. RSC Adv. 2015, 5, 27986–28006. [Google Scholar] [CrossRef]
  37. Hu, L.; Wang, P.; Zhang, G.; Liu, G.; Li, Y.; Shen, T.; Crittenden, J.C. Enhanced Persulfate Oxidation of Organic Pollutants and Removal of Total Organic Carbons Using Natural Magnetite and Microwave Irradiation. Chem. Eng. J. 2020, 383, 123140. [Google Scholar] [CrossRef]
  38. Wang, N.; Zheng, T.; Zhang, G.; Wang, P. A Review on Fenton-like Processes for Organic Wastewater Treatment. J. Environ. Chem. Eng. 2016, 4, 762–787. [Google Scholar] [CrossRef]
  39. Zazo, J.A.; Pliego, G.; Blasco, S.; Casas, J.A.; Rodriguez, J.J. Intensification of the Fenton Process by Increasing the Temperature. Ind. Eng. Chem. Res. 2011, 50, 866–870. [Google Scholar] [CrossRef]
Figure 1. (a). Scheme of the synthesis of carbon microspheres CS-X. (b). Scheme of the synthesis of macroporous LaFeO3 (LFO-CS-X).
Crystals 15 00394 g001
Figure 2. SEM images of the obtained carbon microspheres and their particle size distribution as insets: (a) CS-6h, (b) CS-8h, (c) CS-10h, (d) CS-12h.
Crystals 15 00394 g002
Figure 3. Powder diffractograms of pure LaFeO3 and LFO-CS-X (LaFeO3 obtained in presence of CS) from bottom to top. For comparison, LaFeO3 diffractogram by COD #00-152-6450 is included (see the legend).
Crystals 15 00394 g003
Figure 4. SEM images of (a) pure LaFeO3, magnification 5000×; (b) LFO-CS-8; (c) LFO-CS-10; and (d) LFO-CS-12 (all three with magnification 10,000×).
Crystals 15 00394 g004
Figure 5. (a) Absorption spectra and calculated band gaps of the LaFeO3 and LFO-CS-X samples assuming (b) indirect and (c) direct band gaps.
Crystals 15 00394 g005
Figure 6. (a) Kinetic curves of the catalytic oxidation of TCH by PMS, by LFO/PMS, and by LFO-CS-X/PMS under visible light; (b) degradation of TCH, %, by PMS, and by LFO/PMS and LFO-CS-X/PMS; (c) rate constants of the oxidation processes (according the legend).
Crystals 15 00394 g006
Figure 7. Degree of mineralization in the presence of LFO-CS-X/PMS under visible-light irradiation: (a) TOC and (b) TNb removal. The used subscripts s, cat, r refers to the carbon removed by sorption by catalysis and total carbon removed by sorption + catalysis.
Crystals 15 00394 g007
Figure 8. Efficiency of the radical scavengers.
Crystals 15 00394 g008
Figure 9. Kinetic curves of the process for degradation of TCH by LFO-CS-X/PMS under visible-light irradiation: (a) in the presence of different ions, (b) in the presence of different waters, and (c) the rate constants for degradation of TCH in LFO-CS-X/PMS under visible-light irradiation in the presence of different waters.
Crystals 15 00394 g009
Figure 10. (a) Kinetic curves of the degradation of TCH at different irradiations in the presence of the most effective LFO-CS-8 activator and PMS and (b) semi-logarithmic dependence with the values of the rate constants.
Crystals 15 00394 g010
Figure 11. Effect of temperature on the catalytic process (a) with only peroxymonosulfate and PMS and (b) with LFO-CS-8 for PMS activation under visible light.
Crystals 15 00394 g011
Figure 12. Kinetic curves of a recycled catalyst for three cycles.
Crystals 15 00394 g012
Table 1. Unit cell parameters, crystallite size, and microstrain of pure LaFeO3 and LFO-CS-X (LaFeO3, synthesized in presence of CS).
SampleUnit Cell Parameters,
Å
Crystallites Size,
nm
Microstrains,
× 10−3 a.u.
Rwp, %χ2
LaFeO3a = 5.5608(1)
b = 5.5653(1)
c = 7.8614(1)
88.5 ± 1.50.00166.822.13
LFO-CS-6a = 5.5608(1)
b = 5.5639(1)
c = 7.8609(1)
98.4 ± 1.40.00166.141.51
LFO-CS-8a = 5.5582(1)
b = 5.5680(1)
c = 7.8617(1)
106.8 ± 1.50.00137.282.37
LFO-CS-10a = 5.5587(1)
b = 5.5686(1)
c = 7.8604(1)
108.6 ± 1.70.00138.002.31
LFO-CS-12a = 5.5581(1)
b = 5.5680(1)
c = 7.8594(1)
128.4 ± 2.20.00136.101.67
Table 2. Energy band gap and the band edge potentials.
SampleIndirect Band GapDirect Band Gap
Eg, eV/λ, nmECB, eVEVB, eVEg, eV/λ, nm ECB, eVEVB, eV
LaFeO32.12/584−0.01322.10142.39/519−0.14812.2418
LFO-CS-62.12/584−0.01322.10142.37/523−0.13822.2318
LFO-CS-82.15/575−0.02822.12182.55/486−0.22822.3218
LFO-CS-102.16/573−0.02252.13752.57/482−0.23822.3318
LFO-CS-122.15/575−0.02822.12182.54/488−0.22312.3168
Disclaimer/Publisher’s Note: The statements, opinions and data contained in all publications are solely those of the individual author(s) and contributor(s) and not of MDPI and/or the editor(s). MDPI and/or the editor(s) disclaim responsibility for any injury to people or property resulting from any ideas, methods, instructions or products referred to in the content.

