1. Introduction
Lithium niobate (LiNbO
3) crystals are multi-functional materials, which exhibit good photoelectric and piezoelectric properties, among others, and they are currently employed in many commercial applications [
1,
2,
3,
4,
5]. Conventionally, a large size of good-quality LiNbO
3 crystals can be readily grown from Li
2CO
3 and Nb
2O
5 raw materials, whereby the crystals obtained are non-stoichiometric compounds (where [Li]/[Nb] < 1) [
6]. The intrinsic defects of Li greatly influence the properties of these materials and limits their application. Therefore, it is significant to investigate the defect structure of LiNbO
3 crystals and explore the relationships between the structure and the properties of this material.
Several efforts were made to understand the intrinsic lattice characteristics of LiNbO
3 crystals, while there still remains some controversy surrounding its defect structure [
7,
8,
9,
10,
11,
12,
13,
14,
15,
16,
17]. The X-ray diffraction technique is the primary method used to resolve crystal structure, whereas its drawbacks involve its insensitivity to light elements. For LiNbO
3 crystals, there exists Li and O light elements; thus, compared to X-ray techniques, neutron scattering is more sensitive to these light elements. In addition, the nuclear neutron scattering lengths of Li (−1.900 fm) and Nb (7.054 fm) are of the same order with an opposite sign. Taken together, these factors suggest that neutron scattering is a more powerful method than X-ray diffraction for resolving the LiNbO
3 crystal structure. However, the natural LiNbO
3 crystal is not suitable for further investigation on the crystal micro-structure using neutron scattering, as the natural Li element contains two isotopes of
6Li and
7Li. The
6Li isotope has a large neutron absorption cross-section with about 940 barn, while the neutron absorption of
7Li is only about 0.0454 barn. When the neutron is incident on the natural crystal, some of the neutrons are absorbed by the
6Li isotope in the crystal without being scattered, which results in the inaccuracy of the result. Therefore, providing good crystals grown using only the
7Li isotope in isolation has great significance for further investigation into the micro-structure of the LiNbO
3 crystal.
In our previous work, we reported on the studies on an undoped lithium isotope niobate (
7LiNbO
3) crystal [
18]. Here, we mainly report on the specific crystal growth procedure, the determination of the crystal structure and crystal composition, and the characterization of the thermal properties, including specific heat, thermal expansion, thermal diffusion, and thermal conductivity, of Mg-doped lithium isotope niobate (Mg:
7LiNbO
3) single crystals.
2. Experimental Section
2.1. Crystal Growth Procedure
The conventional raw materials for growing LiNbO
3 crystals are Li
2CO
3 and Nb
2O
5. However, due to the limited availability of isotopic materials, the starting materials for growing the Mg:
7LiNbO
3 crystal were
7LiOH (with 99.9% chemical purity and 99.3%
7Li isotopic purity), Nb
2O
5 (with 99.99% purity; Tianjin Institute of Pure Chemical Reagents, Tianjin, China), and MgO (with 99.99% purity; Tianjin Institute of Pure Chemical Reagents, Tianjin, China), which reacted as per the proportions described in Equation (1).
The chemical activity of 7LiOH is strong, allowing it to easily absorb H2O and CO2 from the air to form 7LiOH·H2O and 7Li2CO3. In addition, 7LiOH is strongly alkaline and can easily corrode the platinum crucible, especially at high temperatures. Therefore, the preparation technique of isotopic crystals from 7LiOH and Nb2O5 was expected to be much harder than that for the natural crystal from Li2CO3 and Nb2O5 raw materials. The specific preparation procedure is described below.
Initially, Mg:7LiNbO3 polycrystalline materials were prepared. Firstly, 7LiOH was baked at about 100 °C for at least 24 h to remove water, with the results showing that 7LiOH lost up to 45% of its weight. Secondly, 7LiOH was ground and combined completely with MgO and Nb2O5 according to the stoichiometric value, before the mixture was put into a platinum crucible, where a pure Nb2O5 pellet was placed at the bottom of the mixture to prevent contact between 7LiOH and the crucible. Then, the crucible was heated to 450 °C over 2 h and was kept stable for a further 2 h, before being heated to 900 °C over 2 h and kept stable for a further 2 h. The crucible was finally heated to 1000 °C over 2 h and kept stable for a further 5 h, after which the Mg:7LiNbO3 polycrystalline materials formed.
Subsequently, the Mg:7LiNbO3 crystal was grown using the Czochralski method in a TDL model-H50AC crystal-pulling apparatus. The apparatus used to heat the crucible was a 2-kHz low-radio-frequency furnace. Temperature control was achieved using a Eurotherm model 818 controller with a precision of ±0.5 °C. The crawling distance of the pulling apparatus was less than 1 μm. A c-axis natural LiNbO3 crystal rod (Φ 2.8 mm × 22 mm) was used as the seed. During the growth process, the pulling rate ranged from 0.3 to 0.5 mm/h, and the rotation rate was kept at 5 rpm. After the growth was completed, the crystal was cooled to room temperature in air at a rate of 25 °C/h.
2.2. X-ray Powder Diffractometer (XPRD) Measurements
The phase identification of the as-grown crystal was determined using an X-ray powder diffractometer (XRPD; Bruker, model: Smart PPEX II) with a Cu Kα1 line (λ = 1.5406 × 10⁻¹⁰ m).
2.3. Crystal Composition Measurements
The crystal composition was determined using the Raman mode linewidth method. The Raman spectra were recorded on a Jobin-Yvon Model T64000 triple spectrometer with a spectral resolution of 2 cm−1. Furthermore, a green 514.5-nm radiation from a Coherent Mode Innova 70 Ar+ laser operating at 30 mW was employed for excitation of the spectra.
2.4. Transmittance Spectroscopy Measurements
The transmittance of the as-grown crystal was measured at room temperature using an infrared–visible–ultraviolet (IR–Vis–UV) spectrophotometer (Hitachi U-3500 model) in the range of 190–2500 nm, and the sample used was cut and polished with a thickness of 2 mm.
2.5. Thermal Property Measurements
The specific heat (Cp) was measured using a differential scanning calorimeter (Diamond DSC) with a simultaneous thermal analyzer made by the Perkin–Elmer company. A small sample weighing 23.20 mg was used for the measurements. Firstly, the sample was held at 298 K for 20 min, and was then heated to 573 K at a heating rate of 10 K·min−1, before being held at 573 K for 20 min. The Cp value was calculated using the supplied software.
Thermal expansions of the as-grown crystal were measured, and the thermal expansion coefficients (α) were obtained using a thermal mechanical analyzer (TMA) made by the Perkin–Elmer company. The measurements were done along the crystallographic axis (expressed as X, Y, and Z) over a temperature range of 300 to 776 K with a heating rate of 5 K·min−1. The measured sample was cut and polished with dimensions of 6 (X) × 6 (Y) × 4 (Z) mm3.
The thermal diffusion coefficients (λ) of the as-grown crystal were measured using a pulsed-laser method with a laser flash apparatus (Nanoflash LFA 447 nanoflash) in a temperature range of 301 to 572 K. Two square wafers with dimensions of 5 (X) × 5 (Y) × 1 (Z) mm3 and 5 (Y) × 5 (Z) × 1 (X) mm3 were coated with graphite on opposite faces, and the obtained values were calculated using the software supplied.
3. Results and Discussion
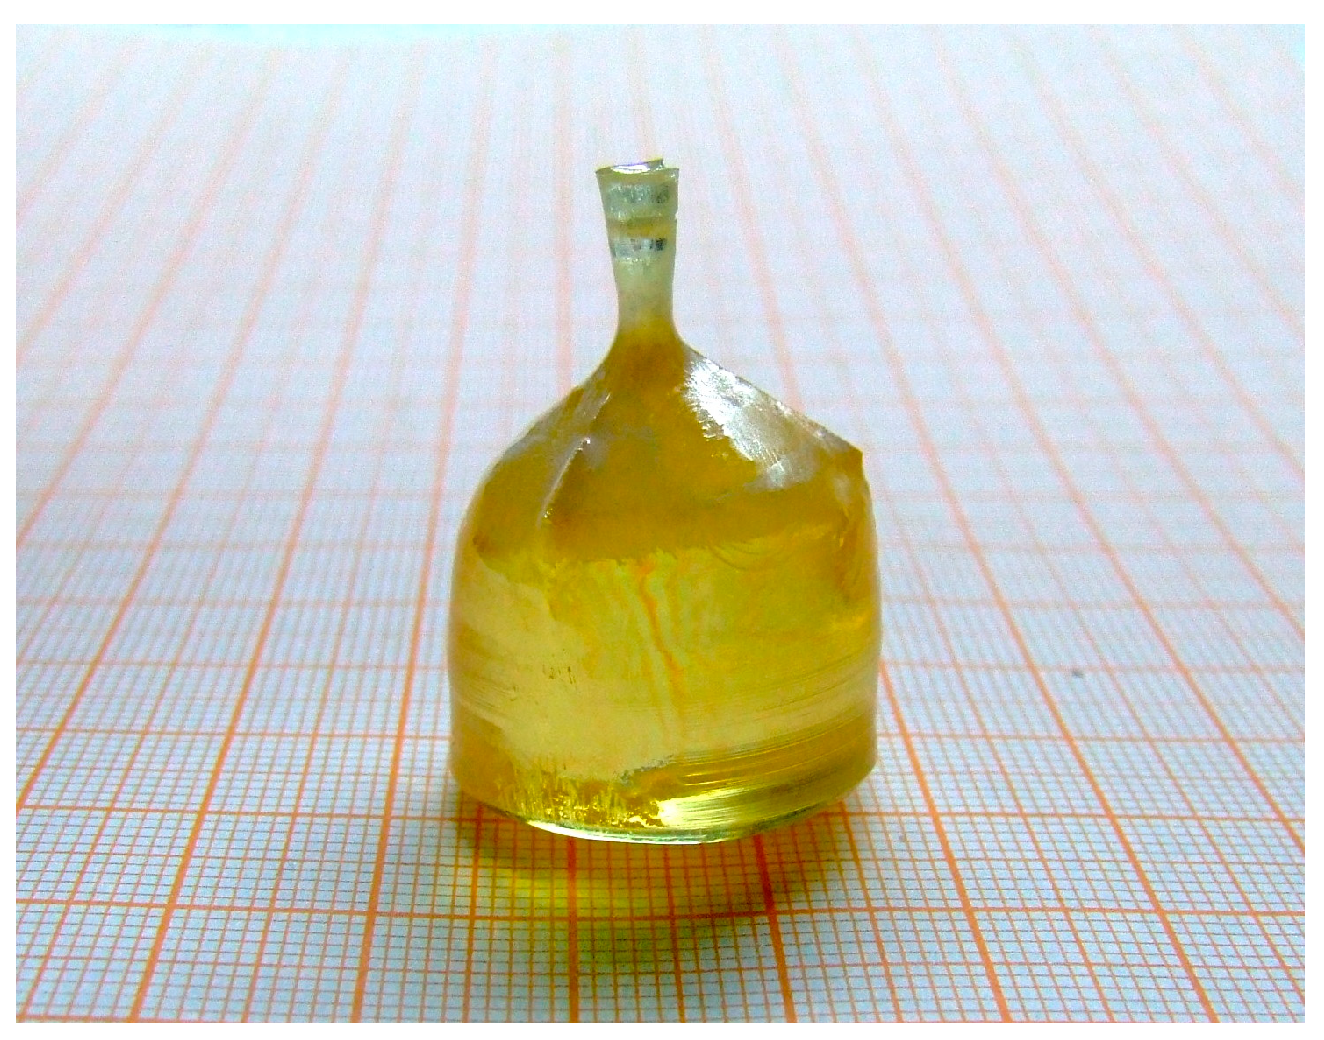
Figure 1 shows a photograph of the as-grown Mg:
7LiNbO
3 single crystal along the
c direction. Its dimensions were about
Φ 20 mm × 20 mm, and its mass was about 40 g. It was transparent and free of inclusions as observed by the naked eye. Its color was a little darker than our previous undoped
7LiNbO
3 single crystal [
18].
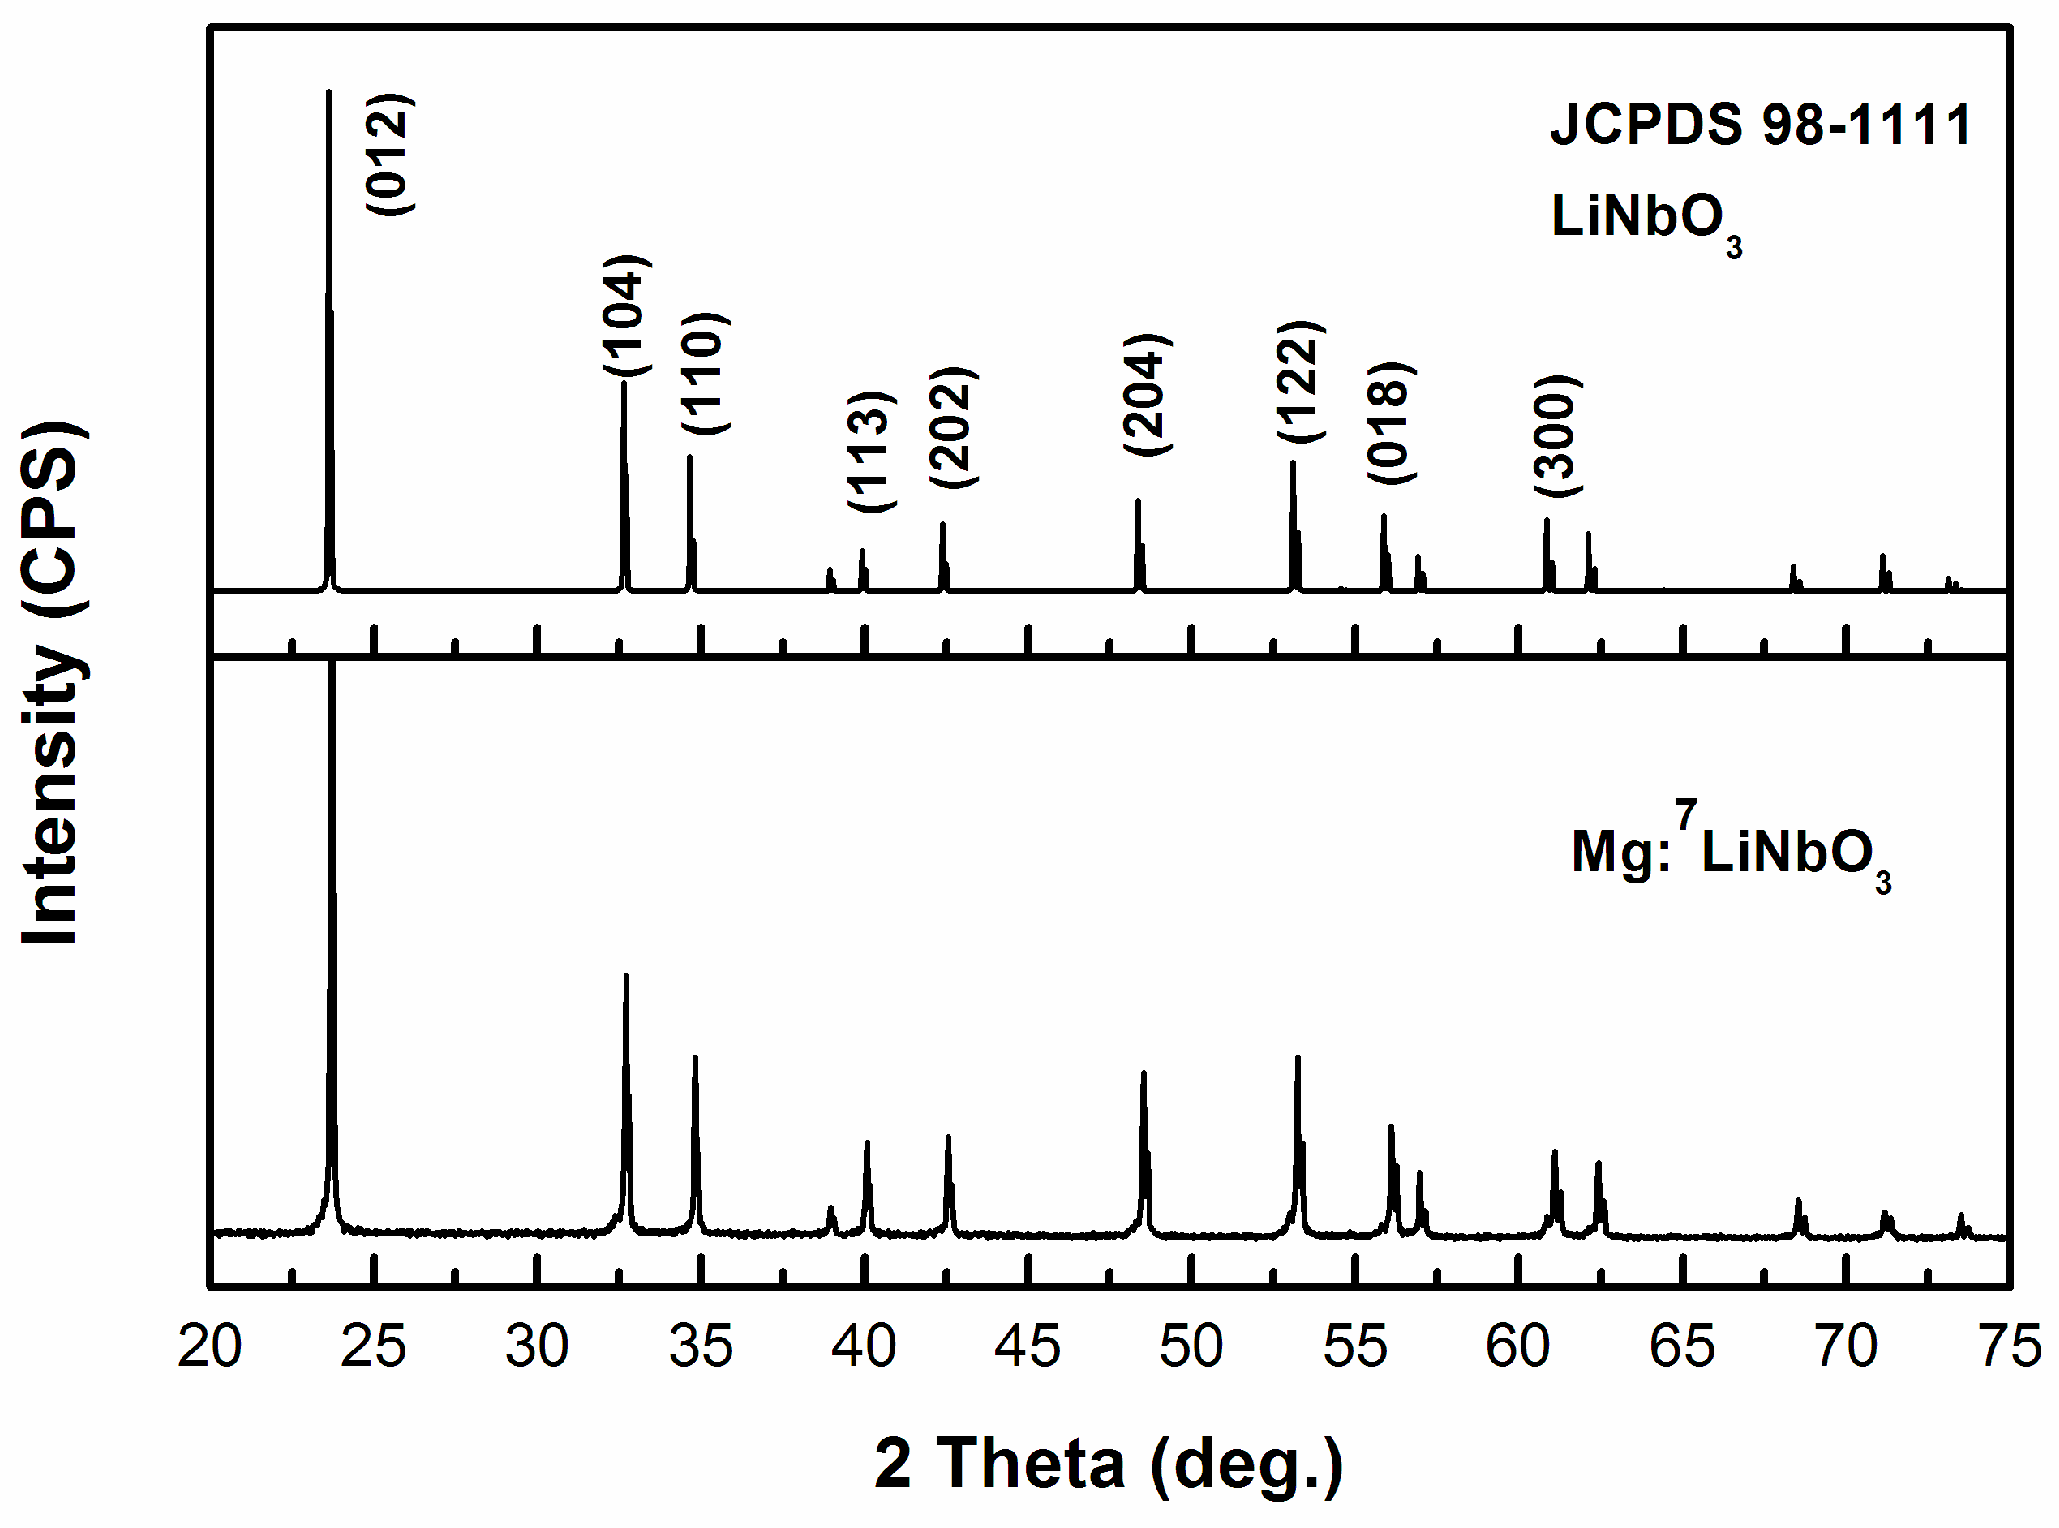
Figure 2 shows the XRPD results of the as-grown Mg:
7LiNbO
3 crystal, which indicate that the as-grown Mg:
7LiNbO
3 crystal exhibited the same crystal structure as that of natural LiNbO
3, whereby both belong to the hexagonal, 3-m point group and the
R3c space group. There were three molecules per unit cell (Z = 3). According to the peak 2
θ values in the XRPD pattern, the unit-cell parameters were
a =
b = 5.0857 Å, and
c = 13.8405 Å.
According to Equation (2) in Reference [
19], the crystal composition of the LiNbO
3 crystal (Li% = the sum of
6Li and
7Li) can be estimated using the Raman mode linewidth (
Г) of the value of
E(TO
1) expected in the x(yz)x configuration.
For the Mg-doped
7LiNbO
3 crystal, the Li% (the sum of
6Li and
7Li, whereby the
6Li content is very small due to the original isotopic purity) can also be calculated using the same formula [
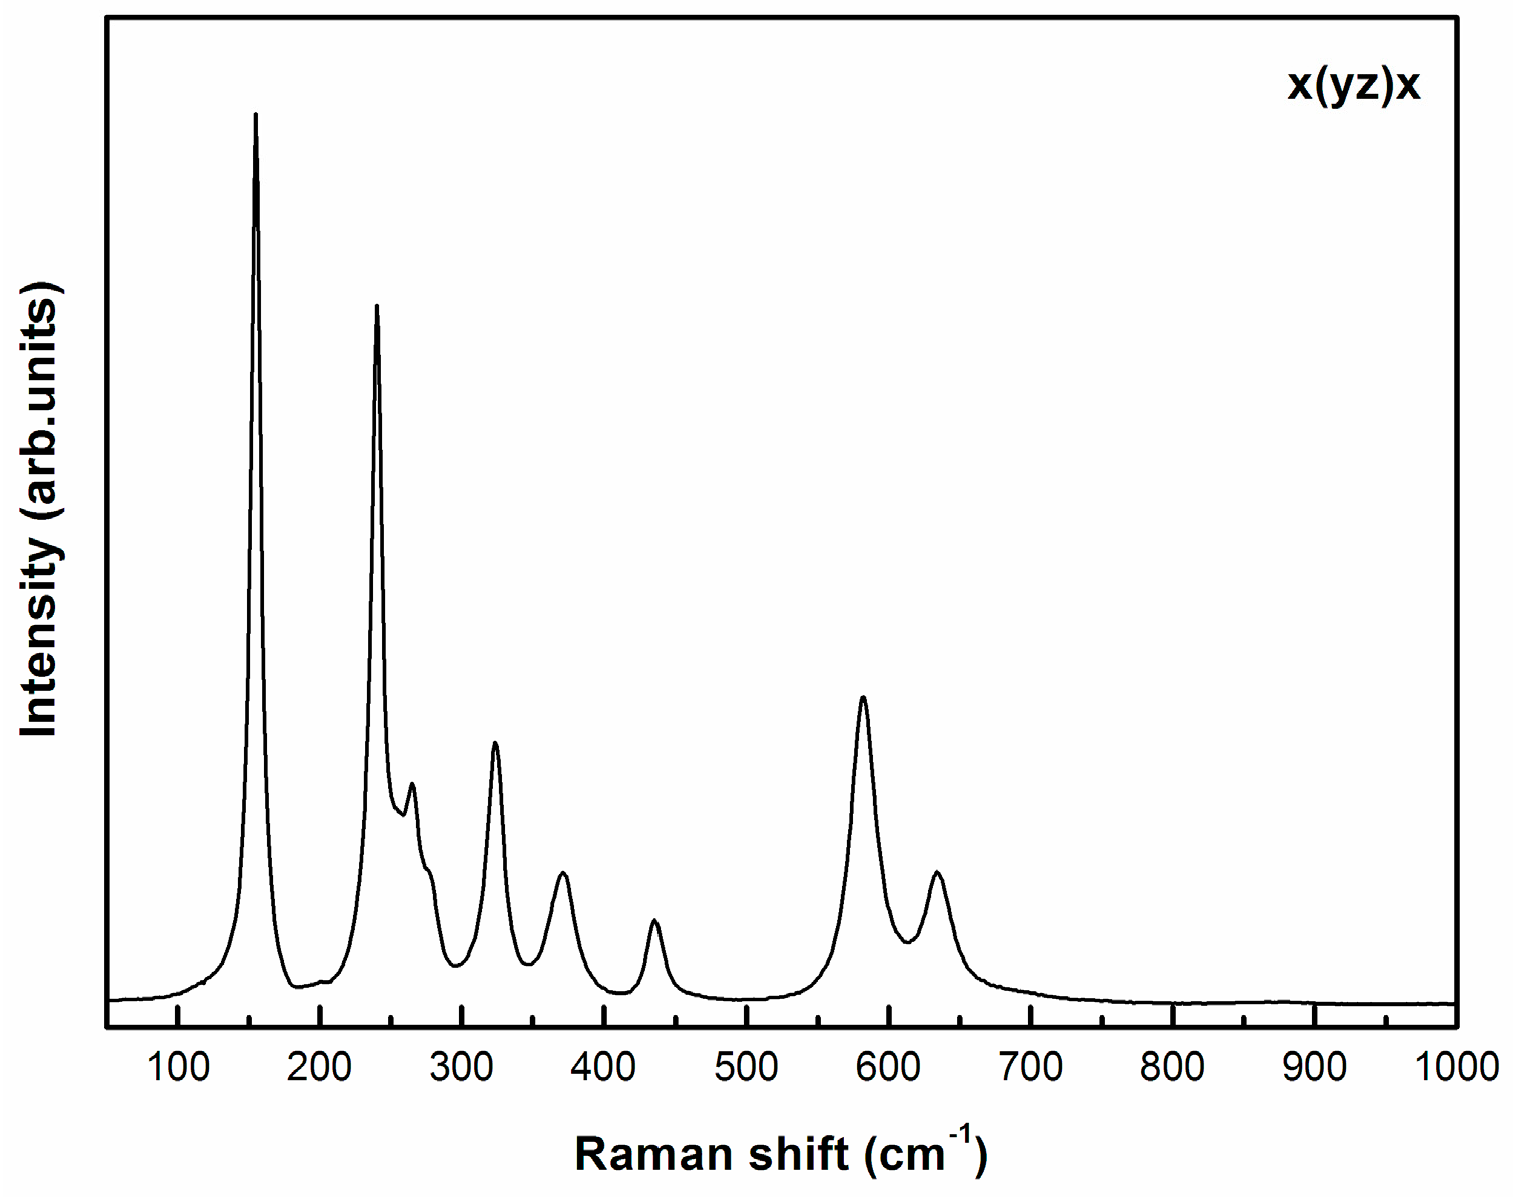
19]. The obtained Raman spectrum at room temperature is plotted in
Figure 3, and seven obvious
E(TO) modes were observed. We could unambiguously identify that the
E(TO
1) mode was located at 157 cm
−1, and its linewidth was 8 cm
−1, obtained using the Peakfit software. From Equation (2) and the data obtained, we calculated the Li% as 49.29%.
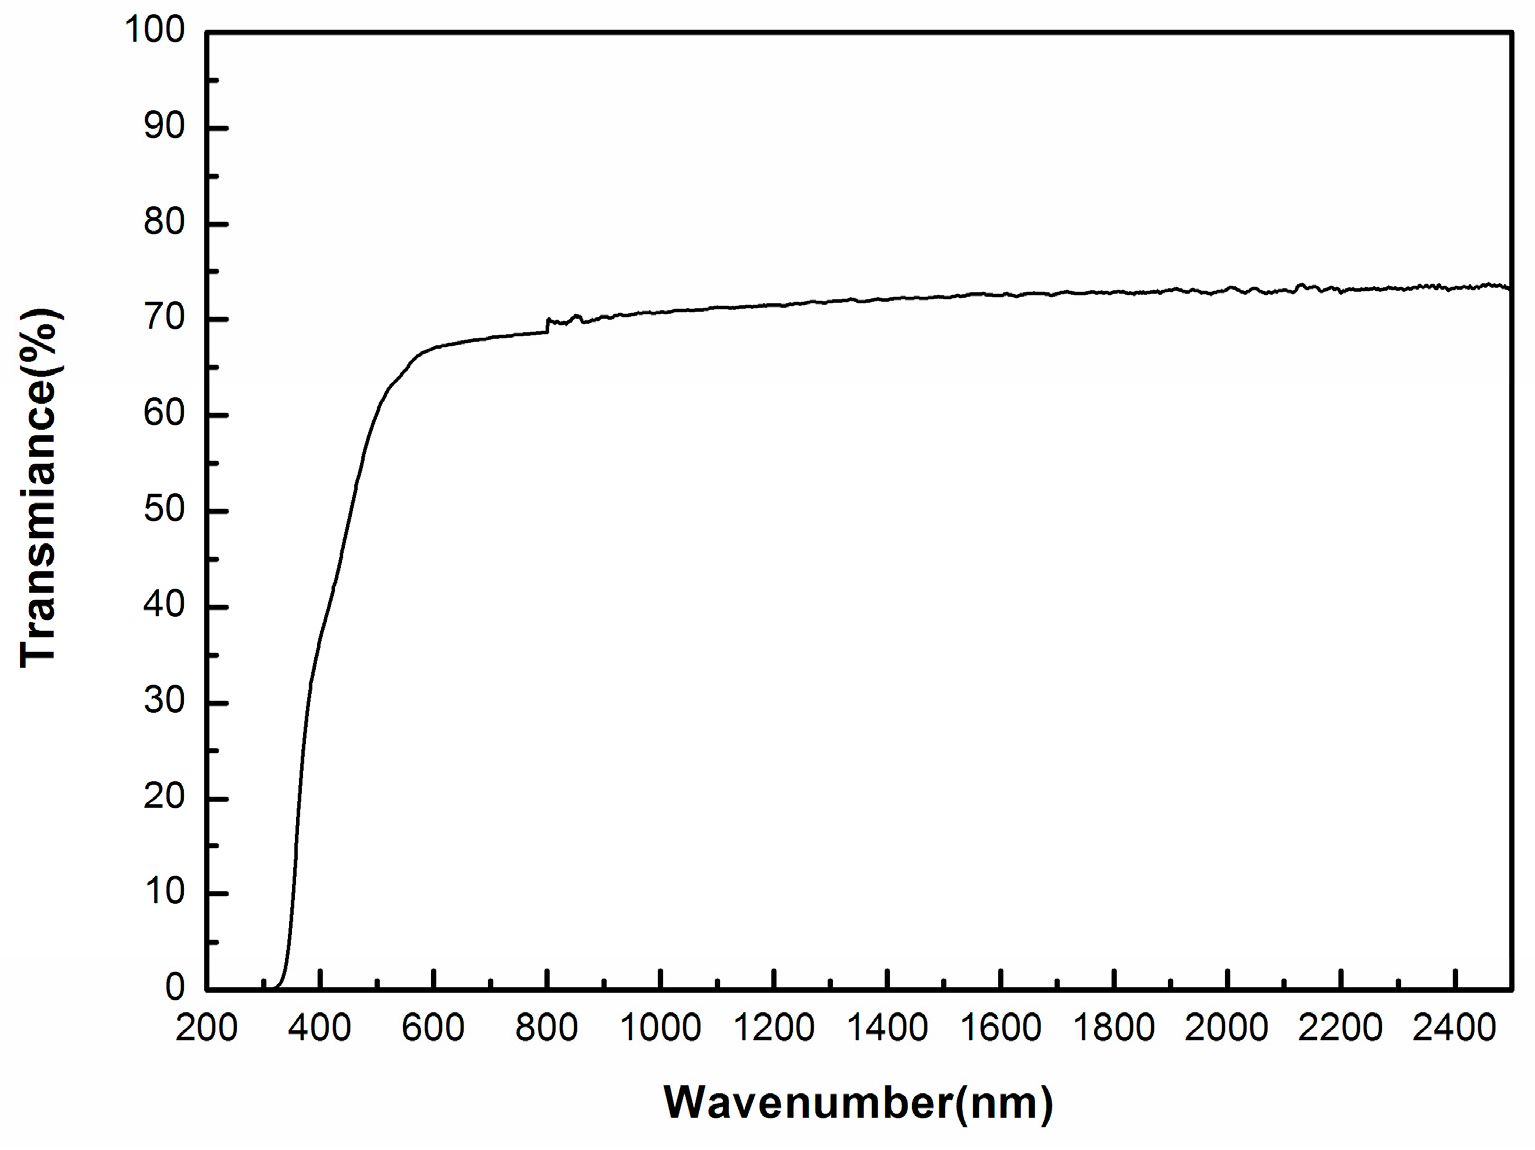
The transmittance spectrum of the as-grown crystal is plotted in
Figure 4, where we found that the crystal exhibited large transmittance, and the average value was approximately 72% in a wavenumber range of 500–2500 nm.
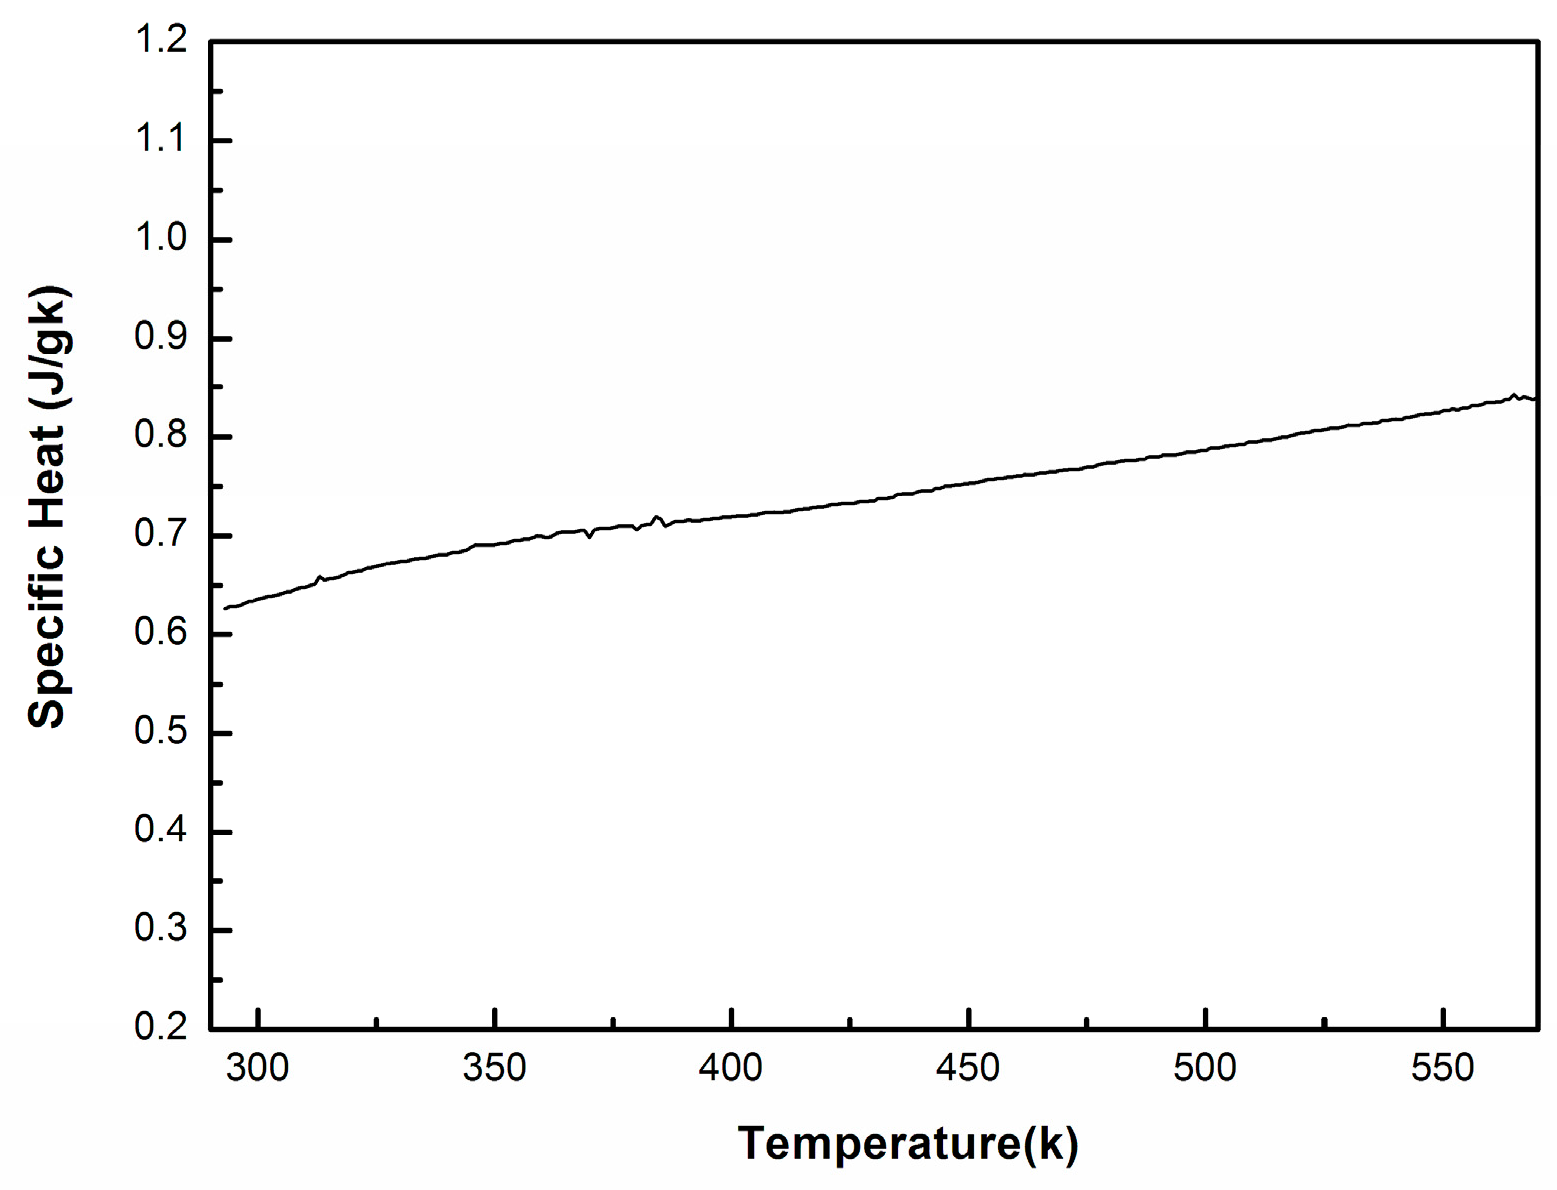
The specific heat (
Cp) is the ratio of the change in energy to the change in temperature, and it is the most important factor that influences the damage threshold of crystal materials [
20].
Figure 5 shows the specific heat (
Cp) curve of the as-grown Mg:
7LiNbO
3 crystal. From the curve, it can be seen that the specific heat of the Mg:
7LiNbO
3 crystal was almost linear with temperature, and it increased smoothly from 0.63 Jg
−1K
−1 to 0.85 Jg
−1K
−1 in the measured temperature range of 293 to 573 K, whereas it was 0.67 Jg
−1K
−1 at 328 K. The larger specific heat potentially makes it more useful for applications at high temperatures.
The thermal expansion coefficient (
α) is another important thermal parameter that affects the fracture of crystal materials [
20]. The thermal expansion coefficient (
αij) is a second-rank tensor [
21], and the quadric representation of
αij for the principle axis is shown in Equation (3).
Correspondingly, in the principle coordinate system the
αij tensor is diagonal, as shown in Equation (4), where
α11,
α22, and
α33 represent the principle components of the thermal expansion coefficient tensor.
As determined from the XRPD measurement, the Mg:
7LiNbO
3 crystal belongs to the hexagonal and 3-m point group, where
α11 =
α22. Therefore, the as-grown crystal exhibits only
α11 or
α22 and
α33 as two independent principle components, as described in Equation (5), which can be obtained by measuring the thermal expansion along the X-axis (equivalent to
a) and Z-axis (equivalent to
c) of the crystal.
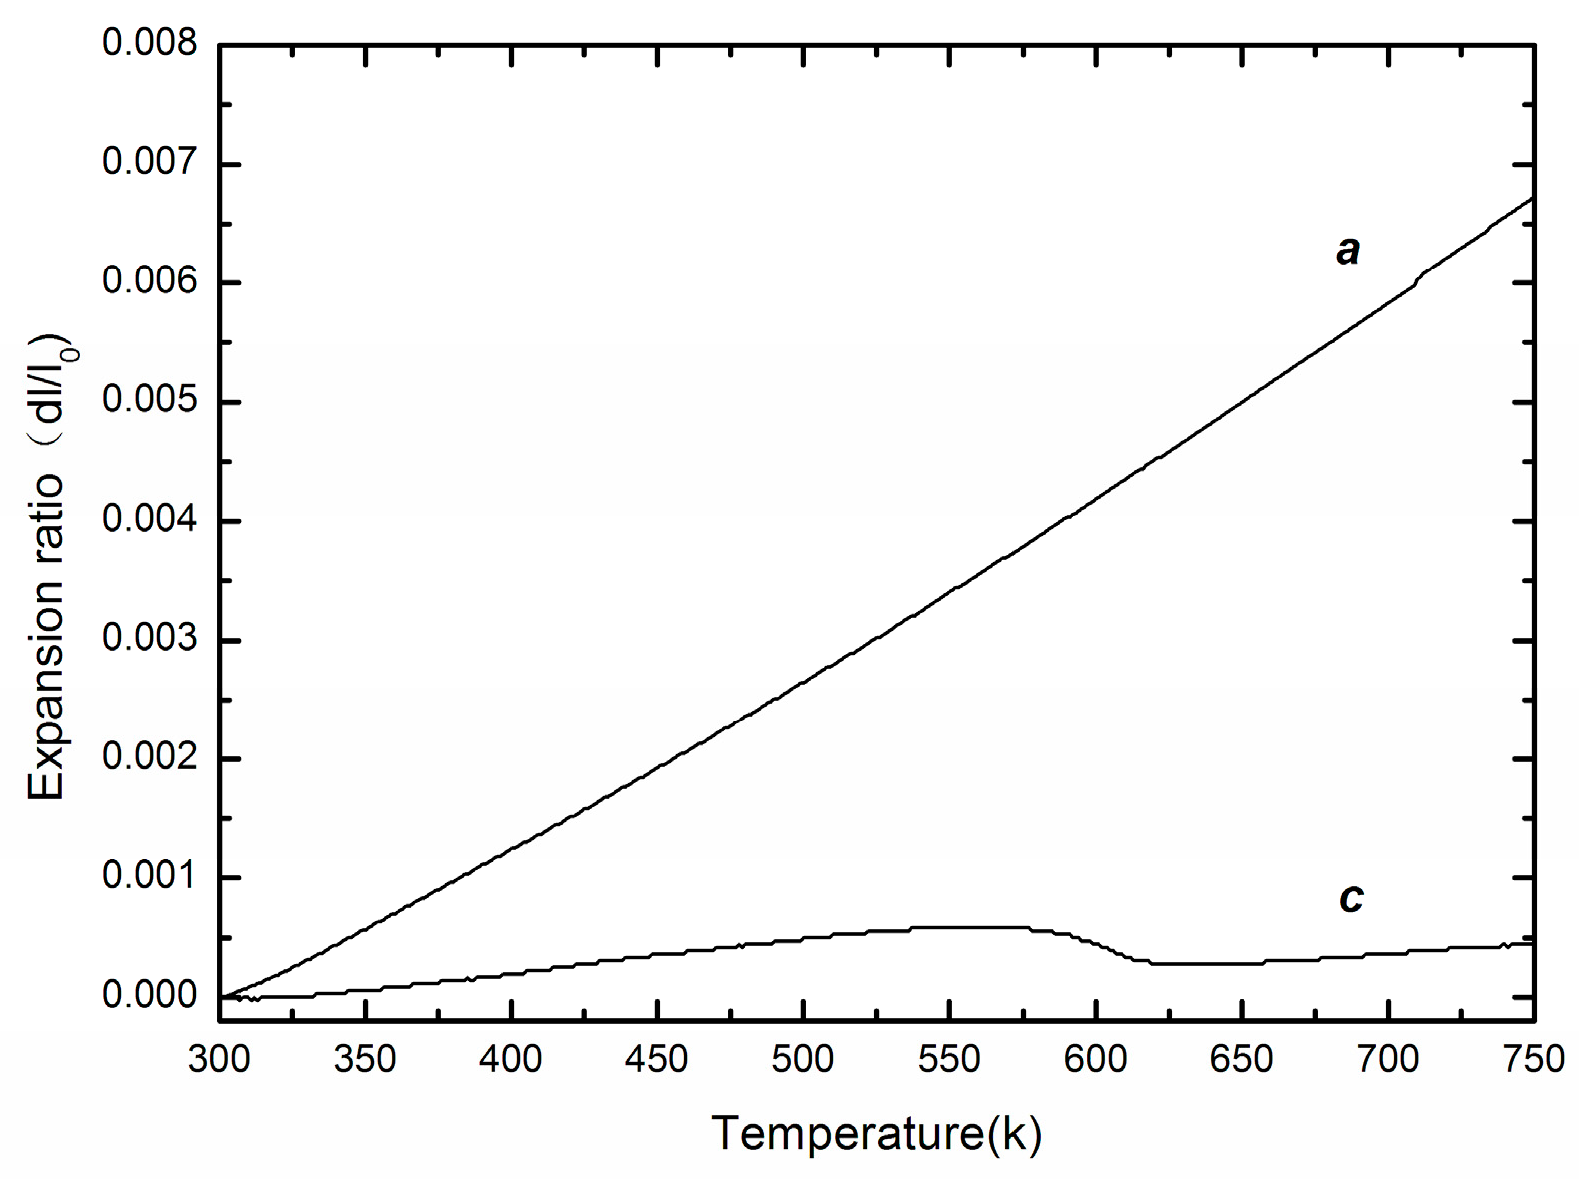
Figure 6 shows the thermal expansions ratio curves along the
a-axis and
c-axis of the as-grown Mg:
7LiNbO
3 crystal, where the thermal expansion along the
a-axis increased almost linearly in the measured temperature range, while the thermal expansion along the
c-axis was different, as observed by the change in its slope at about 550 K.
The thermal expansion coefficient can be calculated using Equation (6).
where
L0 is the sample length at
T0, Δ
T is the temperature variation from
T to
T0, Δ
L is the length change within Δ
T, and
is the average thermal coefficient over the temperature range from
T to
T0.
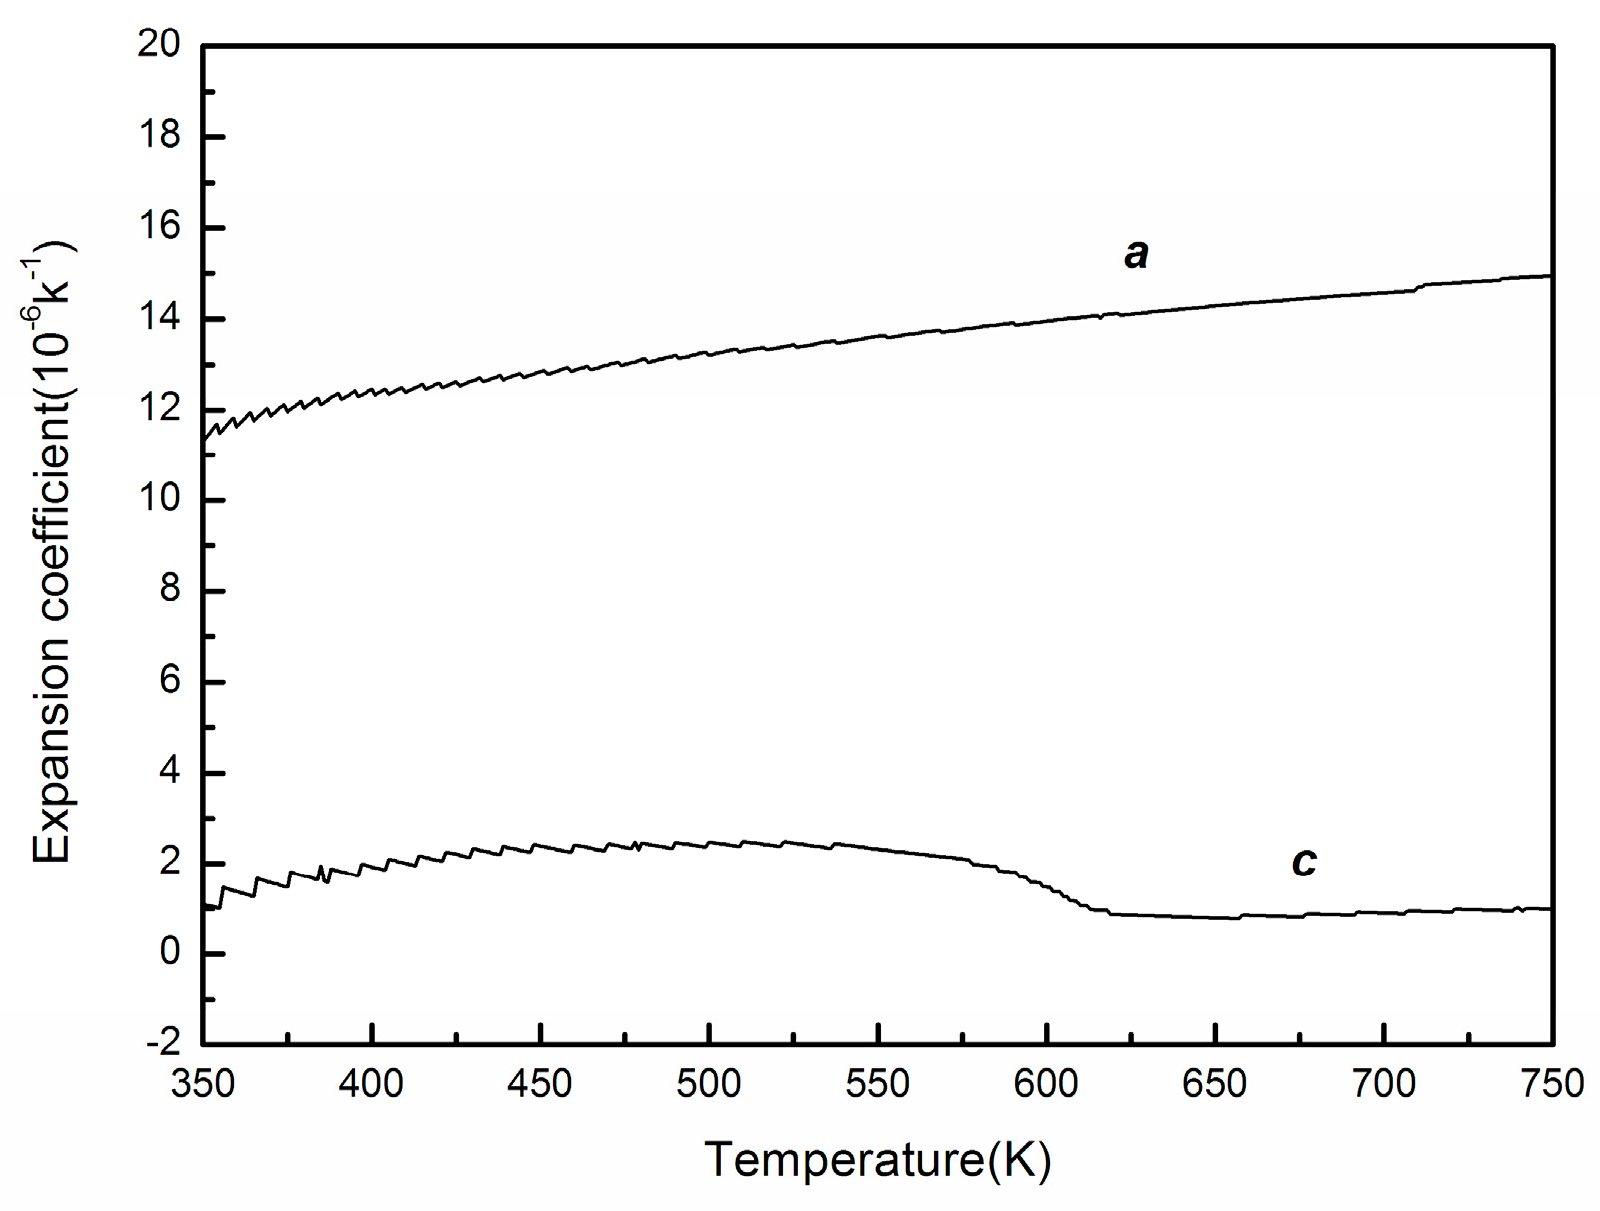
Figure 7 shows the curves of the calculated thermal expansion coefficients versus the temperature along the
a-axis and
c-axis of the as-grown Mg:
7LiNbO
3 crystal. From the curves, it can be seen that the Mg:
7LiNbO
3 crystal only possessed positive thermal expansion when it was heated. Along the
a-axis, the value increased steadily over the temperature range, while, along the
c-axis, the value remained almost unchanged between 350 K and 550 K, before slightly decreasing to 640 K, after which it remained constant with rising temperature until 750 K. The calculated average thermal expansion coefficients were
αa = 13.2 × 10
−6 K
−1 and
αc = 1.5 × 10
−6 K
−1 from 300 K to 750 K. The value of the expansion coefficient along the
a-axis was much larger than that along the
c-axis, which shows that the as-grown crystal possessed large anisotropic thermal expansion, suggesting that the crystal grown along the
c-axis could largely avoid internal pressure and fracture.
Thermal diffusion and thermal conductivity are also important factors for crystal materials from both a fundamental and an applied perspective. Both factors are also the symmetrical second-rank tensor. In our experiment, the thermal diffusion coefficients (
λ) along the
a-axis and
c- axis were measured directly.
Figure 8 shows the behavior of the thermal diffusion coefficient (
λ) of the as-grown Mg:
7LiNbO
3 crystal, which was anisotropic and decreased with increasing temperature. The thermal diffusion coefficient along the
c-axis (
λc) was slightly larger than that along the
a-axis (
λa). At 300 K,
λa = 1.75 mm
2s
−1 and
λc = 1.89 mm
2s
−1.
The thermal conductivity (
κ) can be calculated according to the following equation:
where
κ,
λ,
ρ, and
Cp denote the thermal conductivity, thermal diffusion coefficient, density, and specific heat value at corresponding temperatures, respectively. The calculated thermal conductivities (κ) exhibited a similar tendency with thermal diffusion (
λ), as shown in
Figure 9, which decreased with rising temperature. In the temperature range of 301.1 K to 572.2 K, the thermal conductivity value along the
a-axis decreased from 5.66 Wm
−1K
−1 to 3.47 Wm
−1K
−1, and the value along the
c-axis decreased from 5.75 Wm
−1K
−1 to 3.49 Wm
−1K
−1.
All the measured thermal properties are listed in
Table 1, where we also listed our previous results from the undoped
7LiNbO
3 crystals (including the congruent isotope lithium niobate, abbreviated as C
7LN, and the nearly stoichiometric isotope lithium niobate, abbreviated as NS
7LN), and results from the natural LiNbO
3 crystals (including the congruent lithium niobate, abbreviated as CLN, and the nearly stoichiometric lithium niobate, abbreviated as NSLN). As shown in
Table 1, we found that the specific heat (
Cp) value of the as-grown Mg:
7LiNbO
3 crystal was larger than that of C
7LN and CLN, but was smaller than that of NS
7LN and NSLN, which means that the grown Mg:
7LiNbO
3 crystal exhibited a relatively moderate damage threshold [
20]. The values of the thermal expansion coefficient (
α) among the three isotope crystals were similar, which means that this thermal parameter was hardly affected by the intrinsic defects of the
7LiNbO
3 crystal, while both the values of the thermal diffusion coefficient (
λ) and the thermal conductivity (
κ) of the Mg:
7LiNbO
3 crystal were larger than those of NS
7LN and NSLN, and even larger than those of C
7LN and CLN. Due to the relatively smaller quantity of
6Li being substituted, the divergences in
λ and
κ were mainly a result of the defect micro-structure caused by the Li concentration (Li%).
According to Reference [
22],
κ can also be determined using the following equation:
where
υ is the constant sound velocity, and
L is phonon mean free path (MFP). Phonon scattering in a solid consists of four processes involving collisions between phonons and (a) phonons, (b) defects, (c) free electrons, and (d) boundaries of the system [
22]. A higher Li concentration results in a lower number of defects, since
L (and
κ) decreases with the increasing the number of defects. The collisions between phonons and defects explain why the thermal conductivity of C
7LN and CLN was smaller than that of Mg:
7LiNbO
3, NS
7LN and NSLN. Because the doped Mg occupied the positions of Li or Nb sites in the crystal and made up for some vacancies [
23], the as-grown Mg:
7LiNbO
3 possessed the largest thermal conductivity among all the crystals.


