Abstract
Only six years ago, the first clear-cut example of a ferroelectric, lyotropic liquid crystal was discovered. Since then, ongoing investigations in this new research field provided numerous instances of the missing pieces to complete the formerly blank picture of the lyotropic smectic C* (SmC*) phase. In this review we wanted to combine these new results and put them into a wider historical and scientific context. We start by giving an introduction about characteristic features of the well-known thermotropic SmC* phase and why it is so difficult to find a lyotropic equivalent of this fascinating phase. After discussing early examples of achiral lyotropic and swollen SmC phases, we recap the discovery of the first lyotropic SmC* phase. The molecular features necessary for its formation and its properties are analyzed. We place special emphasis on discussing the long-range orientational order of the tilt direction and the corresponding chirality effects. By comparing these exceptional features with thermotropic and swollen SmC* phases, we aim to improve not only the understanding of the lyotropic SmC* phase, but also of the relationship between thermotropic and lyotropic systems in general.
1. Introduction
In the present article, the discovery of the lyotropic analogue of the thermotropic polar smectic C* phase (lyo-SmC*), its properties and the prerequisites for its formation are reviewed. We cover the very first examples of fluid and tilted lyotropic lamellar phases and the latest developments in the newly evolved research field. In order to illuminate the special status of the lyo-SmC* phase among the lyotropic liquid crystal phases, we begin this review with a short recapitulation of the unique features of the thermotropic polar and ferroelectric SmC* phase, and discuss the obstacles to overcome on the way to finding lyotropic analogues of the former.
1.1. Ferroelectricity in Liquid Crystals
The term ferroelectricity is used in analogy to ferromagnetism and describes the property of certain dielectric materials to have a spontaneous electric polarization, the direction of which can be changed—in most cases reversed—by the action of an external electric field [1]. After the first discovery of ferroelectricity in Rochelle salt by the physicist Joseph Valasek in 1920 [2], it was long believed that ferroelectricity could only be found in solid crystals of low symmetry; namely, those crystals which belong to the ten polar crystallographic point groups (crystal classes) C1, Cs, Cn and Cnv with n = 2, 3, 4 and 6. In the 1970s, however, the Harvard physicist Robert B. Meyer realized that a thermotropic smectic C liquid crystal which is composed of chiral molecules has polar C2 symmetry, and might, thus, be the first example of a fluid medium with a spontaneous electric polarization [3,4]. Meyer’s discovery initiated one of the most active fields in soft matter research ranging from ferro- and antiferroelectric liquid crystals to the plethora of polar liquid crystal structures formed by bent-core mesogens [5,6,7].
The structures of the thermotropic fluid smectic liquid crystals, smectic A (SmA) and smectic C (SmC), can be considered as 1D-periodic stacks of 2D-fluid layers formed by elongated molecules, the long axes of which are orientationally ordered along the liquid crystal director n (Figure 1). While n is parallel to the smectic layer normal k (the stacking direction) in SmA (Figure 1a), the director n is tilted in SmC by the tilt angle θ with respect to k (Figure 1b). The tilt of the director breaks the full rotational symmetry of the uniaxial SmA phase around k and makes the SmC phase biaxial. In SmC, the principal symmetry axis is the C2-axis normal to the tilt plane (the plane spanned by k and n; see Figure 2). In addition, the tilt plane itself is a mirror plane. The non-chiral SmC structure, thus, belongs to the non-polar point group C2h. Chirality, however, excludes the presence of any mirror planes, such that the symmetry of the chiral SmC phase (SmC*) is reduced to the polar point group C2 [5].
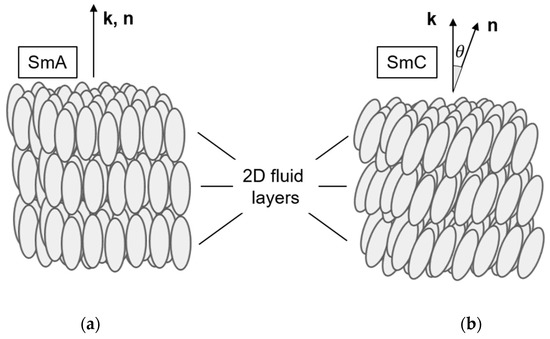
Figure 1.
Structures of the fluid smectic phases (a) smectic A (SmA) and (b) smectic C (SmC). Both phases are 1D stacks of 2D fluid layers formed by orientationally ordered mesogenic molecules. In SmA, the director n (the mean direction of the long molecular axes) is parallel to the smectic layer normal k (the stacking direction of the layers). In SmC, n is tilted with respect to k by the director tilt angle θ.
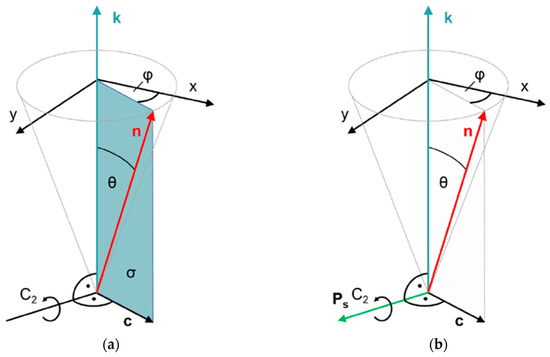
Figure 2.
Symmetries of (a) smectic C (SmC) and (b) chiral smectic C (SmC*) liquid crystals. The director n is tilted with respect to the smectic layer normal k by the tilt angle θ. The tilt direction is indicated by the c director and specified by the azimuth angle φ. The directions of k and n define the tilt plane. Normal to the tilt plane, we find a twofold symmetry axis C2, since the directions of +n and +k are physically equivalent to the directions of −n and −k, respectively. In addition, the tilt plane is a mirror plane in the case of non-chiral SmC. Both symmetry elements combine to the non-polar point group C2h. In the presence of chiral molecules, however, mirror symmetry is expelled and the C2 axis remains the only symmetry element. Thus, the chiral SmC* phase has polar C2 symmetry, and a spontaneous polarization vector Ps along the C2 axis is allowed by symmetry.
The absence of a mirror plane normal to the C2 axis makes this axis a polar axis, in the direction of which the presence of vectorial properties, such as a spontaneous electric polarization Ps, is allowed by symmetry. Since the polar C2 axis is normal to both the director n and the layer normal k, the direction of Ps is expressed by [8]:
which implies that the magnitude of spontaneous polarization Ps = |Ps| increases with the director tilt θ as Ps ∝ sinθ ≈ θ in the first approximation. In conclusion, both the direction and the magnitude of Ps depend on the direction and magnitude of tilt. This is known as the polarization-tilt coupling in chiral smectic liquid crystals.
The point group symmetries D∞h of non-chiral SmA and D∞ of chiral SmA* are too high to allow ferroelectricity and a spontaneous polarization in any direction. In SmA*, however, an electric polarization induced by an electric field E along the smectic layers is linearly coupled to an induced director tilt δθ(E) via the polarization-tilt coupling. This so-called electroclinic effect increases in amplitude towards the transition temperature Tc from the SmA* into the SmC* phase in a Curie–Weiss-like anomaly [9,10,11].
In addition to the spontaneous electric polarization of each smectic layer, chiral smectic C forms a helical superstructure in such a way that the tilt direction—and thus the direction of Ps as well—slightly twists from layer to layer along the layer normal k (Figure 3). The pitch p of the SmC* helix is typically in the order of several microns and is, therefore, several orders of magnitude larger than the thickness of the smectic layers d which are typically in the range of a few nanometers. As a result of this helical superstructure, the spontaneous polarization is macroscopically cancelled out over a full pitch length.
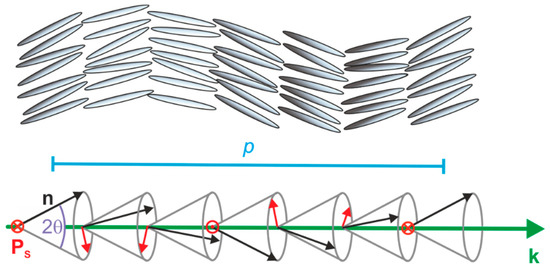
Figure 3.
Helical superstructure of a chiral smectic C (SmC*) phase depicted with hard rods (top) and vectors (bottom). The director n (black) and the spontaneous polarization Ps (red) are twisted along the direction of the layer normal k (green) from layer to layer with a helical pitch p (blue). The latter is typically in the micron range, and thus, several orders of magnitude larger than the layer spacing d.
In 1980, Noel A. Clark and Sven T. Lagerwall discovered that the SmC* helix formation can be easily suppressed if the phase is confined between two planarly aligning glass plates, the distance between which is less or similar to the SmC* pitch p (Figure 4a) [12]. In this so-called surface stabilized ferroelectric liquid crystal (SSFLC) configuration, the SmC* phase behaves very much like a classic ferroelectric material. The SSFLC film forms two kinds of domains with opposite tilt directions parallel to the glass surfaces (Figure 4). As a result of the polarization-tilt coupling, these two kinds of tilt domains also have opposite directions of Ps and are, therefore, the liquid crystal equivalents to the ferroelectric domains in solid ferroelelectrics. An electric field E is applied across the cell switches’ tilt directions such that Ps is parallel to E (Figure 4b). Observed between crossed polarizers, the field-induced reversal of the SmC* tilt direction gives rise to a very fast and bistable electro-optic effect which attracted tremendous interest for future display applications and initiated a boost of research in the field of ferroelectrics (FLCs), and later, the antiferroelectric (AFLC) liquid crystal field as well [8]. Today, hundreds of thermotropic FLC and AFLC materials are known.
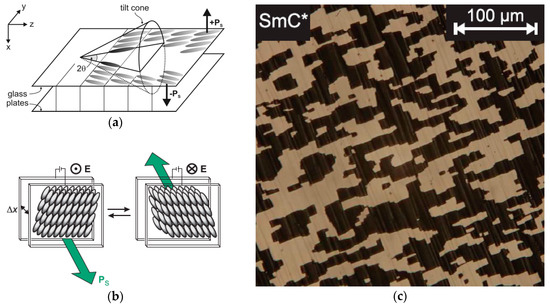
Figure 4.
Surface stabilized ferroelectric liquid crystals (SSFLCs). (a) SmC* phase confined between two glass plates (with conductive indium tin oxide (ITO) electrodes) of a liquid crystal cell which aligns the SmC* director parallel to the glass surfaces. All possible tilt directions of the SmC* director are represented by the so-called tilt cone. Only the two tilt directions parallel to the glass surfaces meet the surface anchoring condition, and thus, the helical SmC* structure is suppressed if the gap between the glass plates is sufficiently small. The two possible tilt directions (±y) are coupled to opposite directions of the spontaneous polarization Ps (up and down). (b) The application of an electric field E across the cell reorients the Ps vectors of all domains into the direction of E. The field-induced reversal of Ps also reverses the tilt direction of the SmC* director, which gives rise to a fast electro-optic effect if seen between crossed polarizers. (c) In the polarizing optical microscope, the ferroelectric domain structure of the virgin SSFLC configuration is seen between crossed polarizers as an array of bright and dark domains with opposite tilt directions, and thus opposite Ps directions. (Reprinted with permission (a) from Springer Nature: [13], redrawn after [12]; (b,c) from A. Bogner: [14].)
Two examples of thermotropic FLC materials are shown in Figure 5. The chiral Schiff base (S)-p-(n-decyloxybenzylidene)-p-amino-(2-methylbutyl) cinnamate, code named DOBAMBC, shown in Figure 5a, was actually the first thermotropic SmC* material which was recognized as a ferroelectric liquid crystal [3] and much of the pioneering work was done with this material. DOBAMBC undergoes a second-order transition from the paraelectric SmA* to the ferroelectric SmC* phase below TAC = 95 °C. Below TAC the director tilt angle θ and the spontaneous polarization Ps continuously increase from zero and reach far below TAC values of 28° and 6 nC cm−2, respectively (Figure 5a) [15]. Even though many FLCs have second-order SmA*–SmC* transitions like DOBAMBC, materials with first-order ferroelectric transitions are also known. The first example was the chiral biphenyl (S,S)-4-(3-methyl-2-chloropentanoyloxy)-4′-heptyloxybiphenyl, code named C7 (Figure 5b) [16]. At the transition temperature TAC = 55°C the paraelectric SmA* phase coexists with the SmC* phase which has 15° tilt and 100 nC cm−2 polarization at the transition point. In the SmC* phase below, TAC tilt and polarization reach values of up to 23° and 300 nC cm−2, respectively (Figure 5b). In the (T,E)-phase diagram, the first-order SmA*–SmC* transition terminates under the action of a strong electric field E at a critical point [17].
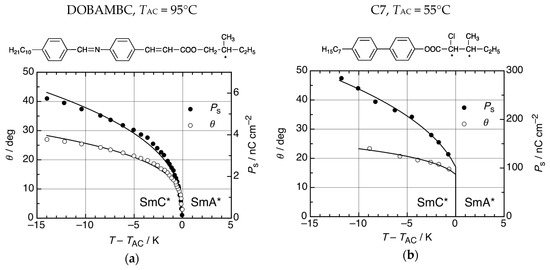
Figure 5.
Two examples of ferroelectric SmC* materials. (a) The chiral Schiff base DOMBAMBC has a second-order SmA*–SmC* transition at the transition temperature TAC = 95 °C. At increasing temperatures T < TAC, the director tilt angle θ and the spontaneous electric polarization Ps continuously decrease to zero values at T = TAC. At that critical point, the SmC* phase is identical to SmA*. (Data taken from [16].) (b) The chiral biphenyl C7 has a first-order SmA*–SmC* transition. At TAC, the paraelectric SmA* phase coexists with a ferroelectric SmC* phase with non-zero θ and Ps. Values of θ and Ps further increase in the SmC* phase at decreasing temperatures below TAC. (Data taken from [17].)
1.2. The Challenge of a Lyotropic SmC* Phase
Most thermotropic liquid crystal phases find a counterpart with equivalent structure and same symmetry in the world of lyotropic liquid crystals. The lyotropic counterpart of the thermotropic SmA phase, for instance, is the well-known lamellar α-phase (Lα) which consists of 2D-fluid surfactant bilayers which are separated from each other by fluid solvent layers (Figure 6a). An important exception, however, is the family of tilted fluid smectics. Even though SmC is among the most common phases found in thermotropics, the lyotropic equivalent to the SmC phase (Figure 6b) is almost unknown. To the best of our knowledge, only two examples of lyo-SmC phases and not a single example of a chiral lyo-SmC* phase were clearly confirmed, e.g., by 2D X-ray diffraction in the literature until 2013.
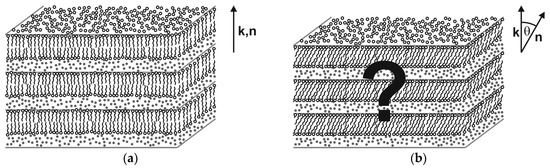
Figure 6.
Lyotropic equivalents to the thermotropic fluid smectic phases SmA and SmC. (a) The lamellar α-phase (Lα) is a 1D-stack of 2D-fluid surfactant bilayers (lamellae) which are separated from each other by interlamellar solvent layers. Since the director n is parallel to the bilayer normal k, Lα is the lyotropic equivalent to thermotropic SmA. (b) The lyotropic equivalent to the thermotropic SmC phase should have the same fundamental structure as Lα except that the surfactant molecules are tilted by the tilt angle θ into the same direction in all bilayers (synclinic tilt correlation). (Reprinted by permission from Springer Nature: [13].)
We believe that this obvious dissymmetry between thermotropic and lyotropic phases is mainly related to the issue of long-range correlations of tilt directions in a lyotropic medium on different levels:
- Intra-layer tilt correlation: In order to form a lyotropic C-phase the surfactant bilayers must be in a 2D-fluid state, the hydrophobic tails in each single bilayer must be tilted and the direction of tilt must be more or less the same throughout the bilayer. A uniform tilt direction in each single fluid bilayer might be hardly achieved with the flexible alkyl-tails of classic surfactants. The incorporation of rigid core segments (mesogenic cores) into the tails might, however, promote a collective tilt direction, e.g., by steric interactions between the rigid segments, and might lead to uniformly tilted amphiphiles in the bilayer.
- Inter-layer tilt correlation: The formation of a lyo-SmC structure further requires that in a 1D stack of bi-layers, each of which has a uniform tilt direction, the tilt directions become correlated between the bi-layers such that they all point into the same direction (synclinic correlation). In thermotropic SmC, where the smectic layers are in direct contact with each other, the synclinic tilt correlation is explained by short-range interactions, such as steric interactions or out-of-layer fluctuations, which align the tilt directions of molecules in adjacent layers [18]. In the lyotropic case, however, where the by-layers are separated from each other by solvent layers, these short-range interaction mechanisms are less relevant. Probably, the inter-layer correlation of tilt directions is the most critical step in the formation of lyo-SmC phases.
- Helical correlation: In addition to the first two points, the formation of a chiral lyo-SmC* structure requires that also subtle chiral perturbations of the synclinic tilt correlation, namely the helical precession of the tilt direction from bilayer to bilayer, are transmitted through the solvent layers.
In view of these general requirements it seems understandable that the counterparts of the thermotropic SmC and SmC* phases are very rare in lyotropic liquid crystals.
2. Examples of Swollen Thermotropic and Lyotropic SmC Phases
In general, SmC phases containing solvent can be distinguished into one of three categories: the swollen, the hyper-swollen and the true lyotropic SmC phases. In the following, examples for each type and their properties are reviewed, briefly. Regrettably, there are not a lot of examples for hyper-swollen or lyotropic SmC phases, and frequently, they are not investigated in detail. This leaves a big gap of knowledge about the properties of the hyper-swollen, and especially, lyotropic SmC phase and its correlation with the conventional thermotropic SmC phase.
The simplest way to obtain a lyotropic SmC phase, is by mixing an amphiphilic mesogen, which exhibits a SmC phase in the neat state already, with a protic solvent. However, in most cases, the tilted phase will only be stable up to a few weight percent of solvent [19,20,21]. Instead it is replaced by the Lα phase in which there is no macroscopic tilt angle. These phases are called swollen SmC phases. Typical examples for such swollen SmC phases are shown in Figure 7. Due to the strongly destabilizing impact of the solvent, they are normally not investigated further.
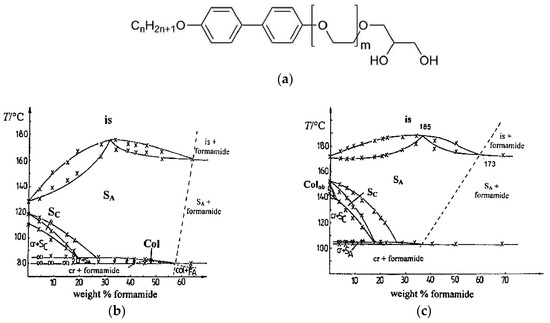
Figure 7.
(a) Molecular constitution of a calamitic mesogen which incorporates a rigid biphenyl core and a diol moiety, the latter providing solubility in protic solvents. For (b) n = 12 and m = 3 and for (c) n = 10 and m = 1, the amphiphiles show a swollen SmC phase, denoted with SC in the phase diagram. In neither case, is the phase stable with mass fractions of formamide larger than approximately 15 wt%. (Phase diagrams reprinted with permission from Spie [19], and [20]. Copyright 1998 American Chemical Society.)
Thermotropic SmC phases, which can take up considerable amounts of solvent, are the so-called hyper-swollen phases. Kanie et al. [22] discovered that combining a phospholipid with an aromatic cyano azobenzene unit produces an SmC phase, which tolerates a water amount of up to 50 wt% before transforming into the orthogonal Lα phase. This observation was, however, solely based on the detection of characteristic textures; i.e., oily streaks and Schlieren textures.
Tan et al. [23] reported in 2015 that another azobenzene mesogen, this time combined with a hydrophilic polyethylene glycol tail, showed a thermotropic and a lyotropic SmC phase in mixtures with water, formamide and ethylene glycol. They investigated the system by both POM and XRD. For ethylene glycol, the maximum solvent uptake before phase separation was found to be about 50 wt%. The phase diagram shows, that the SmC phase is even stabilized by the addition of ethylene glycol, increasing the thermal phase width from 13 to 18 K. While the molecule behaves similar in mixtures with formamide, the SmC phase is reduced to a thermal width of only 2 K in a water saturated mixture. Investigations of the layer spacing at different concentrations of ethylene glycol show the typical behavior known from thermotropic SmA to SmC phase transitions with an increase of the layer spacing in Lα phase, due to the decreasing orientational order at increasing temperature, and a decrease of the layer spacing in the SmC phase which is connected to the increasing tilt angle. Most remarkable, is that the layer spacing at the phase transition temperature is increased from roughly 5.4 nm in the neat state to 11.7 nm in the ethylene glycol saturated state, giving evidence that a considerable solvent layer is formed between the amphiphile bilayers.
In the same year, an interesting report about hyper-swollen SmA and SmC phases was published by Murase et al. [24]. Once again, the mesogen included a rigid aromatic core and showed amphiphilic behavior. However, contrary to the examples discussed before, the mesogen had no hydrophilic, but instead, a fluorophilic tail, as shown in Figure 8a. Thus, mixtures of the amphiphile with three different perflourinated solvents (e.g., Figure 8b) were investigated. Phase diagrams, such as the one in Figure 8c, were recorded by observation of characteristic textures; i.e., the dark homeotropic texture of the SmA or Lα phase with a few defects and the Schlieren texture of the SmC phase. In all cases, the SmC phase got destabilized by the addition of the perfluorinated solvent, but still appeared in a narrow temperature range at solvent mass fractions higher than 50 wt%. They investigated the temperature-dependent layer spacing for different concentrations and found striking differences for the three solvents. Mixtures of the mesogen with elongated solvents, as shown in Figure 8b, exhibit an almost monotonic increase of the layer spacing with increasing solvent concentration. Within the concentration range of the SmC phase, the layer spacing is roughly tripled in dimension. In contrast to this, mixtures of the more spherically shaped solvent perfluorodecalin did not show a substantial increase of the layer spacing with increasing concentration of the solvent. The authors showed by careful processing of their X-ray data, that the elongated solvent molecules were incorporated in between the partial bilayers of the amphiphiles, while in the perfluorodecalin molecules were localized within the amphiphile bilayers. This case does not meet the common understanding of a lamellar phase, while the others do. Furthermore, the authors speculated about possible mechanisms for the long-range correlation of the tilt across the solvent layers, but did not find a conclusive explanation.
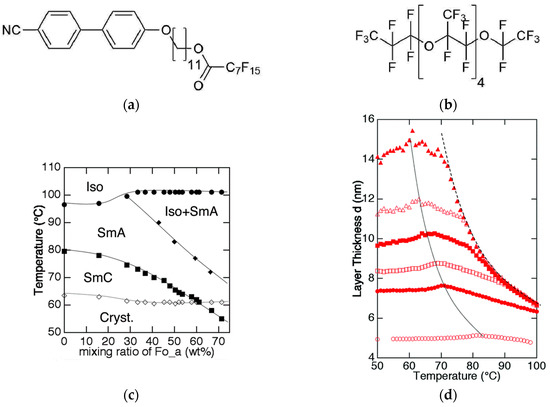
Figure 8.
(a) Chemical structure of the mesogenic perflourinated cyano biphenyl. (b) Examples of one of the perflourinated solvents used, (c) the corresponding phase diagram and (d) the temperature-dependent layer spacing d(T). The mesogen to solvent ration in (d) gradually changes from 1:2 (filled triangles) to 2:1 (filled circles). The layer spacing of the neat mesogen in depicted with open circles. (Reprinted by permission from RCS Publishing: [24].)
Finally, “true” lyotropic SmC-phases, which are formed only in the presence of a solvent, and thus, do not exist in the neat state of the amphiphile, are the least common case. In this case, the presence of the solvent is a necessary condition for the formation of the tilted lamellar mesophase and not just a destabilizing factor of a formerly thermotropic SmC phase, as in the cases of swollen and hyper-swollen smectics. Therefore, these truly lyotropic SmC phases are the most interesting to study and are in the focus of this review.
Until 2013, there were only two proven reports of truly lyotropic SmC phases. The first publication was by Schaheutle and Finkelmann and was published in 1988 [25]. They investigated a series of amphiphiles with rigid hydrophobic moieties and varying lengths of hydrophilic ethylene glycol units (see Figure 9a). Originally interested in the effects of packing constrains on the shape of micelles, they found that the amphiphiles formed lamellar mesophases only. In all three cases, SmC phases were observed in the presence of water, while there were no liquid crystalline phases in the neat states. They verified the structural analogy of this lyotropic phase with the known thermotropic SmC phase by X-ray diffraction measurements. In Figure 9b, a reprint of this measurement is shown. The two-dimensional diffraction pattern shows the typical features of a fluid, lamellar and tilted phase, i.e., diffuse scattering maxima in the wide angle regime, sharp layer peaks in the small angle region and an azimuth angle differing from 90° between the two of them. Even though the tilt angle measurable from this diffraction pattern is only a couple of degrees, it is clearly observable. Comparing amphiphiles with varying hydrophilic-hydrophobic balances, the authors found that the molecule with the shortest polyethylene glycol chain forms the most stable lyotropic SmC phase in a concentration regime between roughly 30 and 70 wt% of surfactant. By increasing the chain length, the concentration range, in which the tilted phase occurs, is diminished and shifted to higher mass fractions of surfactant. In Figure 9c the phase diagram of the investigated amphiphile with an intermediate chain length and water is shown as an example.
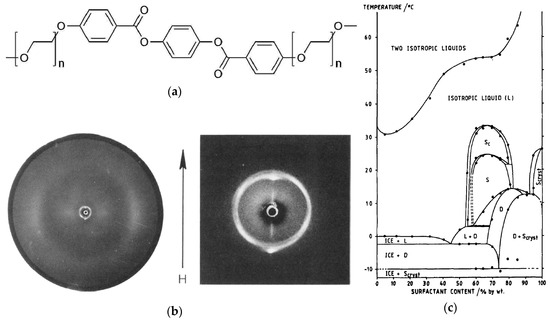
Figure 9.
(a) A rigid aromatic core is combined with two polyethylene glycol units on each end, varying from n = 5 to n = 7. (b) Two-dimensional X-ray diffraction pattern of a magnetic-field aligned sample with 70 wt% percent of the amphiphile with n = 6 at 26 °C. The arrow indicates the direction of the magnetic field (H). The phase diagram corresponding to this system is shown in (c). The lyotropic SmC phase is denoted as ‘SC’ in this diagram; ‘S’ and ‘D’ stand either for a supposedly higher ordered smectic or dystetic (i.e., Lα) phase, respectively. (Reprinted by permission form Taylor and Francis Ltd.: [25].)
In spite of Schafheutle’s and Finkelmann’s outstanding discovery, it took slightly more than a decade until a further example of a truly lyotropic SmC phase was published. Ujiie and Yano [26] reported the occurrence of a lyotropic SmC phase in mixtures of an ionic amphiphile and water. The amphiphile incorporates a rigid hydrophobic azobenzene unit which is connected to a polyethylene imine chain by a hexamethylene linker. To every imine moiety, a 2-hydroxy ethane group is attached, providing the necessary hydrophilicity. The molecule exhibits a thermotropic SmA phase at elevated temperatures. By adding water, the melting point of the system decreases significantly, but the SmA phase, which turns into a Lα phase, stays stable up to a mass fraction of surfactant as low as 20 wt%. At lower temperatures, in the concentration range between roughly 15 and 75 wt%, the lyotropic SmC phase occurs. The authors provide evidence of the lamellar and fluid nature of this phase by a one-dimensional X-ray diffraction pattern, and for the director tilt by a picture of the typical Schlieren texture.
In addition to those two cases, a further amphiphile was reported to show a true lyotropic SmC phase [27]. However, later investigations revealed that the supposed lyotropic SmC phase was in fact an oblique columnar phase [28].
In view of the very small number of lyotropic SmC phases reported, which only form in the presence of a solvent, one can easily understand why the search for a chiral variant of this rare phase took so long. On the one hand, the missing experience with the design of lyotropic SmC phases, and on the other hand, the more demanding synthesis of chiral components, made it quite difficult to find promising amphiphiles. Furthermore, the knowledge from the often separated research fields of lyotropic and thermotropic liquid crystals had to be combined, to handle the more complicated sample preparation of lyotropic systems and notice the characteristic features of a chiral lyotropic SmC* phase.
3. The Recognition of a First Lyotropic SmC* Phase
In 2013, the discovery of a chiral, lamellar tilted and fluid phase—a true lyotropic SmC* phase—was reported for the first time [29]. The phase is formed by the chiral amphiphile shown in Figure 10a. Without solvent, the amphiphile does not form any stable liquid crystal phase, but after the addition of water or formamide, several lyotropic mesophases appear (Figure 10b).
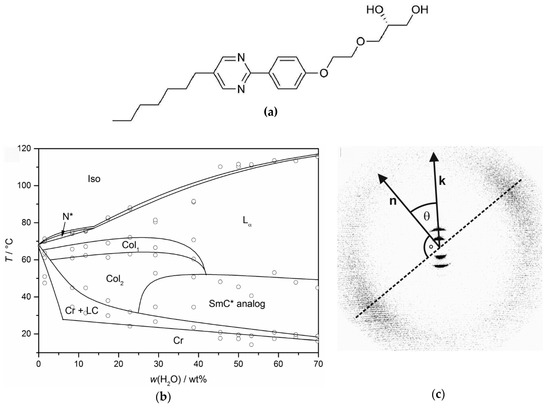
Figure 10.
The chiral diol depicted in (a) forms true lyotropic SmC* phases in mixtures with water and formamide. (b) The phase diagram with water exhibits a cholesteric (N*), two different columnar phases (Col1 and Col2), a Lα phase and the lyotropic SmC* phase. (c) A two-dimensional X-ray diffraction pattern of the aligned phase provides clear evidence that the probed lyotropic phase possesses a structure analogous to the thermotropic SmC* phase. (Phase diagram reprinted by permission from John Wiley and Sons: [29]; X-ray pattern reprinted by permission from Springer Nature: [13].)
The two-dimensional X-ray diffraction pattern of a magnetically aligned sample with 64 wt% water which is depicted in Figure 10c, proves without doubt that this is truly a structural equivalent to the thermotropic SmC or SmC* phase. The sharp, Bragg-like peaks of 1st and 2nd order in the small angle region clearly show that the phase is lamellar; the diffuse maxima in the wide angle region attest that it is fluid; and the azimuth angle between the two of them deviates by 90°, confirming that the surfactant molecules within the fluid bilayers are tilted with respect to the layer normal k. Evidently, the tilt directions are long-range correlated, at least over the macroscopic length scale of the scattering volume. A distinction between the chiral and achiral SmC phase is not possible from X-ray diffraction alone.
Furthermore, the lyotropic SmC* phase exhibits the same characteristic textures as those known from its thermotropic counterpart. In Figure 11, striking examples of this similarity in terms of textures are given. The Schlieren texture in Figure 11a underlines that the phase is biaxial and the zigzag defects [30] in Figure 11b indicate a substantial layer shrinkage at the Lα to lyo-SmC* phase transition. Most remarkable is that the lyo-SmC* phase can be surface stabilized (Figure 11c,d), just as the thermotropic SmC* phase (cf. Figure 4c). The rotation at about two times the optical tilt angle, exchanges the brightness of the tilt domains between crossed polarizers.
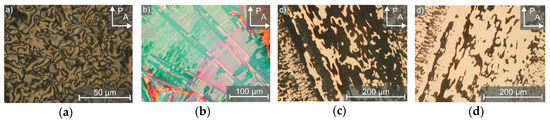
Figure 11.
Typical textures of the lyotropic SmC* phase observed by polarized optical microscopy. In thicker samples (a) Schlieren textures and (b) broken fans with zigzag defects appear. (c) In the surface stabilized state, bright and dark domains in the range of several hundred micrometers with opposite tilt directions can be observed. (d) By rotating the sample between crossed polarizers (P and A), the brightness of the tilt domains reverses. (Reprinted by permission from John Wiley and Sons: [29].)
Even more impressive than the long-range correlation of the director tilt, is that even the subtler precession of the tilt direction along the layer normal k is transmitted across the interlamellar solvent layers, resulting in a macroscopically observable chirality. This helical director modulation causes a striped pattern, as exemplarily shown in Figure 12a for a sample with 32 wt% of formamide. The distance between two of these so-called pitch lines is equal to the full pitch, the magnitude of which is in the same order as in thermotropic SmC* phases. By plotting the pitch versus the temperature, (Figure 12b) an exponential increase of the values is observed when approaching the Lα phase. This is again, a typical behavior known from the thermotropic SmC* phase [31,32,33].
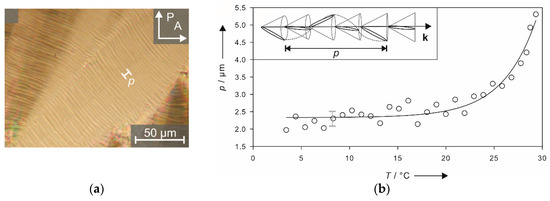
Figure 12.
The striped texture shown in (a) originates from a helical precession of the tilt direction along the layer normal k which is depicted in the inset of (b). The distance necessary for a full rotation of the director corresponds to the helical pitch p, which is plotted versus the temperature T in (b). (Reprinted by permission from John Wiley and Sons: [29].)
Measurements of the helical twist in dependence of the formamide mass fraction show a trend which is at the first glance counterintuitive, as the twist (the inverse pitch) increases with increasing solvent concentration (Figure 13). Osipov et al. [34] presented a possible explanation, as follows: The twisting is promoted by the chiral centers and counteracted by an elastic force, the effective elastic constant of which is known to be proportional to sin2θ. If we add solvent, the volume density of chiral centers decreases linearly, while the tilt angle decreases at least linearly with the solvent concentration (cf. Figure 19). In this case, the restoring force decays more strongly than the twisting power, and thus, an increasing twist is observed. Nevertheless, this explanation has still to be verified by further experiments.
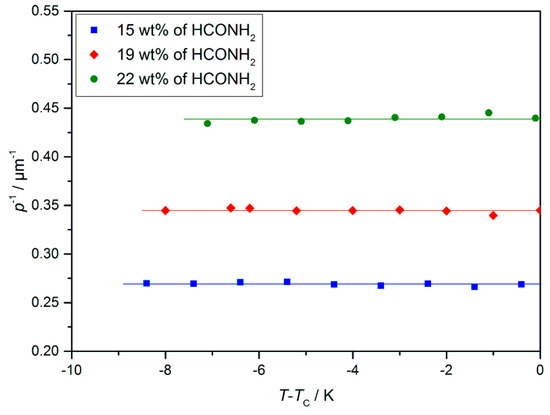
Figure 13.
Helical twist p−1 of the lyo-SmC* phase for different mass fractions of formamide measured by the Cano method [34]. While a strong increase of the twist was measured with increasing solvent content, no temperature dependence was observed. Most likely, the latter is due to a pinning effect between liquid crystalline phase and the glass surfaces of the measurement set up. (Reprinted by permission from Springer Nature: [13].)
The most prominent chirality effect in thermotropic SmC* is the spontaneous electric polarization of its smectic layers (cf. Figure 3). So far it was not possible to directly measure this spontaneous polarization in a lyotropic SmC* phase, since its current response to an electric field is dominated by its high electric conductivity. The relatively high conductivity of the lyotropic phase originates from residual ions which cannot be fully avoided in the solvent layers containing water (autoprotolysis) or formamide (hydrolysis to NH4+ and HCOO− [35,36]). Instead, the presence of a spontaneous polarization in lyo-SmC* phase was indirectly confirmed by its polar electro-optic switching in the SSFLC state between crossed polarizers. Just as in the thermotropic case, the transmittance of the sample depends on the sign of the electric field (Figure 14), while any dielectric effect is proportional to E2, and thus, insensitive to the sign of E [29].
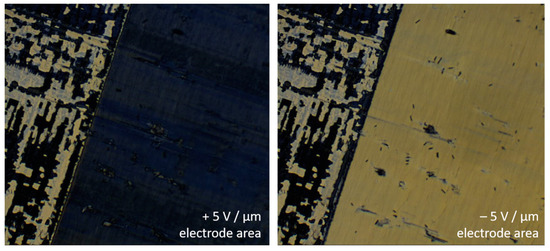
Figure 14.
Polar electro-optic effect of a lyotropic SmC* phase in the SSFLC geometry (4 with 20 wt% formamide at 28 °C in a 1.6 µm thick cell). The directions of the spontaneous polarization and director tilt depend on the sign of the applied electric field. Therefore, the transmittance of the sample depends on the sign of E. Outside the electrode area (upper left corner) the tilt domain texture of the virgin sample can be seen.
4. Prerequisites and Properties of Lyotropic SmC* Phases
4.1. Lyotropic SmC* Systems—A Delicate Balance
Since and even before the discovery of the first example of a lyotropic SmC* phase, there were constant research efforts—especially in and around the soft matter group in Stuttgart—to find a lyotropic analog of the thermotropic SmC* phase. As discussed in Section 1.2, the first and fundamental challenge was to identify the structural features necessary on a molecular basis for the formation of the lyo-SmC phase. For this, the early examples—namely, the lyotropic systems from Schafheutel and Finkelmann [25], Ujiie and Yano [26] and Pietschmann et al. [27]—were used as templates, although the last example turned out not to form a lyotropic SmC phase later on [28]. All of these model systems share certain common features, which are:
- A rigid aromatic core;
- A polar head group which is attached to the core by a slightly hydrophilic linker (e.g., ethylene glycol units);
- Another flexible chain attached to the other side of the core;
- Water as solvent.
Based on those observations, the amphiphiles listed in Table 1 were synthesized by Porada [28,29] and the Lemieux group [37,38,39]. All of the molecules incorporate a diol head group, a rigid aromatic core and a hydrophobic alkyl chain. Furthermore, the 1,2-diol head group introduces chirality to the molecules. Often, the amphiphiles only differ in the linker length between the diol group and the aromatic core, the number of oxygen atoms or the nature of the aromatic core. These slight variations allow a systematic analysis of the factors necessary for the formation of the lyotropic SmC* phase.

Table 1.
Summary of the amphiphiles which were screened for the lyotropic SmC* phase. Thermo-tropic liquid crystalline (TLC) phases that occur are listed, as are solvents tested during screening which enable the formation of a lyotropic SmC* phase.
The molecules 1 to 8 all possess a phenyl pyrimidine core which is a promoter for the formation of tilted phases in thermotropic liquid crystals [40,41], a hydrophobic heptyl chain or a diol head group. Variations were only made in the linker between the head group and the aromatic core. Amphiphile 4 is the one presented in Section 3 already. Next to water (cf. Figure 10b) it forms a lyotropic SmC* phase with formamide, too. The phase diagram depicted in Figure 15, reveals that the same mesophases occur as found in mixtures with water. However, the N*, the Col1, the Col2 and the lyo-SmC* phases appear in a much more confined concentration range for the benefit of the Lα phase. While the lyo-SmC* phase is stabilized between roughly 25 and 70 wt% of water, it appears in mixtures with formamide only between 7 and 25 wt% of formamide. This finding underlines the importance of the solvent for the stability of the tilted phase.
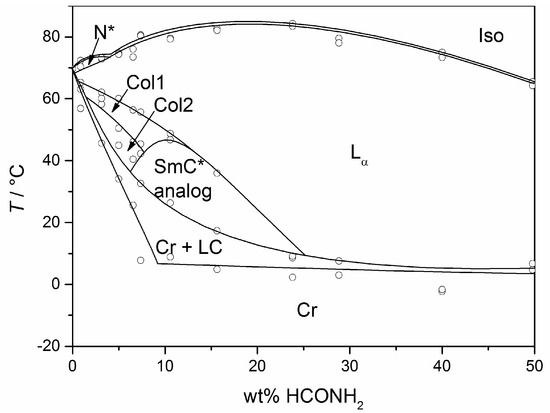
Figure 15.
Phase diagram of the system 4/formamide measured in heating. Next to the lyotropic SmC* phase (SmC* analog), a cholesteric (N*), two columnar (Col1, Col2) and a rather pronounced lamellar Lα phase occur. (Reprinted by with permission from Springer Nature: [13].)
Elongating the linker by one ethylene glycol unit leads to 5. Instead of a monotoropic N* phase, this amphiphile forms a monotropic SmA* phase in the neat state which is substantially stabilized by the addition of water (Figure 16(a-a)). Moreover, a lyotropic SmC* phase forms, which was identified by the typical broken fan and schlieren textures (Figure 16(a-b–a-d)). No columnar or cholesteric phases occur in the phase diagram shown in Figure 16b. Another difference to the parent amphiphile 4 is that the lyotropic SmC* phase is only stable in mixtures with water, but not with formamide. Furthermore, the phase occurs only between 10 to 20 wt% of water. Overall, the lyotropic SmC* phase is destabilized in comparison to the parent systems with amphiphile 4.
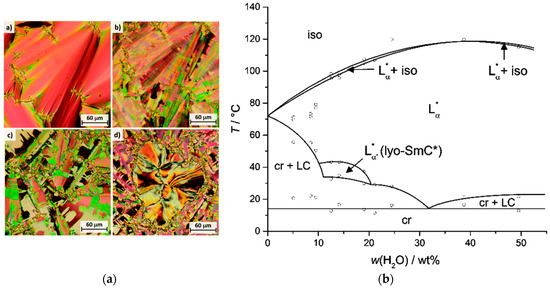
Figure 16.
Mixtures of the amphiphile 5 with 19 wt% water show characteristic textures, as is known from thermotropic systems while cooling: (a-a) fan texture of the Lα* phase, (a-b) broken fan texture of the lyo-SmC* phase, (a-c) well defined tilt domains of the lyo-SmC* phase at lower temperatures and (a-d) Schlieren texture of the lyo-SmC* phase surrounded by the broken fan texture. (b) Phase diagram of 5 with water. (Reprinted by permission from the Royal Society of Chemistry: [37].)
If the linker consists of three ethylene glycol units (6), no lyotropic SmC* phase is detected at all. Instead an enatiotropic mesophase—SmA* phase—is formed in the neat state for the first time. Comparing the amphiphiles 4, 5 and 6 suggests that the length of the linker is essential for the formation of the lyotropic SmC* phase. The linker in 4 seems to have the optimum length for stabilizing the lyo-SmC* phase.
For the amphiphiles 1, 2 and 3, the ethylene glycol unit is replaced by a simple alkyl chain which is attached to the aromatic core by a single ether unit. Even though all three amphiphiles form a variety of lyotropic liquid crystal phases, they neither form any thermotropic phases nor a lyotropic SmC* phase. Especially for 3, this is remarkable, considering that the only difference to 4 is the exchange of an oxygen atom in the linker by a CH2-moiety. The change of the molecular length and the flexibility of the linker due to this alteration are negligible. Thus, the most reasonable explanation is, that the modification in the hydrophilicity—namely the ability of the oxygen atom in the linker to accept hydrogen bonds—has a major impact on the formation of the lyotropic SmC* phase.
The amphiphile 8 is composed of the same alkyl tail, diol head group and linker as the amphiphile 4. However, the aromatic core is inverted compared to the original molecule. This simple switch in the position of the pyrimidine and the phenyl rings has a major impact on the mesophase behavior of the amphiphile. In the solvent free state, 8 exhibits a SmA* and a SmC* phase. Both mesophases stay stable upon the addition of water or formamide up to roughly 50 wt%. No further lyotropic liquid crystal phases were detected.
The amphiphiles 9–12 all incorporate the same diol head group and linker as the amphiphile 5. The phenyl pyrimidine core, however, is substituted by a 2,7-fluorenone core which is known to be an even stronger SmC-promoter in thermotropic smectics [42,43]. From 9 to 11, the hydrophobic alkoxy tail is elongated. With the shortest hydrophobic chain—a butoxy chain (9), neither a thermotropic mesophase nor a lyotropic SmC* phase forms. Elongating the chain by one methylene unit (10) leads to the appearance of a SmA* phase in the neat state, but only the elongation by two carbon atoms (11) allows the formation of lyotropic SmC* phase with water and formamide. The latter amphiphile already exhibits a SmC* and a SmA* phase in the solvent free state. The phase diagram of the system 11/formamide is presented in Figure 17a and reveals that the thermal stability of the SmC* phase is gradually decreased by the addition of formamide.
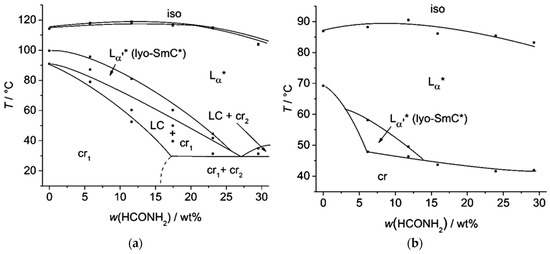
Figure 17.
(a) Already in the neat state, the amphiphile 11 exhibits a SmA* and a SmC* phase. In mixtures with formamide, the orthogonal phase is stabilized while the tilted phase is destabilized, but remains present up to 25 wt% of solvent. (b) The amphiphile 12 shows only a monotropic lyo-SmC* phase. Thus, the phase diagram measured while cooling is presented here. During heating, the temperature and concentration range in which the phase occurs is superposed by a two-phase region of crystalline and liquid crystalline phases. (Reprinted by permission from the Royal Society of Chemistry: [37].)
In the amphiphile 12, one terminal hydrogen atom of the alkyl tail in 11 is replaced by a chlorine atom. The terminal chloro substituent, which favors orthogonal versus tilted phases [44], suppresses the thermotropic SmC* phase and increases the thermal stability of the SmA* phase. The lyotropic SmC* phase is reduced to a monotropic phase. Thus, the phase diagram shown in Figure 17b was measured during cooling.
Concluding this section, it is obvious that every structural subunit of the amphiphiles plays an important role in the formation of the lyotropic SmC(*) phase. Minor changes in the hydrophilic linker, the hydrophobic chain or the aromatic core easily lead to the appearance or disappearance of the tilted lamellar phase.
4.2. Structure and Phase Transitions of Lyotropic SmC* Phases
In Section 3 of this review, a two-dimensional X-ray pattern of the lyotropic SmC* phase (cf. Figure 10c) proved that the structure of the lyotropic SmC* phase is an analog to its thermotropic equivalent. To address the question of how the amount of solvent affects the structural parameters of the phase, temperature and concentration-dependent measurements of the system 4/formamide are shown in Figure 18 [13]. For all mixtures investigated a temperature-dependent d(T) characteristic of thermotropic SmA(*) to SmC(*), phase transitions were found: In the Lα phase the lamellar repeat unit d increases with increasing temperatures due to the decreasing orientational order. The maximum is reached at the transition from the lamellar Lα to the lyotropic SmC* phase. By further heating the lamellar repeat unit decreases again, which can be explained by an increasing value of the tilt angle.
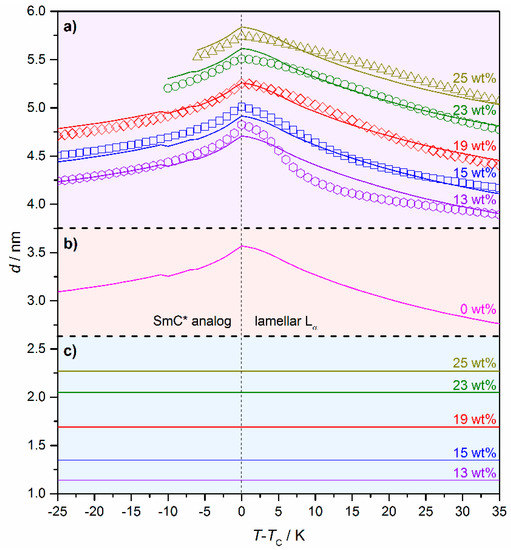
Figure 18.
(a) Temperature and concentration-dependent measurements of the lamellar repeat unit d of the system 4/formamide. The weight fraction w of formamide is given in the graph. Measured data points are depicted as symbols, while the lines represent fits according to the Equations (2) and (3). (b) Calculated thickness of the amphiphile bilayer dbl(T) of a hypothetic SmC* phase in the neat state. (c) Calculated solvent layer thickness ds(w) for the different weight fractions w of formamide. (Reprinted by permission from Springer Nature: [13].)
A second observation is, that the addition of solvent shifts the d(T) curves to higher values but does not change their principal shape. To describe these observations in a more quantitative way, we assume that the lamellar repeat unit d is composed of two additive contributions:
- The thickness of the solvent layer ds, which mainly depends on the mass fraction w of solvent;
- The thickness of the amphiphile bilayer dbl, which changes with the temperature T.
The total repeat unit d(T,w) can, thus, be written as:
with
where the slope m denotes the increase in solvent layer thickness per wt% of solvent.
d(T,w) = ds(w) + dbl(T),
ds(w) = mw,
The measured data points were fitted to these equations resulting in the continuous lines in Figure 18a. From that, the thickness of the pure bilayer dbl(T) (Figure 18b) and the thickness of the solvent layers ds(T) for the different mass fractions (Figure 18c) were separated from each other. The reasonable agreement of the measured data and the fits in Figure 18a imply that the solvent molecules form a separate layer between the amphiphile bilayers and do not penetrate them. Furthermore, it allows an estimation of the solvent layer thickness. For example, in a sample of 4 with 25 wt% of formamide, the solvent layer is roughly 2.3 nm thick, while the amphiphile bilayer ranges between 3.3 and 3.6 nm.
The foremost difference between Lα and the lyotropic SmC* phase, is the collective tilt of the elongated molecules relative to the layer normal. The presence of the tilt was already verified by X-ray diffraction (cf. Figure 10c) and polarizing optical microscopy (cf. Figure 11c,d). In Figure 19 the optical tilt angle θopt of the system 4/formamide is plotted against the relative temperature for different mass fraction of formamide [45]. For all samples investigated, the tilt angle seems to saturate at lower temperatures. This saturation value decreases with increasing mass fractions of formamide, from about 27° at 13 wt% to 12.5° at 25 wt% of formamide. Moreover, the course of the measured values in dependence of the temperature changes with the concentration. At high solvent concentrations, the tilt discontinuously drops to zero in a first order phase transition to the Lα phase, while the transition is continuously second order at low concentrations [13]. This is a remarkable example of a solvent-induced change in the nature of a phase transition.
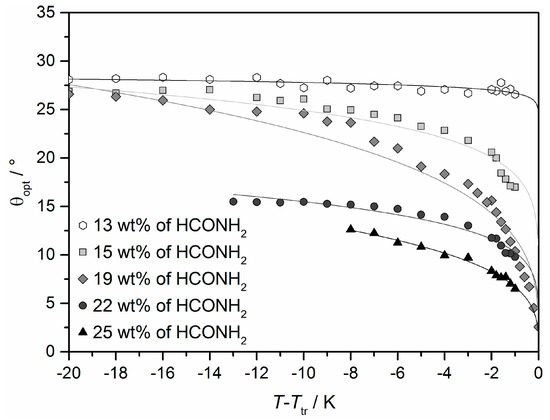
Figure 19.
Tilt angle θopt of the system 4/formamide measured by rotating a surface stabilized sample between crossed polarizers. The values were plotted relative to the temperature Ttr of the phase transition from the high temperature phase to the lyotropic SmC* phase. (Reprinted by permission from John Wiley and Sons: [45].)
A more detailed investigation of the phase transition from the SmC* analog phase to the high temperature phase was done by differential scanning calorimetry (DSC) [13]. The heat flows measured while cooling and heating are displayed in Figure 20; the discussed transition enthalpies are highlighted in yellow. For the lowest solvent concentration measured in the system 4/formamide, the mesophase above the lyotropic SmC* phase is a columnar phase. As already required by symmetry arguments, the heat flow measured confirms a 1st order phase transition. At formamide mass fractions between 12 and 22 wt%, the high temperature phase is the lamellar Lα phase. At 12 wt%, the peak is less pronounced than in the former case, but still suggests a phase transition close to 1st order. By increasing the formamide content further, the peak starts to flatten out more and more, only showing a step in the curves for 18 and 22 wt%. This suggests that the order of phase transition is shifted from 1st to 2nd with an increasing amount of solvent. With 27 wt% of formamide, only a non-tilted phase is formed.
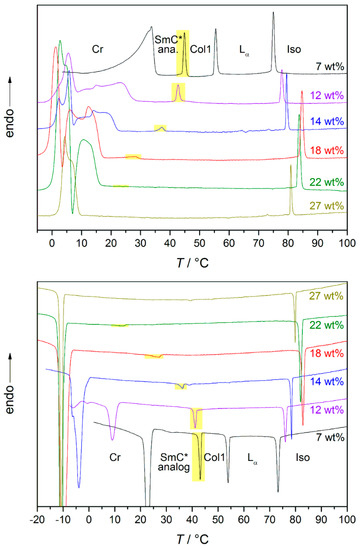
Figure 20.
DSC curves obtained while heating (top) and cooling (bottom) the system 4/formamide. The weight fraction of formamide is indicated in the graphs. The transition from the high temperature phase to the lyotropic SmC* phase is highlighted in yellow. In the sample with the smallest amount of formamide the high temperature phase is a columnar (Col1) phase. For the samples with 12 to 22 wt% of formamide, it is a Lα phase. In case of the sample with the highest formamide concentration, the only mesophase occurring is a Lα phase (cf. Figure 15). (Reprinted by permission from Springer Nature: [13].)
From the measured tilt angles and lamellar repeat units, and the estimated thickness of the amphiphile bilayer and the solvent layer a structural model of the lyotropic SmC* phase was sketched [13]. In Figure 21, a true to scale model of the lyotropic SmC* phase of the system 4/formamide with 19 wt% of formamide 10 K below the phase transition from the Lα phase is shown. As depicted, the amphiphile bilayers consist of partial bilayers with a significant interdigitation of the hydrophobic parts. The formamide is not mixed within the amphiphile bilayers but forms separate, well-defined solvent layers. Thus, the amphiphile molecules from different bilayers are not in direct contact with each other, which raises the question once again, of how the long-range correlation of the director tilt across the solvent layers takes place.
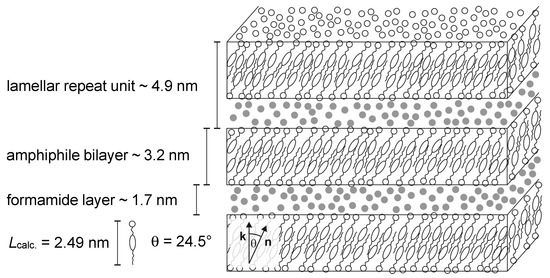
Figure 21.
Model of the lyotropic SmC* phase for the system 4/formamide. The model suggested by Bruckner et al. is based on their measurements shown in Figure 18 and Figure 19 and the length Lcalc. of the amphiphile calculated by molecular modeling. The sketch corresponds to a sample with 19 wt% of formamide (•) at T − Ttr = −10 K. (Reprinted by permission from Springer Nature: [13].)
4.3. Origin of the Director Tilt
To learn more about the origin of the director tilt and its long-range correlation, the orientation of the C–N pyrimidine vibration which is directed along the long molecular axis of 4 was selectively probed by polarized micro-Raman spectroscopy [45]. For this a mixture of amphiphile 4, 15 wt% of formamide was used. The mean direction of the C–N vibration is found to be tilted with respect to k and its tilt angle is in good agreement with the director tilt angle optically measured under the same conditions. Thus, the authors concluded that the origin of the tilt in the lyotropic SmC* phase is a tilt of the aromatic 2-phenylpyrimidine core relative to the layer normal.
However, this still does not explain how the tilt direction is transmitted between adjacent bilayers. To clarify the long-range correlation of the director tilt, the authors made use of an observation mentioned in the Dection 4.1 already: the appearance or disappearance of the lyotropic SmC* phase by simply changing the solvent. Thus, different solvents were tested for their ability to stabilize the lyotropic SmC* phase. The solvents and some of their physical data are listed in Table 2.
Table 2.
Physical data of the solvents which were tested for the formation of a lyotropic SmC* with the amphiphile 4. (Adapted from [13].)
As discussed before, the amphiphile 4 forms a lyotropic SmC* phase in mixtures with water and formamide. The corresponding phase diagrams are depicted in Figure 22a,b once again, for comparability. By changing the solvent from water to formamide, the concentration and temperature range in which the tilted phase occurs is reduced significantly. Exchanging the solvent to N-methyl formamide (NMF), leads to the disappearance of the lyotropic SmC* phase and the two columnar phases (Figure 22c). Moreover, the stability of the lamellar Lα phase is reduced with increasing mass fraction of NMF. When the solvent is replaced by N,N-dimethyl formamide (DMF), only a N* phase appears (Figure 22d).
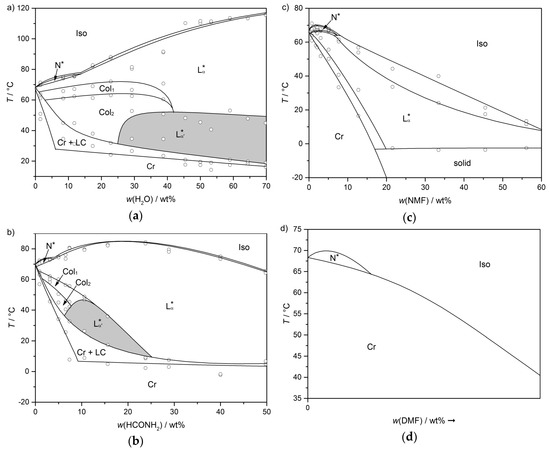
Figure 22.
Phase diagrams of the amphiphile 4 with (a) water, (b) formamide, (c) N-methylformamide and (d) N,N,-dimethylformamide. The ability of the solvent to stabilize lyotropic mesophases in general—and the lyotropic SmC* phase in particular—is diminished in the order of presentation. For the system 4/DMF, only a schematic phase diagram is presented, which was derived by investigation of a contact sample. (Reprinted by permission from John Wiley and Sons: [45].)
Neither the dielectric permittivities, nor the dipole moments listed in Table 2 may explain this trend. Therefore, pure electrostatic interactions between adjacent amphiphile bilayers cannot explain the long-range correlation of the director tilt in an obvious way. A quantity which follows the trend observed experimentally is the number of hydrogen bond donor atoms. Since all four solvents can accept up to two hydrogen bonds, water and formamide are known to form extended hydrogen bond networks in the liquid state, while NMF only forms chains of hydrogen bonds and DMF no hydrogen bonds with itself. Thus, the authors conclude, that anisotropic hydration interactions which are mediated by a dense three dimensional hydrogen bond network might be responsible for the correlation of the tilt direction in adjacent bilayers [45]. In general, hydration forces have already been known for phospholipids forming lyotropic lamellar phases [48,49,50,51,52,53,54], but have never been observed in combination with lamellar, fluid and tilted phases. Several studies show that the orientational ordering of water molecules by the phospholipid head groups can bridge a distance of up to 1 nm [55,56,57,58,59,60].
Solvents other than water and formamide which hold two hydrogen bond donor atoms are ethylene glycol and its polymers (PEG). Consequently, these solvents were investigated too [13]. In mixtures of amphiphile 4 and ethylene glycol, two columnar mesophases a N* and a Lα phase appear. Yet, a lyotropic SmC* phase is not stabilized. In mixtures with PEG 200 or PEG 300, the only stable mesophase is a cholesteric phase next to a monotropic Lα phase. In conclusion, the number of hydrogen bonds per solvent molecule cannot be the sole determining factor for the stability of the lyotropic SmC* phase. A second important factor is the density of the hydrogen bond network which is directly related to the number densities of the solvent molecules (Table 2) and the average number of hydrogen bonds per molecule.
To underline the importance of the hydrogen bond network further, the tilt angle in mixtures with ordinary formamide and deuterated formamide were compared [45], since deuteration selectively modifies the strength and dynamics of the hydrogen bond network. The result is shown in Figure 23. Even though the investigated mole fractions of formamide were the same, the saturation value of the sample with deuterated solvent was roughly 15% lower than in the equivalent sample with ordinary formamide. This is indeed, a quite substantial isotope effect which clearly confirms that the correlation mechanism is sensitive to the structure and dynamics of the hydrogen bond network in the solvent layers.
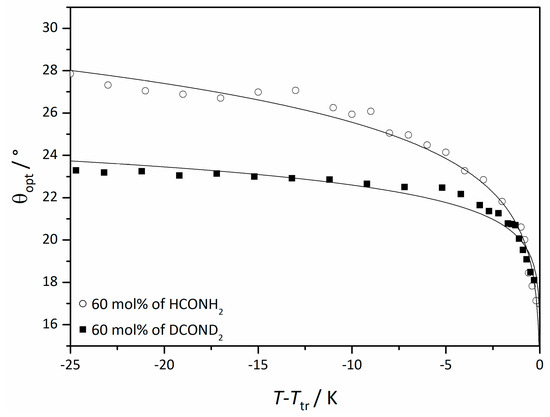
Figure 23.
Optically measured tilt angle of the system 4/formamide (circles) and 4/deuterated formamide (squares) at the same mole fraction relative to the phase transition temperature Ttr from the Lα phase. (Reprinted by permission from John Wiley and Sons: [45].)
An example which seems to contradict the importance of a strong hydrogen bond network for the long-range correlation of the tilt direction across the solvent layers, is the case of the hyper-swollen perfluorinated smectics [24] (cf. Section 2). The perfluorinated oils which are used for swelling do not form any hydrogen bonds at all. Nonetheless, the hyper-swollen SmC phase stays stable up to an oil content of 60 wt%. We suggest that the mechanism for the long-range tilt correlation with perfluorinated solvents is completely different. Due to the size of the fluorine atoms, a free rotation of the perfluorinated carbon chains is hindered [61,62]. Therefore, perfluorinated polymers are rather stiff and possess a significantly higher persistence length than unfluorinated polymers [63,64,65]. Therefore, we propose, that the two elongated perfluorinated polymeric oils (cf. Figure 8b) might possess enough rigidity to transmit the tilt direction sterically. This of course, has to be confirmed by experiments and/or simulations.
4.4. Electroclinic Effect
As we previously discussed in Section 1.1, the D∞-symmetry of a chiral SmA* phase excludes polar properties, such as a spontaneous polarization. The polarization-tilt coupling, however—present in all chiral smectics—gives rise to the so-called electroclinic effect [9,10], the properties of which resemble, in some aspects, the (inverse) piezoelectricity in non-centrosymmetric solid crystals. An electric field E along the SmA* layers induces an electric polarization P in a non-parallel direction to the layer normal k. In a chiral medium, the plane spanned by k and P is no mirror plane. As a result of E, the free energy and the distribution of molecular tilt directions are no longer symmetric about the k,P-plane and the macroscopic director n is, therefore, observed to tilt away from k in a direction normal to the k,P-plane. Similar to the field-induced mechanical strain in the inverse piezoelectric effect, the field-induced tilt angle δθ is linear in E and the direction of tilt reverses upon reversal of the field direction [9,10,11].
According to these symmetry arguments, the electroclinic effect must be present in all SmA* phases even though the effect might be very small. Indeed, a measurable electroclinic effect was only observed in the pretransitional regime of a second-order (or weak first-order) transition from the SmA* into the tilted SmC* phase. In that temperature regime, the electroclinically induced tilt δθ grows hyperbolically towards the critical temperature Tc ≤ TAC according to a Curie–Weiss-like behavior [10,11,66].
Since the symmetry arguments leading to the electroclinic effect in SmA* apply in the very same way to the lyotropic case of a chiral lamellar α-phase, there were several attempts to detect an electroclinic response in Lα*. A first indication was the observation by Jakli et al. that the chirality of phospholipids makes fluid lamellar phases piezoelectric [67,68]. The discovery of the lyo-SmC* phase however sheds new light on this issue: in 2017 Harjung et al. observed an electroclinic response in the Lα* phase of the amphiphile 4 with 23 wt% formamide at temperatures close to its transition into the newly discovered lyo-SmC* phase [69]. The samples were poured into a liquid crystal cell and a square-wave electric field was applied to its transparent ITO electrodes (Figure 24a). The field E(t) electroclinically induced an alternating tilt δθ(t), which gave rise to an essentially square-wave modulation I(t) of the light intensity transmitted through the cell between crossed polarizers (Figure 24b). The electroclinic electro-optic response completely vanished in the case of the corresponding non-chiral Lα phase composed of the racemic version of the amphiphile 4. At least beyond a certain threshold field in the order of 1 V/µm, the electroclinic tilt increased linearly with the field amplitude (Figure 25a) and grew hyperbolically if the temperature was lowered towards the transition temperature into the tilted ferroelectric lyo-SmC* phase (Figure 25b).
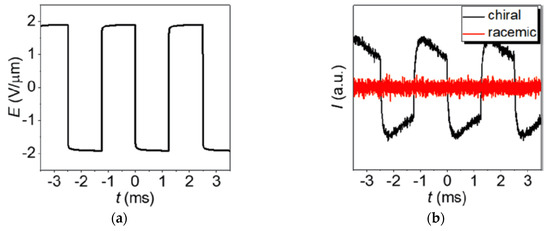
Figure 24.
Electroclinic electro-optic effect of a chiral lamellar α-phase in the vicinity to its transition into a tilted lyo-SmC* phase. (a) Square-wave electric field E(t) applied to lyotropic Lα(*) samples in a direction normal to the layer normal k. (b) Corresponding electro-optic response of the lyotropic samples between crossed polarizers measured by the transmitted light intensity I(t) at a temperature of 0.2 K above the transition into the tilted phase; black line: chiral Lα* phase of 4 with 23 wt% of formamide; red line: nonchiral Lα phase of racemic 4 with 23 wt% of formamide. (Reprinted by permission from [69] Copyright 2018 by the American Physical Society.)
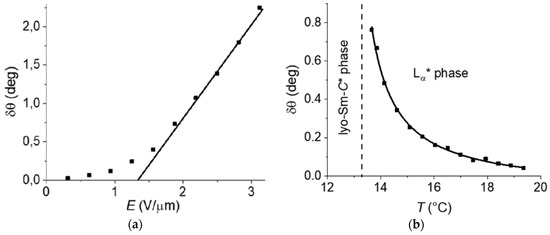
Figure 25.
Signatures of the electroclinic effect in the Lα* phase of the chiral amphiphile 4 with 23 wt.% of formamide. (a) Electroclinically induced tilt angle δθ versus amplitude E of a 400 Hz square-wave electric field at a fixed temperature of 0.5 K above the transition temperature into the lyo-SmC* phase. The straight line shows the linear regime of δθ(E). (b) δθ versus temperature T at a fixed amplitude E = 1.9 V/µm of the 400 Hz square-wave electric field. The solid line shows the Curie–Weiss-like hyperbolic divergence of δθ(T). (Reprinted by permission from [69] Copyright 2018 by the American Physical Society.)
The electroclinic effect in the Lα* phase, thus shows all signatures of the electroclinic effect in thermotropic SmA* phases, namely the effect (i) is chiral in nature, (ii) is essentially linear in the sign and magnitude of the electric field, and (iii) shows Curie–Weiss-like behavior in the pretransitional regime of a tilting transition into lyo-SmC* [69]. Beyond these striking similarities between the electroclinic effects in SmA* and Lα* there are also specific deviations, namely, the slow decay of the electro-optic response in Figure 24b, after switching and the non-linearity at low field strength in Figure 24a. The experiments in [69] indicate that these deviations are related to the comparatively high electric conductivity of lamellar phases which originates from the inevitable presence of ionic impurities in the highly polar and protic solvent layers. Under the action of an electric field, these ionic impurities accumulate at the interfaces between the solid electrodes and the liquid-crystalline electrolyte and form electric double layers which screen the external electric field, and thus reduce the effective field inside the liquid crystal layer. Since the electroclinic effect probes the effective field inside the lyotropic phase, the screening effect of electric double layers considerably complicates the dynamics of the electroclinic effect in Lα* phases.
All in all, 40 years after the discovery of the electroclinic effect in thermotropic SmA* it has now become clear that the same effect exists in chiral lyotropic Lα* phases as well. Since phospholipid cell membranes are in a fluid Lα* state, this observation might also have certain implications in biophysics.
5. Conclusions and Outlook
After the discovery of ferroelectricity in thermotropic liquid crystals in the 1970s, it has become evidently clear, in recent years, that the lyotropic equivalent to the thermotropic ferroelectric smectic C* phase indeed exists. The new lyo-SmC* phase shares many characteristic properties of its thermotropic counterpart:
- It has the same fundamental SmC structure; namlely, a 1D periodic layer structure of 2D-fluid bilayers with the liquid crystal director macroscopically tilted from the layer normal by typically 10–30 degrees.
- The lyo-SmC* phase has a helical ground state with a pitch typically in the micron range and textures showing pitch lines familiar from thermotropic SmC* phase.
- In thin samples the lyo-SmC* phase can be surface stabilized, showing ferroelectric tilt domains, sometimes prevaded by zig-zag defects, and it can be electrically switched between the two stable states just like a thermotropic ferroelectric SmC* sample.
- At higher temperatures and/or solvent concentrations, the lyo-SmC* phase often transforms into the chiral Lα* phase, the lyotropic equivalent of thermotropic SmA*. As in thermotropic SmC*–SmA* materials, the transition can be second order and an electroclinic effect is observed in the Lα* phase.
Beyond these convincing similarities, the new lyotropic SmC* phase is clearly distinguished from its thermotropic counterpart by the presence of water or water-like solvent layers between the bilayers of amphiphilic mesogens. This raises a lot of new questions which all address the specific role of the solvent. In comparison to thermotropic SmC*, the solvent concentration is an additional thermodynamic degree of freedom, and thus, an additional “control variable” in lyo-SmC*. Exploring how the solvent concetration changes properties, such as order parameters, elasticity, viscosity, pitch and polarization, will certainly involve new physics and lead to an improved understanding of interactions in lyotropic systems. In view of the surprising long-range tilt correlation in lyo-SmC*, the most challenging question is how not only the elastic interactions (tilt) but also the much weaker chiral interactions (twist) are transmitted through the interlamellar solvent layers. Evidently these interactions do transform the disordered solvent into partially ordered solvent. The further investigation of this subtle order is a most interesting subject and key to the detailed understanding of lyotropic SmC* phases. Even though there are already strong experimental indications that hydrogen bond networks in the solvent layers play an important role in the interlamellar correlation of tilt directions, more experimental and theoretical work is needed to really understand how elastic and chiral interactions are “communicated” across nanoscopic solvent layers. This might also be helpful in our further understanding of chirality effects in other soft matter and biological systems.
The tailored design of new lyo-SmC* phases remains a non-trivial task, since it relies on a detailed balance between hydrophilic, hydrophobic and tilt-promoting molecular interactions. As far as we know today, the formation of lyo-SmC* phases requires, on the one hand, protic water-like solvents which are able to form extended hydrogen bond networks, and on the other hand, rod-shaped amphiphiles terminated by a hydrogen-bonding hydrophilic head group that is able to connect to the hydrogen bond network of the solvent. The molecular structure of the amphiphile further contains a rigid tilt-promoting core which is linked to the head group by a slightly hydrophilic spacer chain. The further proof and extension of this rather specific design concept is a future challenge for synthetic liquid crystal chemistry.
Last but not least, all attempts to measure the actual values of spontaneous polarization in lyo-SmC* phases by field-reversal, dielectric or pyroelectric techniques have failed so far, due to the high electrolytic conductivity of lyo-SmC* phases originating from the mobile ionic impurities located in the solvent layers. Since Ps is the key parameter of any ferroelectric material, this situation is highly unsatisfactory and it remains another future challenge to directly measure the spontaneous polarization in an electrolytically conductive medium.
In terms of possible applications, the use of the lyo-SmC* phases in displays—as known from its thermotropic counterpart—namely, in SSFLC devices [70], is not very promissing, considering the high electrolytic conductivity and the potential leakage of the solvents. At the same time, the solvent opens new perspectives; e.g., in chirality sensing. For instance, the enantiomeric excess of physiologically-important, watersoluble drug molecules might be probed by their effect on the electo-optic switching time. In addition, the discovery of the elctroclinic effect in Lα* has certain implications in the biophysics of cell membranes, since these are in a lamellar α state and contain substantial amounts of chiral inclusions; e.g., cholesterols and membrane proteins.
All in all, the recent discovery of the lyotropic equivalent to the thermotropic ferroelectric SmC* phase has not only bridged a long-standing gap between the worlds of thermotropic and lyotropic liquid crystals, it also opened new research directions to the understanding of solvent-mediated chirality effects in lyotropic and biological systems.
Author Contributions
Both authors contributed equally.
Funding
Parts of our research were funded by Deutsche Forschungsgemeinschaft, DFG Gi 243/4, and Landesgraduiertenförderung of the state Baden-Württemberg.
Acknowledgments
Mikhail Osipov, Friederike Knecht and Marc Harjung are gratefully acknowledged for valuable discussions and input.
Conflicts of Interest
The authors declare no conflict of interest.
References
- Lines, M.E.; Glass, A.M. Principles and Applications of Ferroelectrics and Related Materials; Oxford University Press: Oxford, UK, 2001; ISBN 978-0-19850778-9. [Google Scholar]
- Valasek, J. Piezo-Electric and Allied Phenomena in Rochelle Salt. Phys. Rev. 1921, 17, 475–481. [Google Scholar] [CrossRef]
- Meyer, R.B.; Liebert, L.; Strzelecki, L.; Keller, P. Ferroelectric Liquid Crystals. J. Phyique Lett. 1975, 36, 69–71. [Google Scholar] [CrossRef]
- Meyer, R.B. Ferroelectric Liquid Crystals; a Review. Mol. Cryst. Liq. Cryst. 1977, 40, 33–48. [Google Scholar] [CrossRef]
- Lagerwall, S.T. Ferroelectric Liquid Crystals. In Handbook of Liquid Crystals; Goodby, J.W., Collings, P.J., Kato, T., Tschierske, C., Gleeson, H.F., Raynes, P., Eds.; Wiley-VCH: Weinheim, Germany, 2014; Volume 4, ISBN 978-3-527-32773-7. [Google Scholar]
- Takezoe, H.; Cepic, M. Antiferroelectric Liquid Crystals. In Handbook of Liquid Crystals; Goodby, J.W., Collings, P.J., Kato, T., Tschierske, C., Gleeson, H.F., Raynes, P., Eds.; Wiley-VCH: Weinheim, Germany, 2014; Volume 4, ISBN 978-3-527-32773-7. [Google Scholar]
- Takezoe, H.; Eremin, A. Bent-Shaped Liquid Crystals; CRC Press: Boca Raton, FL, USA, 2017; ISBN 978-1-4822-4759-6. [Google Scholar]
- Lagerwall, S.T. Ferroelectric and Antiferroelectric Liquid Crystals; Wiley-VCH: Weinheim, Germany, 1999; p. 129. ISBN 3-527-29831-2. [Google Scholar]
- Garoff, S.; Meyer, R.B. Electroclinic Effect at the A—C Phase Change in a Chiral Smectic Liquid Crystal. Phys. Rev. Lett 1977, 38, 848–851. [Google Scholar] [CrossRef]
- Garoff, S.; Meyer, R.B. Electroclinic Effect at the A—C Phase Change in a Chiral Smectic Liquid Crystal. Phys. Rev. A 1979, 19, 338–347. [Google Scholar] [CrossRef]
- Bahr, C.; Heppke, G. Optical and Dielectric Investigations on the Electroclinic Effect Exhibited by a Ferroelectric Liquid Crystal with High Spontaneous Polarization. Liquid Cryst. 1987, 2, 825–831. [Google Scholar] [CrossRef]
- Clark, N.A.; Lagerwall, S.T. Submicrosecond bistable electro-optic switching in liquid crystals. Appl. Phys. Lett. 1980, 36, 899–901. [Google Scholar] [CrossRef]
- Bruckner, J.R. A First Example of a Lyotropic Smectic C* Analog Phase—Design, Properties and Chirality Effects; Springer: Cham, Switzerland, 2015; ISBN 978-3-319-27202-3. [Google Scholar]
- Bogner, A. Maßgeschneiderte smektische Flüssigkristalle vom ‚de Vries‘-Typ: Struktur-Eigenschaftsvariationen in nanosegregierenden Organosiloxanen und Organocarbosilanen. Ph.D. Thesis, University of Stuttgart, Stutgart, Germany, 2015. [Google Scholar]
- Dumrongrattana, S.; Huang, C.C. Polarization and Tilt-Angle Measurements Near the Smectic-a-Chiral-Smectic-C Transition of P-(N-Decyloxybenzylidene)-P-Amino-(2-Methyl-Butyl)Cinnamate (DOBAMBC). Phys. Rev. Lett 1986, 56, 464–467. [Google Scholar] [CrossRef]
- Bahr, C.; Heppke, G. Ferroelectric Liquid-Crystals: Properties of Binary Mixtures and Pure Compounds with High Spontaneous Polarization. Mol. Cryst. Liq. Cryst. 1987, 148, 29–43. [Google Scholar] [CrossRef]
- Bahr, C.; Heppke, G. Influence of Electric Field on a First-Order Smectic-A–Ferroelectric-Smectic-C Liquid-Crystal Phase Transition: A Field-Induced Critical Point. Phys. Rev. A 1990, 41, 4335–4342. [Google Scholar] [CrossRef]
- Glaser, M.A.; Clark, N.A. Fluctuations and Clinicity in Tilted Smectic Liquid Crystals. Phys. Rev. E 2002, 66, 021711–021714. [Google Scholar] [CrossRef] [PubMed]
- Tschierske, C.; Schroeter, J.A.; Lindner, N.; Sauer, C.; Diele, S. Formation of columnar mesophases by rodlike molecules. SPIE 1998, 3319, 8–13. [Google Scholar] [CrossRef]
- Lindner, N.; Kölbel, M.; Sauer, C.; Diele, S.; Jokiranta, J.; Tschierske, C. Formation of Columnar and Cubic Mesophases by Calamitic Molecules: Novel Amphotropic Biphenyl Derivatives. J. Phys. Chem. B 1998, 102, 5261–5273. [Google Scholar] [CrossRef]
- Neumann, B.; Sauer, C.; Diele, S.; Tschierske, C. Molecular design of amphotropic materials: Influence of oligooxyethylene groups on the mesogenic properties of calamitic liquid crystals. J. Mater. Chem. 1996, 6, 1087–1098. [Google Scholar] [CrossRef]
- Kanie, K.; Sekiguchi, J.; Zeng, X.; Ungar, G.; Atsushi, M. Phospholipids with a stimuli-responsive thermotropic liquid-crystalline moiety. Chem. Commun. 2011, 47, 6885–6887. [Google Scholar] [CrossRef]
- Tan, X.; Zhang, R.; Guo, C.; Cheng, X.; Gao, H.; Liu, F.; Bruckner, J.R.; Giesselmann, F.; Prehm, M.; Tschierske, C. Amphotropic azobenzene derivatives with oligooxyethylene and glycerol based polar groups. J. Mater. Chem. C 2015, 3, 11202–11211. [Google Scholar] [CrossRef]
- Murase, M.; Takanishi, Y.; Nishiyama, I.; Yoshizawa, A.; Yamamoto, J. Hyper swollen perfluorinated smectic liquid crystal by perfluorinated oils. RSC Adv. 2015, 5, 215–220. [Google Scholar] [CrossRef]
- Schafheutle, M.A.; Finkelmann, H. Shapes of Micelles and Molecular Geometry Synthesis and Studies on the Phase Behaviour, Surface Tension and Rheology of Rigid Rod-Like Surfactants in Aqueous Solutions. Liq. Cryst. 1988, 3, 1369–1386. [Google Scholar] [CrossRef]
- Ujiie, S.; Yano, Y. Thermotropic and lyotropic behavior of novel amphiphilic liquid crystals having hydrophilic poly(ethyleneimine) units. Chem. Commun. 2000, 79–80. [Google Scholar] [CrossRef]
- Pietschmann, N.; Lunow, A.; Brezesinski, G.; Tschierske, C.; Kuschel, F.; Zaschke, H. The first liquid crystalline diol compound which exhibits nematic, smectic A+, and smectic C+ mesophases in the presence of water. Colloid Polym. Sci. 1991, 269, 636–639. [Google Scholar] [CrossRef]
- Bruckner, J.R.; Krueerke, D.; Porada, J.H.; Jagiella, S.; Blunk, D.; Giesselmann, F. The 2D-correlated structures of a lyotropic liquid crystalline diol with a phenylpyrimidine core. J. Mater. Chem. 2012, 22, 18198–18203. [Google Scholar] [CrossRef]
- Bruckner, J.R.; Porada, J.H.; Dietrich, C.F.; Dierking, I.; Giesselmann, F. A Lyotropic Chiral Smectic C Liquid Crystal with Polar Electrooptic Switching. Angew. Chem. Int. Ed. 2013, 52, 8934–8937. [Google Scholar] [CrossRef] [PubMed]
- Clark, N.A.; Rieker, T.P.; Maclennan, J.E. Director and layer structure of SSFLC cells. Ferroelectrics 1988, 85, 79–97. [Google Scholar] [CrossRef]
- Kuczyński, W. Behavior of the helix in some chiral smectic-C* liquid crystals. Phys. Rev. E 2010, 2, 021708. [Google Scholar] [CrossRef]
- Martinot-Lagarde, P. Flexo and ferro-electricity observation of ferroelectrical monodomains in the chiral smectic liquid crystal. J. Phys. Colloques 1976, 37, 129–132. [Google Scholar] [CrossRef]
- Brunet, M.; Isaert, N. Periodic structures in smectic C*—Pitch and unwinding lines. Ferroelectrics 1988, 84, 25–52. [Google Scholar] [CrossRef]
- Osipov, M.A.; Bruckner, J.R.; Giesselmann, F. On the Theory of Helical Twisting in Ferroelectric Liquid Crystals, 2. In Proceedings of the Joint German British Liquid Crystal Conference, Würzburg, Germany, 3–5 April 2017. [Google Scholar]
- Gorb, L.; Asensio, A.; Tuñón, I.; Ruiz-López, M.F. The Mechanism of Formamide Hydrolysis in Water from Ab Initio Calculations and Simulations. Chem. Eur. J. 2005, 11, 6743. [Google Scholar] [CrossRef]
- Notley, J.M.; Spiro, M. The Purification of Formamide, and the Rate of its Reaction with Dissolved Water. J. Chem. Soc. B 1966, 362. [Google Scholar] [CrossRef]
- Harjung, M.D.; Schubert, C.P.J.; Knecht, F.; Porada, J.H.; Lemieux, R.P.; Giesselmann, F. New amphiphilic materials showing the lyotropic analogue to the thermotropic smectic C* liquid crystal phase. J. Mater. Chem. C 2017, 5, 7452–7457. [Google Scholar] [CrossRef]
- Knecht, F. Neue Einblicke in die Lyotrope Smektische C* Phase: Untersuchungen zur Phasenstabilität und zum Mechanismus Interlamellarer Direktorkorrelation. Ph.D. Thesis, University of Stuttgart, Stutgart, Germany, 2019. [Google Scholar]
- Harjung, M.D. Chirale Lyotrop-Lamellare Flüssigkristalle: Phasenverhalten Neuer Chiraler Amphiphile und Nachweis des Elektroklinen Effektes. Ph.D. Thesis, University of Stuttgart, Stutgart, Germany, 2019. [Google Scholar]
- Li, L.; Jones, C.D.; Magolan, J.; Lemieux, R.P. Siloxane-terminated phenylpyrimidine liquid crystal hosts. J. Mater. Chem. 2007, 17, 2313–2318. [Google Scholar] [CrossRef]
- Roberts, J.C.; Kapernaum, N.; Giesselmann, F.; Lemieux, R.P. Design of liquid crystals with “de Vries-like” properties: Organosiloxane mesogen with a 5-phenylpyrimidine core. J. Am. Chem. Soc. 2008, 130, 13842–13843. [Google Scholar] [CrossRef] [PubMed]
- McCubbin, J.A.; Tong, X.; Wang, R.; Zhao, Y.; Snieckus, V.; Lemieux, R.P. Directed metalation route to ferroelectric liquid crystals with a chiral fluorenol core: The effect of restricted rotation on polar order. J. Am. Chem. Soc. 2004, 126, 1161–1167. [Google Scholar] [CrossRef] [PubMed]
- Takatoh, K.; Sunohara, K.; Sakamoto, M. Mesophase Transition of Series Materials Containing Fluorene, Fluorenone and Biphenyl Structures with Chiral End Groups. Mol. Cryst. Liq. Cryst. 1988, 164, 167–178. [Google Scholar] [CrossRef]
- Roberts, J.C.; Kapernaum, N.; Song, Q.; Nonnenmacher, D.; Ayub, K.; Giesselmann, F.; Lemieux, R.P. Design of liquid crystals with “de Vries-like” properties: Frustration between SmA- and SmC-promoting elements. J. Am. Chem. Soc. 2010, 132, 364–370. [Google Scholar] [CrossRef]
- Bruckner, J.R.; Knecht, F.; Giesselmann, F. Origin of the Director Tilt in the Lyotropic Smectic C* Analog Phase: Hydration Interactions and Solvent Variations. ChemPhysChem 2016, 17, 86–92. [Google Scholar] [CrossRef]
- Rumble, J.R. (Ed.) CRC Handbook of Chemistry and Physics, 99th ed.; CRC Press: Boca Raton, FL, USA, 2018; ISBN 1138561630. [Google Scholar]
- Sengwa, R.J.; Kaur, K.; Chaudhary, R. Dielectric properties of low molecular weight poly(ethylene glycol)s. Polym. Int. 2000, 49, 599–608. [Google Scholar] [CrossRef]
- LeNeveu, D.M.; Rand, R.P.; Parsegian, V.A. Measurement of forces between lecithin bilayers. Nature 1976, 259, 601–603. [Google Scholar] [CrossRef]
- Lis, L.J.; McAlister, D.; Fuller, N.; Rand, R.P.; Parsegian, V.A. Interactions between neutral phospholipid bilayer membranes. Biophys. J. 1982, 37, 657–666. [Google Scholar]
- Leikin, S.; Parsegian, V.A.; Rau, D.C.; Rand, R.P. Hydration Forces. Ann. Rev. Phys. Chem. 1993, 44, 369–395. [Google Scholar] [CrossRef]
- McIntosh, T.J. Short-range interactions between lipid bilayers measured by X-ray diffraction. Curr. Opin. Struct. Biol. 2000, 10, 481–485. [Google Scholar] [CrossRef]
- Milhaud, J. New insights into water-phospholipid model membrane interactions. Biochim. Biophys. Acta 2004, 1663, 19–51. [Google Scholar] [CrossRef] [PubMed]
- Berkowitz, M.L.; Vácha, R. Aqueous solutions at the interface with phospholipid bilayers. Acc. Chem. Res. 2012, 45, 74–82. [Google Scholar] [CrossRef] [PubMed]
- Bergenstaahl, B.A.; Stenius, P. Phase diagrams of dioleoylphosphatidylcholine with formamide, methylformamide and dimethylformamide. J. Phys. Chem. 1987, 91, 5944–5948. [Google Scholar] [CrossRef]
- Cheng, J.-X.; Pautot, S.; Weitz, D.A.; Xie, X.S. Ordering of water molecules between phospholipid bilayers visualized by coherent anti-Stokes Raman scattering microscopy. Proc. Natl. Acad. Sci. USA 2003, 100, 9826–9830. [Google Scholar] [CrossRef]
- Tayebi, L.; Ma, Y.; Vashaee, D.; Chen, G.; Sinha, S.K.; Parikh, A.N. Long-range interlayer alignment of intralayer domains in stacked lipid bilayers. Nat. Mater. 2012, 11, 1074–1080. [Google Scholar] [CrossRef]
- Marrink, S.J.; Berkowitz, M.; Berendsen, H. Molecular dynamics simulation of a membrane/water interface: The ordering of water and its relation to the hydration force. Langmuir 1993, 9, 3122–3131. [Google Scholar] [CrossRef]
- Kjellander, R.; Marčelja, S. Perturbation of hydrogen bonding in water near polar surfaces. Chem. Phys. Lett. 1985, 393–396. [Google Scholar] [CrossRef]
- Marčelja, S.; Radić, N. Repulsion of interfaces due to boundary water. Chem. Phys. Lett. 1976, 42, 129–130. [Google Scholar] [CrossRef]
- Attard, P.; Batchelor, M.T. A mechanism for the hydration force demonstrated in a model system. Chem. Phys. Lett. 1988, 149, 206–211. [Google Scholar] [CrossRef]
- Tokarev, A.V.; Bondarenko, G.N.; Yampol’skii, Y.P. Chain structure and stiffness of Teflon AF glassy amorphous fluoropolymers. Polym. Sci. Ser. A 2007, 49, 909–920. [Google Scholar] [CrossRef]
- Parra, R.D.; Zeng, X.C. Staggered and eclipsed conformations of C2F6: A systematic ab initio study. J. Fluor. Chem. 1997, 83, 51–60. [Google Scholar] [CrossRef]
- Salerno, K.M.; Bernstein, N. Persistence Length, End-to-End Distance, and Structure of Coarse-Grained Polymers. J. Chem. Theory Comput. 2018, 14, 2219–2229. [Google Scholar] [CrossRef] [PubMed]
- Teoh, M.M.; Chung, T.-S.; Pramoda, K.P. Thin-film polymerization and Metropolis Monte Carlo simulation of thermotropic liquid crystalline poly(ester-amide)s. Synth. Met. 2004, 147, 191–197. [Google Scholar] [CrossRef]
- Koestner, R.; Roiter, Y.; Kozhinova, I.; Minko, S. AFM imaging of adsorbed Nafion polymer on mica and graphite at molecular level. Langmuir 2011, 27, 10157–10166. [Google Scholar] [CrossRef] [PubMed]
- Giesselmann, F.; Zugenmaier, P. Mean-Field Coefficients and the Electroclinic Effect of a Ferroelectric Liquid-Crystal. Phys. Rev. E 1995, 52, 1762–1772. [Google Scholar] [CrossRef]
- Jakli, A.; Harden, J.; Notz, C.; Bailey, C. Piezoelectricity of Phospholipids: A Possible Mechanism for Mechanoreception and Magnetoreception in Biology. Liquid Cryst. 2008, 35, 395–400. [Google Scholar] [CrossRef]
- Harden, J.; Diorio, N.; Petrov, A.G.; Jakli, A. Chirality of Lipids Makes Fluid Lamellar Phases Piezoelectric. Phys. Rev. E 2009, 79. [Google Scholar] [CrossRef]
- Harjung, M.D.; Giesselmann, F. Electroclinic effect in the chiral lamellar α phase of a lyotropic liquid crystal. Phys. Re. E 2018, 97, 032705. [Google Scholar] [CrossRef]
- Clark, N.A.; Lagerwall, S.T. Applications of Ferroelectric Liquid Crystals in Ferroelectric Liquid Crystals—Principles, Properties and Applications; Taylor, G.W., Shuvalov, L.A., Eds.; Gordon and Breach Science Publishers: Philadelphia, PA, USA, 1991; ISBN 2-88124-282-0. [Google Scholar]


© 2019 by the authors. Licensee MDPI, Basel, Switzerland. This article is an open access article distributed under the terms and conditions of the Creative Commons Attribution (CC BY) license (http://creativecommons.org/licenses/by/4.0/).