Lyotropic Liquid Crystals from Colloidal Suspensions of Graphene Oxide


Department of Physics and Astronomy, University of Manchester, Manchester M13 9PL, UK
*
Author to whom correspondence should be addressed.
Crystals 2019, 9(9), 455; https://doi.org/10.3390/cryst9090455
Submission received: 20 August 2019
/
Revised: 28 August 2019
/
Accepted: 30 August 2019
/
Published: 31 August 2019
(This article belongs to the Special Issue New Trends in Lyotropic Liquid Crystals)
Abstract
:Lyotropic liquid crystals from colloidal particles have been known for more than a century, but have attracted a revived interest over the last few years. This is due to the developments in nanoscience and nanotechnology, where the liquid crystal order can be exploited to orient and reorient the anisotropic colloids, thus enabling, increasing and switching the preferential properties of the nanoparticles. In particular, carbon-based colloids like carbon nanotubes and graphene/graphene–oxide have increasingly been studied with respect to their lyotropic liquid crystalline properties over the recent years. We critically review aspects of lyotropic graphene oxide liquid crystal with respect to properties and behavior which seem to be generally established, but also discuss those effects that are largely unfamiliar so far, or as of yet of controversial experimental or theoretical outcome.
1. Introduction
Many of the liquid crystal (LC) phases known from applications in displays are based on rod-shaped molecules, so called calamitic mesogens, which exhibit the liquid crystal behaviour as a function of changing temperature and are called thermotropic. Nevertheless, for the formation of liquid crystals only general shape anisotropy of the molecules is necessary, and in 1977, Chandrasekhar et al. [1] reported liquid crystallinity from disk-shaped molecules, called discotic liquid crystals, which are also part of the family of thermotropic LC phases. But liquid crystallinity can also be observed as a function of changing concentration of either amphiphilic molecules, or anisotropic nanoparticles and colloids, in an isotropic host fluid, often water. This leads to a wholly new class of LCs, the lyotropic phases, which are the topic of this paper and indeed of the whole journal volume of this special issue of Crystals. Besides those formed from amphiphilic molecules, several types of lyotropic LCs may be distinguished. Chromonics [2,3] are liquid crystals of dissolved rigid dyes, thus flat molecules, in an isotropic solvent. These stack to form super-molecular structures which then exhibit nematic and columnar phases. Inorganic liquid crystals [4] are lyotropics that can be formed by rod-like colloids, such as vanadium pentoxide, V2O5, and other minerals, but also by disc-shaped colloids, especially clays [5,6,7]. Such systems have already been observed by Langmuir in 1938 on bentonite clays [8] and form the basis of the Onsager theory, which will be discussed herein.
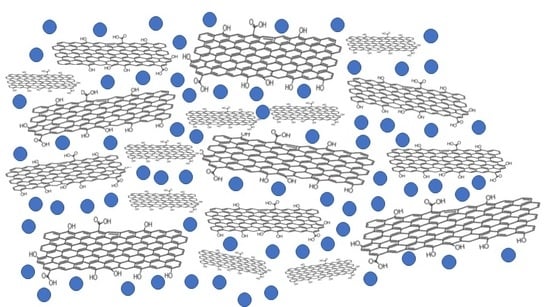
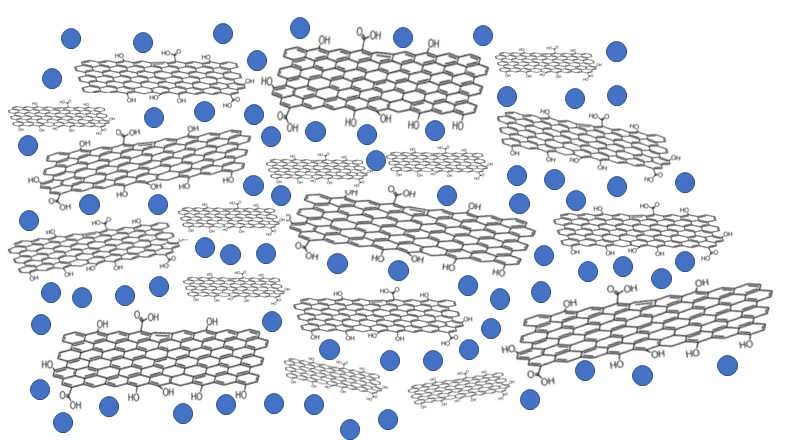
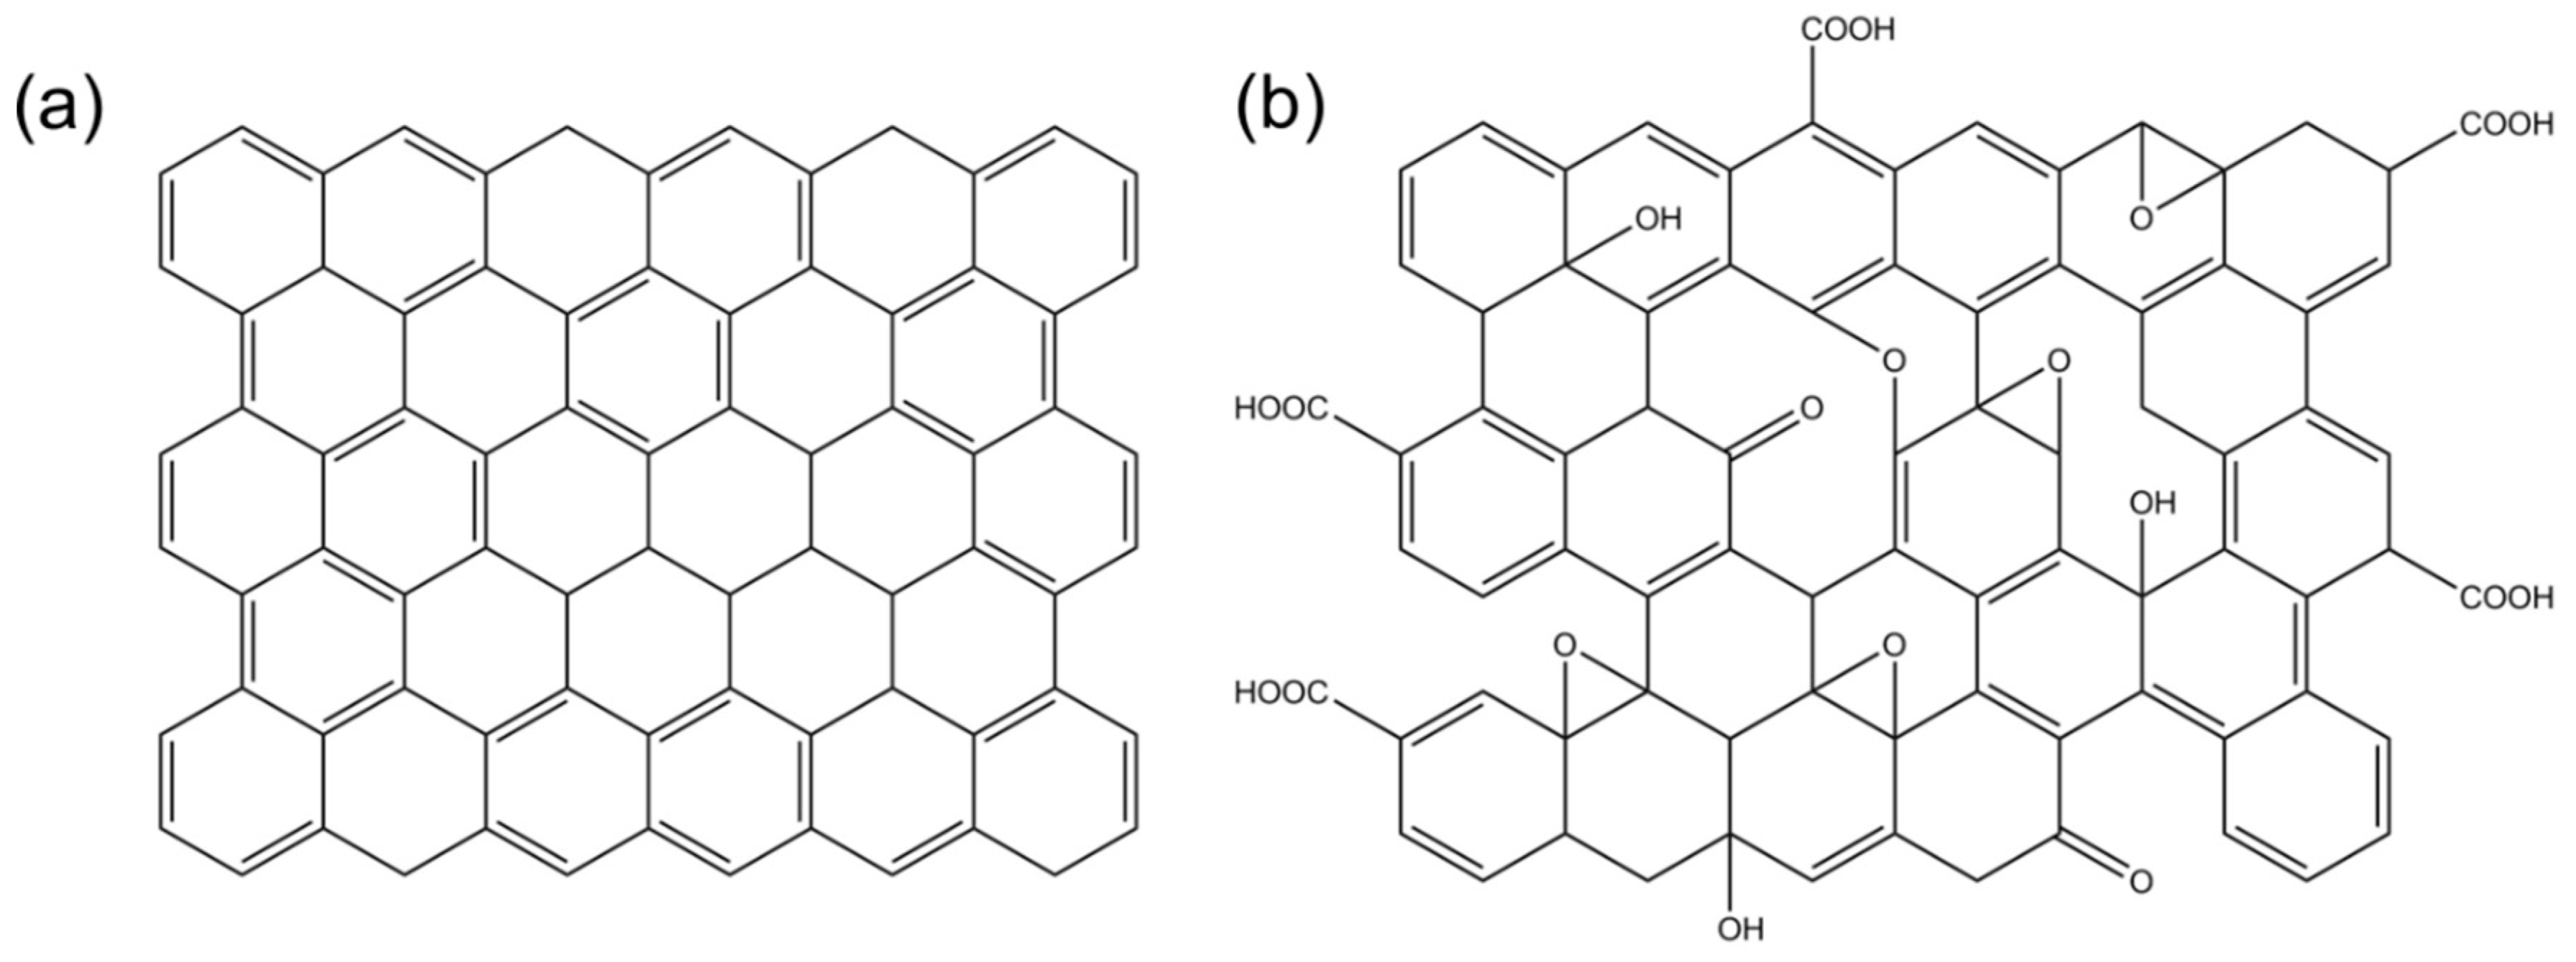
Somewhere in between the molecular size of chromonic dyes and the macroscopic platelets of clays, lies graphene oxide. Since the discovery of graphene in 2004 [9], a stable, two-dimensional hexagonal lattice of carbon with quite surprising and unprecedented physical properties [10], this material has attracted enormous interest (Figure 1a). This is on the one side founded by questions of fundamental research, and on the other side by the promise of a large range of possible high volume technological applications. When working with graphene in a liquid crystal environment, one will unfortunately quickly arrive at the conclusion that these composites and mixtures are by no means easy to handle, because graphene is largely insoluble in nearly all liquid solvents. This is very different for graphene–oxide (GO) which exhibits different functional groups at the edges and the plane of the graphene oxide sheets, and is readily soluble in many solvents, including water, which is a significant advantage for environmentally friendly applications (Figure 1b). At certain concentrations, roughly > 0.1–1 wt%, GO often exhibits very stable lyotropic nematic phases [11,12,13]. One of the interesting aspects of GO liquid crystals is the possibility of self-organized and self-ordered systems of graphene oxide. This order can then easily be manipulated by application of external stimuli, such as boundary conditions, mechanical shear, but possibly also electric and magnetic fields. After obtaining a certain directional order one could wash away or evaporate the solvent, leaving an ordered GO structure, which may even be reduced chemically or through heat application to produce reduced graphene oxide (rGO), which displays some of the originally desirable graphene properties. Lyotropic graphene oxide liquid crystals are thus of immense interest for nanotechnology and its applications. There have been several review articles on the properties of GO liquid crystals [14,15,16]. In this paper we want to give a short critical account of what is known, what is not yet known, and what are the controversial questions with regards to graphene oxide liquid crystals. Effects of flake size and solvent will be discussed, alignment, addition of salts and polymers, as well as electro-optic properties, and electric and magnetic field effects.
2. Graphene and Graphene Oxide
Pristine graphene is a two-dimensional hexagonal lattice of sp2 hybridized carbon with a basis of two, giving rise to a honeycomb structure [10]. Graphene oxide is a very different material to graphene. Graphene is often obtained by mechanical exfoliation of graphite (the so-called Scotch Tape® method) or grown by chemical vapor deposition. On the other hand, graphite that has undergone treatment to become graphite oxide readily exfoliates into monolayers when dispersed in water (Figure 1) [17]. Thus, graphene oxide is often easier to produce in large quantities than graphene and is readily dispersible in solution for storage or further processing [18]. There are two main processes described in the literature for producing graphite oxide, the Hummers [19] and Brodie [20] methods.
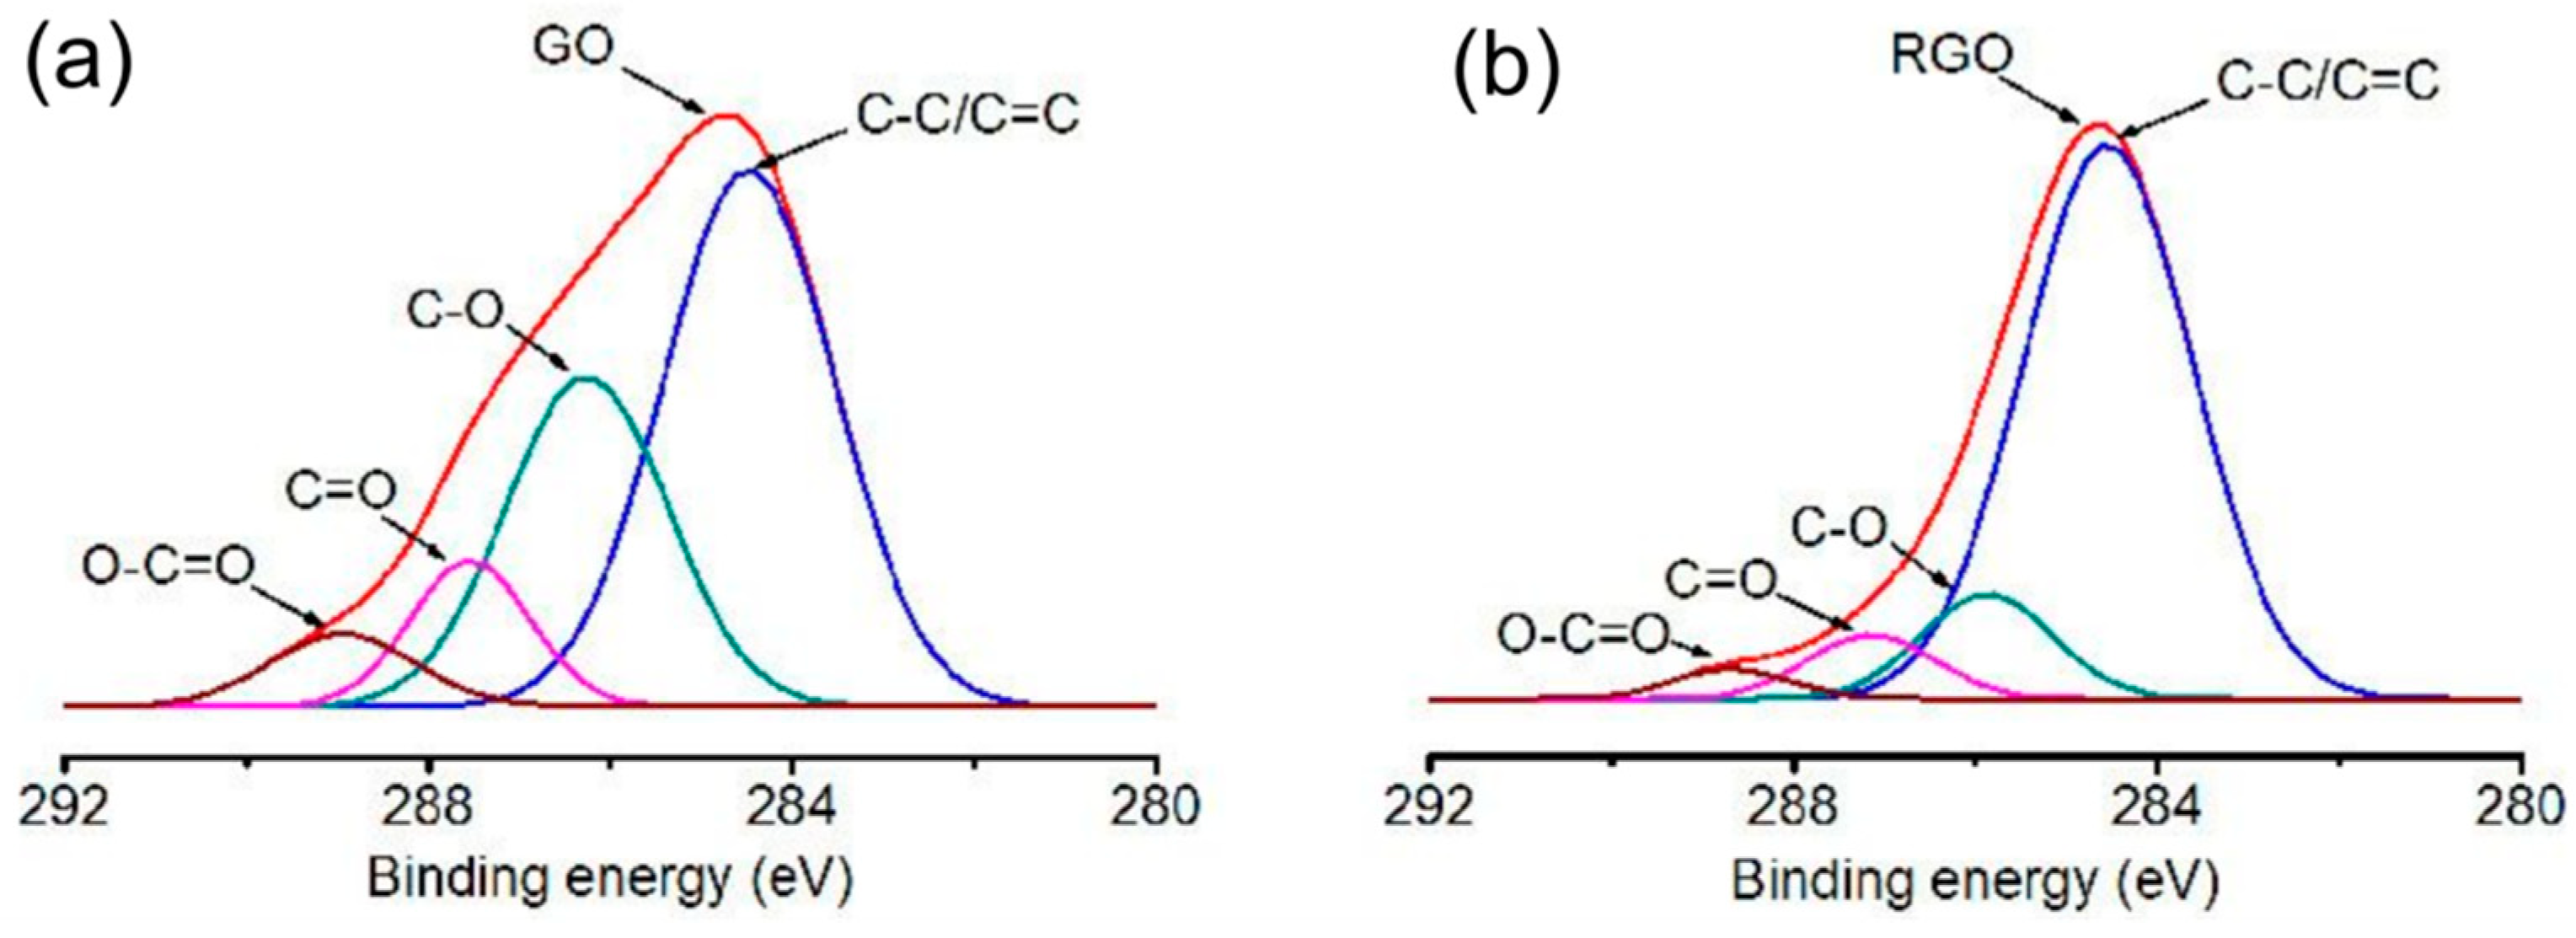
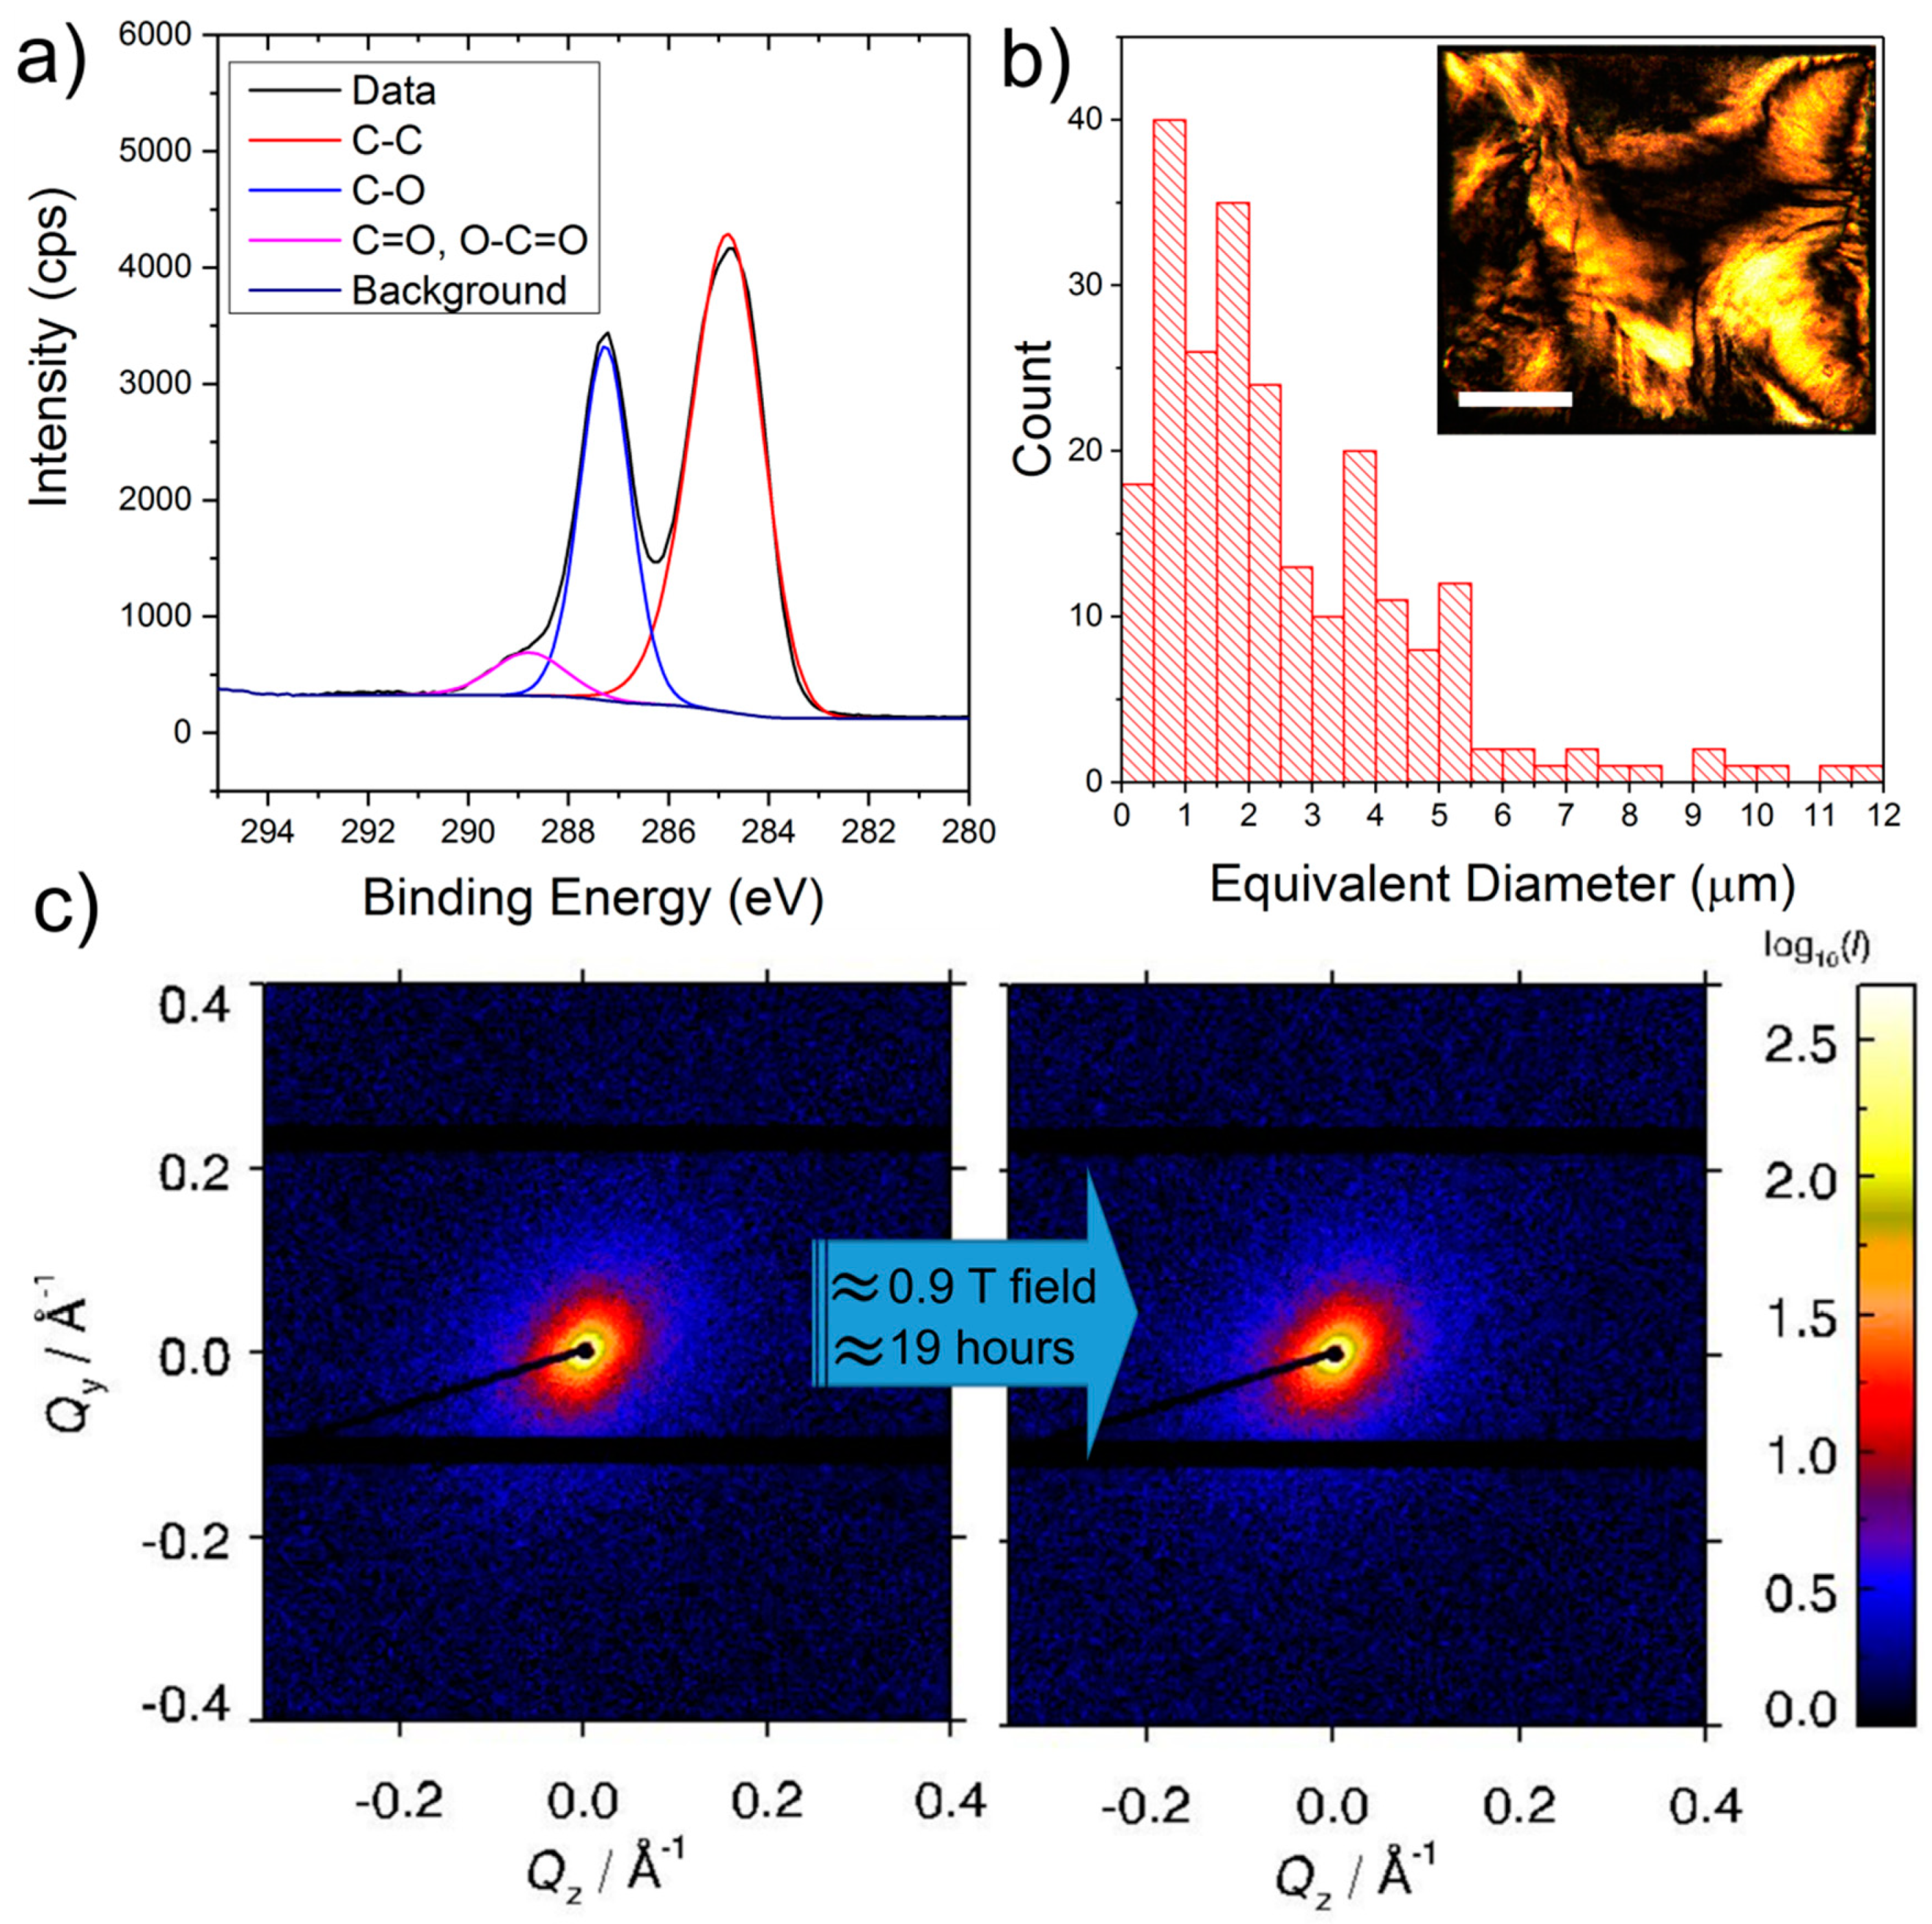
The structure of graphene oxide is reminiscent of graphene but the lattice is now distorted and the covalent bonding of oxygen functional groups such as epoxy, hydroxyl and carboxyl groups [21] means much more of the carbon is now sp3 hybridized. The disruption to the sp2 bonding network means graphene oxide is not electrically conductive. Typically, graphene oxide is produced by a modified Hummers method [22] and the degree of oxidation is characterized by X-ray photoelectron spectroscopy (XPS) measurements. From XPS measurements one can determine the ratio of oxygen to carbon atoms in the material, which is often taken as a measure of how oxidized the graphene sheet is. Graphene oxide can be reduced by thermal or chemical means, and the product is known as rGO. When GO is reduced, the first change to occur is that the C–O peak in XPS decreases in intensity relative to the C–C and the C–O=O/C=O bonds (Figure 2) [23,24]. This can be interpreted as a relative decrease in the abundance of epoxy groups (which only include C–O bonds) on the GO surface.
Stable dispersions of graphene oxide in appropriate solvents can be described as a colloid—a suspension of one phase (in this case a solid) inside another. Colloids of anisodiametric (shape-anisotropic) particles are known to make lyotropic liquid crystal phases, and the same is true of graphene oxide.
3. Colloidal Liquid Crystals of Graphene Oxide
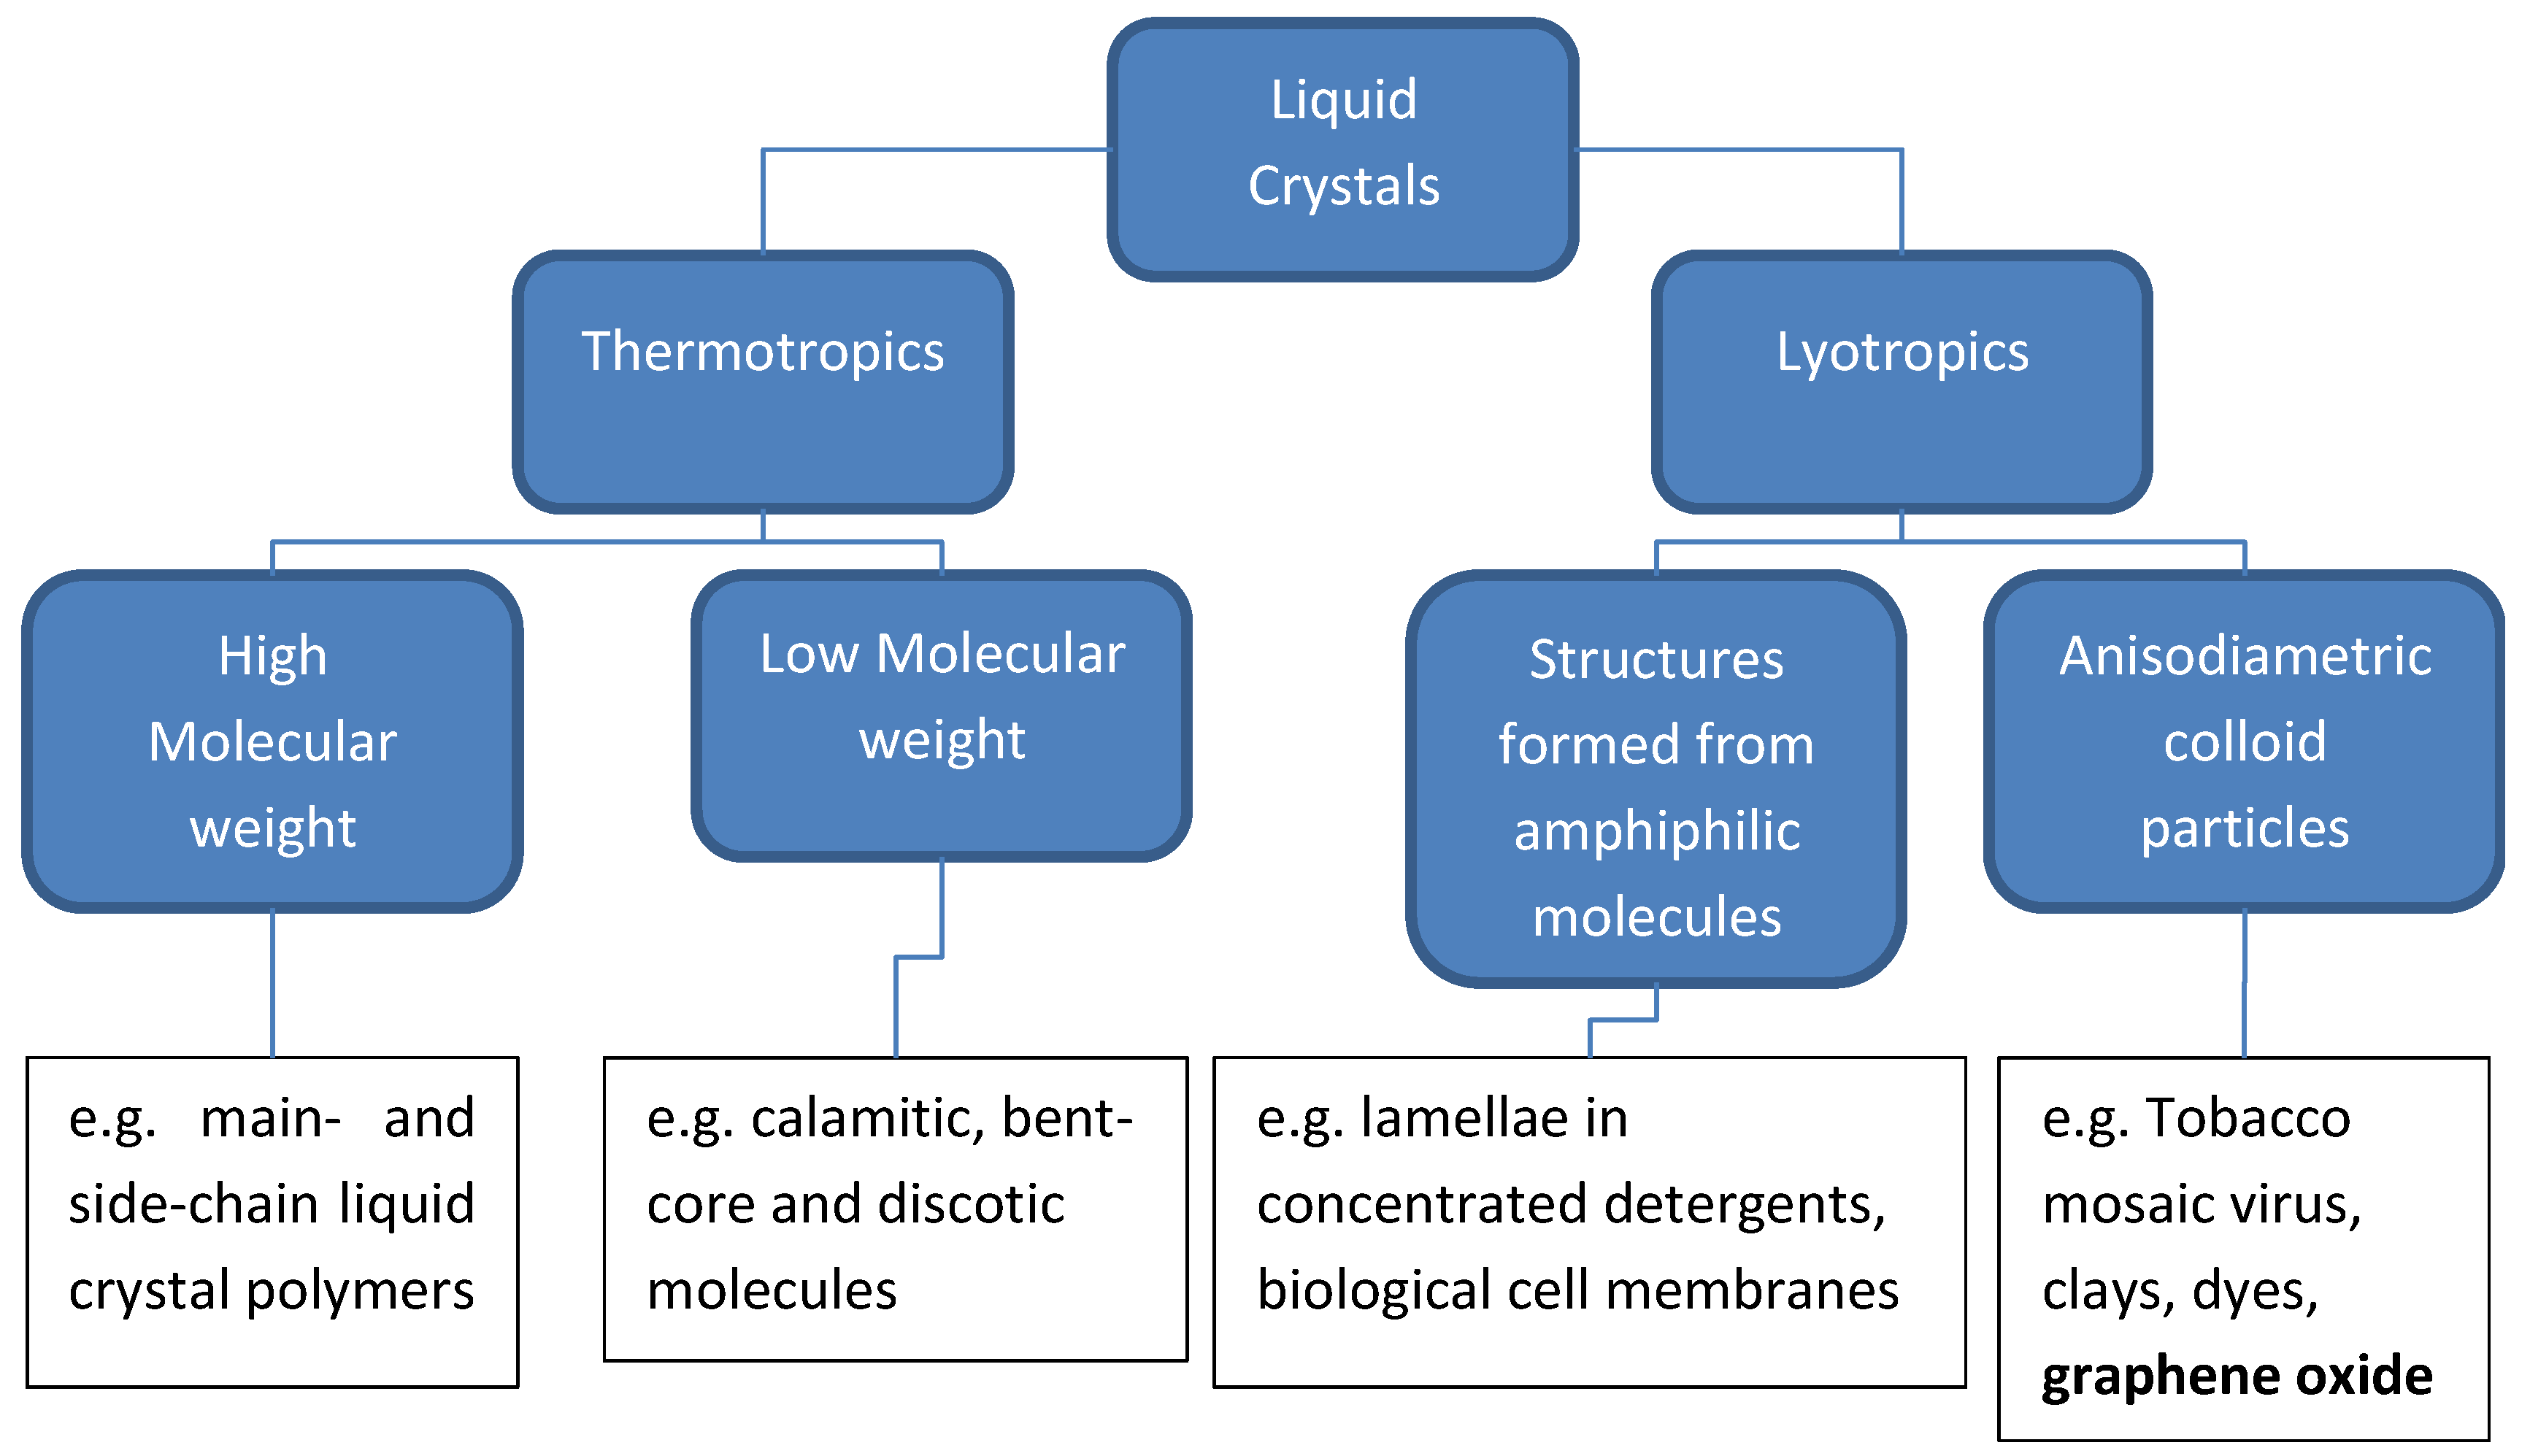
Liquid crystals are soft condensed matter systems which exhibit orientational ordering of their basic units (and in some cases, a degree of positional order) as a solid phase does, but which can also flow. As mentioned above, there are two main classes of liquid crystals—thermotropic and lyotropic (Figure 3) [25]. Thermotropic liquid crystals are systems in which phases exhibiting liquid crystal properties can be observed to occur between the solid and liquid states. Thus, temperature and pressure are the main variables of state which alters their phase. The best known example of thermotropic liquid crystals are the rod-like (calamitic) molecules found in everyday display screens [26]. Lyotropic liquid crystals are systems of at least two components, and it is their relative concentration that brings about orientational ordering of self-assembled structures [27]. Examples include the columnar and lamellar phases of amphiphilic molecules in water [28]. Amphiphilic lyotropic liquid crystals are also the most common type of all liquid crystals, since their lamellae form the basic structure of biological cell membranes [27,29]. Colloids of anisodiametric particles in liquid solvents can also possess orientational ordering at sufficiently high concentrations [30]. Though the structures that are aligning are quite different to the case of amphiphiles, they are nevertheless referred to as lyotropic liquid crystals.
In 2010, Behabtu et al. [31] described the observation in polarized optical microscopy (POM) of birefringence in suspensions of graphene in chlorosulphonic acid. The authors interpreted these observations as being due to orientational alignment and hence lyotropic liquid crystallinity of the graphene flakes [31]. Just one year later, Kim et al. [11], Dan et al. [13], and Xu and Gao [12,32] reported that graphene oxide dispersed in water behaved in the same way.
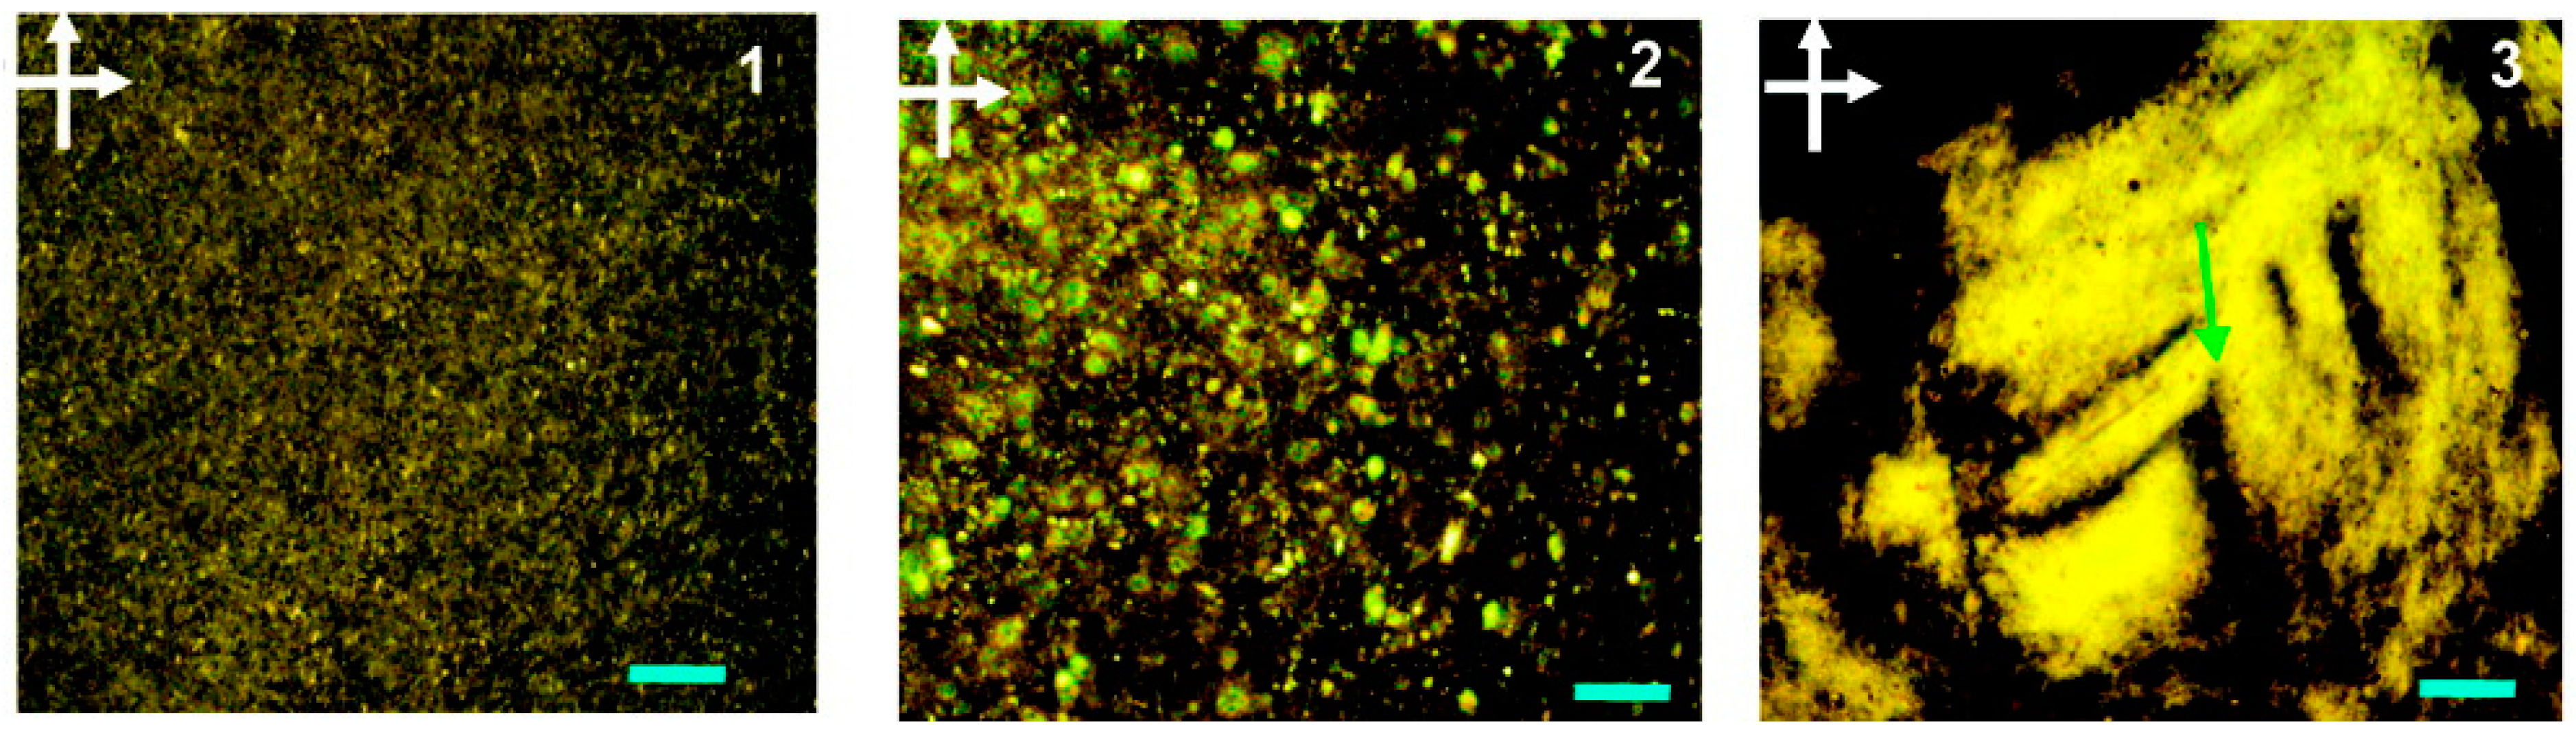
Typical POM images of graphene oxide dispersion in the nematic phase from Xu and Gao [12] are shown in Figure 4. These images show the evolution in the microstructure of graphene oxide dispersions as the concentration is increased from the isotropic phase (image 1) through the biphase region (image 2) and into the nematic liquid crystal phase (image 3).
Theoretically, the lyotropic phase behaviour of anisodiametric nano- and micro-particles is described by the Onsager theory [33]. In his original work of 1949 [33], Onsager used a virial expansion method to describe the orientational ordering that had been observed in suspensions of tobacco mosaic viruses. The underlying principle of the theory is that some volume a particle would otherwise be able to move into is excluded by the presence of a further particle i.e., the particles cannot interpenetrate one another. As the volume concentration of particles increases, this means there is less and less space available to a particular particle and for anisodiametric particles orientational ordering spontaneously emerges at a critical concentration. The transition is known as an entropy-driven transition [34]. Thus far, all known theories about entropy driven phase transitions in colloidal lyotropics have used the approximation that the particles are inflexible.
Forsyth et al. [35] extended the Onsager model to the hard-disk fluid in 1977. Their findings showed that the phase behaviour of disks was distinctly different from rods. When the aspect ratio (diameter/thickness) of the discs increases, transitions to the biphase and the nematic phase occur at lower volume concentrations. The reverse happens for rods; as their aspect ratio (length/diameter) increases so does the minimum volume concentration required for the onset of orientational ordering.
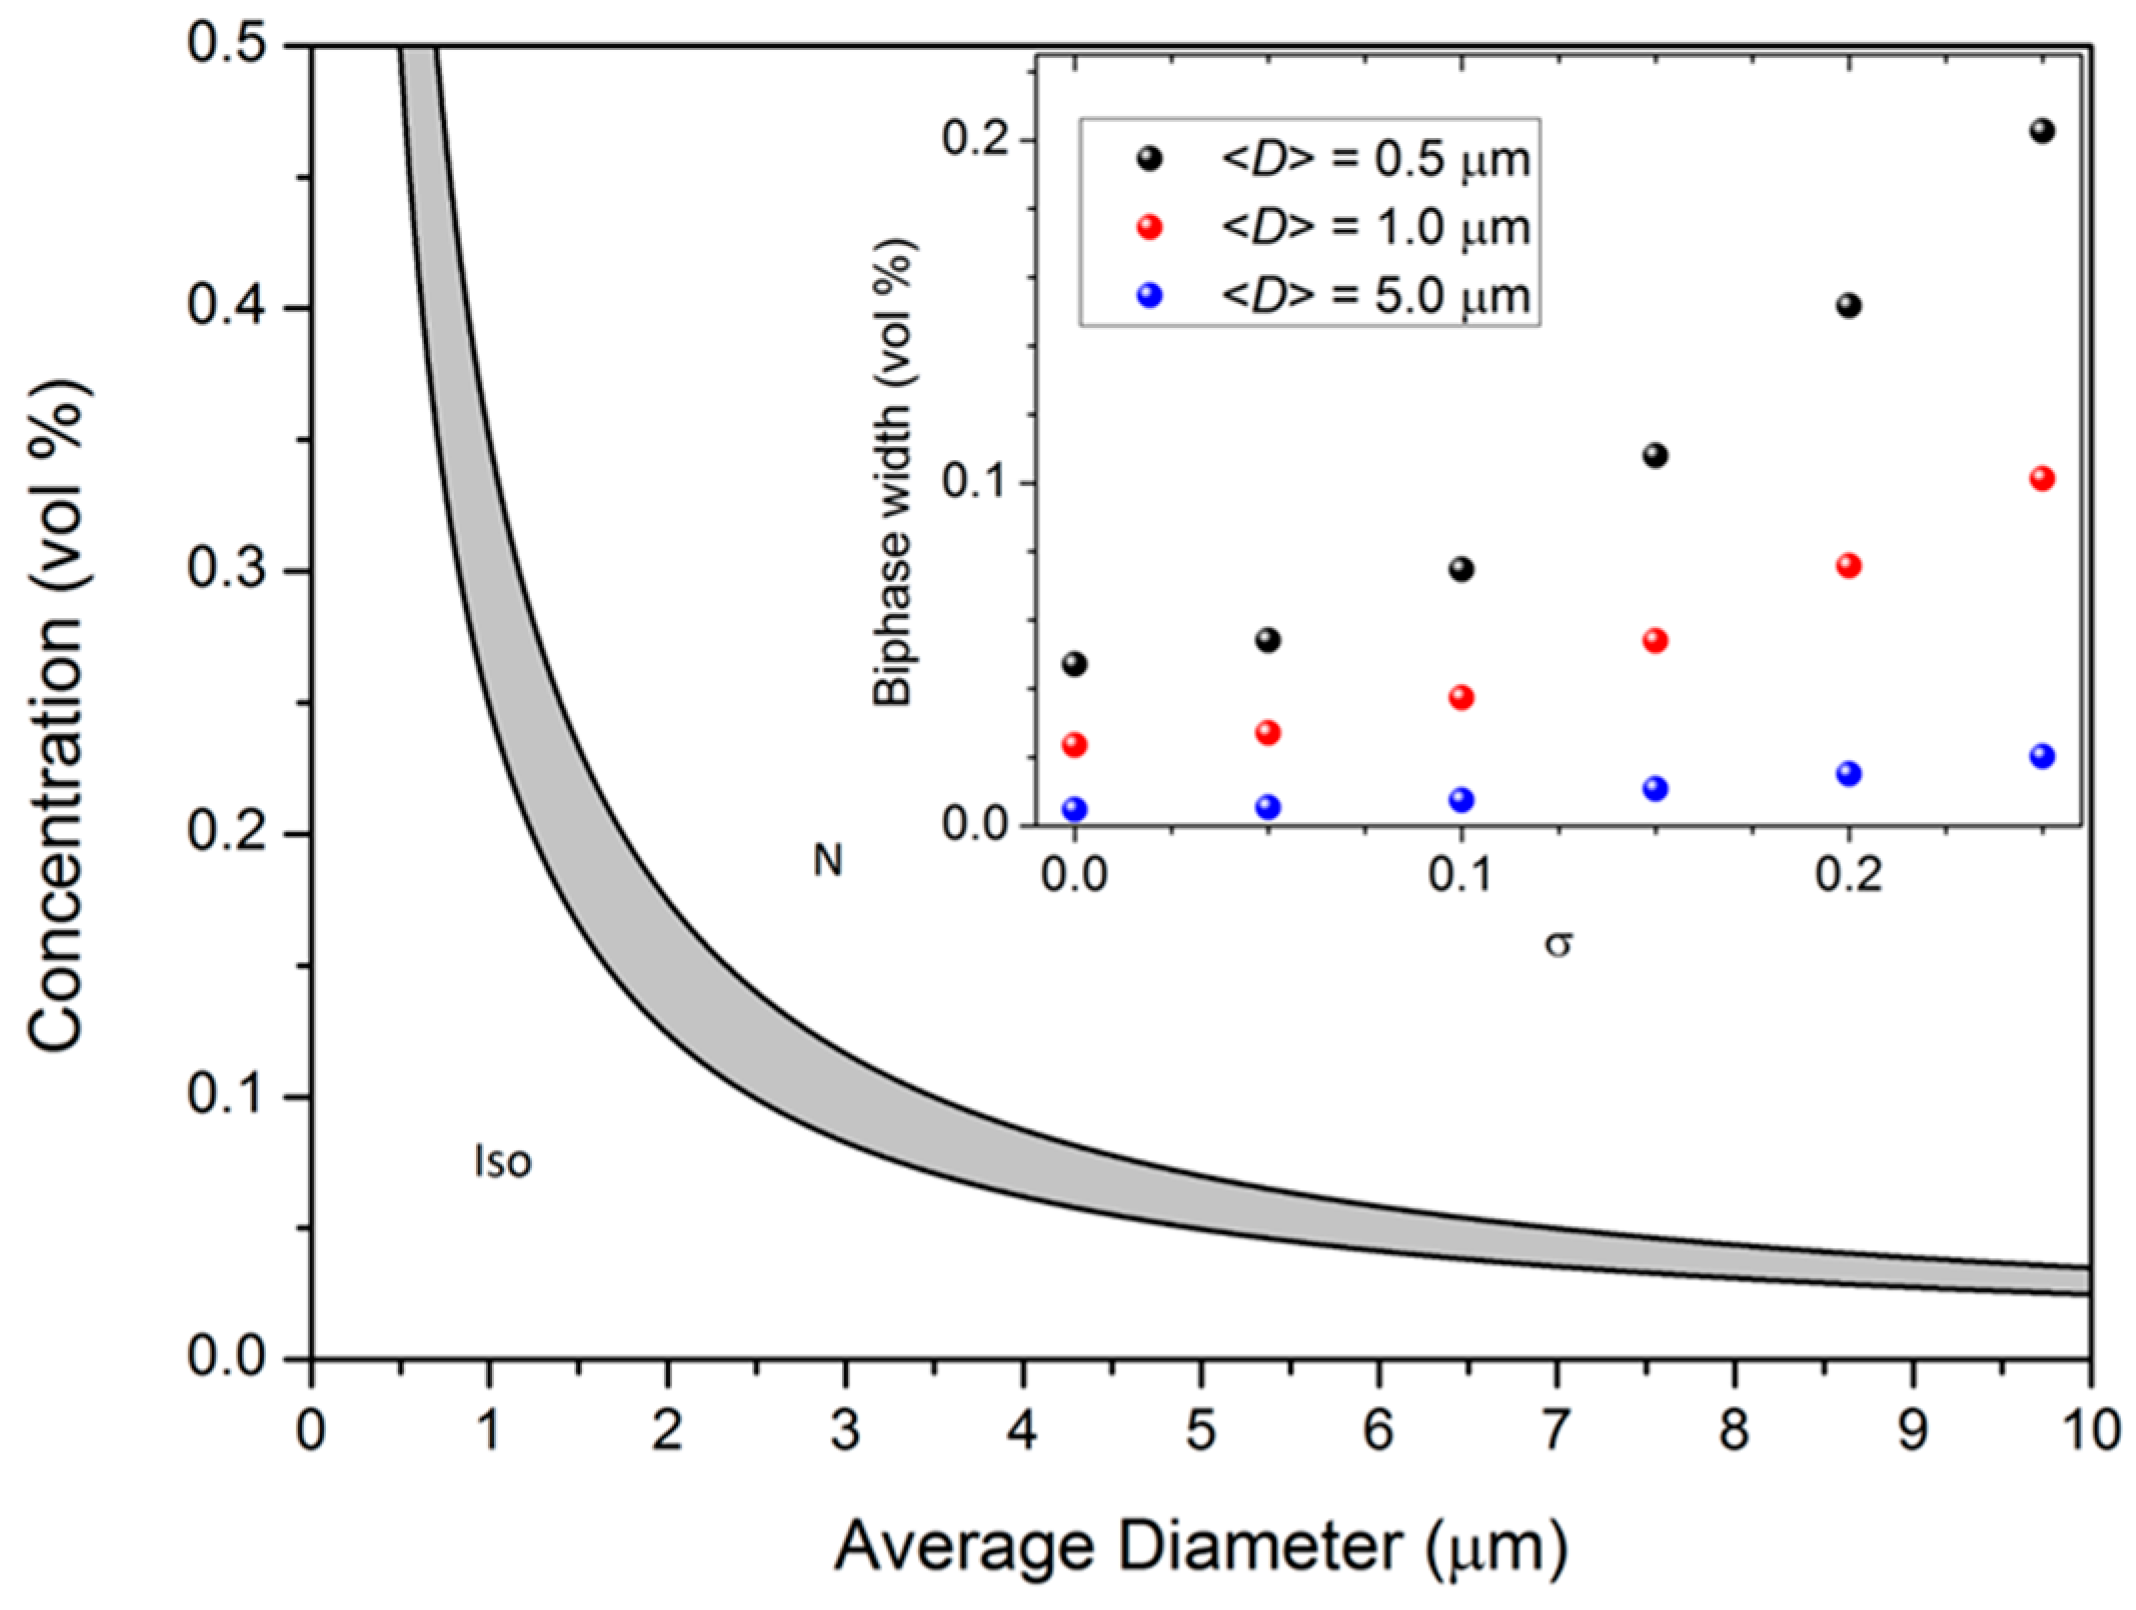
Bates and Frenkel [36], almost two decades later, have argued that the extension of Onsager’s theory from rods to discs is invalid. Furthermore, they argued that since real systems are polydisperse, model systems should be as well. Their approach was to use Monte–Carlo simulations of infinitely thin disks with varying polydispersity (σ = 〈D〉/√(〈D2 〉 – 〈D〉2), where 〈D〉 is the average diameter of the disk). Their results are summarized in Figure 5. For ease of interpretation, these results have been converted into units typically used in experimental graphene oxide research (i.e., micrometers, vol %) using the method of Shen et al. [37]. It can be seen that the width of the biphasic region increases with increasing polydispersity, but the range of polydispersity investigated in the simulations does not stretch to that typically encountered for graphene oxide dispersions [37].
When the concentration of graphene oxide is further increased, other phases can be observed. The first phase to appear with increasing concentration is the lamellar phase. In the lamellar phase, the graphene oxide sheets form layers which lead to Bragg reflection in small-angle X-ray scattering (SAXS) [12]. On the basis of ellipsometry measurements and freeze-fracture cryo-SEM (scanning electron microscopy), Xu and Gao have also proposed that this lamellar phase is in fact chiral. They propose the structure of this phase to be an analogue of the twist grain boundary phases of thermotropic liquid crystals, with lamellar blocks of GO twisted relative to one another forming a helical superstructure. This observation is remarkable, since neither the graphene oxide nor the solvent is chiral, so it is not clear from where the chirality of the system arises. When the graphene oxide is covalently functionalized with polyacrylonitrile, there is also evidence of a chiral nematic phase, in which the GO sheets form a helical structure but are not yet in lamellae. These results were established using ellipsometry and SAXS [38]. When the sheet-to-sheet interaction is modified with salt, the phase diagram becomes more complex, and this will be discussed later in this review. Meanwhile in the next section, the nematic phase is discussed in more detail.
4. Effects of Flake Size and Solvent
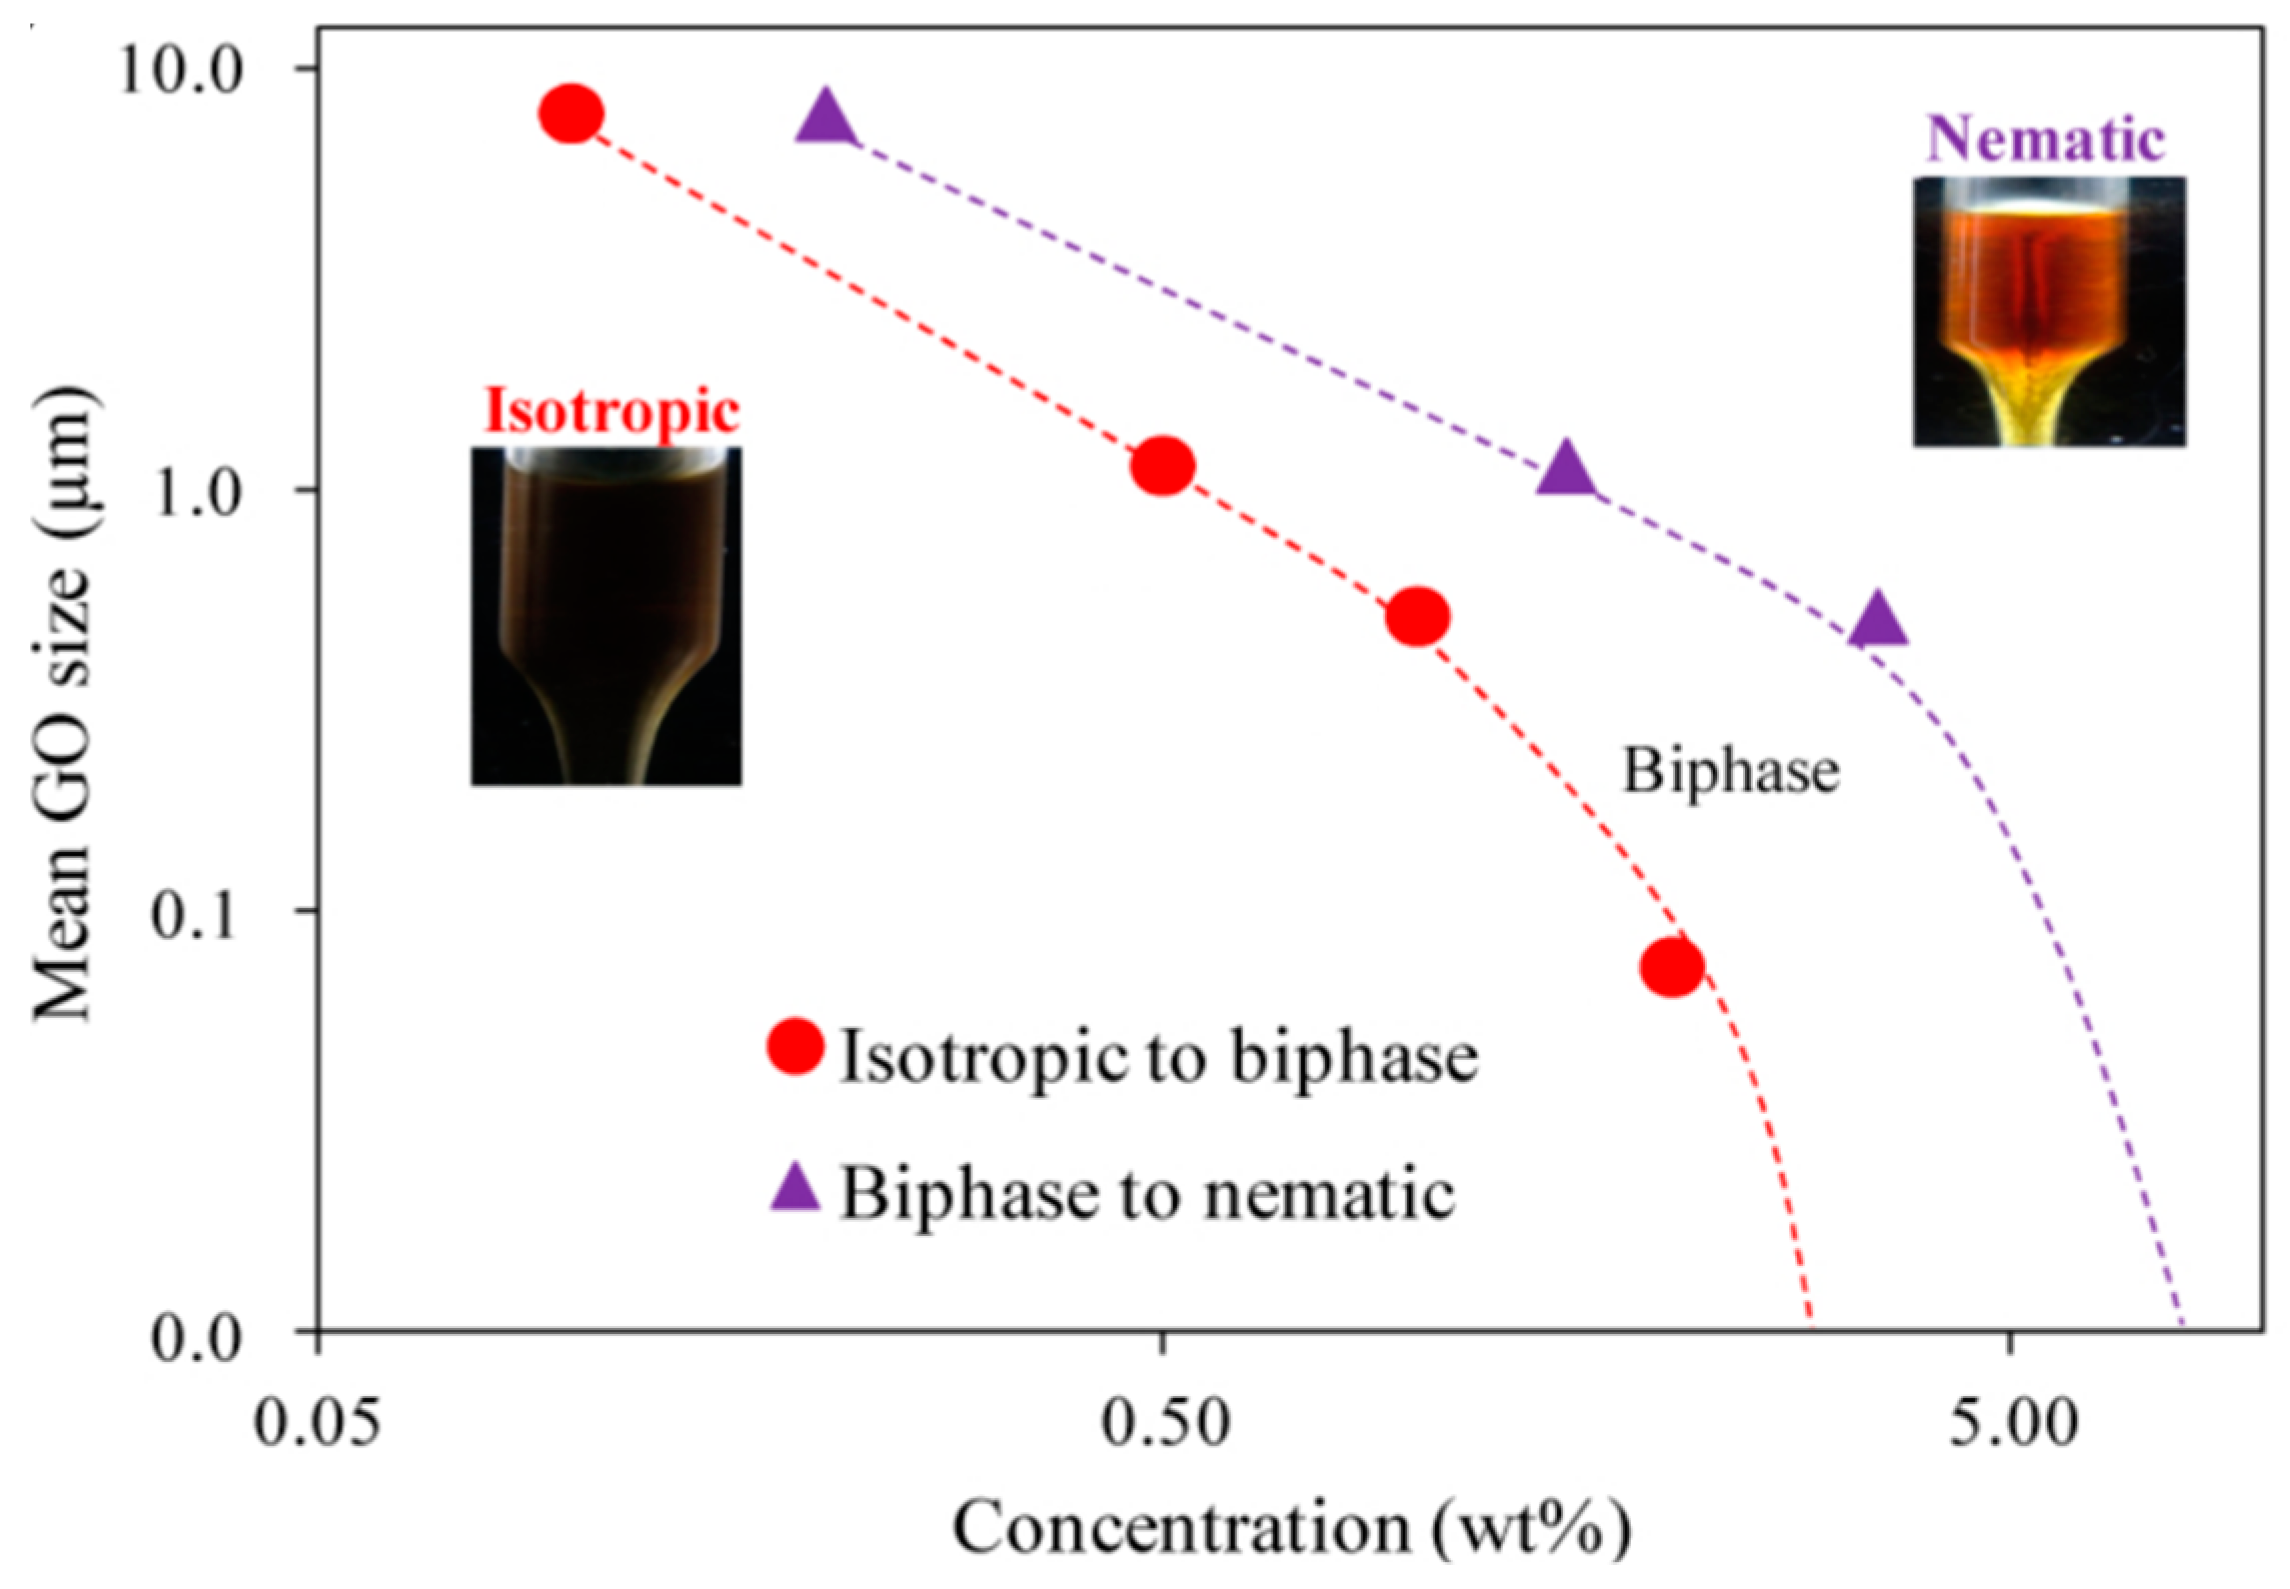
Recently, Ahmad et al. [39] have investigated the dependence of the electro-optical properties of GO dispersions on the graphene oxide flake size. We will return to electro-optic effects later but we note here that the authors’ experimentally determined phase diagram is quite different to that produced from the simulations of Bates and Frenkel [36] (Figure 6). There are various explanations as to why this could be the case. Firstly, GO sheets are not rigid but in fact are highly flexible [40]. Secondly, they are not infinitely thin but have a finite thickness of around 1 nm as determined by atomic force microscopy (AFM) [24,41]. Furthermore, the polydispersity of GO systems cannot usually be approximated by a normal distribution (as the simulations do), and is usually asymmetric with a tail to higher particle sizes (skewed distribution, Pearson distribution). Ahmad et al. [39] determined the phase boundaries through polarized photography of graphene oxide dispersions contained within a Pasteur pipette. Under such conditions, the isotropic phase appears black. However, it is possible to observe transient birefringence caused by flow driven alignment in the isotropic phase [37] (see the next section for more detail), which could be misinterpreted as the onset of the biphasic region. Furthermore, the transition from the two-phase region to the nematic phase is effectively continuous, making the boundary difficult to determine by either photography of macroscopic samples or microscopy.
The overall trend of the phase diagram is at odds with the theoretical model of Bates and Frenkel [36] with the phase boundaries shifting to higher concentration with decreasing mean particle size – the inverse of the theoretical prediction. The reasons for this are not currently well understood. What is known is that current theoretical models are too restrictive and do not accurately represent an experimental system. GO sheets are not, for example, infinitely thin, ridged and of approximately equal size. Although it still appears that the primary driver for the onset of liquid crystallinity is excluded volume effects, there are other ways flakes can interact with each other, as will be discussed herein.
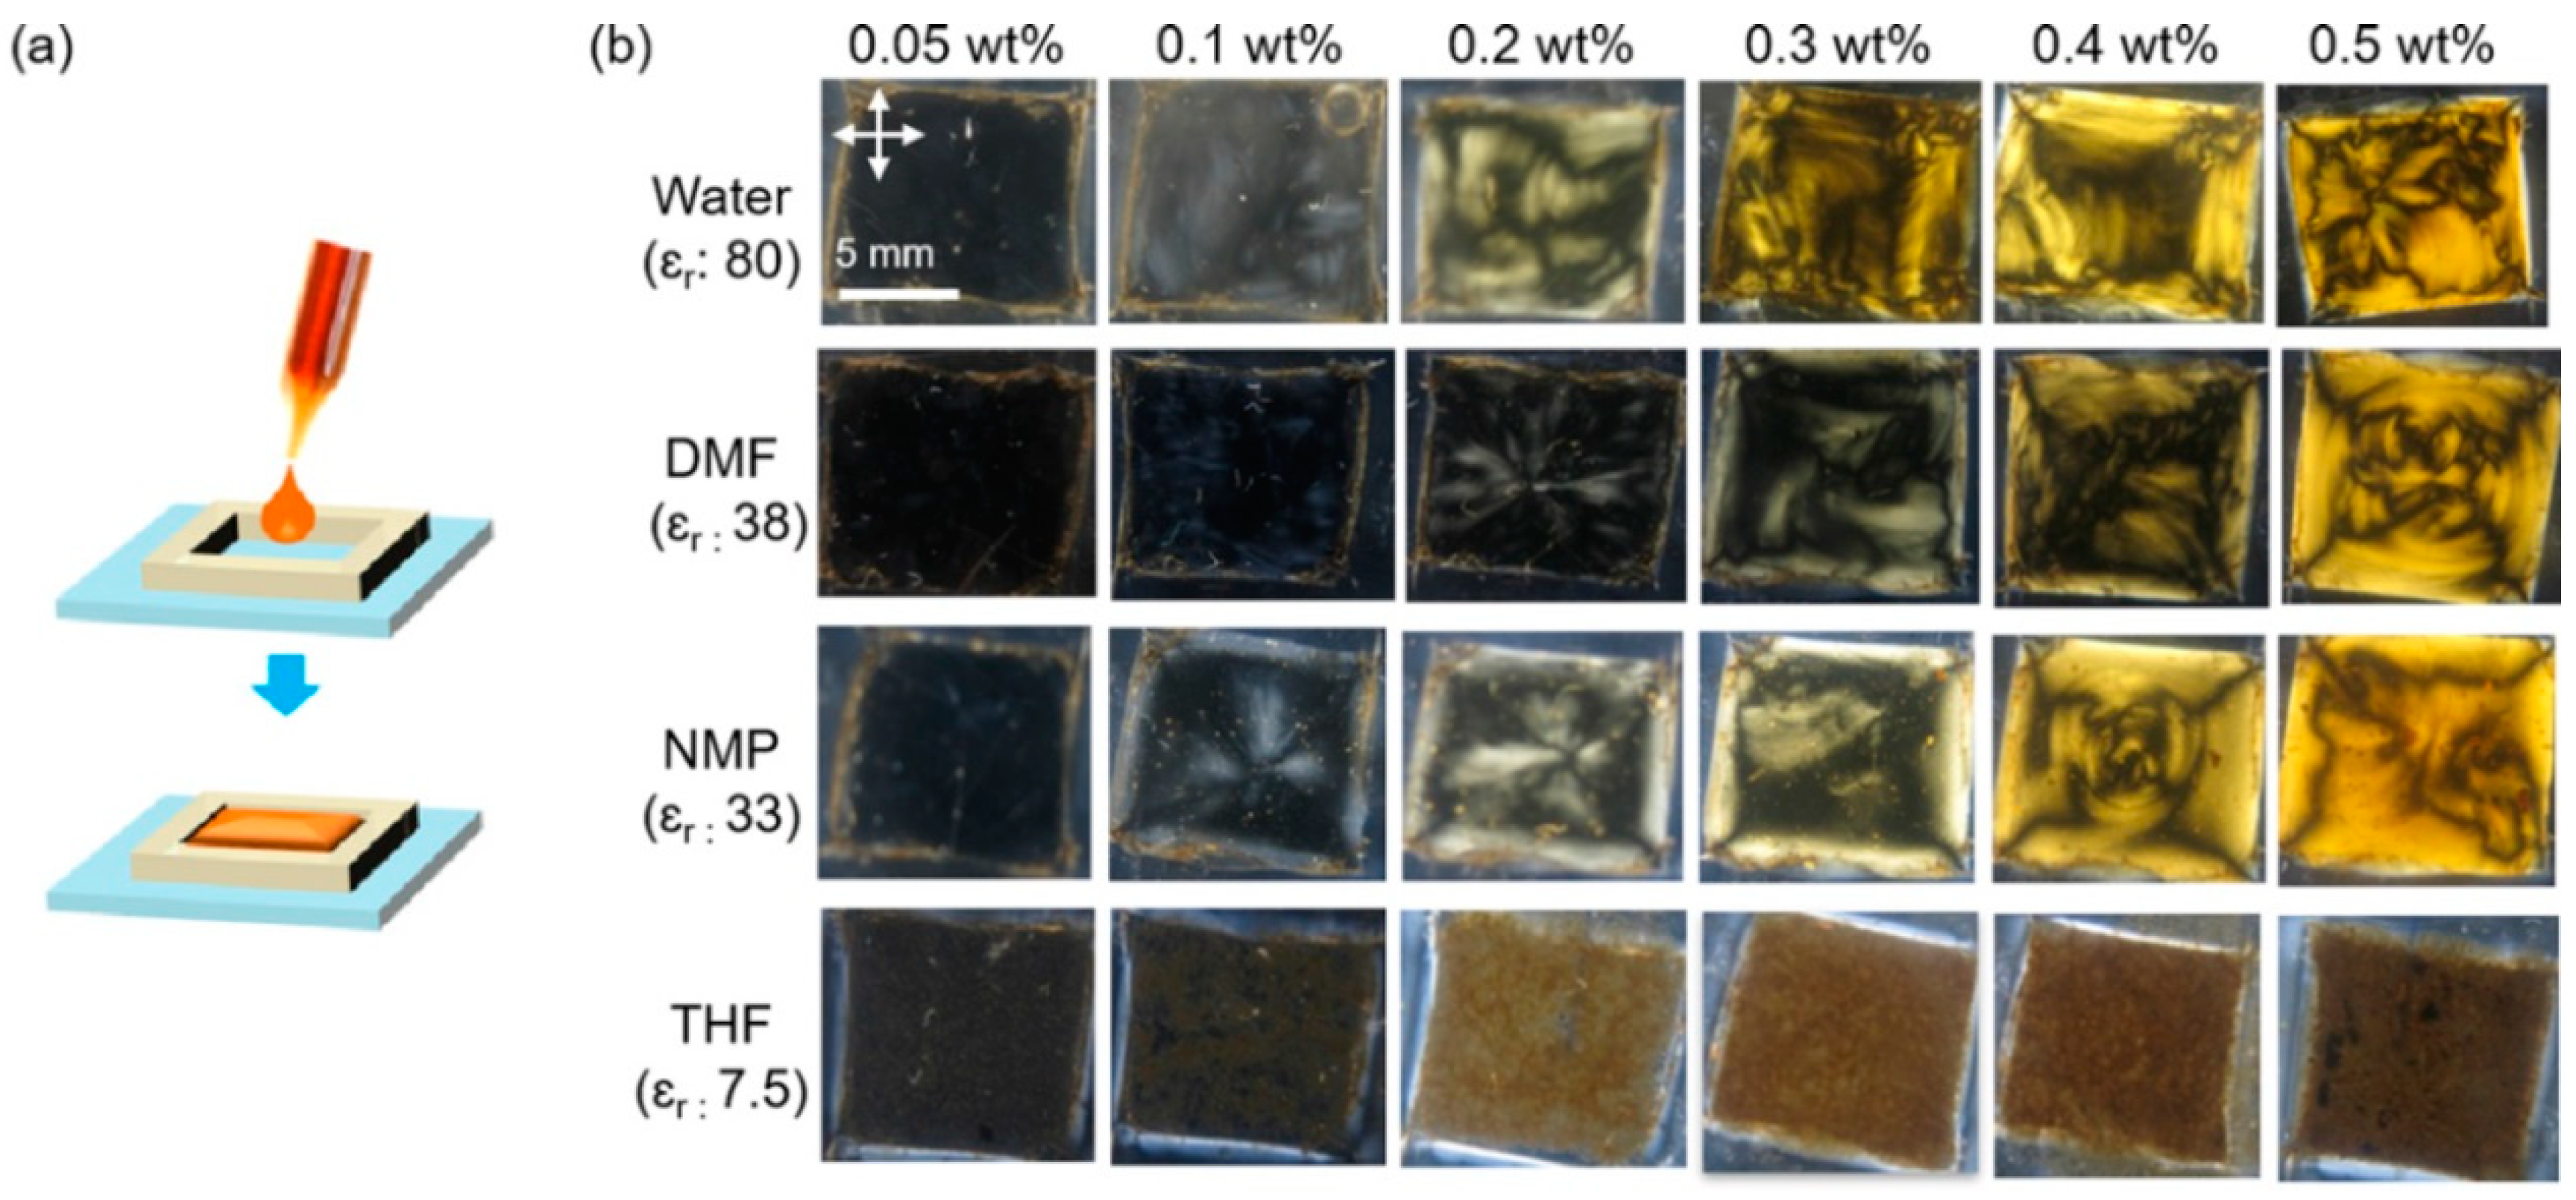
Since, in principle, the phase behaviour of colloidal systems of graphene oxide is only dependent on concentration, the isotropic liquid which acts as the solvent should not play any part, and all solvents that can disperse graphene oxide without aggregation, flocculation or sedimentation should be equal. It has been widely reported [21,41,42] that water, dimethylformamide (DMF) and N-methyl-2-pyrrolidone (NMP) are the best of the common laboratory solvents for dispersing graphene oxide. Accordingly, lyotropic liquid crystalline behavior was found in all three of these in another paper by Ahmad et al. [42] (Figure 7).
Ionization of the polar oxygen functional groups on the GO surface in solvents leads to GO being negatively charged, and thus electrostatic interactions play a role in the dispersion of graphene oxide and the pair-wise interaction. By measuring the conductivity of GO dispersions in the three different solvents Ahmad et al. [42] showed that the surface ionization of GO varies depending on the solvent, with water having the highest conductivity and hence aqueous GO having the highest surface ionization.
5. Alignment of GO Liquid Crystals
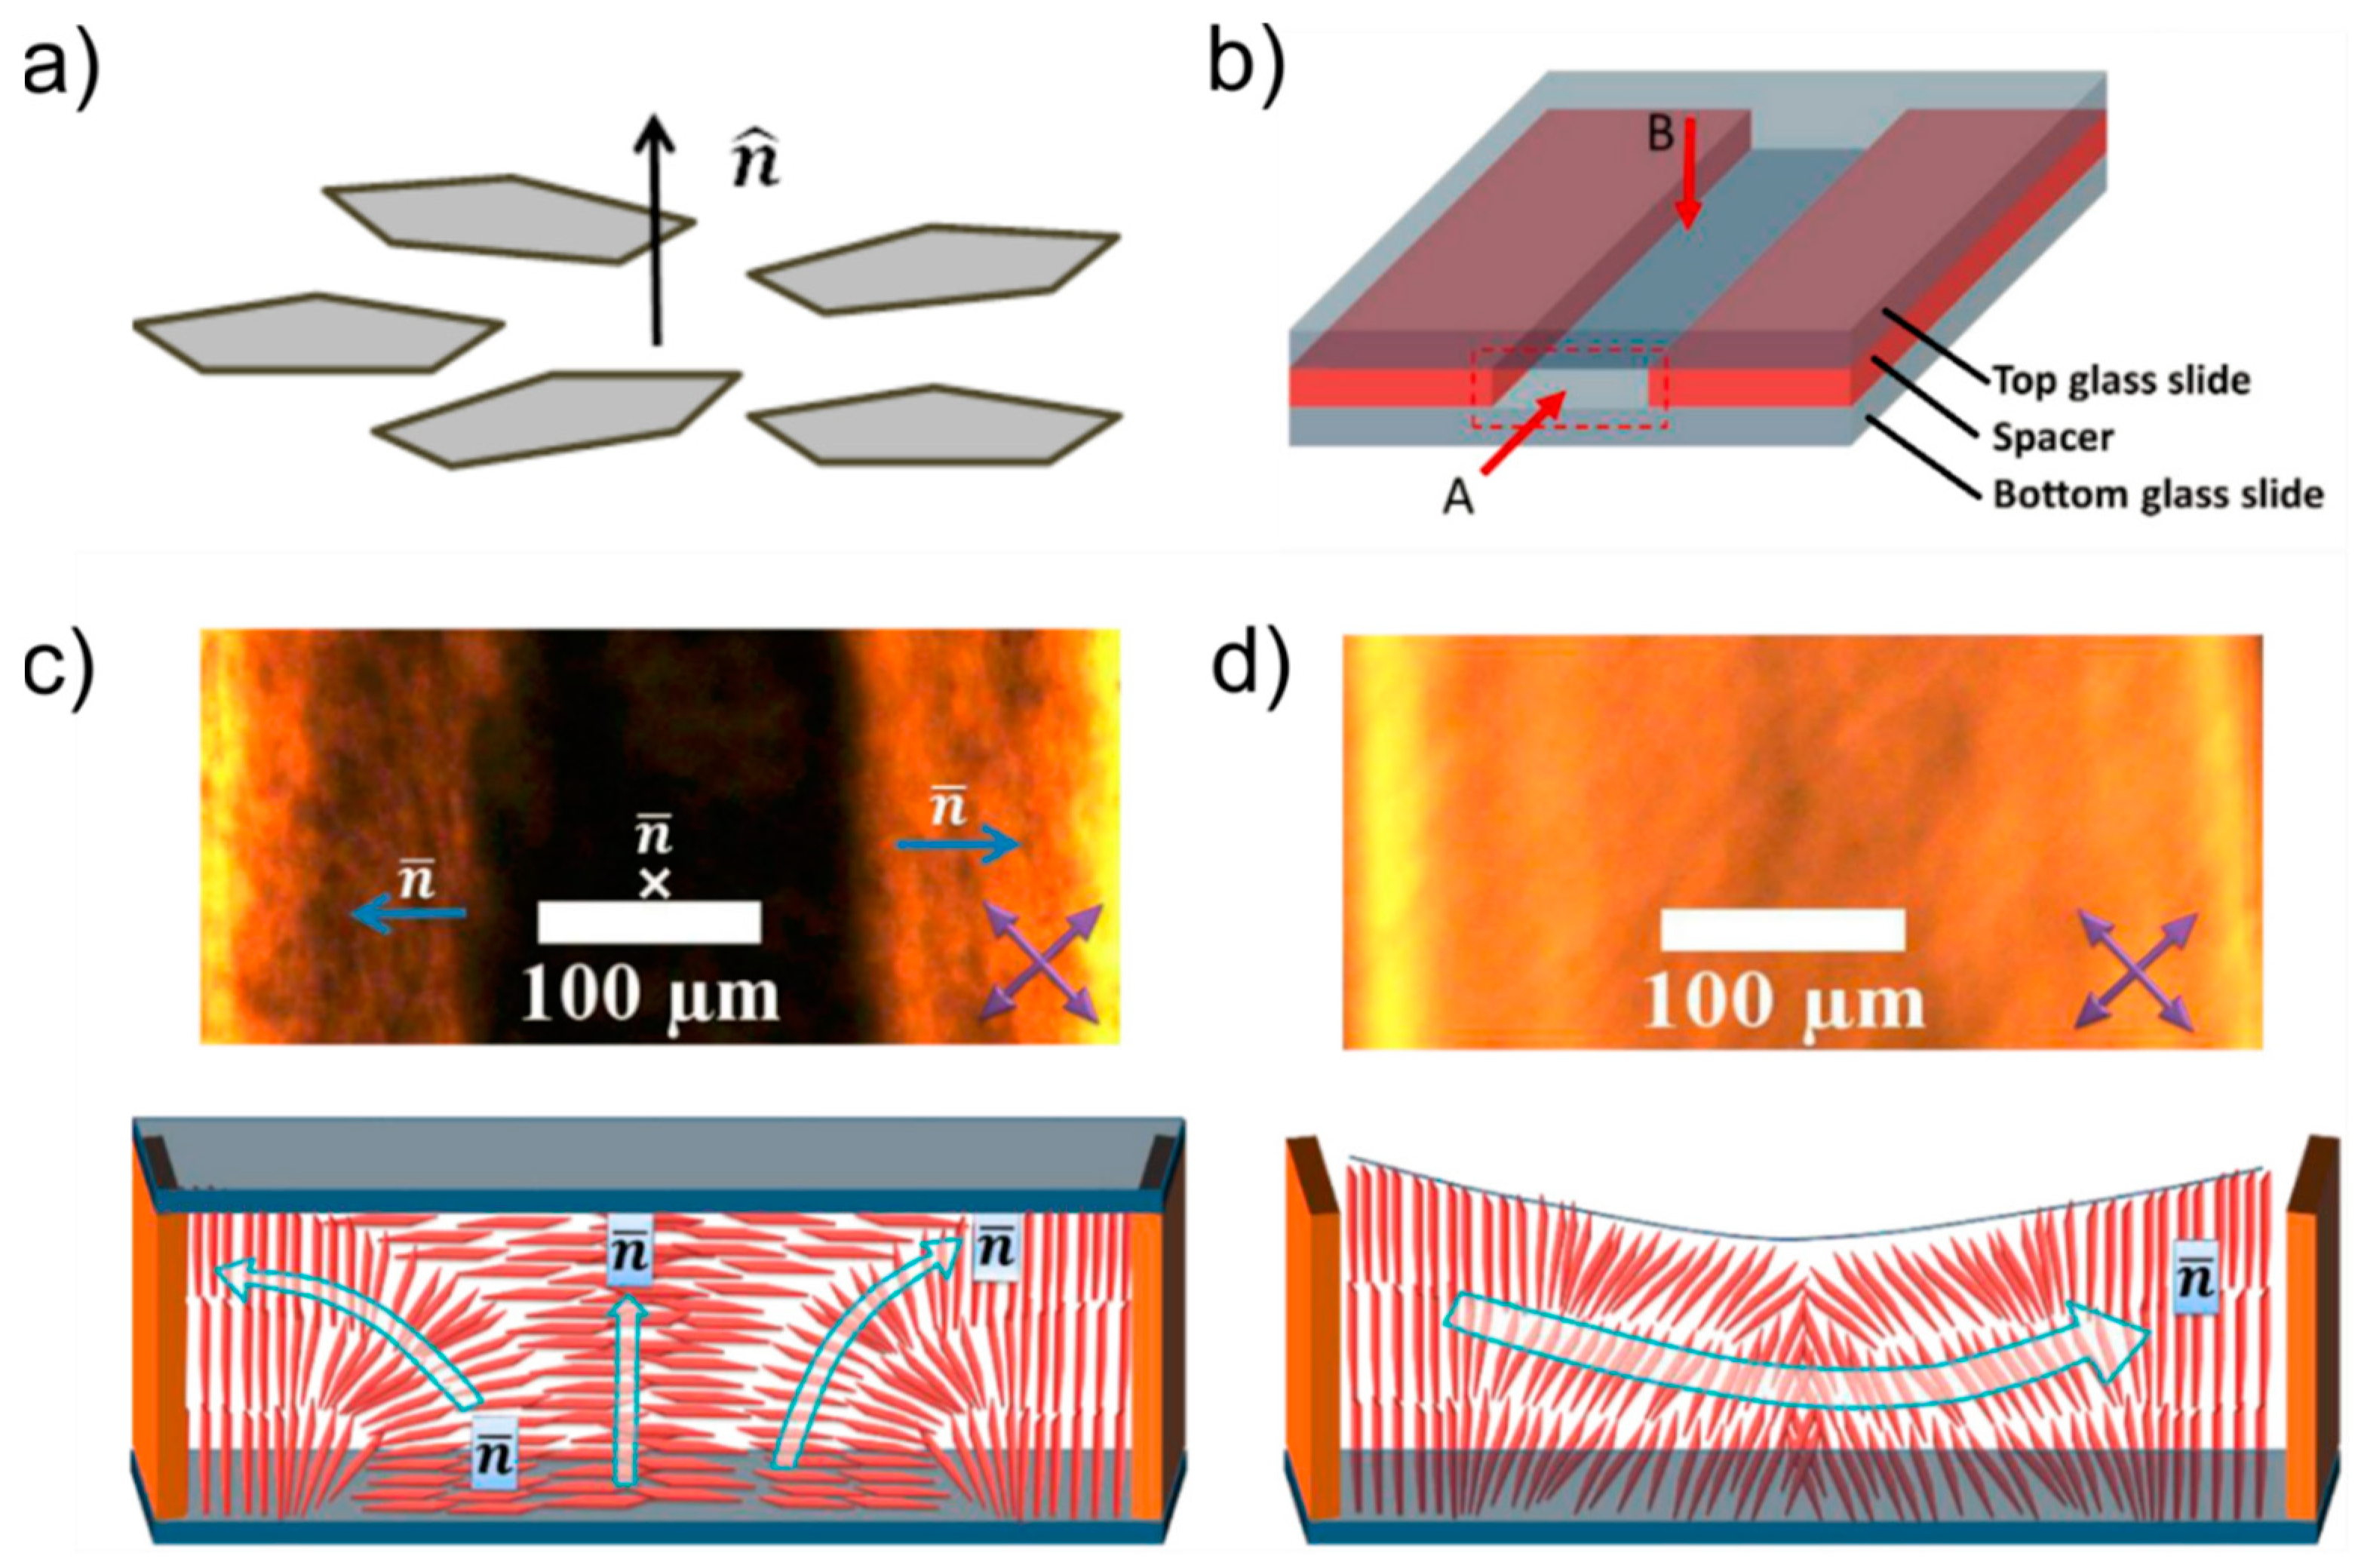
The alignment of conventional thermotropic liquid crystals can be achieved using surface treatment of the glass used to confine them for study. Examples include rubbed polyimide for planar alignment and the use of surfactants such as C-TAB or DMOAP for homeotropic alignment. Graphene oxide liquid crystals are a very different system however, with flakes being tens of thousands of times larger than thermotropic liquid crystal molecules. In 2011, Dan et al. [13] reported that nematic GO confined in a rectangular capillary aligned spontaneously with the average GO sheet normal (the optical axis in this case) being parallel to the capillary axis. However, they suspected this was a metastable state [13]. Recently Al-Zangana et al. [43] have shown that graphene oxide sheets in solution tend to prefer to lie parallel to glass. Thus, the director aligns perpendicularly to a glass surface. This has been demonstrated by the construction of both covered and uncovered glass channels constructed from microscope slides and coverslips (Figure 8). In polarized optical microscopy, the channel appears bright when its axis is placed at 45° to each of the polarizers, indicating uniform alignment of the director field perpendicular to the axis of the channel, along its length. When a glass plate is placed on top of this channel, the middle section becomes dark, irrespective of the position of the channel relative to the polarizers. This indicates local homeotropic alignment of the director field i.e. the graphene oxide is parallel to the glass plate.
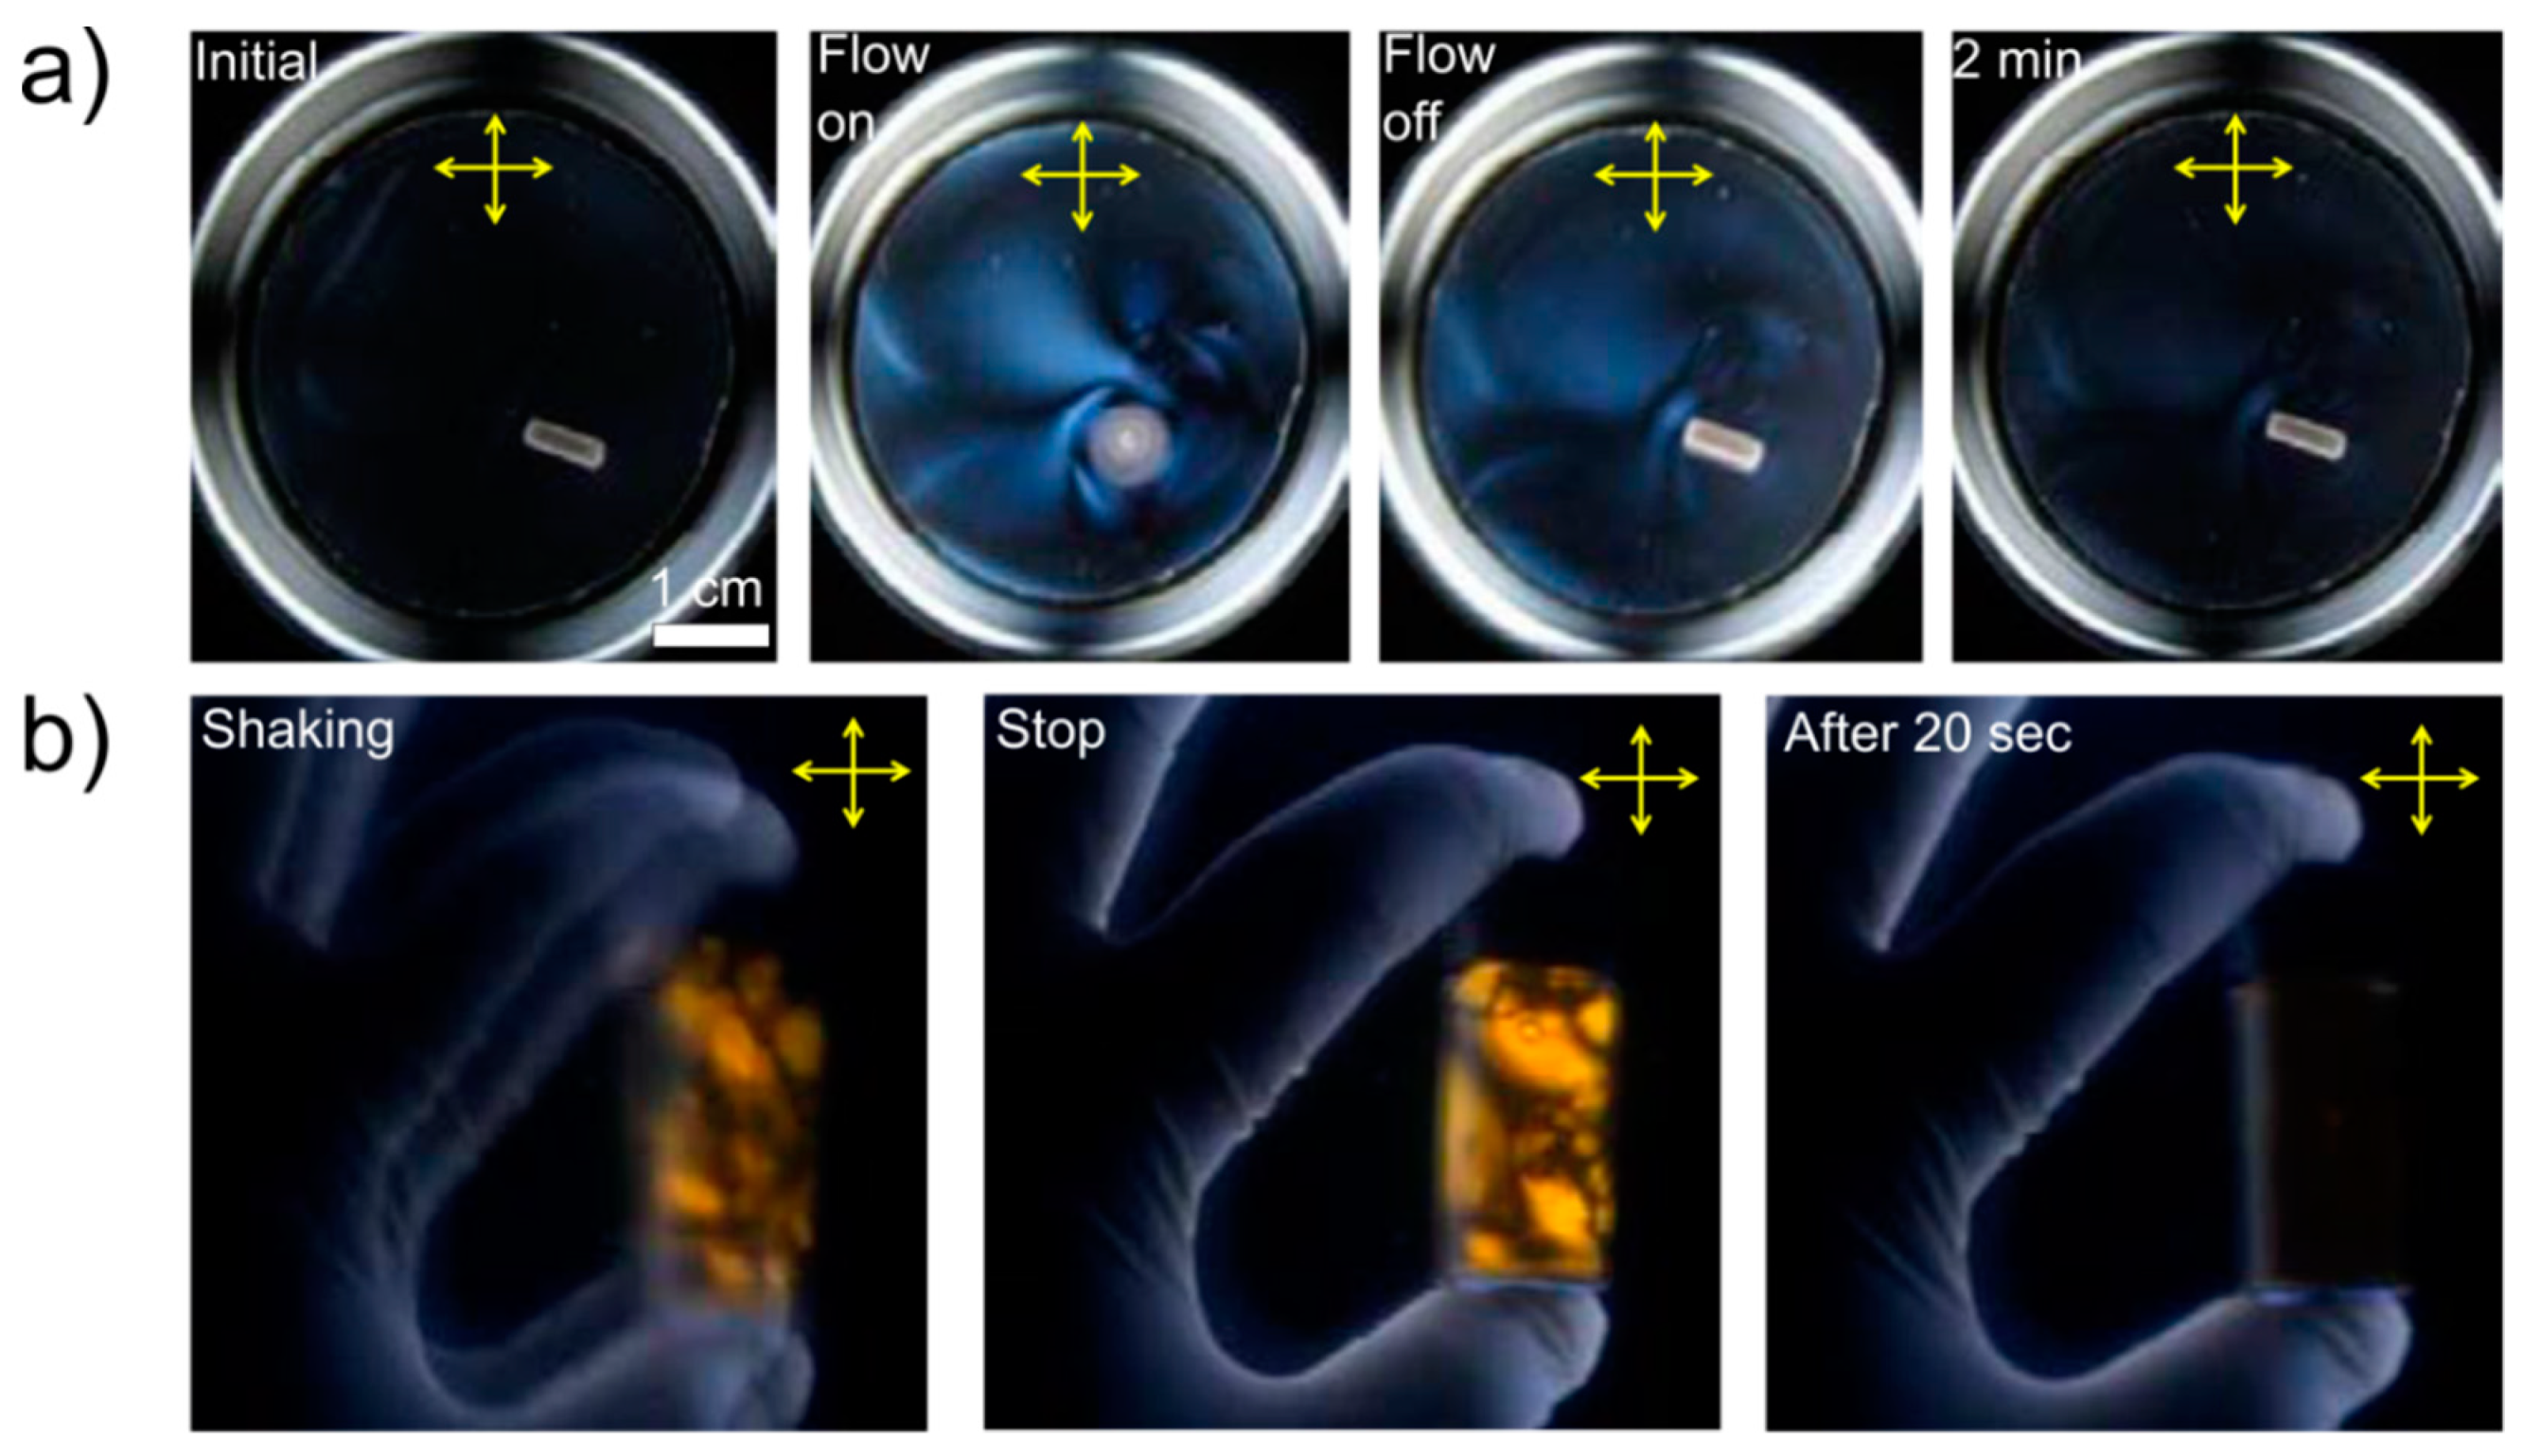
Shear flows can also cause GO liquid crystals in the isotropic phase to be birefringent. This has been demonstrated by Shen et al. [37] by using magnetic stirring and manual shaking of samples between crossed polarizers (Figure 9). The birefringence observed can be explained by the graphene oxide flakes feeling a torque caused by the velocity field of the solvent. This causes local alignment of the graphene oxide flakes, and hence birefringence, where the change in velocity of the solvent is greatest.
Tkacz et al. [44] have also shown that dispersions of reduced graphene oxide can be used to produce highly aligned films on glass substrates. The authors proposed that diffusion of sheets in the fluid, assisted by capillary forces, causes the self-assembly of the sheets on the substrate.
6. Ions and Polymers in GO Liquid Crystals
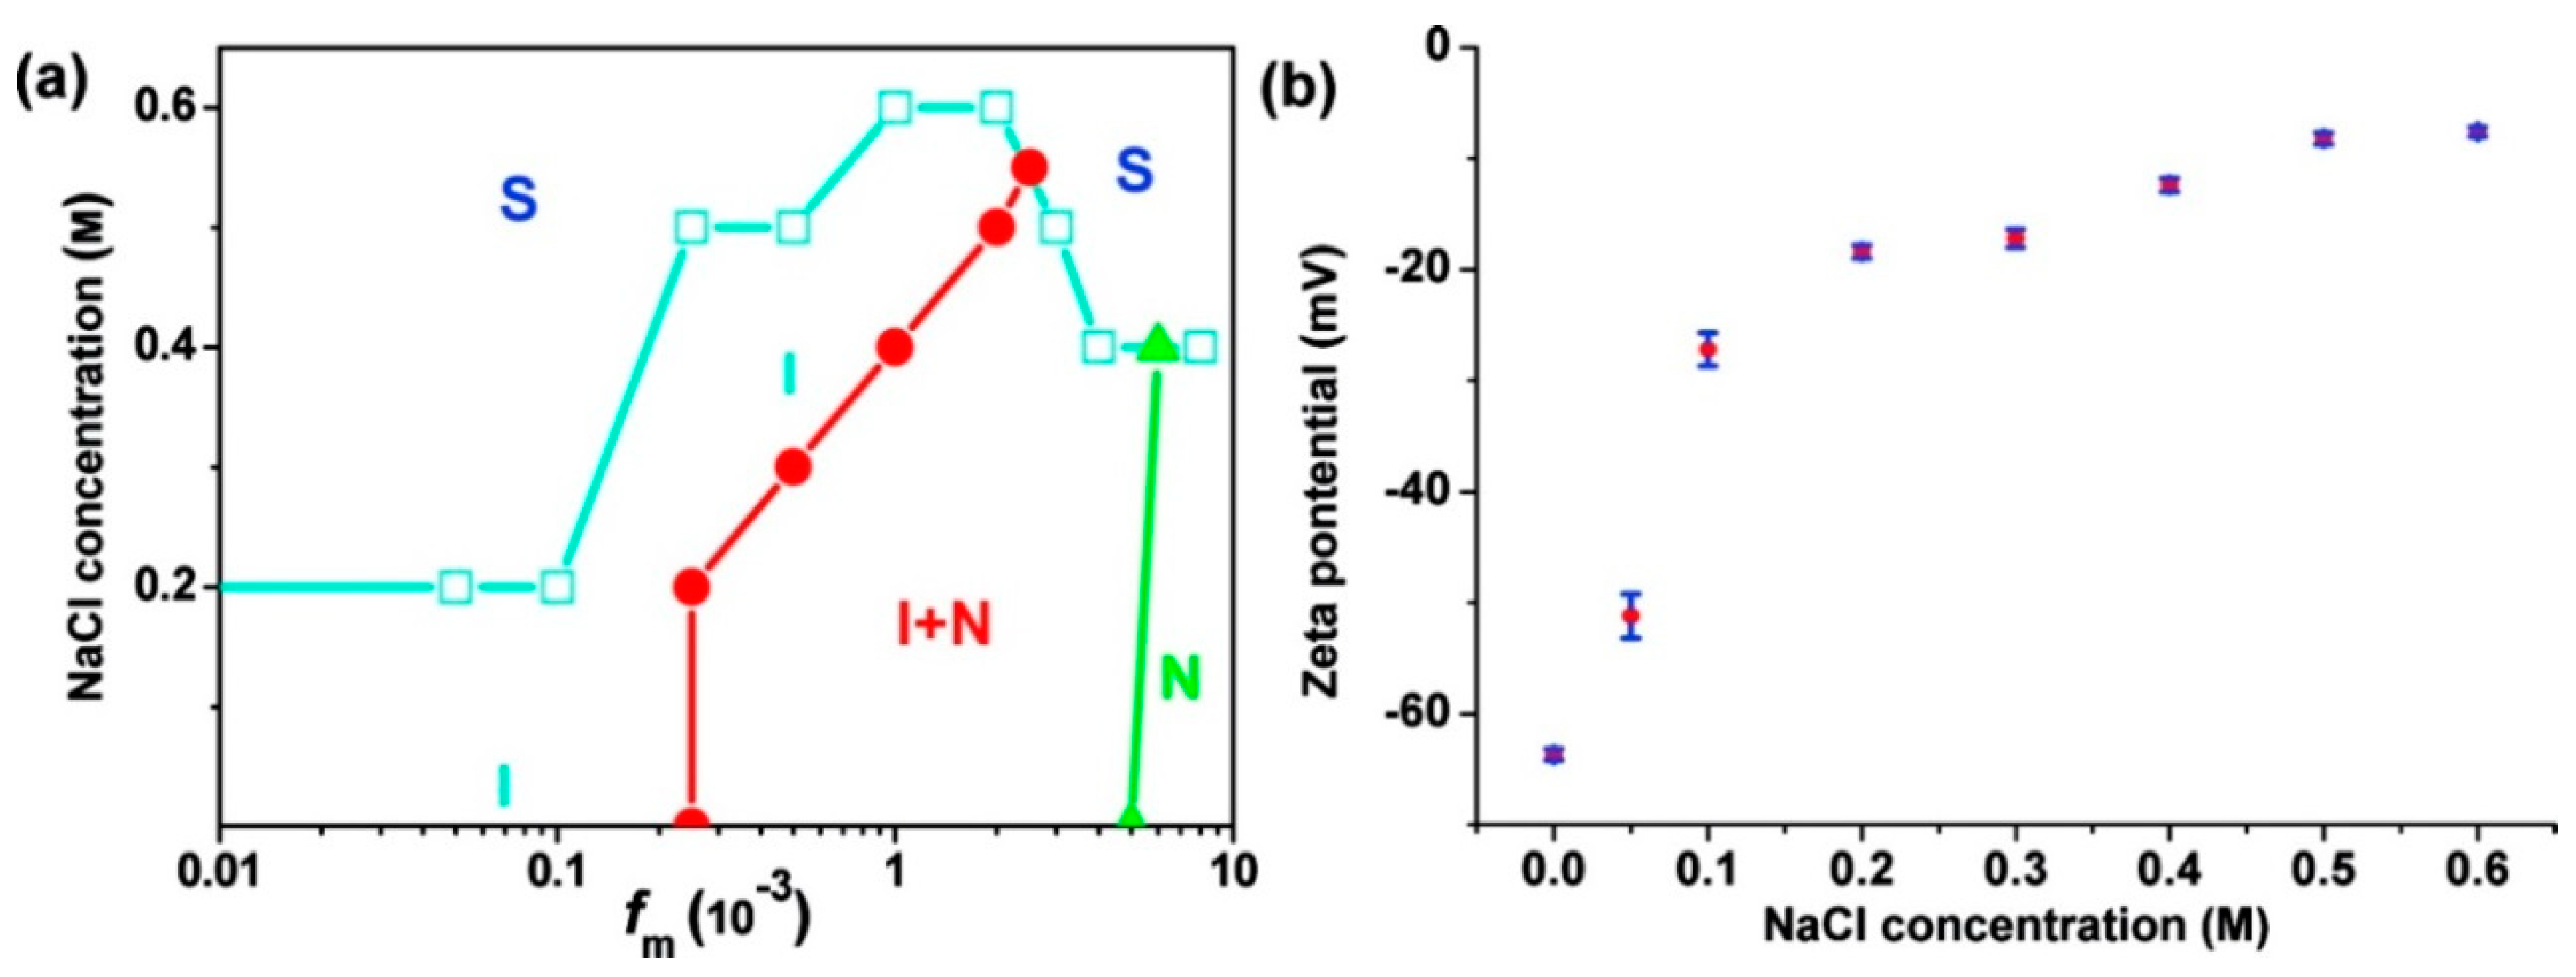
Xu and Gao [12] have demonstrated that electrostatic interactions also play a role in the lyotropic behaviour of graphene oxide to some degree. To reveal this, they measured the phase behaviour by observing POM images as a function of salt (NaCl) concentration. If the NaCl concentration was too high, the repulsive force between the sheets was reduced such that flocculation occurred. Small amounts of NaCl did however influence the width of the two-phase region significantly (Figure 10). The authors also measured the zeta-potential of the dispersion for each concentration studied and found the absolute value decreased with increasing NaCl content. These results indicate that both electrostatic and excluded volume effects play a role in the lyotropic behaviour of graphene oxide, and that the overall stability of the nematic phase is reduced in an electrolyte environment. However, Zhao et al. [45] have shown that by coating the GO flakes with polyelectrolytes, the nematic phase can remain stable even in NaCl concentrations of up to 6.2 M, depending on the polyelectrolyte employed.
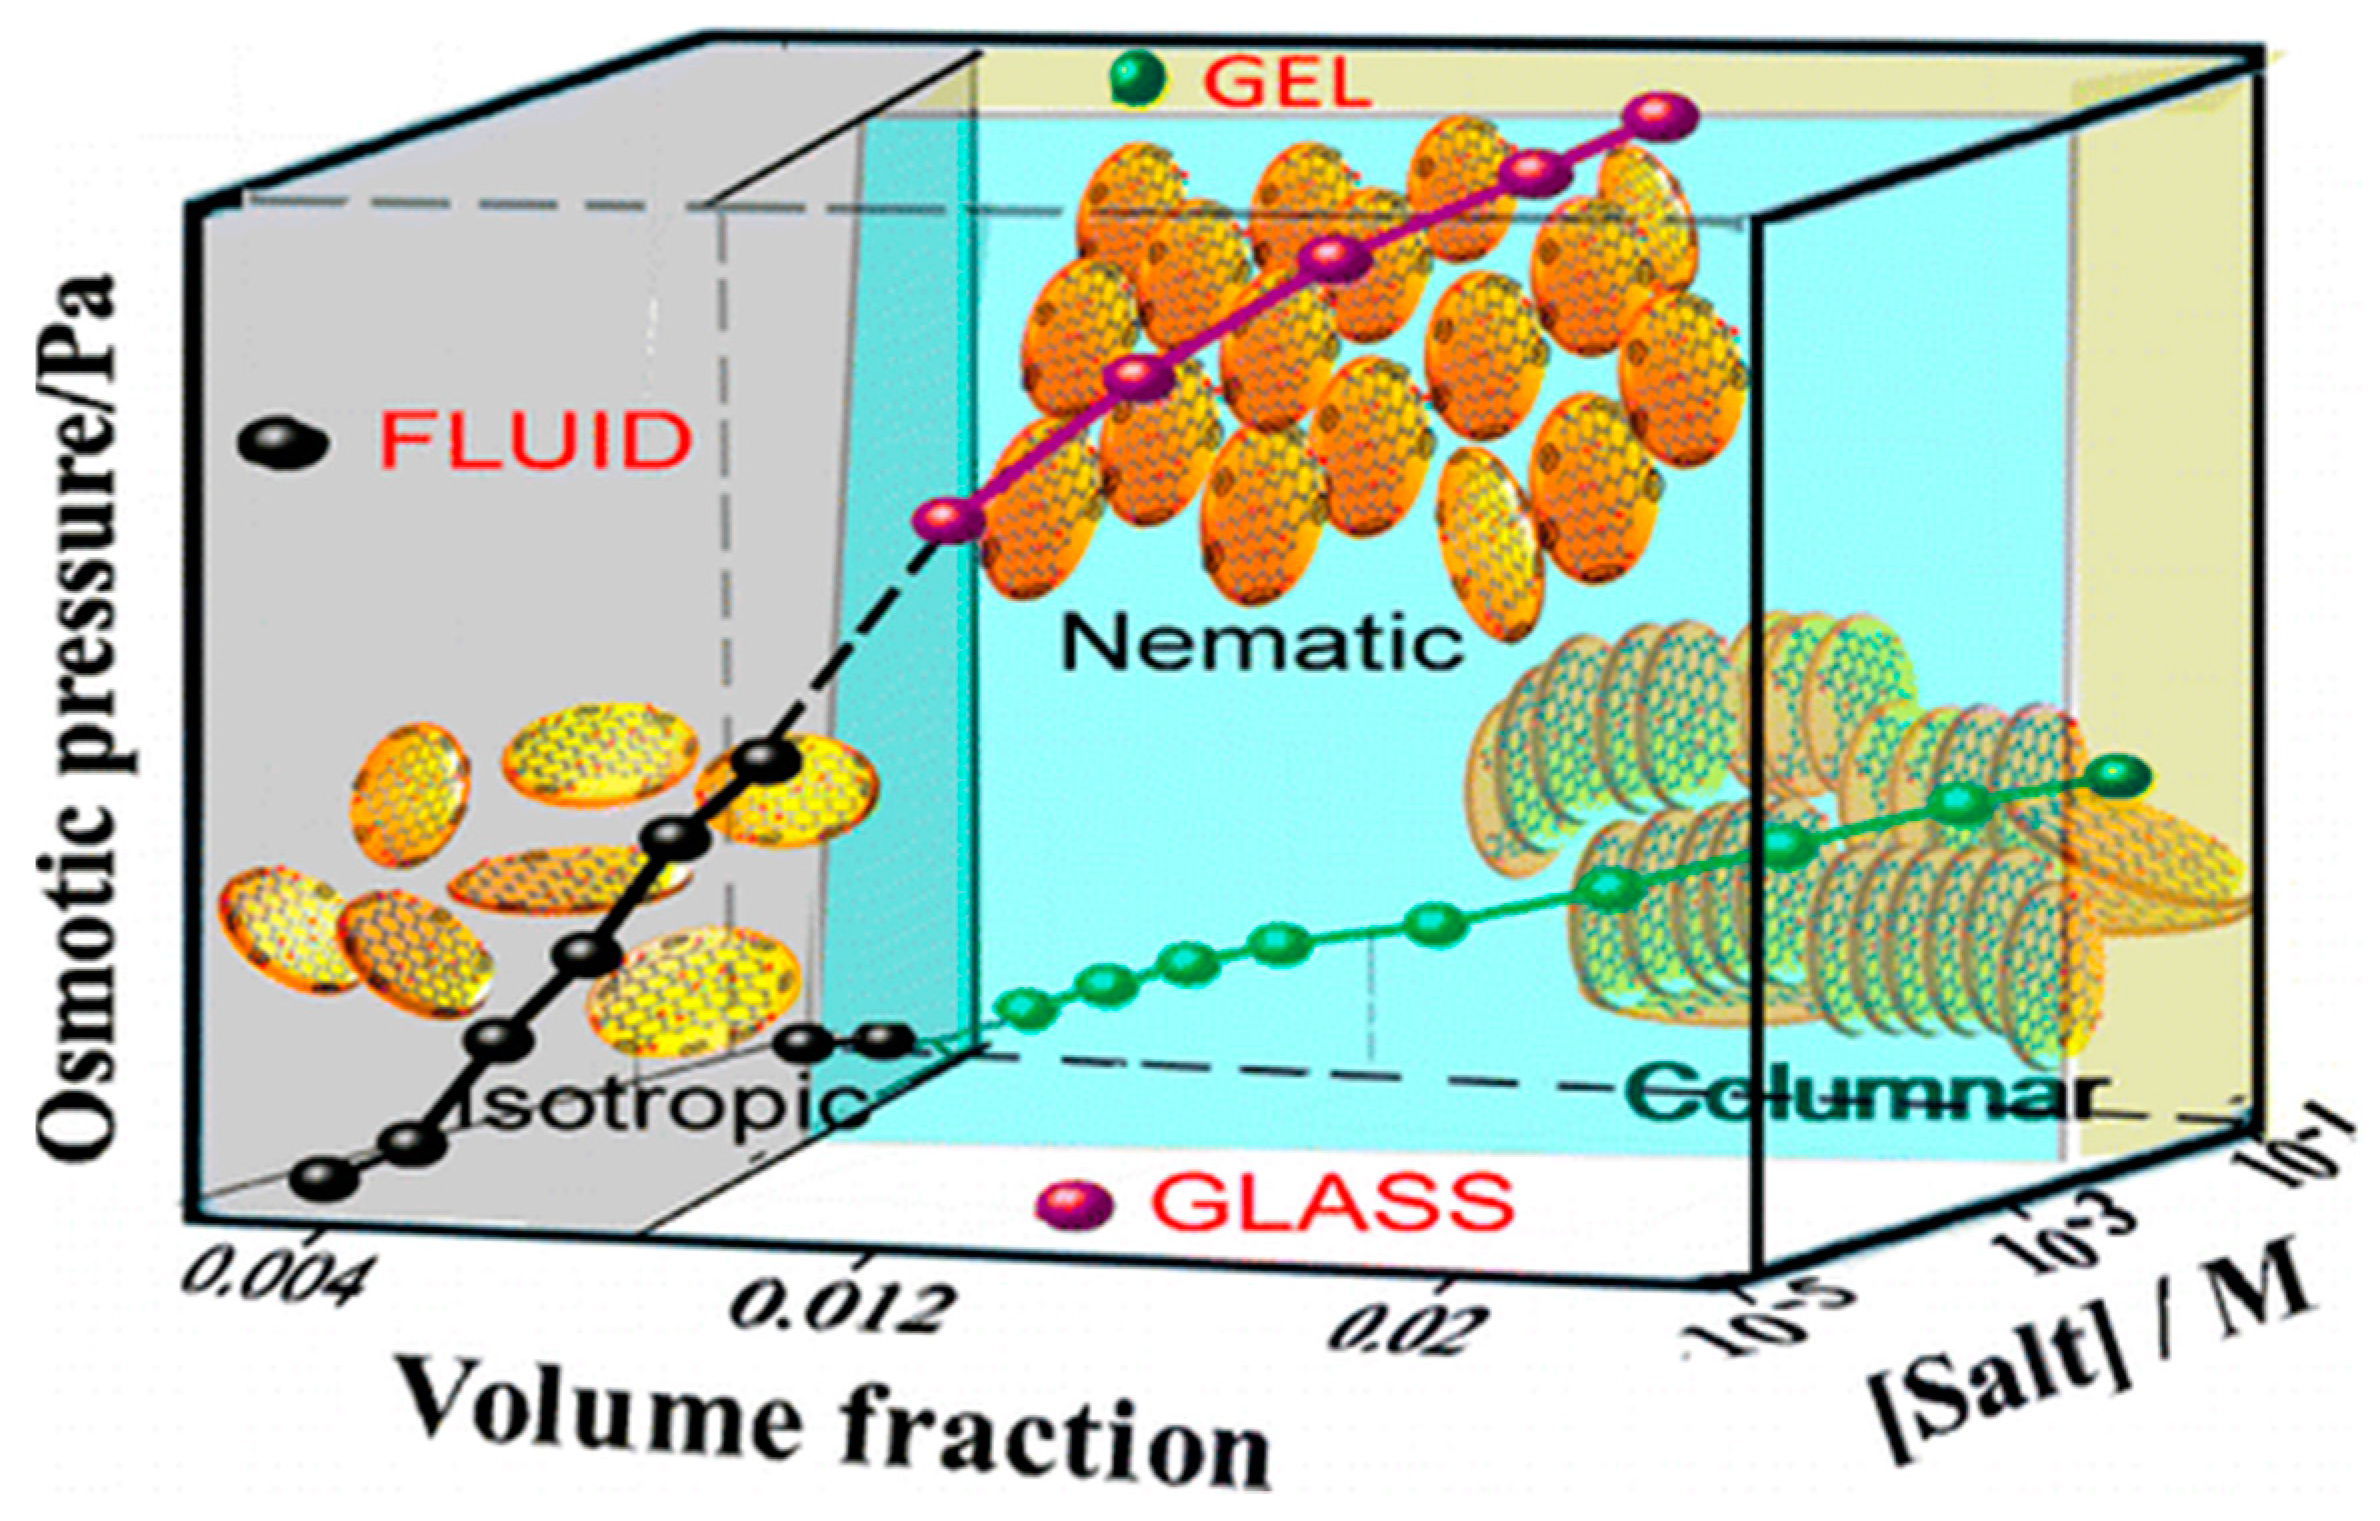
Konkena and Vasudevan [46] have also demonstrated that by varying the GO and NaCl salt concentrations, a number of different phases or arrested states can be formed (Figure 11). By arrested states, the authors refer to structures which are not at global minima of the thermodynamic potential, thus metastable [46]. At high GO concentrations, but low salt concentrations where electrostatic repulsion dominates the interactions, a glass is observed. This is attributed as a Wigner glass, which is analogous to the Wigner crystals of electrons in solids [47,48]. Wigner glasses have also been observed in dispersions of other plate-like materials such as laptonite [49]. GO glasses and gels do not flow, unlike nematic liquid crystals, and so can be easily identified by inverting the container of the GO dispersion. To further demonstrate a glass experimentally, the authors performed dilution experiments. The glass, in which GO interactions are predominantly repulsive, melts upon the addition of further solvent whereas the states observed at higher salt concentrations do not [46] Konkena and Vasudevan further suggest that at higher salt concentrations, the dominant GO interaction is an attractive one which leads to a phase which appears dark between crossed polarizers but turns bright when sheared. These observations point towards homeotropic alignment of the graphene oxide sheets i.e. collectively the sheets are in the same plane as the substrate and perpendicular to the light path. This behaviour is attributed to the onset of a columnar phase by the authors, based on the appearance of the POM textures [46] though recent X-ray scattering experiments by Rubim et al. suggest that this observation could be a lamellar phase [50].
Graphene oxide liquid crystals are often observed with water as the solvent. Typically, the water is deionized and at pH ~7 for a fresh dispersion. However, the LC behaviour can also be observed at pH 2, 6 and 9 as reported by Tkacz et al. [51] As the pH increases, the fraction of dissociated carboxylic groups changes (the pKa value is ~4 for these groups [52]) and so too does the width of the biphasic region between the isotropic and nematic phases. This work further suggests that electrostatic interactions between GO sheets are important for the onset of lyotropic behavior. Furthermore, at biphasic concentrations, highly ordered phase-separated nematic droplets were observed [51].
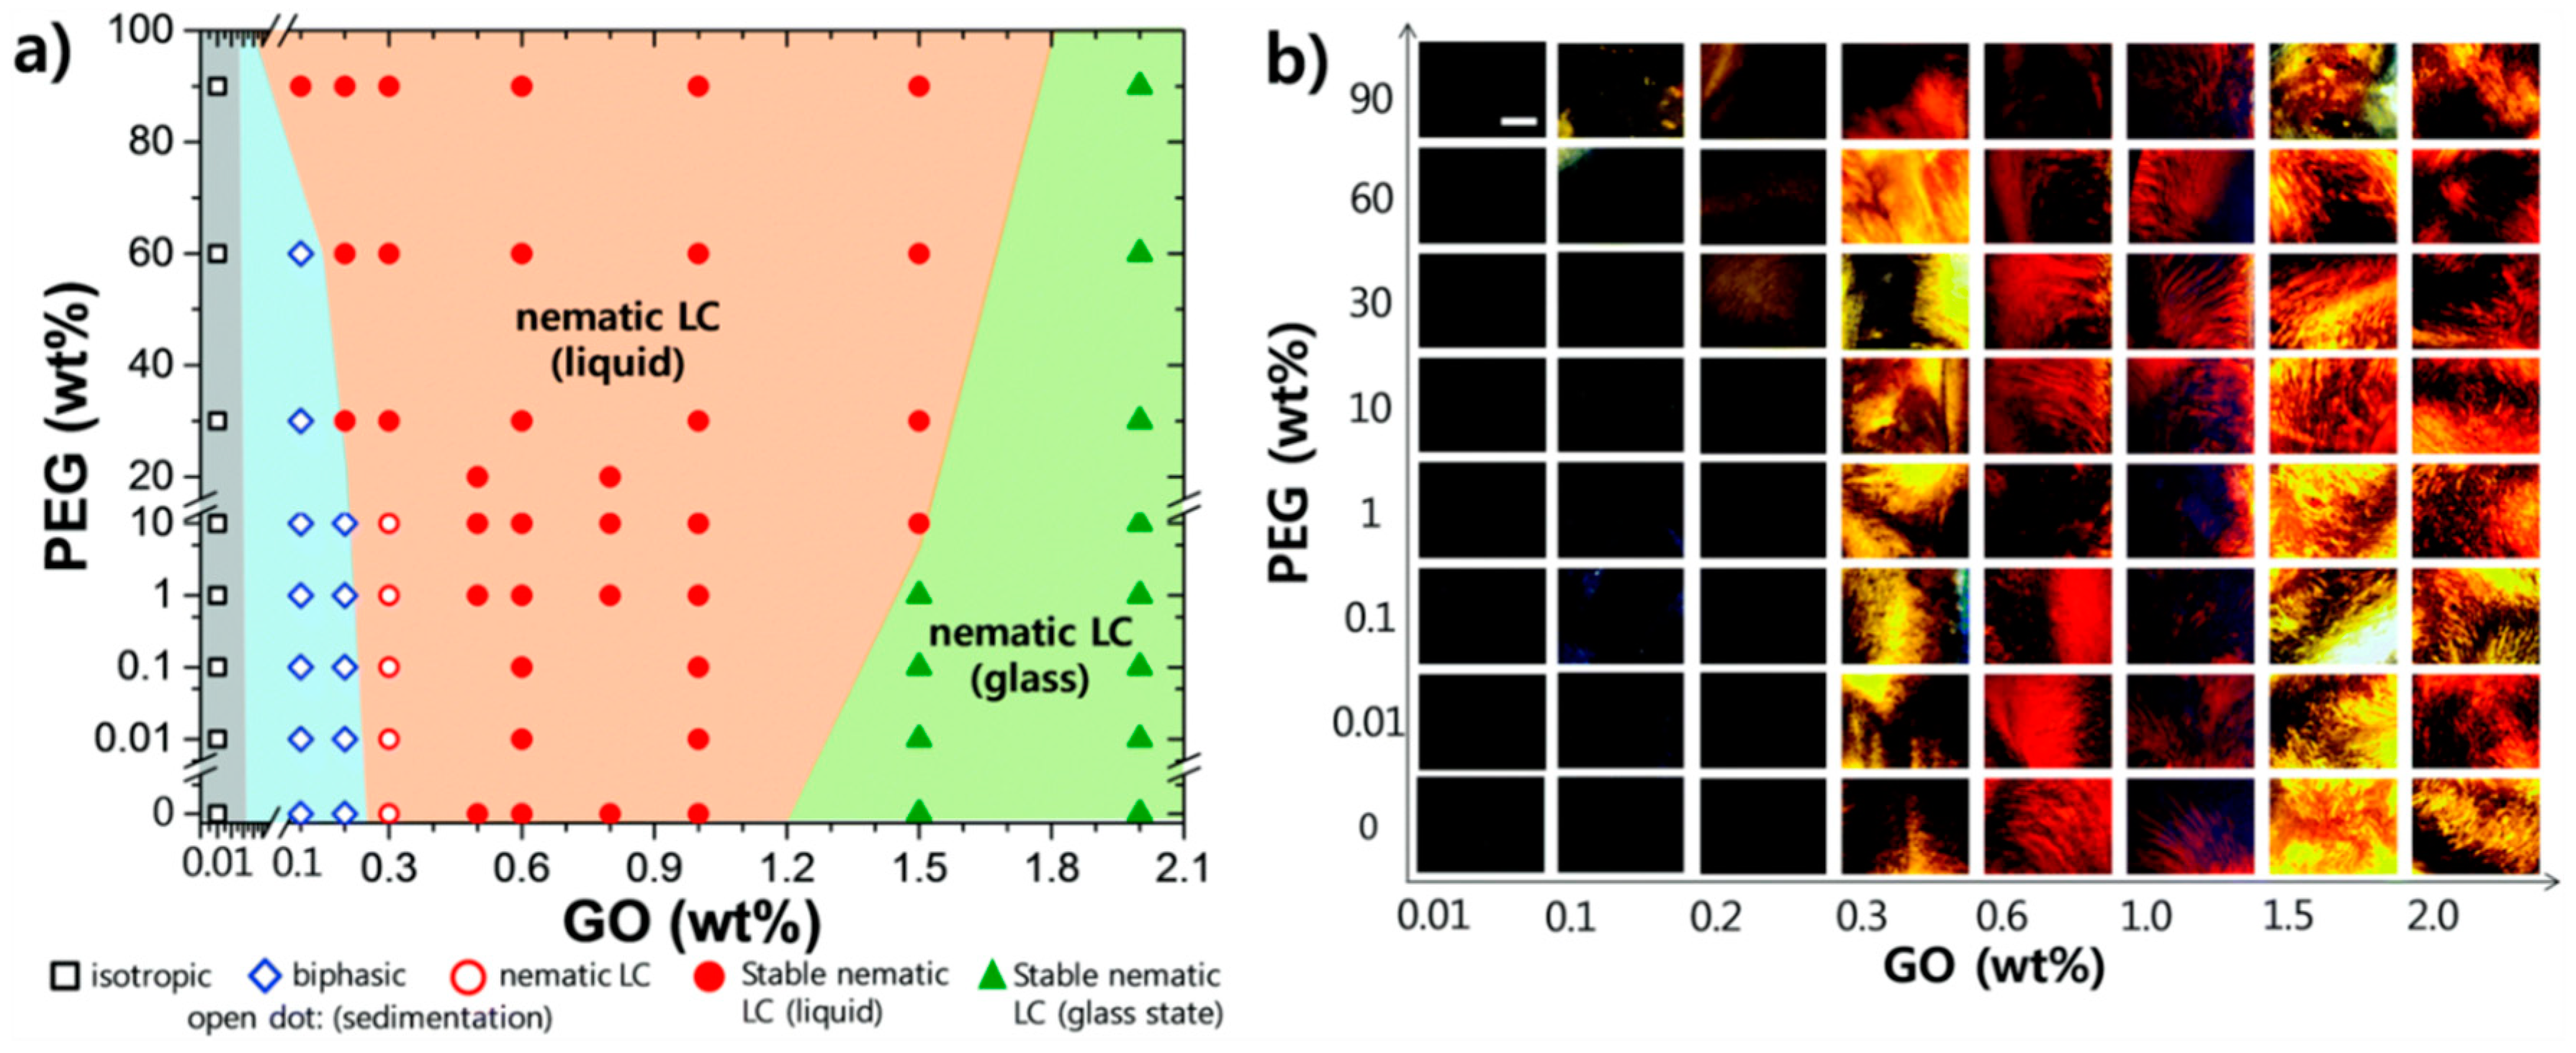
The addition of polymers to a colloidal liquid crystal system is often performed to better stabilize the dispersion via steric hindrance or to cause gelation. Recently, Shim et al. [53] have reported that the addition of polyethylene glycol (PEG) to GO LCs causes the onset of the nematic phase to occur at lower concentrations of GO in the total volume. Furthermore, they report that the Wigner glass transition of the GO dispersion is pushed up to higher GO concentrations. [53] Therefore the overall effect of the addition of PEG widens the nematic phase. The concentrations of PEG required to observe these effects are rather high (Figure 12).
The addition of PEG to a concentration of 20 wt% in the mixture causes the macroscopic viscosity of the whole dispersion to decrease by a factor of 20–30 relative to that of GO in pure water, for the same concentration of GO. This, the authors rightly suggest, points to a need for a greater understanding of the micro-structure of the polymer-solvent-GO system at the GO surface. In a follow-up work by the same group [54], a selection of molecular weights of PEG were used. It was shown that PEG with a larger average molecular weight (10,000 gmol−1) reduced electrostatic repulsion between the sheets, which is the origin of the glass transition in GO. Reduction of this repulsive energy was offered as explanation for a decrease in the macro-viscosity of the LC. If PEG with a lower molecular weight (400 gmol−1) was added, the viscosity did not decrease by the same amount.
7. Electro-Optic Effects
Birefringence induced by electric fields can be observed in a variety of otherwise optically isotropic materials. These effects are commonly grouped into one of two categories, the Pockels effect or the Kerr effect, depending on whether the induced birefringence is proportional to the magnitude of the applied electric field or its square, respectively [55]. The Pockels effect only occurs in crystals which lack inversion symmetry. Dispersions of graphene oxide in the isotropic, biphasic and nematic phases have displayed electric field-induced birefringence [37,39,42,56]. In the case of the nematic phase, this corresponds most likely to a reorientation of the director field as a whole, as is the case with thermotropic nematics. In the less concentrated phases, a Kerr effect is observed where each flake, from whichever orientation it was in, aligns itself to the electric field. This behavior of a GO flake in an electric field can be described by the Maxwell–Wagner–O’Konski model [57,58]. The key parameters of the GO in this framework are the aspect ratio and the ionic conductivity at the surface. It is known that in aqueous dispersions GO is negatively charged with an ionic double layer at its surface [12].
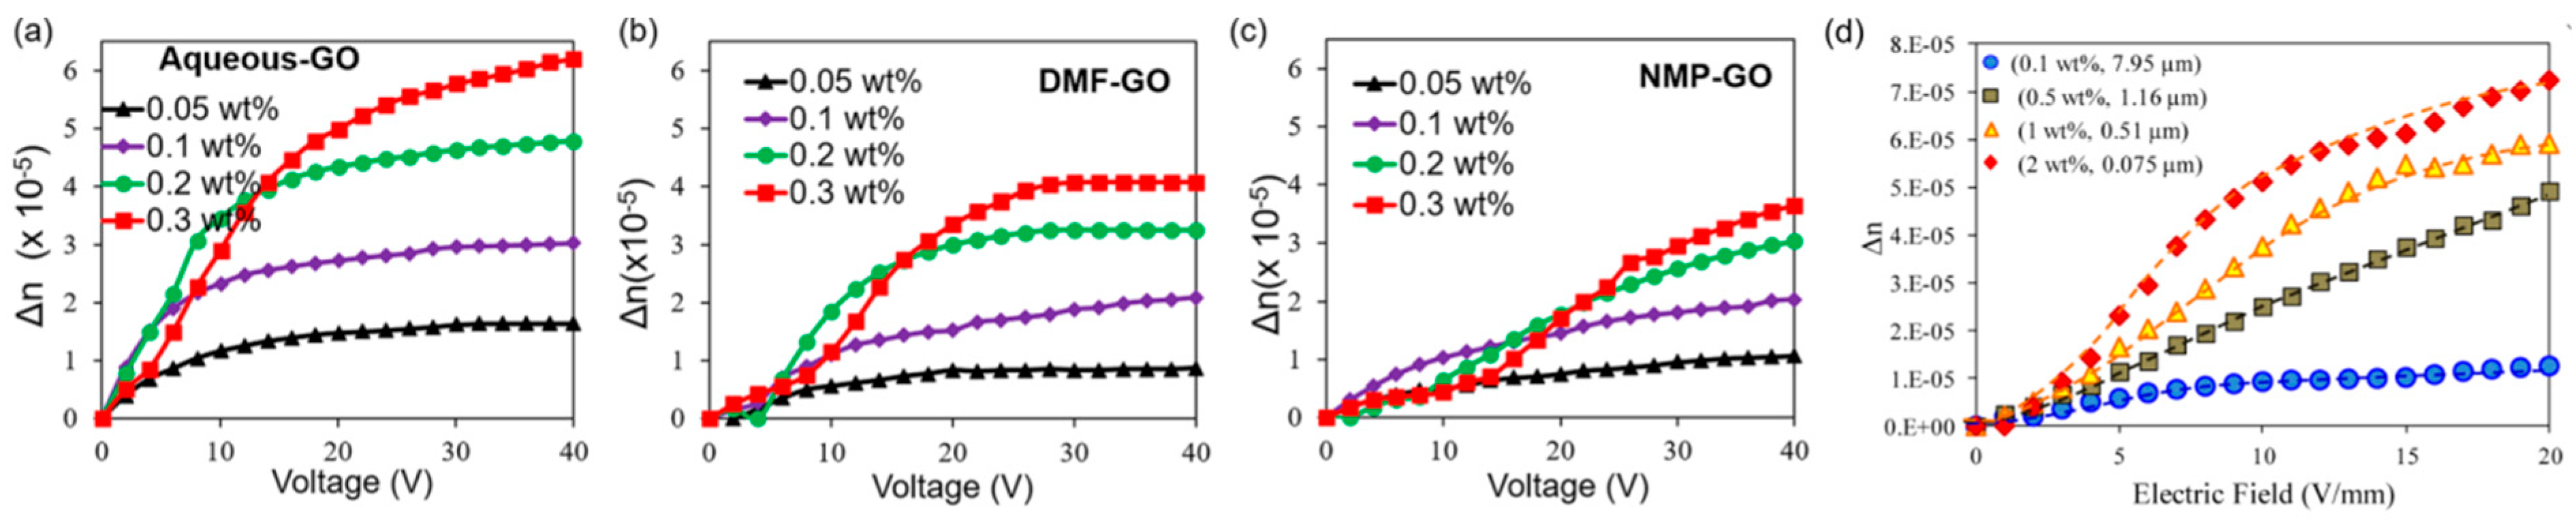
Shen et al. [37] measured the Kerr coefficient of aqueous dispersions of graphene oxide and found values of the order 10−5 mV−2. This value is very high in comparison to other materials known to have high Kerr coefficients such as thermotropic liquid crystal blue phases (~10−9 mV−2) [59,60,61] or nitrobenzene (10−12 mV−2) [62]. In a qualitatively similar system consisting of suspended platelets of clay the Kerr coefficient was four orders of magnitude lower than that of graphene oxide [62]. Shen et al. [37] also observed that the electric field-induced birefringence decreased as the concentration was increased through the biphasic region and that in the concentrated nematic phase there was barely any effect of the electric field at up to 20 Vmm−1. By analogy, thermotropic nematic liquid crystals require much higher field strengths to switch the director (~0.7 Vµm−1). In contrast, Ahmad et al. [42] measured a significant field-induced birefringence in the nematic phase with field strengths of 10 Vmm−1 or lower (Figure 13). Interestingly, they also found that the maximum field-induced birefringence of a given flake size distribution depended on what solvent it was dispersed in [42]. Water was found to outperform both DMF and NMP at high frequency (10 kHz), but electrophoretic drift of the GO particles was observed at lower frequencies (100 Hz). Both of these results were attributed to the higher ionic content of the aqueous dispersion [42] which occurs because the surface functional groups of graphene oxide are easily ionized in aqueous dispersions. The maximum field-induced birefringence has been shown to be affected by the flake size and distribution [63] (Figure 13) but interestingly also the number of cleaning steps taken in the production of the graphene oxide [64].
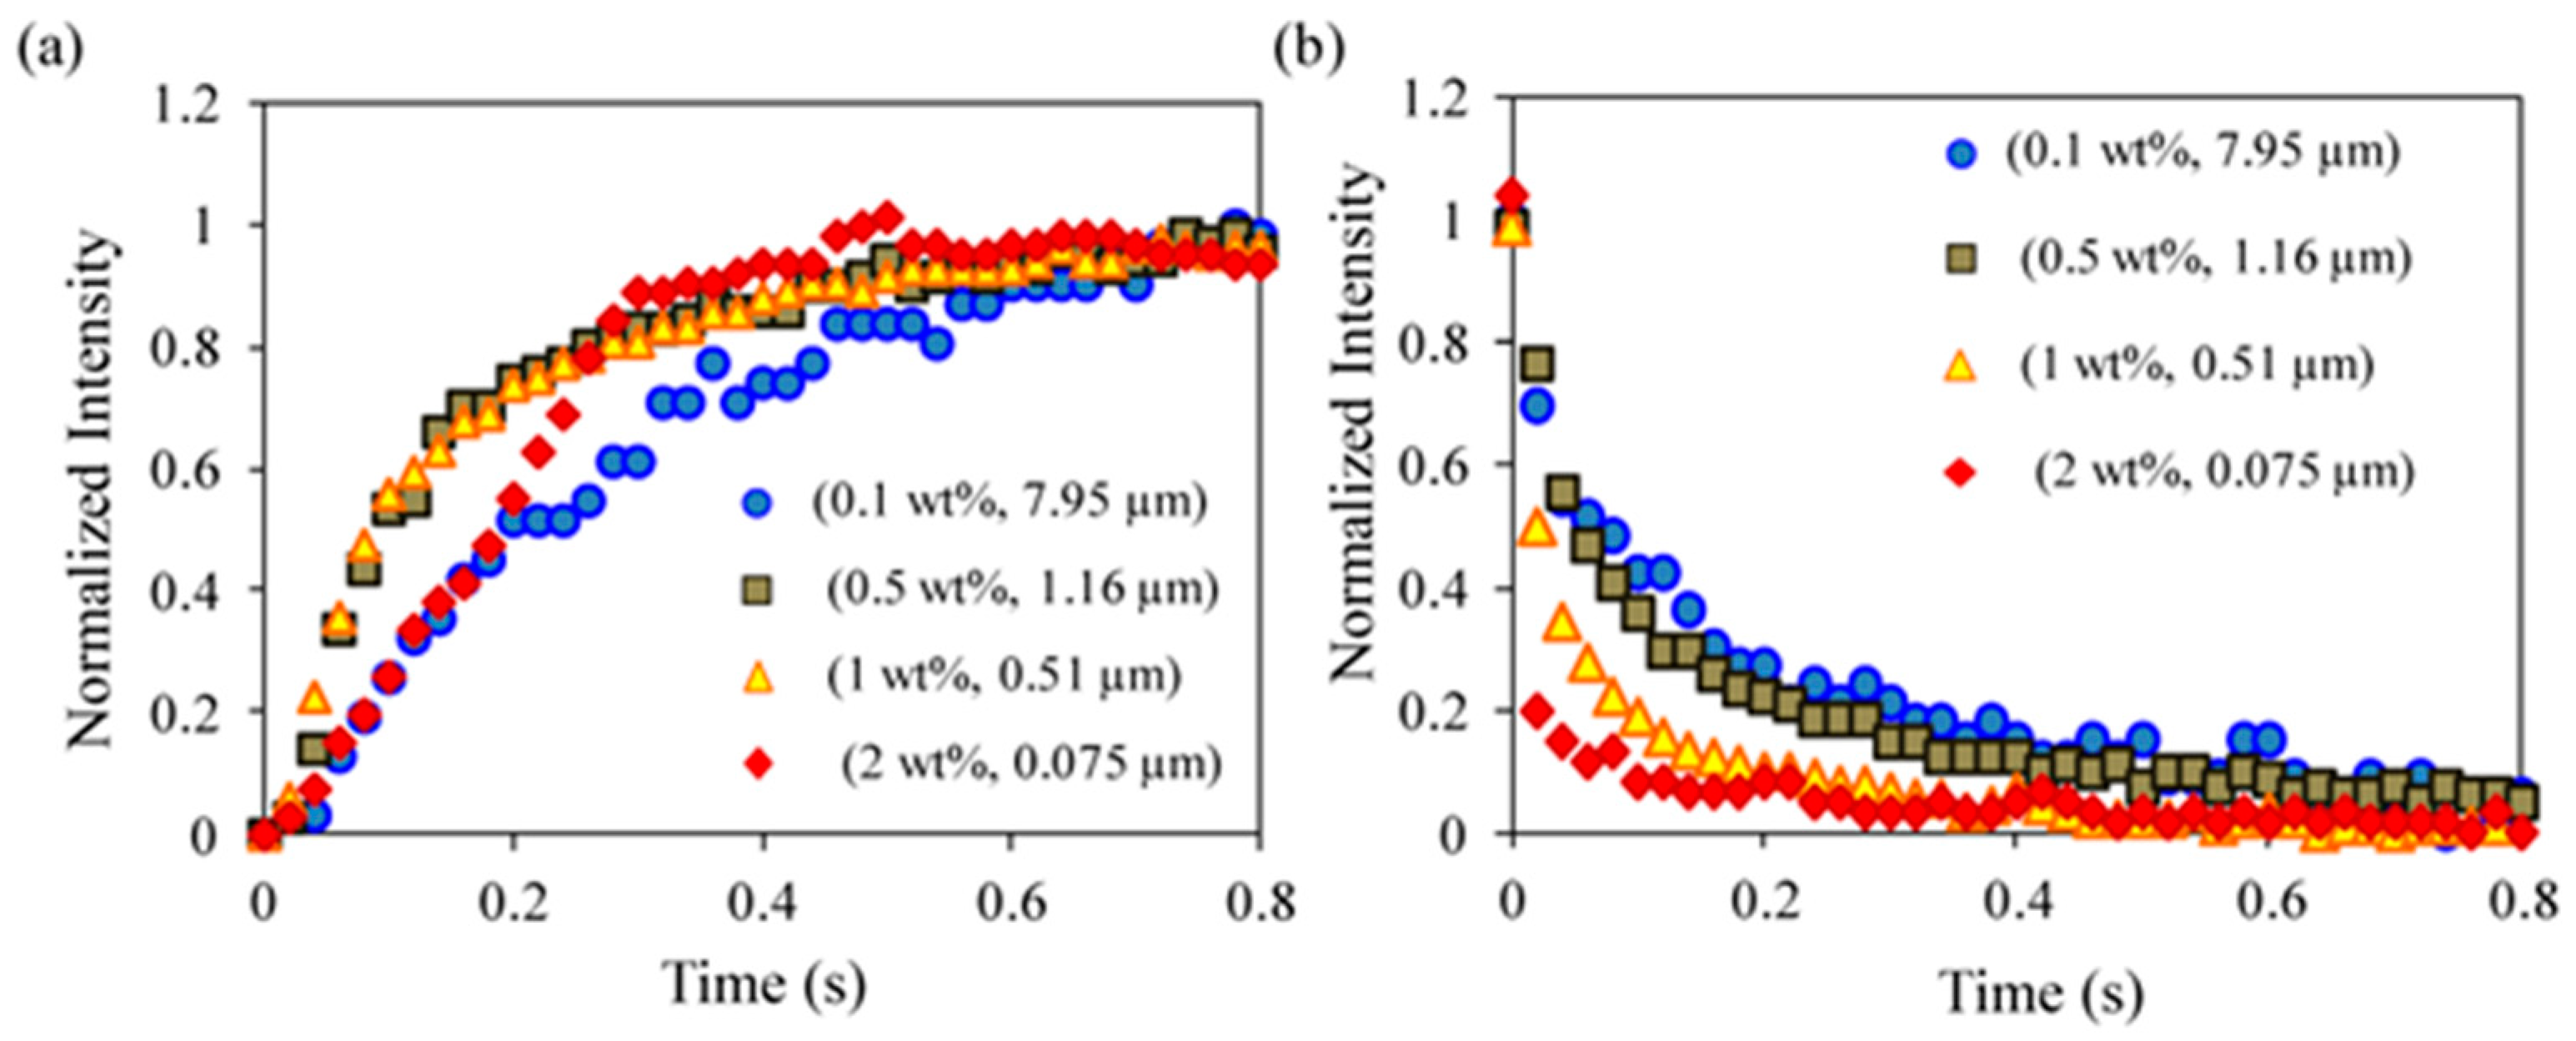
The time taken for the graphene oxide dispersions to become fully aligned to the electric field is known as the response time. The relaxation time is defined as the time taken for the system to relax once the electric field is removed. Both the response and relaxation times for graphene oxide dispersions have been found to be just under half a second, depending on the flake size distribution and concentration (Figure 14) [39,63]. This has been shown to be affected by flake size and in particular the flake size distribution [39,63]. The higher the fraction of large flakes (>1 µm) in a mixture which otherwise contains mainly small flakes (<1 µm) the slower the response to electric fields and the slower the relaxation time when the field is removed. This has been attributed to increased inter-particle friction when larger flakes are present [63].
Graphene oxide in aqueous dispersions ages with time. This is due to C–C bond cleavage and the formation of vinylogous carboxylic acids [65]. This reaction also releases protons and decreases the pH of the dispersion. Consequently, the electro-optic performance has been shown to decrease with time [66]. Over the course of one week of storage at room temperature, Shen et al. [66] found that the field-induced birefringence fell by approximately 25% as compared to fresh GO. However, they did find that re-cleaning the material with fresh water in a centrifuge restores the performance completely [66].
8. Effect of Magnetic Fields
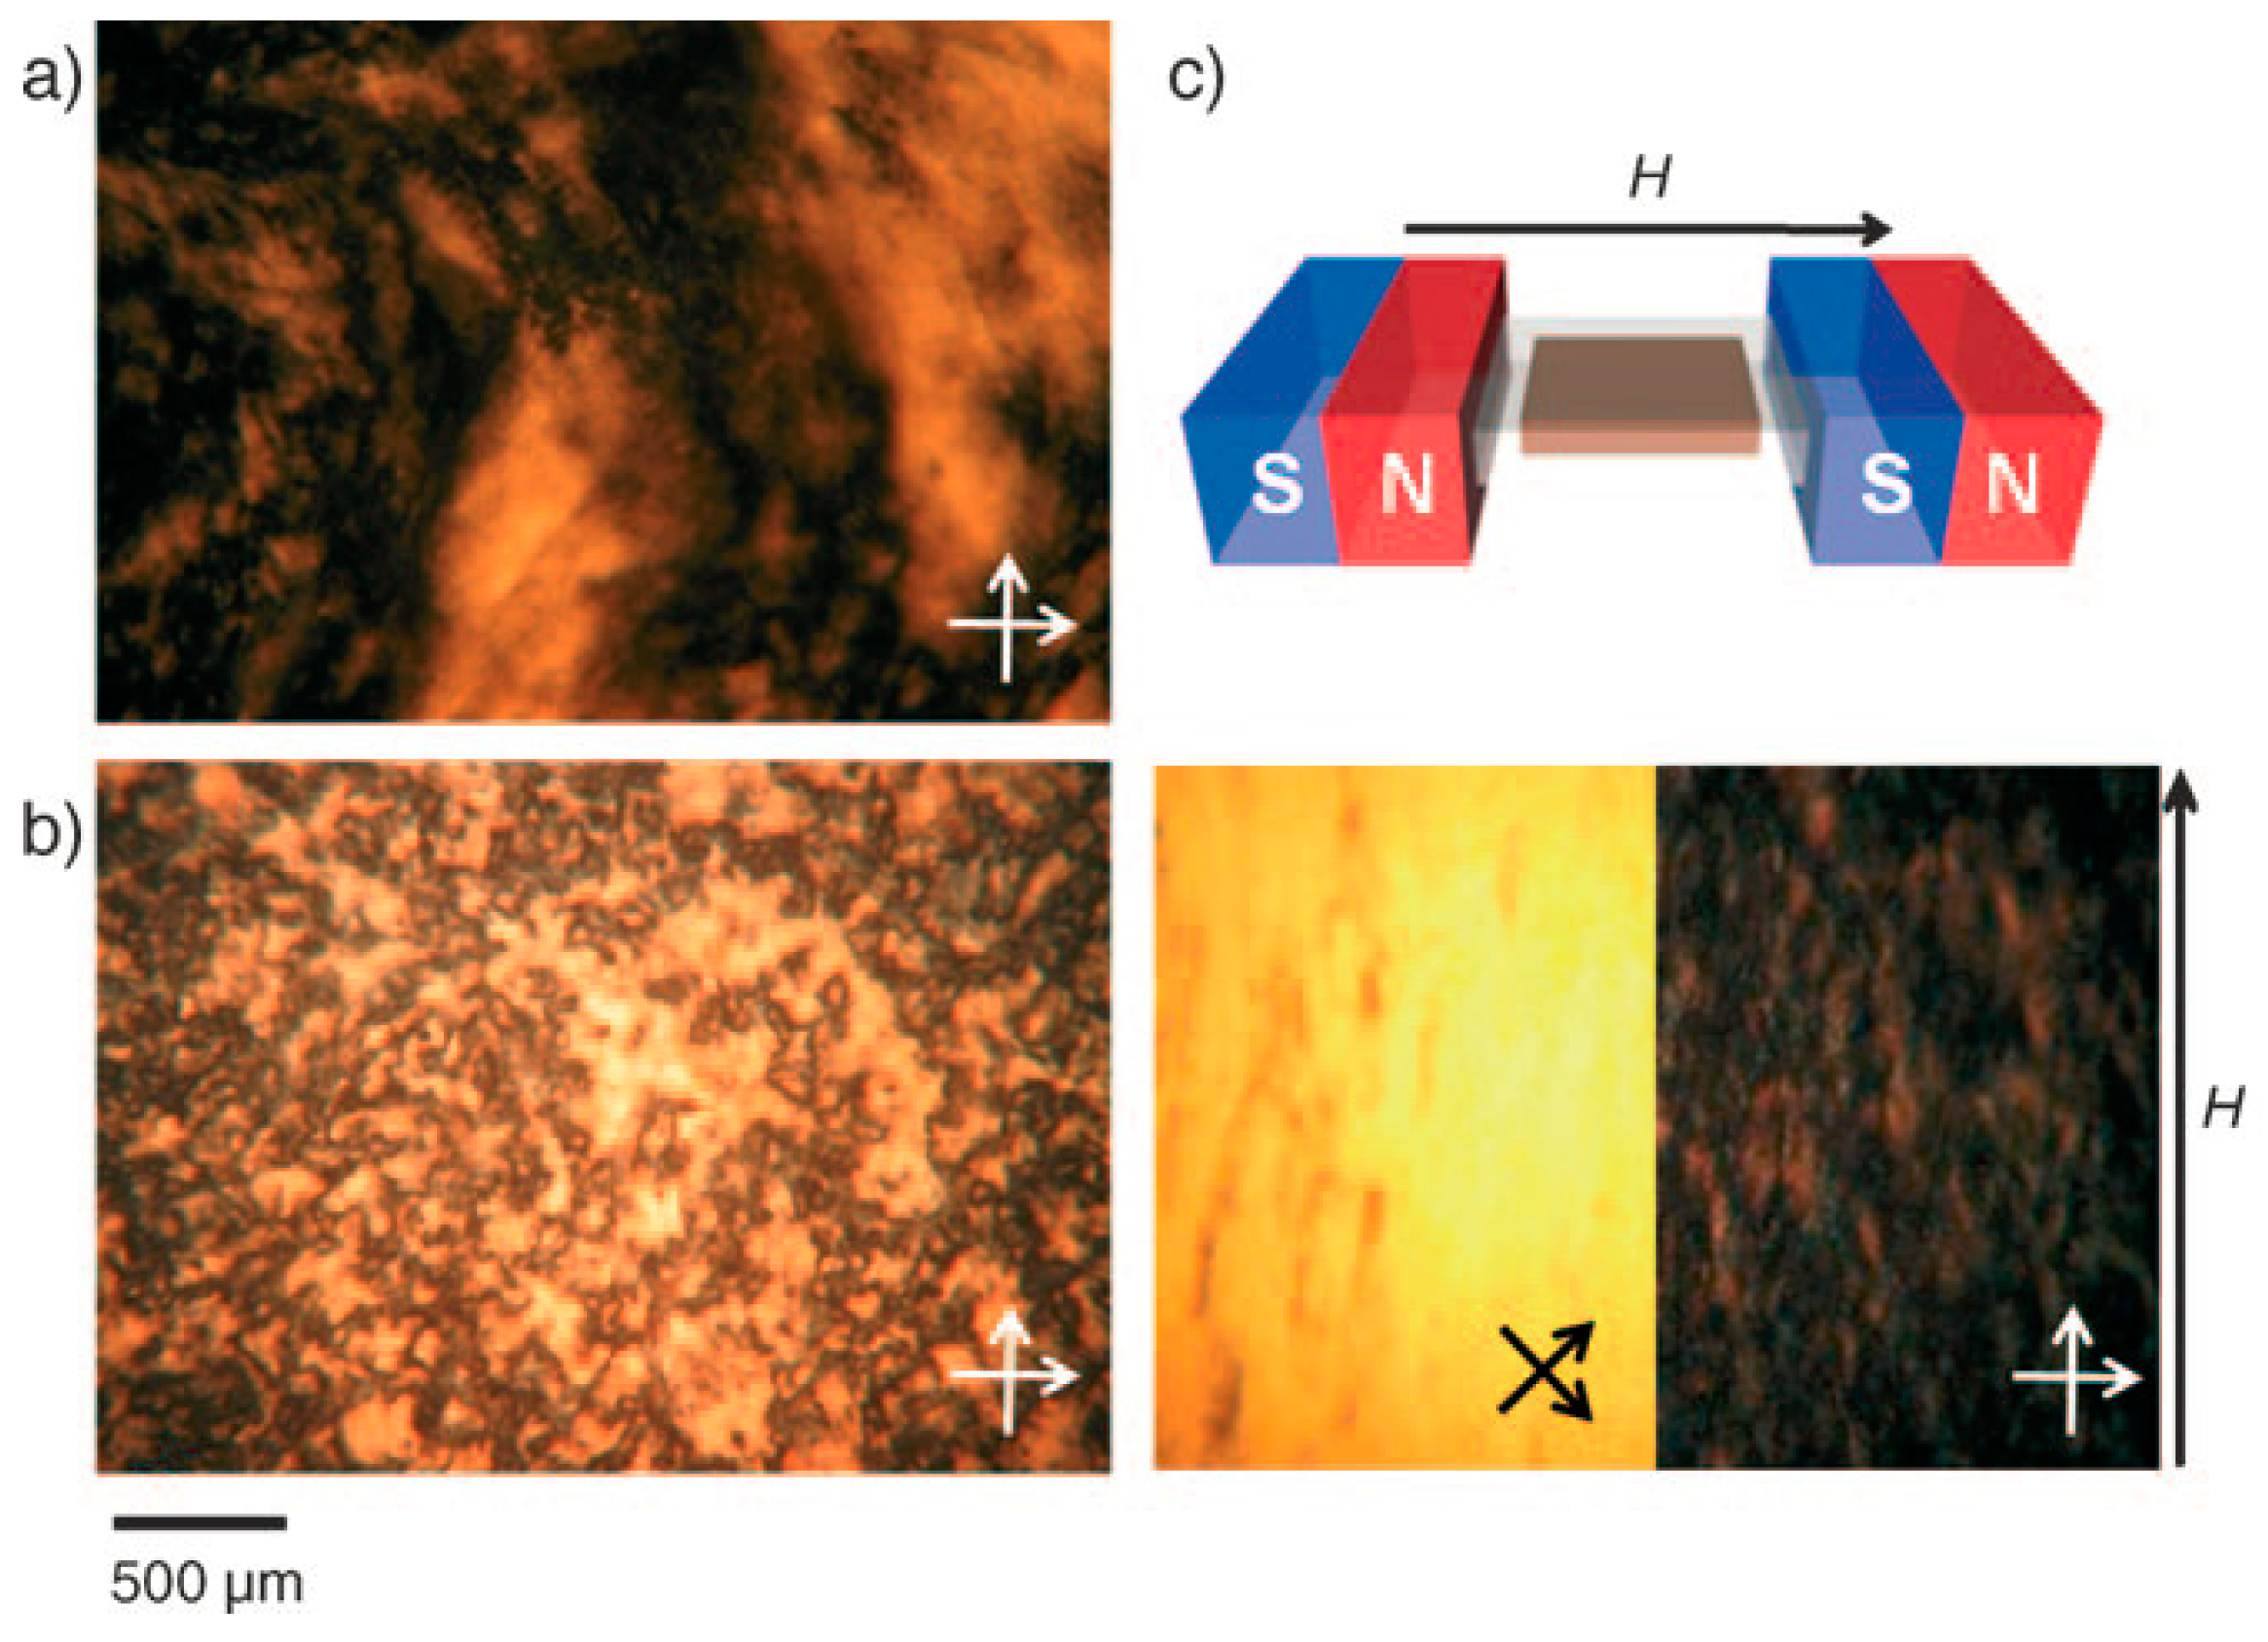
Early in the story of graphene oxide lyotropic liquid crystals, Kim et al. [11] reported that over a long time (5 h) a magnetic field (0.25T) could cause a nematic graphene oxide dispersion to align (Figure 15).
Since that time, it appears that this effect has not been independently demonstrated. Recently, we have performed small angle X-ray scattering measurements of the nematic phase of graphene oxide with an in situ magnetic field of approximately 0.9 T, applied perpendicularly to the X-ray beam. The experiments used a SAXSLAB Ganesha 300XL machine. This uses a copper Kα X-ray source and a 2D Pilatus 300K detector which is movable along the beam axis so the sample-detector distance can be adjusted. The experimental set-up is well described by Figure 1 in Sims et al. [67]. The diffraction pattern was initially anisotropic, presumably due to an average preferred orientation in the diffraction capillary used to contain the dispersion, or from shear alignment as it entered. After approximately 19 hours in the magnetic field, there was no change in the alignment of the GO sheets and they remained out of alignment with the direction of the field (Figure 16c). The graphene oxide used had the XPS spectrum shown in Figure 16a and the size distribution shown in Figure 16b. The stark difference in behaviour we observe compared to that of Kim et al. [11] could be due to the degree of oxidation of the GO. Recently Diamantopoulou et al. [68] have demonstrated that the magnetic response of GO and rGO is very different. This suggests that the precise conditions during the fabrication and storage of the graphene oxide, which affect the degree of reduction, could have an effect on its magneto-optic response.
9. Applications of Graphene Oxide Colloids Lyotropic Behaviour
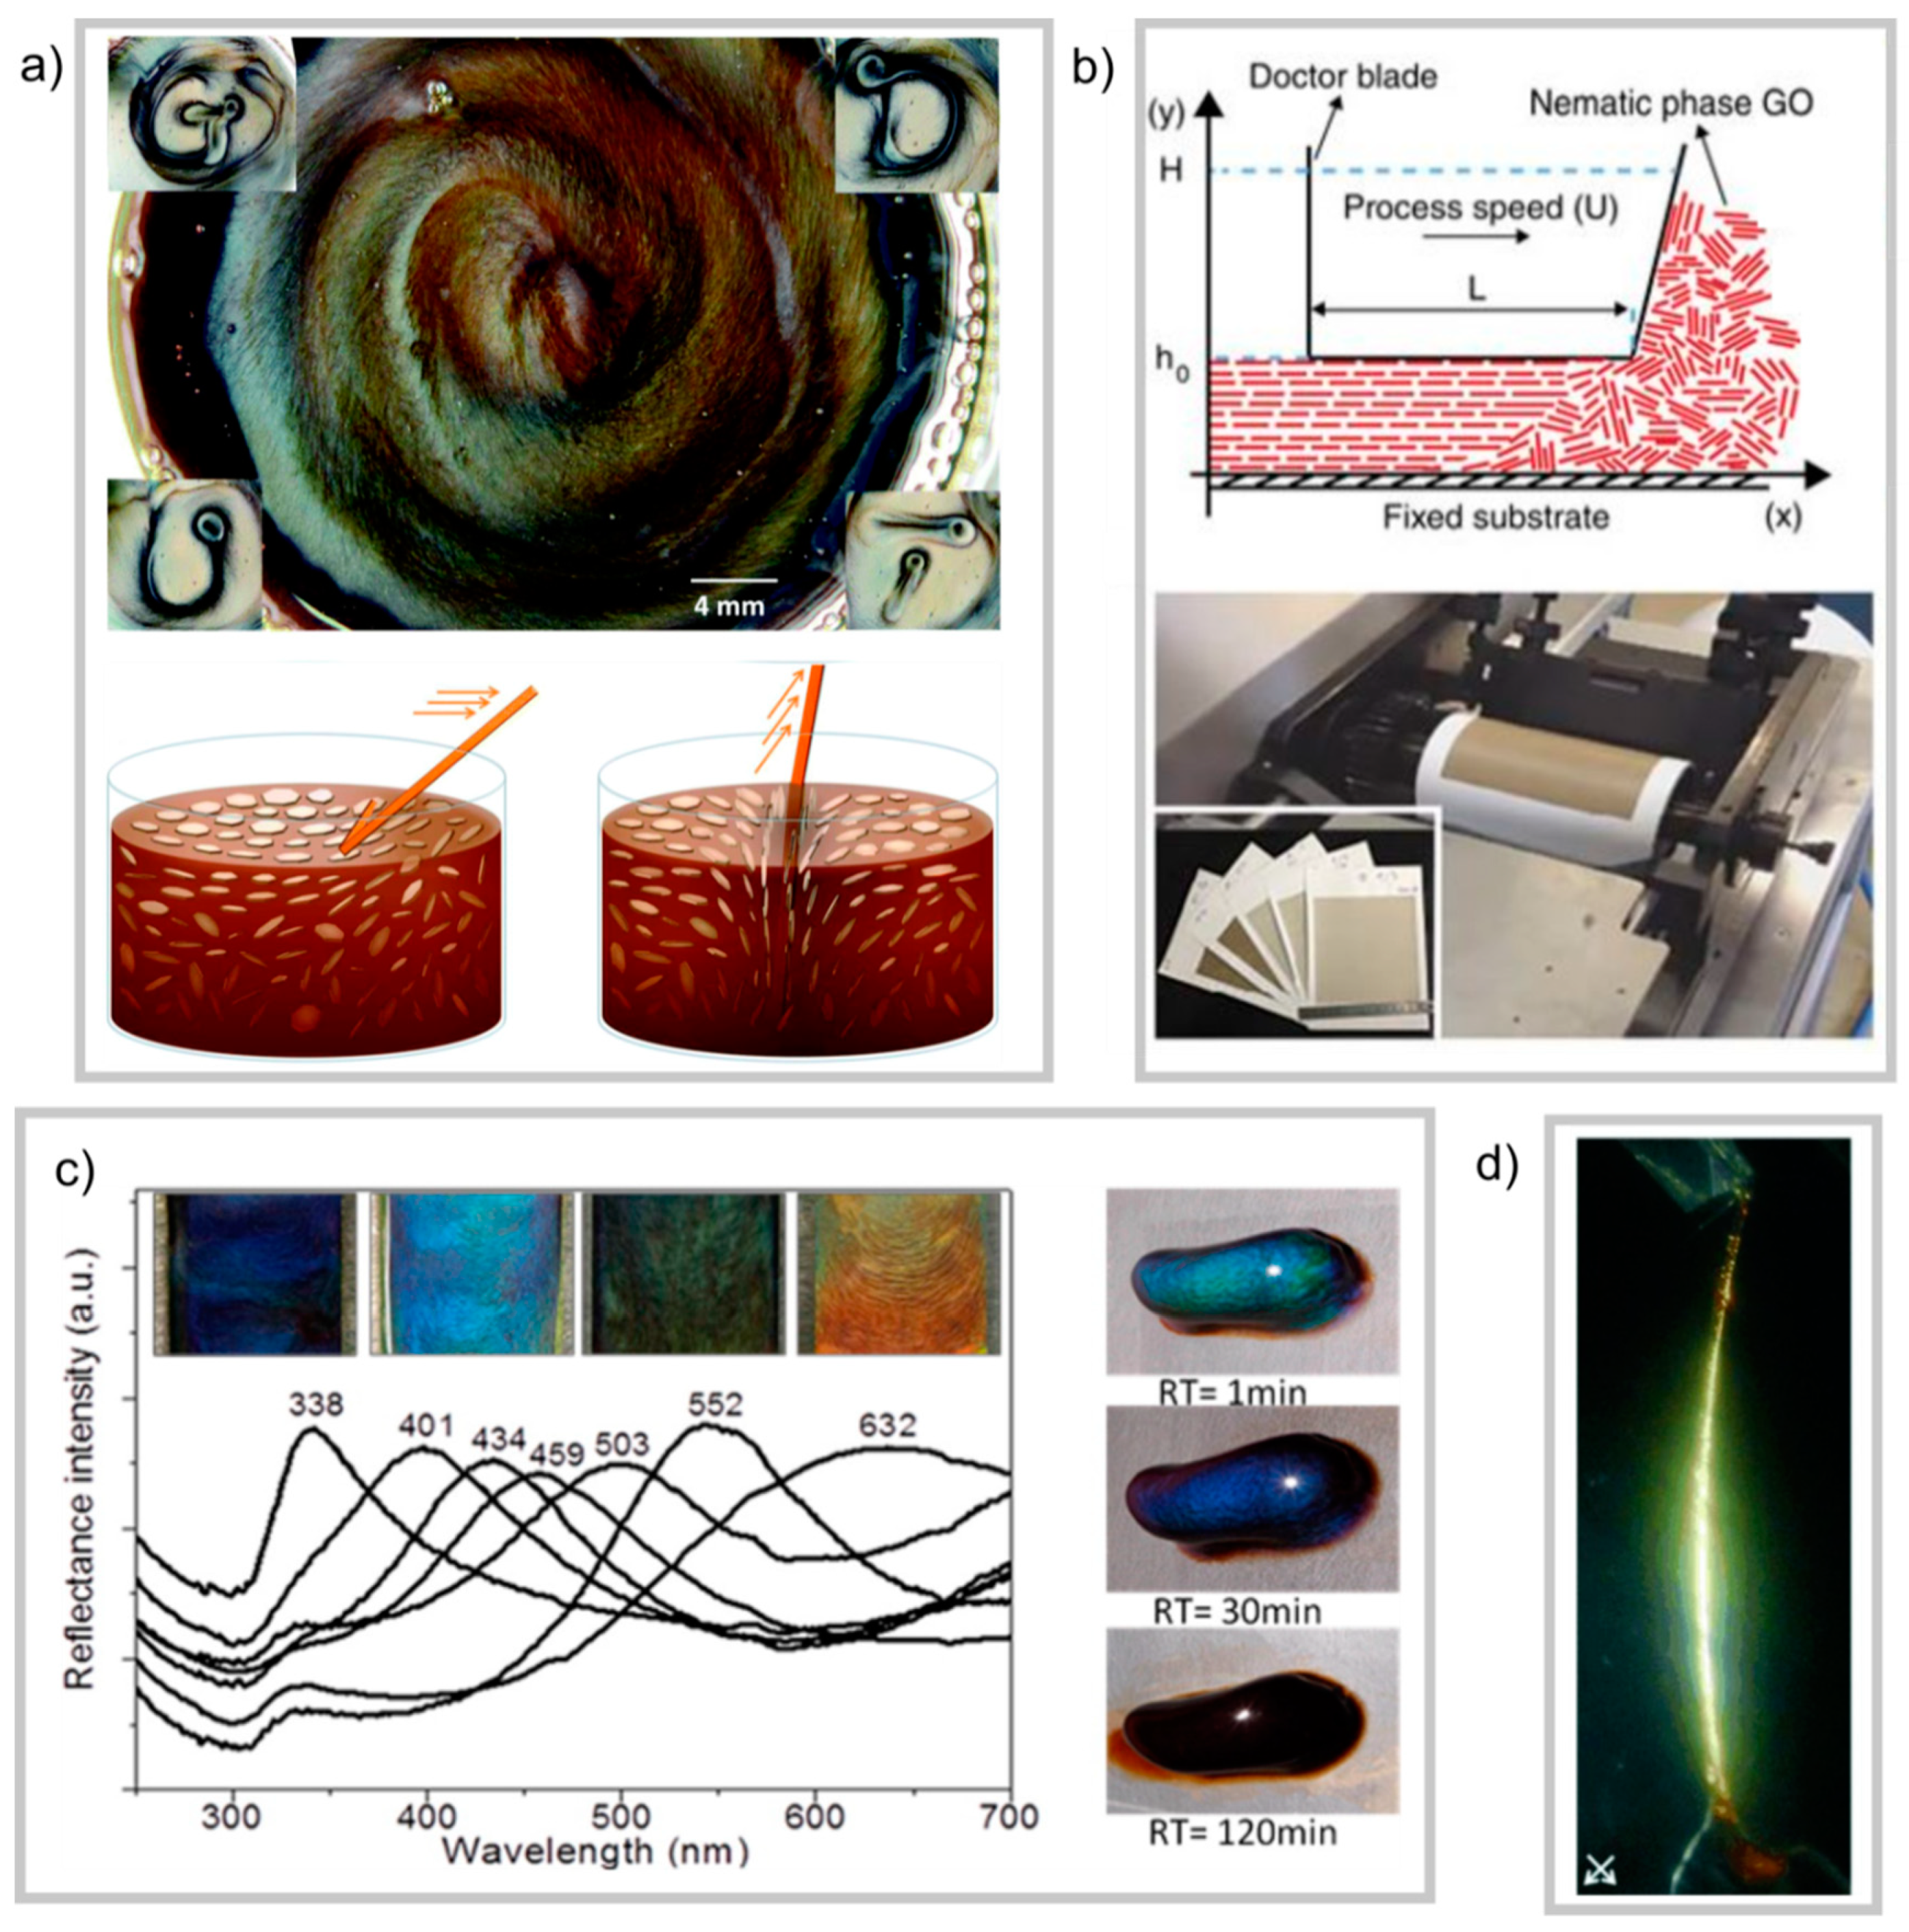
Graphene oxide dispersions are an ideal example of stable dispersions of high aspect ratio plate-like particles. The stability of such dispersions opens up a variety of solution-based processing routes. The spontaneous self-assembly into nematic and lamellar phases with increasing concentration has been shown to assist in the manufacture of novel three-dimensional architectures. An example of this is in the production of graphene oxide membranes [69]. Such membranes have received increased interest over recent years due to their potential use in the desalination of water [69,70]. The technology has arisen from the observation that water permeates the membranes rapidly, faster even than helium [71]. Membranes have been fabricated by vacuum filtration of a GO dispersion [71] or by evaporation of the solvent [72]. However, in 2016, Akbari et al. [69] showed that the shear alignment of a concentrated dispersion in the nematic state on a substrate can produce membranes with very even topography over a large area (Figure 17b). A further example of nematic behavior leading to ordered three-dimensional architectures is the observation of photonic behavior in GO dispersions. Li et al. [73] found that for a dispersion of high aspect-ratio sheets with low polydispersity, Bragg reflections could be observed in natural light at nematic concentrations (Figure 17c). The exact mechanism for this is not fully understood, but the authors noted that a sensitive balance of forces and flake sizes was key to the appearance of reflections, since the addition of NaCl or sonication (to reduce the flake size) both removed Bragg reflections [73]. Nevertheless, appropriately designed, such photonic crystals could be used in novel inks, or since their colour is based on concentration, humidity sensors. Li et al. also propose that if such structures could be controlled by external fields, GO-based photonic crystals could also be used for energy-efficient colour display applications [73].
Since the liquid crystallinity of graphene oxide dispersions was first discovered [11], the anisotropic ordering and self-assembly properties have been exploited in the production of fibrous materials. Kim et al. have shown that fibres drawn from concentrated GO dispersions with added poly(acrylic acid) have highly ordered microstructures and display birefringence (Figure 17d) [11]. The rheological properties of nematic graphene oxide dispersions make them favourable for wet-spinning of fibres [14] which was first demonstrated by Xu and Gao in 2011 [32]. A topic at the forefront of graphene applications is that of smart clothing and wearable electronics. GO can be reduced to restore some of graphene’s conductivity, and conductive fibres using liquid crystal-assisted assembly, followed by reduction, are already at a mature stage of research [14,16,74].
As well as the potential for display technology based on the Kerr effect of GO dispersions in the isotropic phase (as discussed earlier in this review) He et al. have reported on a re-writable reflective display using nematic-phase GO dispersions [75]. When the concentrated dispersion is sheared in the plane of the surface, the surface becomes more reflective due to the larger amount of GO-surface area interacting with the light. Then, using a stick-like implement, the GO director field can be disturbed, and one is able to create writing on the surface (Figure 17a).
10. Conclusions
In the present paper we have reviewed the general properties of lyotropic graphene oxide liquid crystals. We especially discussed some characterization methods of the employed graphene oxide sheets or flakes, the occurrence of liquid crystallinity with respect to flake size and solvent, including a comparison to a simple theoretical description, which was found to only poorly describe the experimental observations. Alignment properties of GO liquid crystals were discussed, as were the effects of added salt and polymers. Only few investigations have been carried out so far concerning the effect of applied electric and magnetic fields. Some of the reported results indicate a controversial and even opposing behaviour, whose underlying possible reasons were considered. Graphene oxide liquid crystals are certainly a very interesting, timely and worthwhile field of investigation, with a potential for the development of fundamental liquid crystal and soft matter understanding, as well as for future applications in the areas of nanotechnology, templating, electro-optic devices, all the way to possibilities in fibre composites or the desalination of sea water.
Author Contributions
A.P.D. and I.D. together conceived of the subject matter and structure for this review. A.P.D. wrote the main text created the figures and sought copyright permissions where reproductions were necessary. I.D. supervised the project and contributed to the writing of the manuscript. A.P.D. prepared and characterized the graphene oxide samples and analysed the data from the experiments.
Funding
This research was funded by The Engineering and Physical Sciences Research Council (EPSRC) of the United Kingdom, grant number EP/L01548X/1.
Acknowledgments
The authors would like to acknowledge Maria Iliut and Aravind Vijayaraghavan for kind provision of the GO used in the original experiments described in Section 7. Furthermore we would like to thank Robert M. Richardson and Andrew Thomas for assistance with the SAXS and XPS experiments, respectively.
Conflicts of Interest
The authors declare no conflict of interest.
References
- Chandrasekhar, S.; Sadashiva, B.K.; Suresh, K.A. Liquid crystals of disc-like molecules. Pramana J. Phys. 1977, 9, 471–480. [Google Scholar] [CrossRef]
- Lydon, J. Chromonic liquid crystalline phases. Liq. Cryst. 2011, 38, 1663–1681. [Google Scholar] [CrossRef]
- Park, H.S.; Lavrentovich, O.D. Lyotropic Chromonic Liquid Crystals. In Emerging Applications. In Liquid Crystals Beyond Displays, Li, Q., Ends.; Wiley: Hoboken, NJ, USA, 2012. [Google Scholar]
- Sonin, A.S. Inorganic lyotropic liquid crystals. J. Mater. Chem. 1998, 8, 2557–2574. [Google Scholar] [CrossRef]
- Gabriel, J.C.P.; Sanchez, C.; Davidson, P. Observation of nematic liquid-crystal textures in aqueous gels of smectite clays. J. Phys. Chem. 1996, 100, 11139–11143. [Google Scholar] [CrossRef]
- Davidson, P.; Penisson, C.; Constantin, D.; Gabriel, J.C.P. Isotropic, nematic, and lamellar phases in colloidal suspensions of nanosheets. Proc. Natl. Acad. Sci. USA 2018, 115, 6662–6667. [Google Scholar] [CrossRef] [PubMed] [Green Version]
- Connolly, J.; Van Duijneveldt, J.S.; Klein, S.; Pizzey, C.; Richardson, R.M. Manipulation of modified clay particles in a nematic solvent by a magnetic field. J. Phys. Condens. Matter 2007, 19, 156103. [Google Scholar] [CrossRef]
- Langmuir, I. The Role of Attractive and Repulsive Forces in the Formation of Tactoids, Thixotropic Gels, Protein Crystals and Coacervates. J. Chem. Phys. 1938, 6, 873–896. [Google Scholar] [CrossRef]
- Novoselov, K.S.; Geim, A.K.; Morozov, S.V.; Jiang, D.; Zhang, Y.; Dubonos, S.V.; Grigorieva, I.V.; Firsov, A.A. Electric Field Effect in Atomically Thin Carbon Films. Science 2004, 306, 666–669. [Google Scholar] [CrossRef] [PubMed] [Green Version]
- Proctor, J.E.; Armada, D.M.; Vijayaraghavan, A. An Introduction to Graphene and Carbon Nanotubes; CRC Press: Boca Raton, FL, USA, 2017. [Google Scholar]
- Kim, J.E.; Han, T.H.; Lee, S.H.; Kim, J.Y.; Ahn, C.W.; Yun, J.M.; Kim, S.O. Graphene oxide liquid crystals. Angew. Chem. Int. Ed. 2011, 50, 3043–3047. [Google Scholar] [CrossRef]
- Xu, Z.; Gao, C. Aqueous liquid crystals of graphene oxide. ACS Nano 2011, 5, 2908–2915. [Google Scholar] [CrossRef]
- Dan, B.; Behabtu, N.; Martinez, A.; Evans, J.S.; Kosynkin, D.V.; Tour, J.M.; Pasquali, M.; Smalyukh, I.I. Liquid crystals of aqueous, giant graphene oxide flakes. Soft Matter 2011, 7, 11154–11159. [Google Scholar] [CrossRef]
- Padmajan Sasikala, S.; Lim, J.; Kim, I.H.; Jung, H.J.; Yun, T.; Han, T.H.; Kim, S.O. Graphene oxide liquid crystals: A frontier 2D soft material for graphene-based functional materials. Chem. Soc. Rev. 2018, 47, 6013–6045. [Google Scholar] [CrossRef] [PubMed]
- Lin, F.; Tong, X.; Wang, Y.; Bao, J.; Wang, Z.M. Graphene oxide liquid crystals: synthesis, phase transition, rheological property, and applications in optoelectronics and display. Nanoscale Res. Lett. 2015, 10, 1–16. [Google Scholar] [CrossRef] [PubMed]
- Liu, Y.; Xu, Z.; Gao, W.; Cheng, Z.; Gao, C. Graphene and Other 2D Colloids: Liquid Crystals and Macroscopic Fibers. Adv. Mater. 2017, 29, 1606794. [Google Scholar] [CrossRef] [PubMed]
- Li, D.; Müller, M.B.; Gilje, S.; Kaner, R.B.; Wallace, G.G. Processable aqueous dispersions of graphene nanosheets. Nat. Nanotechnol. 2008, 3, 101–105. [Google Scholar] [CrossRef]
- Novoselov, K.S.; Fal’Ko, V.I.; Colombo, L.; Gellert, P.R.; Schwab, M.G.; Kim, K. A roadmap for graphene. Nature 2012, 490, 192–200. [Google Scholar] [CrossRef] [PubMed]
- Hummers, W.S.; Offeman, R.E. Preparation of Graphitic Oxide. J. Am. Chem. Soc. 1958, 80, 1339. [Google Scholar] [CrossRef]
- Brodie, B.C., XIII. On the atomic weight of graphite. Philos. Trans. R. Soc. Lond. 1859, 149, 249–259. [Google Scholar]
- Dreyer, D.R.; Park, S.; Bielawski, C.W.; Ruoff, R.S. The chemistry of graphene oxide. Chem. Soc. Rev. 2010, 39, 228–240. [Google Scholar] [CrossRef]
- Marcano, D.C.D.; Kosynkin, D.D.V.; Berlin, J.M.J.; Sinitskii, A.; Sun, Z.; Slesarev, A.; Alemany, L.B.; Lu, W.; Tour, J.M. Improved synthesis of graphene oxide. ACS Nano 2010, 4, 4806–4814. [Google Scholar] [CrossRef]
- Chen, C.; Long, M.; Xia, M.; Zhang, C.; Cai, W. Reduction of graphene oxide by an in-situ photoelectrochemical method in a dye-sensitized solar cell assembly. Nanoscale Res. Lett. 2012, 7, 1–5. [Google Scholar] [CrossRef] [PubMed]
- Rodrigues, A.F.; Newman, L.; Lozano, N.; Mukherjee, S.P.; Fadeel, B.; Bussy, C.; Kostarelos, K. A blueprint for the synthesis and characterisation of thin graphene oxide with controlled lateral dimensions for biomedicine. 2D Mater. 2018, 5, 035020. [Google Scholar] [CrossRef] [Green Version]
- Chandrasekhar, S. Liquid Crystals; Cambridge University Press: Cambridge, UK, 1992. [Google Scholar]
- Castellano, J.A. Liquid Gold: The Story of Liquid Crystal Displays and the Creation of an Industry; World Scientific Pub Co Inc.: Singapore, 2005. [Google Scholar]
- Petrov, A.G. The Lyotropic State of Matter: Molecular Physics and Living Matter Physics; CRC Press: Boca Raton, FL, USA, 1999. [Google Scholar]
- Neto, A.M.F.; Salinas, S.R.A.; Press, O.U. The Physics of Lyotropic Liquid Crystals: Phase Transitions and Structural Properties; Oxford University Press: Oxford, UK, 2005. [Google Scholar]
- Garti, N.; Somasundaran, P.; Mezzenga, R. Self-Assembled Supramolecular Architectures: Lyotropic Liquid Crystals; John Wiley & Sons, Inc: Hoboken, NJ, USA, 2012. [Google Scholar]
- Dierking, I.; Al-Zangana, S. Lyotropic Liquid Crystal Phases from Anisotropic Nanomaterials. Nanomaterials 2017, 7, 305. [Google Scholar] [CrossRef] [PubMed]
- Behabtu, N.; Lomeda, J.R.; Green, M.J.; Higginbotham, A.L.; Sinitskii, A.; Kosynkin, D.V.; Tsentalovich, D.; Parra-Vasquez, A.N.G.; Schmidt, J.; Kesselman, E.; et al. Spontaneous high-concentration dispersions and liquid crystals of graphene. Nat. Nanotechnol. 2010, 5, 406–411. [Google Scholar] [CrossRef] [PubMed]
- Xu, Z.; Gao, C. Graphene chiral liquid crystals and macroscopic assembled fibres. Nat. Commun. 2011, 2, 571–579. [Google Scholar] [CrossRef] [PubMed]
- Onsager, L. The Effects of Shape on the Interaction of Colloidal Particles. Ann. N. Y. Acad. Sci. 1949, 51, 627–659. [Google Scholar] [CrossRef]
- Frenkel, D. Entropy-driven phase transitions. Phys. A Stat. Mech. its Appl. 1999, 263, 26–38. [Google Scholar] [CrossRef] [Green Version]
- Forsyth, P.A.; Marčelja, S.; Mitchell, D.J.; Ninham, B.W. Onsager transition in hard plate fluid. J. Chem. Soc. Faraday Trans. 2 Mol. Chem. Phys. 1977, 73, 84–88. [Google Scholar] [CrossRef]
- Bates, M.A.; Frenkel, D. Nematic-isotropic transition in polydisperse systems of infinitely thin hard platelets. J. Chem. Phys. 1999, 110, 6553–6559. [Google Scholar] [CrossRef]
- Shen, T.Z.; Hong, S.H.; Song, J.K. Electro-optical switching of graphene oxide liquid crystals with an extremely large Kerr coefficient. Nat. Mater. 2014, 13, 394–399. [Google Scholar] [CrossRef]
- Liu, Z.; Xu, Z.; Hu, X.; Gao, C. Lyotropic liquid crystal of polyacrylonitrile-grafted graphene oxide and its assembled continuous strong nacre-mimetic fibers. Macromolecules 2013, 46, 6931–6941. [Google Scholar] [CrossRef]
- Ahmad, R.T.M.; Hong, S.H.; Shen, T.Z.; Song, J.K. Optimization of particle size for high birefringence and fast switching time in electro-optical switching of graphene oxide dispersions. Opt. Express 2015, 23, 4435. [Google Scholar] [CrossRef] [PubMed]
- Poulin, P.; Jalili, R.; Neri, W.; Nallet, F.; Divoux, T.; Colin, A.; Aboutalebi, S.H.; Wallace, G.; Zakri, C. Superflexibility of graphene oxide. Proc. Natl. Acad. Sci. USA 2016, 113, 11088–11093. [Google Scholar] [CrossRef] [PubMed] [Green Version]
- Paredes, J.I.; Villar-Rodil, S.; Martínez-Alonso, A.; Tascón, J.M.D. Graphene Oxide Dispersions in Organic Solvents. Langmuir 2008, 24, 10560–10564. [Google Scholar] [CrossRef] [PubMed]
- Ahmad, R.T.M.; Hong, S.H.; Shen, T.Z.; Masud, A.R.; Song, J.K. Effect of solvents on the electro-optical switching of graphene oxide dispersions. Appl. Phys. Lett. 2016, 108, 251903. [Google Scholar] [CrossRef]
- Al-Zangana, S.; Iliut, M.; Turner, M.; Vijayaraghavan, A.; Dierking, I. Confinement effects on lyotropic nematic liquid crystal phases of graphene oxide dispersions. 2D Mater. 2017, 4, 041004. [Google Scholar] [CrossRef] [Green Version]
- Tkacz, R.; Oldenbourg, R.; Fulcher, A.; Miansari, M.; Majumder, M. Capillary-force-assisted self-assembly (CAS) of highly ordered and anisotropic graphene-based thin films. J. Phys. Chem. C 2014, 118, 259–267. [Google Scholar] [CrossRef]
- Zhao, X.; Xu, Z.; Xie, Y.; Zheng, B.; Kou, L.; Gao, C. Polyelectrolyte-stabilized graphene oxide liquid crystals against salt, pH, and serum. Langmuir 2014, 30, 3715–3721. [Google Scholar] [CrossRef]
- Konkena, B.; Vasudevan, S. Glass, gel, and liquid crystals: Arrested states of graphene oxide aqueous dispersions. J. Phys. Chem. C 2014, 118, 21706–21713. [Google Scholar] [CrossRef]
- Wigner, E. On the Interaction of Electrons in Metals. Phys. Rev. 1934, 46, 1002–1011. [Google Scholar] [CrossRef]
- Sciortino, F.; Tartaglia, P. Glassy colloidal systems. Adv. Phys. 2005, 54, 471–524. [Google Scholar] [CrossRef]
- Bonn, D.; Tanaka, H.; Wegdam, G.; Kellay, H.; Meunier, J. Aging of a colloidal “Wigner” glass. Europhys. Lett. 1999, 45, 52–57. [Google Scholar] [CrossRef]
- Leite Rubim, R.; Abrantes Barros, M.; Missègue, T.; Bougis, K.; Navailles, L.; Nallet, F. Highly confined stacks of graphene oxide sheets in water. Eur. Phys. J. E 2018, 41, 30. [Google Scholar] [CrossRef] [PubMed] [Green Version]
- Tkacz, R.; Oldenbourg, R.; Mehta, S.B.; Miansari, M.; Verma, A.; Majumder, M. PH dependent isotropic to nematic phase transitions in graphene oxide dispersions reveal droplet liquid crystalline phases. Chem. Commun. 2014, 50, 6668–6671. [Google Scholar] [CrossRef] [PubMed]
- Konkena, B.; Vasudevan, S. Understanding aqueous dispersibility of graphene oxide and reduced graphene oxide through p K a measurements. J. Phys. Chem. Lett. 2012, 3, 867–872. [Google Scholar] [CrossRef] [PubMed]
- Shim, Y.H.; Lee, K.E.; Shin, T.J.; Kim, S.O.; Kim, S.Y. Wide concentration liquid crystallinity of graphene oxide aqueous suspensions with interacting polymers. Mater. Horiz. 2017, 4, 1157–1164. [Google Scholar] [CrossRef]
- Shim, Y.H.; Lee, K.E.; Shin, T.J.; Kim, S.O.; Kim, S.Y. Tailored Colloidal Stability and Rheological Properties of Graphene Oxide Liquid Crystals with Polymer-Induced Depletion Attractions. ACS Nano 2018, 12, 11399–11406. [Google Scholar] [CrossRef]
- Band, Y.B. Light and Matter: Electromagnetism, Optics, Spectroscopy and Lasers; Wiley: Hoboken, NJ, USA, 2006. [Google Scholar]
- Hong, S.H.; Shen, T.Z.; Song, J.K. Electro-optical Characteristics of Aqueous Graphene Oxide Dispersion Depending on Ion Concentration. J. Phys. Chem. C 2014, 118, 26304–26312. [Google Scholar] [CrossRef]
- O’Konski, C.T. Electric properties of macromolecules. v. theory of ionic polarization in polyelectrolytes. J. Phys. Chem. 1960, 64, 605–619. [Google Scholar]
- Dozov, I.; Paineau, E.; Davidson, P.; Antonova, K.; Baravian, C.; Bihannic, I.; Michot, L.J. Electric-Field-Induced Perfect Anti-Nematic Order in Isotropic Aqueous Suspensions of a Natural Beidellite Clay. J. Phys. Chem. B 2011, 115, 7751–7765. [Google Scholar] [CrossRef]
- Chen, Y.; Xu, D.; Wu, S.T.; Yamamoto, S.I.; Haseba, Y. A low voltage and submillisecond-response polymer-stabilized blue phase liquid crystal. Appl. Phys. Lett. 2013, 102, 141116. [Google Scholar] [CrossRef] [Green Version]
- Hisakado, Y.; Kikuchi, H.; Nagamura, T.; Kajiyama, T. Large electro-optic Kerr effect in polymer-stabilized liquid-crystalline blue phases. Adv. Mater. 2005, 17, 96–98. [Google Scholar] [CrossRef]
- Haseba, Y.; Kikuchi, H.; Nagamura, T.; Kajiyama, T. Large electro-optic kerr effect in nanostructured chiral liquid-crystal composites over a wide temperature range. Adv. Mater. 2005, 17, 2311–2315. [Google Scholar] [CrossRef]
- Jiménez, M.L.; Fornasari, L.; Mantegazza, F.; Mourad, M.C.D.; Bellini, T. Electric Birefringence of Dispersions of Platelets. Langmuir 2012, 28, 251–258. [Google Scholar] [CrossRef] [PubMed]
- Ahmad, R.T.M.; Shen, T.Z.; Masud, A.R.; Ekanayaka, T.K.; Lee, B.; Song, J.K. Guided Electro-Optical Switching of Small Graphene Oxide Particles by Larger Ones in Aqueous Dispersion. Langmuir 2016, 32, 13458–13463. [Google Scholar] [CrossRef] [PubMed]
- Shen, T.Z.; Hong, S.H.; Song, J.K. Effect of centrifugal cleaning on the electro-optic response in the preparation of aqueous graphene-oxide dispersions. Carbon N. Y. 2014, 80, 560–564. [Google Scholar] [CrossRef]
- Dimiev, A.M.; Alemany, L.B.; Tour, J.M. Graphene Oxide. Origin of Acidity, Its Instability in Water, and a New Dynamic Structural Model. ACS Nano 2013, 7, 576–588. [Google Scholar] [CrossRef] [PubMed]
- Shen, T.Z.; Hong, S.H.; Guo, J.K.; Song, J.K. Deterioration and recovery of electro-optical performance of aqueous graphene-oxide liquid-crystal cells after prolonged storage. Carbon N. Y. 2016, 105, 8–13. [Google Scholar] [CrossRef]
- Sims, M.T.; Abbott, L.C.; Richardson, R.M.; Goodby, J.W.; Moore, J.N. Considerations in the determination of orientational order parameters from X-ray scattering experiments. Liq. Cryst. 2018, 00, 1–14. [Google Scholar] [CrossRef]
- Diamantopoulou, A.; Glenis, S.; Zolnierkiwicz, G.; Guskos, N.; Likodimos, V. Magnetism in pristine and chemically reduced graphene oxide. J. Appl. Phys. 2017, 121, 043906. [Google Scholar] [CrossRef]
- Akbari, A.; Sheath, P.; Martin, S.T.; Shinde, D.B.; Shaibani, M.; Banerjee, P.C.; Tkacz, R.; Bhattacharyya, D.; Majumder, M. Large-area graphene-based nanofiltration membranes by shear alignment of discotic nematic liquid crystals of graphene oxide. Nat. Commun. 2016, 7, 1–12. [Google Scholar] [CrossRef] [PubMed]
- Mohan, V.B.; tak Lau, K.; Hui, D.; Bhattacharyya, D. Graphene-based materials and their composites: A review on production, applications and product limitations. Compos. Part B Eng. 2018, 142, 200–220. [Google Scholar] [CrossRef]
- Nair, R.R.; Wu, H.A.; Jayaram, P.N.; Grigorieva, I.V.; Geim, A.K. Unimpeded Permeation of Water Through Helium-Leak–Tight Graphene-Based Membranes. Science 2012, 335, 442–444. [Google Scholar] [CrossRef] [PubMed]
- Chen, C.; Yang, Q.H.; Yang, Y.; Lv, W.; Wen, Y.; Hou, P.X.; Wang, M.; Cheng, H.M. Self-assembled free-standing graphite oxide membrane. Adv. Mater. 2009, 21, 3007–3011. [Google Scholar] [CrossRef]
- Li, P.; Wong, M.; Zhang, X.; Yao, H.; Ishige, R.; Takahara, A.; Miyamoto, M.; Nishimura, R.; Sue, H.J. Tunable Lyotropic Photonic Liquid Crystal Based on Graphene Oxide. ACS Photonics 2014, 1, 79–86. [Google Scholar] [CrossRef]
- Xin, G.; Yao, T.; Sun, H.; Scott, S.M.; Shao, D.; Wang, G.; Lian, J. Highly thermally conductive and mechanically strong graphene fibers. Science 2015, 349, 1083–1087. [Google Scholar] [CrossRef] [PubMed] [Green Version]
- He, L.; Ye, J.; Shuai, M.; Zhu, Z.; Zhou, X.; Wang, Y.; Li, Y.; Su, Z.; Zhang, H.; Chen, Y.; et al. Graphene oxide liquid crystals for reflective displays without polarizing optics. Nanoscale 2015, 7, 1616–1622. [Google Scholar] [CrossRef]
Figure 1.
The structures of pristine graphene (a) and a model of graphene oxide (b). The functional groups of graphene oxide can vary depending on its method of production and its thermal and/or storage history.
Figure 1.
The structures of pristine graphene (a) and a model of graphene oxide (b). The functional groups of graphene oxide can vary depending on its method of production and its thermal and/or storage history.

Figure 2.
De-convolved X-ray photoelectron spectroscopy (XPS) spectra in the region of the C1s core electron binding energy. In graphene–oxide (GO) (a), three peaks associated with the bonding of oxygen to carbon are identified. In rGO (b), the overall intensity of these peaks is reduced relative to that originating from C-C bonds. Figure adapted from Chen et al. [23] with permission of Springer Nature.

Figure 3.
Flow diagram showing the nomenclature used in the field of liquid crystals. Examples are given of each type of liquid crystal (LC).
Figure 3.
Flow diagram showing the nomenclature used in the field of liquid crystals. Examples are given of each type of liquid crystal (LC).

Figure 4.
Polarized optical microscopy (POM) images of graphene oxide dispersions increasing in concentration from the isotropic phase (1−5 × 10⁻⁴ fm, where fm is the mass fraction of GO in the dispersion) through the biphasic region in which small clusters of birefringent domains can be seen (2–1 × 10⁻³ fm) and then to the nematic phase (3–3 × 10⁻³ fm). The scale bar represents 200 µm. The arrow in the third image indicates the boundary between two nematic domains. This appears as a dark brush in polarized microscopy, analogous to the Schlieren textures of thermotropic nematic liquid crystals. Reprinted with permission from Xu and Gao [12]. Copyright (2011) American Chemical Society.

Figure 5.
The phase diagram for a hard-disk fluid with 25% polydispersity from simulations by Bates and Frenkel. The isotropic (Iso) and nematic (N) phases are labelled and the shaded part corresponds to the biphasic region. Inset: the effect of polydispersity on the width of the biphase.
Figure 5.
The phase diagram for a hard-disk fluid with 25% polydispersity from simulations by Bates and Frenkel. The isotropic (Iso) and nematic (N) phases are labelled and the shaded part corresponds to the biphasic region. Inset: the effect of polydispersity on the width of the biphase.

Figure 6.
Experimentally determined lyotropic phase diagram for graphene oxide dispersed in water. The inset figures show photographs of sample held in a Pasteur pipette between crossed polarizers. It is by such photographs the authors interpreted the location of the phase boundaries. Adapted with permission from ref [39], The Optical Society.

Figure 7.
Polarizing optical photographs of dispersions of graphene oxide in different solvents and at different concentrations are shown (b). In tetrahydrofuran (THF), GO tends to flocculate, meaning spontaneous orientational order does not occur. The apparatus used to contain the dispersions for observation is shown in part (a). Reprinted from Ahmad et al. [42], with the permission of AIP Publishing.

Figure 8.
(a) Schematic diagram showing the orientation of GO flakes with respect to the director, n. (b) The confining geometry used to photograph GO dispersions (POM) in parts (c,d). In (c) the top glass plate is present and the LC becomes homeotropic in the centre of the channel. In part (d) the top plate is removed and the boundary conditions are set by the vertical walls. The director configurations in each case are also shown below the POM pictures. (b–d) reproduced and adapted from Al-Zangana et al. [43] under the terms of the Creative Commons Attribution 3.0 licence.

Figure 9.
Time series of polarized photographs showing the temporary flow-induced alignment of graphene oxide flakes in the isotropic phase by (a) magnetic stirring and (b) manual shaking. Reprinted by permission from Springer Nature: Nature Materials, Shen et al. [37] © 2014.
Figure 9.
Time series of polarized photographs showing the temporary flow-induced alignment of graphene oxide flakes in the isotropic phase by (a) magnetic stirring and (b) manual shaking. Reprinted by permission from Springer Nature: Nature Materials, Shen et al. [37] © 2014.

Figure 10.
The dependence of (a) the phase diagram of a GO-LC (where fm is the mass fraction of GO) and (b) the zeta potential of the GO dispersion on the concentration of NaCl salt in the solution. Reprinted with permission from Xu and Gao. [12] Copyright (2011) American Chemical Society.
Figure 10.
The dependence of (a) the phase diagram of a GO-LC (where fm is the mass fraction of GO) and (b) the zeta potential of the GO dispersion on the concentration of NaCl salt in the solution. Reprinted with permission from Xu and Gao. [12] Copyright (2011) American Chemical Society.

Figure 11.
The phase diagram of graphene oxide dispersions as determined by Konkena and Vasudevan [46] displaying isotropic, nematic, columnar and glass phases. Reprinted with permission from ref. [46], Copyright (2014) American Chemical Society.

Figure 12.
(a) The phase diagram of a graphene oxide liquid crystal with added polyethylene glycol (PEG) as determined by Shim et al. [53]. (b) Typical POM images for different GO/waterPEG mixtures. Weak birefringence can be seen as the PEG concentration is increased in an initially isotropic GO dispersion. Republished with permission of the Royal Society of Chemistry, from Shim et al. [53]; permission conveyed through Copyright Clearance Center, Inc.

Figure 13.
The induced birefringence of GO dispersions as a function of voltage for three different solvents: water (a), DMF (b) and NMP (c). Reprinted from Ahmad et al. [42], with the permission of AIP Publishing. (d) The field induced birefringence of different dispersions with different average flake sizes and concentrations as a function of electric field. Reprinted with permission from ref. [39], The Optical Society.

Figure 14.
Response times of the aqueous dispersions shown in Fig.11d. (a) on-time (b) off-time. Adapted with permission from ref. [39], The Optical Society.
Figure 14.
Response times of the aqueous dispersions shown in Fig.11d. (a) on-time (b) off-time. Adapted with permission from ref. [39], The Optical Society.

Figure 15.
Alignment of aqueous graphene oxide sheets using a magnetic field as reported by Kim et al. [11]. (a) POM texture of the nematic GO LC immediately after preparation. (b) The texture after 3h with no external field present. (c) Schematic diagram showing the magnetic field set-up and POM textures of the aligned GO LC. Reproduced from ref. [11] with permission from John Wiley and Sons.

Figure 16.
XPS and size distribution of the graphene oxide used in our magnetic field experiment (a,b). The inset shows a typical POM texture of the GO (scale of 500 µm). (c) Small-angle X-ray scattering (SAXS) patterns produced by this GO at a 0.5 wt% dispersion in DMF. The magnetic field is in the horizontal direction. After leaving the sample overnight in the field, no alignment effect was observed.

Figure 17.
(a) A rewritable reflective display based on a graphene oxide nematic liquid crystals. Through application of a rod, writing can be achieved by reorientation of the director without the need for polarizers. Republished with permission of the Royal Society of Chemistry from He et al. [75]; permission conveyed through Copyright Clearance Center, Inc. (b) Shear-alignment of nematic GO can be exploited in the fabrication of large-area, highly uniform membranes for desalination applications. Reproduced under a Creative Commons Attribution 4.0 International License from Akbari et al. [69] (c) For a sensitive range of flake size and concentrations, Li et al. [73] observed selective reflection of visible light in a gel-like GO LC, with the wavelength of reflective light increasing with time as water evaporated and concentration of GO increased. Reprinted with permission from ref. [73]. Copyright (2014) American Chemical Society. (d) This polarized photograph represents the first demonstration of a hand-drawn firer composed of a graphene oxide liquid crystal and poly(acrylic acid). Orientation of the flakes along the length of the fibre leads to a high level of birefringence. Reproduced from ref. [11] with permission from John Wiley and Sons.
© 2019 by the authors. Licensee MDPI, Basel, Switzerland. This article is an open access article distributed under the terms and conditions of the Creative Commons Attribution (CC BY) license (http://creativecommons.org/licenses/by/4.0/).
Share and Cite
MDPI and ACS Style
Draude, A.P.; Dierking, I. Lyotropic Liquid Crystals from Colloidal Suspensions of Graphene Oxide. Crystals 2019, 9, 455. https://doi.org/10.3390/cryst9090455
AMA Style
Draude AP, Dierking I. Lyotropic Liquid Crystals from Colloidal Suspensions of Graphene Oxide. Crystals. 2019; 9(9):455. https://doi.org/10.3390/cryst9090455
Chicago/Turabian StyleDraude, Adam P., and Ingo Dierking. 2019. "Lyotropic Liquid Crystals from Colloidal Suspensions of Graphene Oxide" Crystals 9, no. 9: 455. https://doi.org/10.3390/cryst9090455
Note that from the first issue of 2016, this journal uses article numbers instead of page numbers. See further details here.