The polymers underwent either: (i) a thermal treatment at 380 °C, below the degradation temperature, with the purpose of clearing the polymer pores, or (ii) a chemical activation with KOH using differing pre-activation methods to find the best conditions for KOH moisture to diffuse into the UPO pores. The mixtures were then thermally treated at 750 or 800 °C.
3.1. Effects of Thermal Treatment at 380 °C
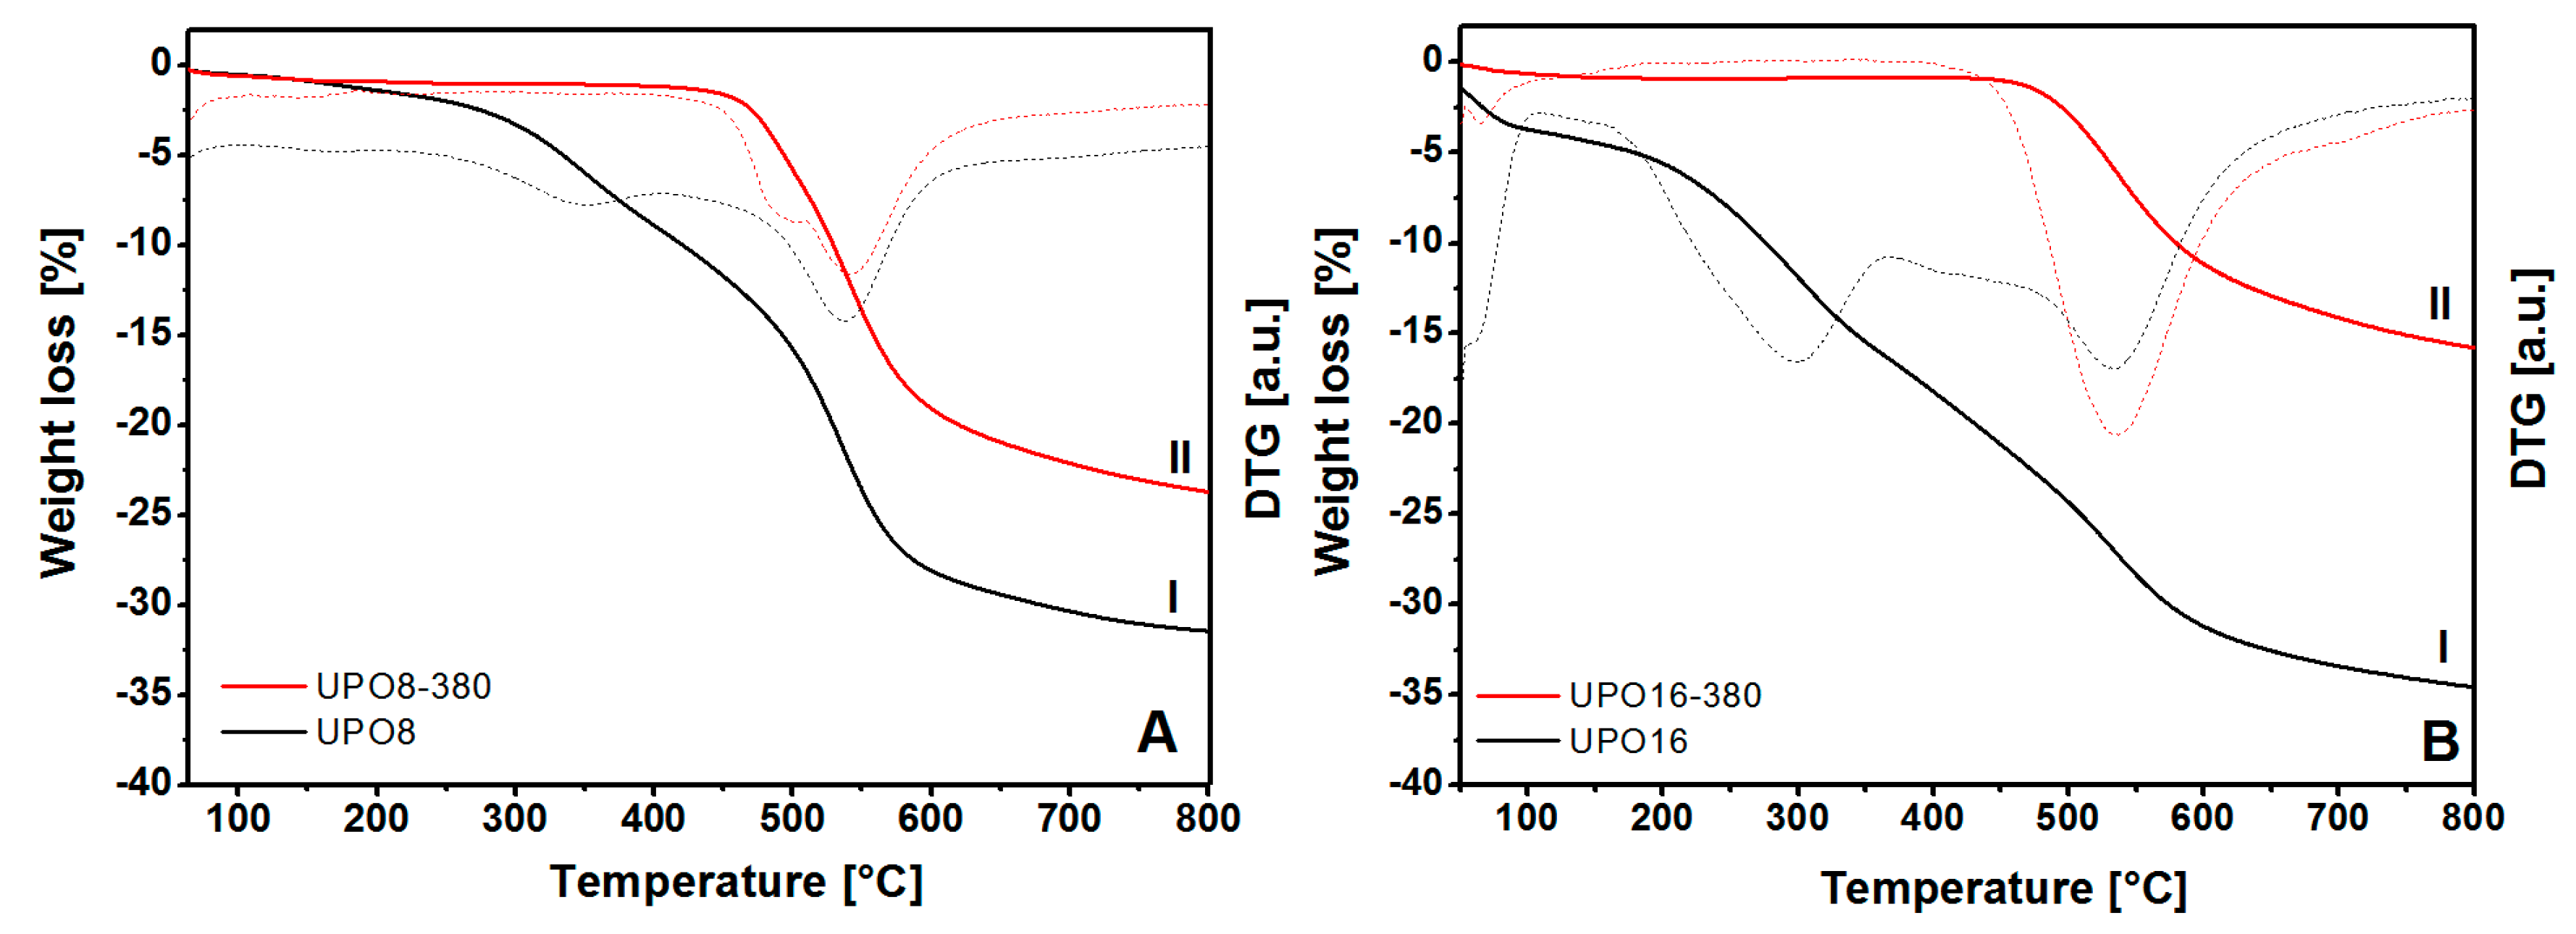
The results of the thermal gravimetric analysis (TGA) on the starting polymers and on the sample treated at 380 °C are compared in
Figure 3.
The TGA profiles report two distinct weight losses in the original polymers (before the thermal treatment, curves I in
Figure 3), one of which (centered at about 300 °C) is attributed to reaction impurities still present in the pores and the second (above 450 °C) to the framework decomposition. On the other hand, the thermal profiles of UPO8-380 and UPO16-380 samples (
Figure 3, curves II) show only the weight loss starting at about 460 °C due to the structure decomposition. This behavior demonstrates the complete removal of impurities trapped in the porous structure upon treatment at 380 °C, however, this does not alter the thermal stability of UPO frameworks.
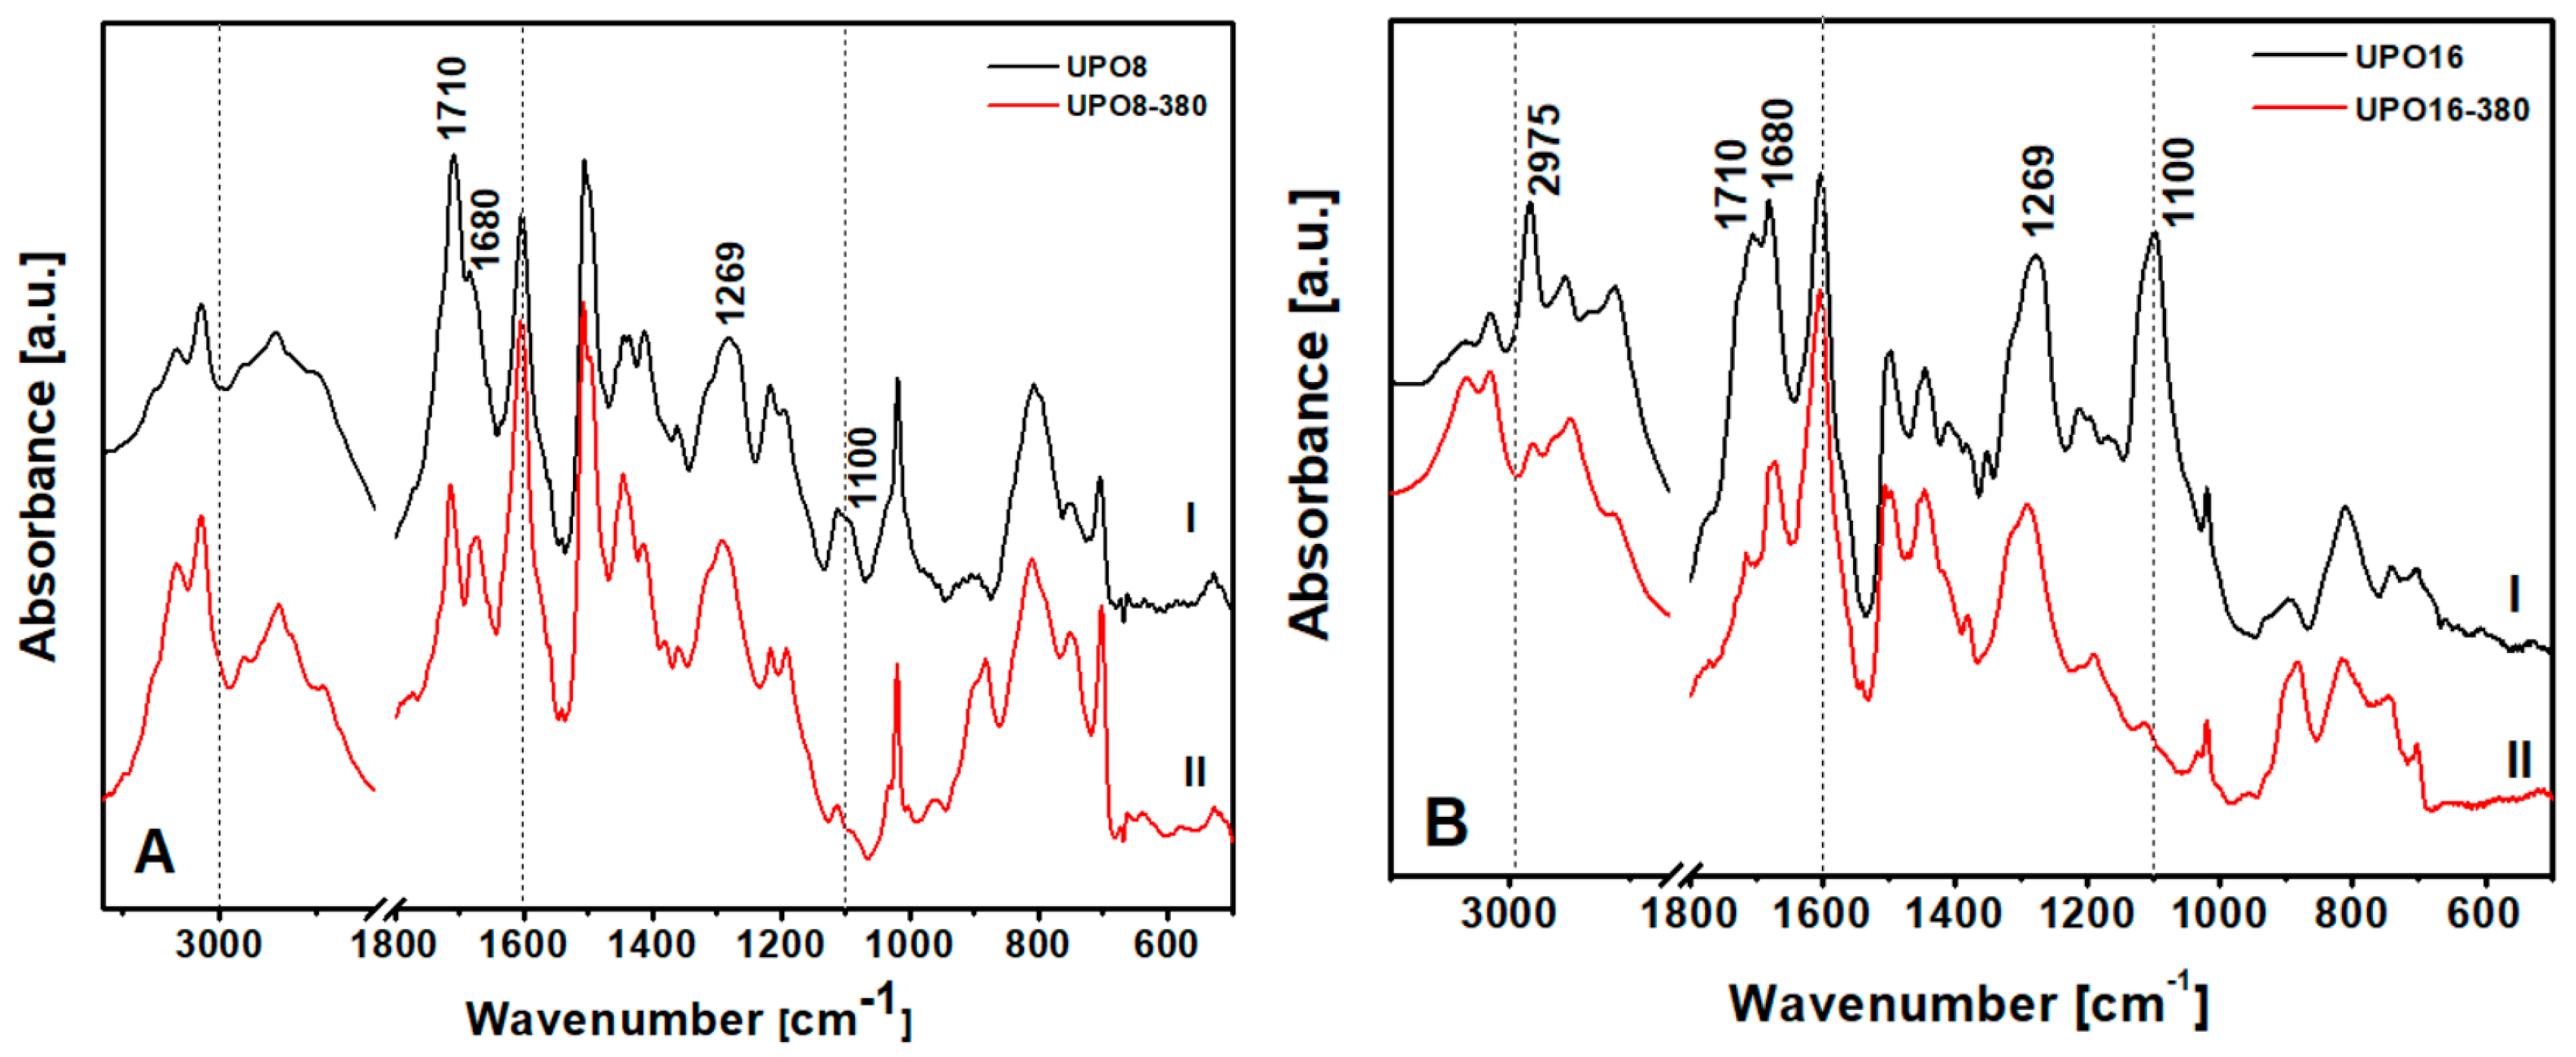
To detect the type of impurities present in UPO8 and UPO16 starting materials, FTIR spectroscopy was used (
Figure 4).
The bands between 3000 and 2800 cm
−1, assigned to aliphatic C–H stretching, are strongly weakened after the thermal treatment (
Figure 4, curves II: the effect is better appreciated by comparing them to the bands above 3000 cm
−1, attributed to aromatic C–H stretching, left unaltered), demonstrating the removal of aliphatic impurities. In particular UPO16, synthesized with a higher FDA concentration, shows a band at 2975 cm
−1 due to the asymmetric stretching of methyl groups in FDA fragments that disappears after thermal treatment. In the low frequency region, the bands at 1710 and 1680 cm
−1, due to vibrations of substituted aromatic rings, undergo an intensity decrease probably caused by the removal of part of the chloro-methylene groups or FDA side-reaction products. Indeed, the band at 1269 cm
−1, due to the CH
2 wagging mode of the chloro-methylene groups, is still present, but with lower intensity compared to the situation before the treatment. Moreover, the absorption at 1100 cm
−1, which is very intense in the starting polymers, disappears completely after treatment. This band has been assigned to ether groups and the disappearance confirms that the treatment cleaned the pores from trapped fragments of FDA. To summarize, the as-prepared UPO polymers show: (i) chloro-methylene groups attached to the aromatic rings of the polymer skeleton and (ii) FDA side-reaction products linked or trapped into the pore of the polymer. The precise nature of these fragments is far beyond the scope of the present paper, and will be the subject of a specific contribution.
Then the pore size distribution (PSD) of all the samples was analyzed by N
2 physisorption at 77 K: the adsorption isotherms, and the corresponding PSD are reported in
Figure 5 for UPO materials before and after the thermal treatment.
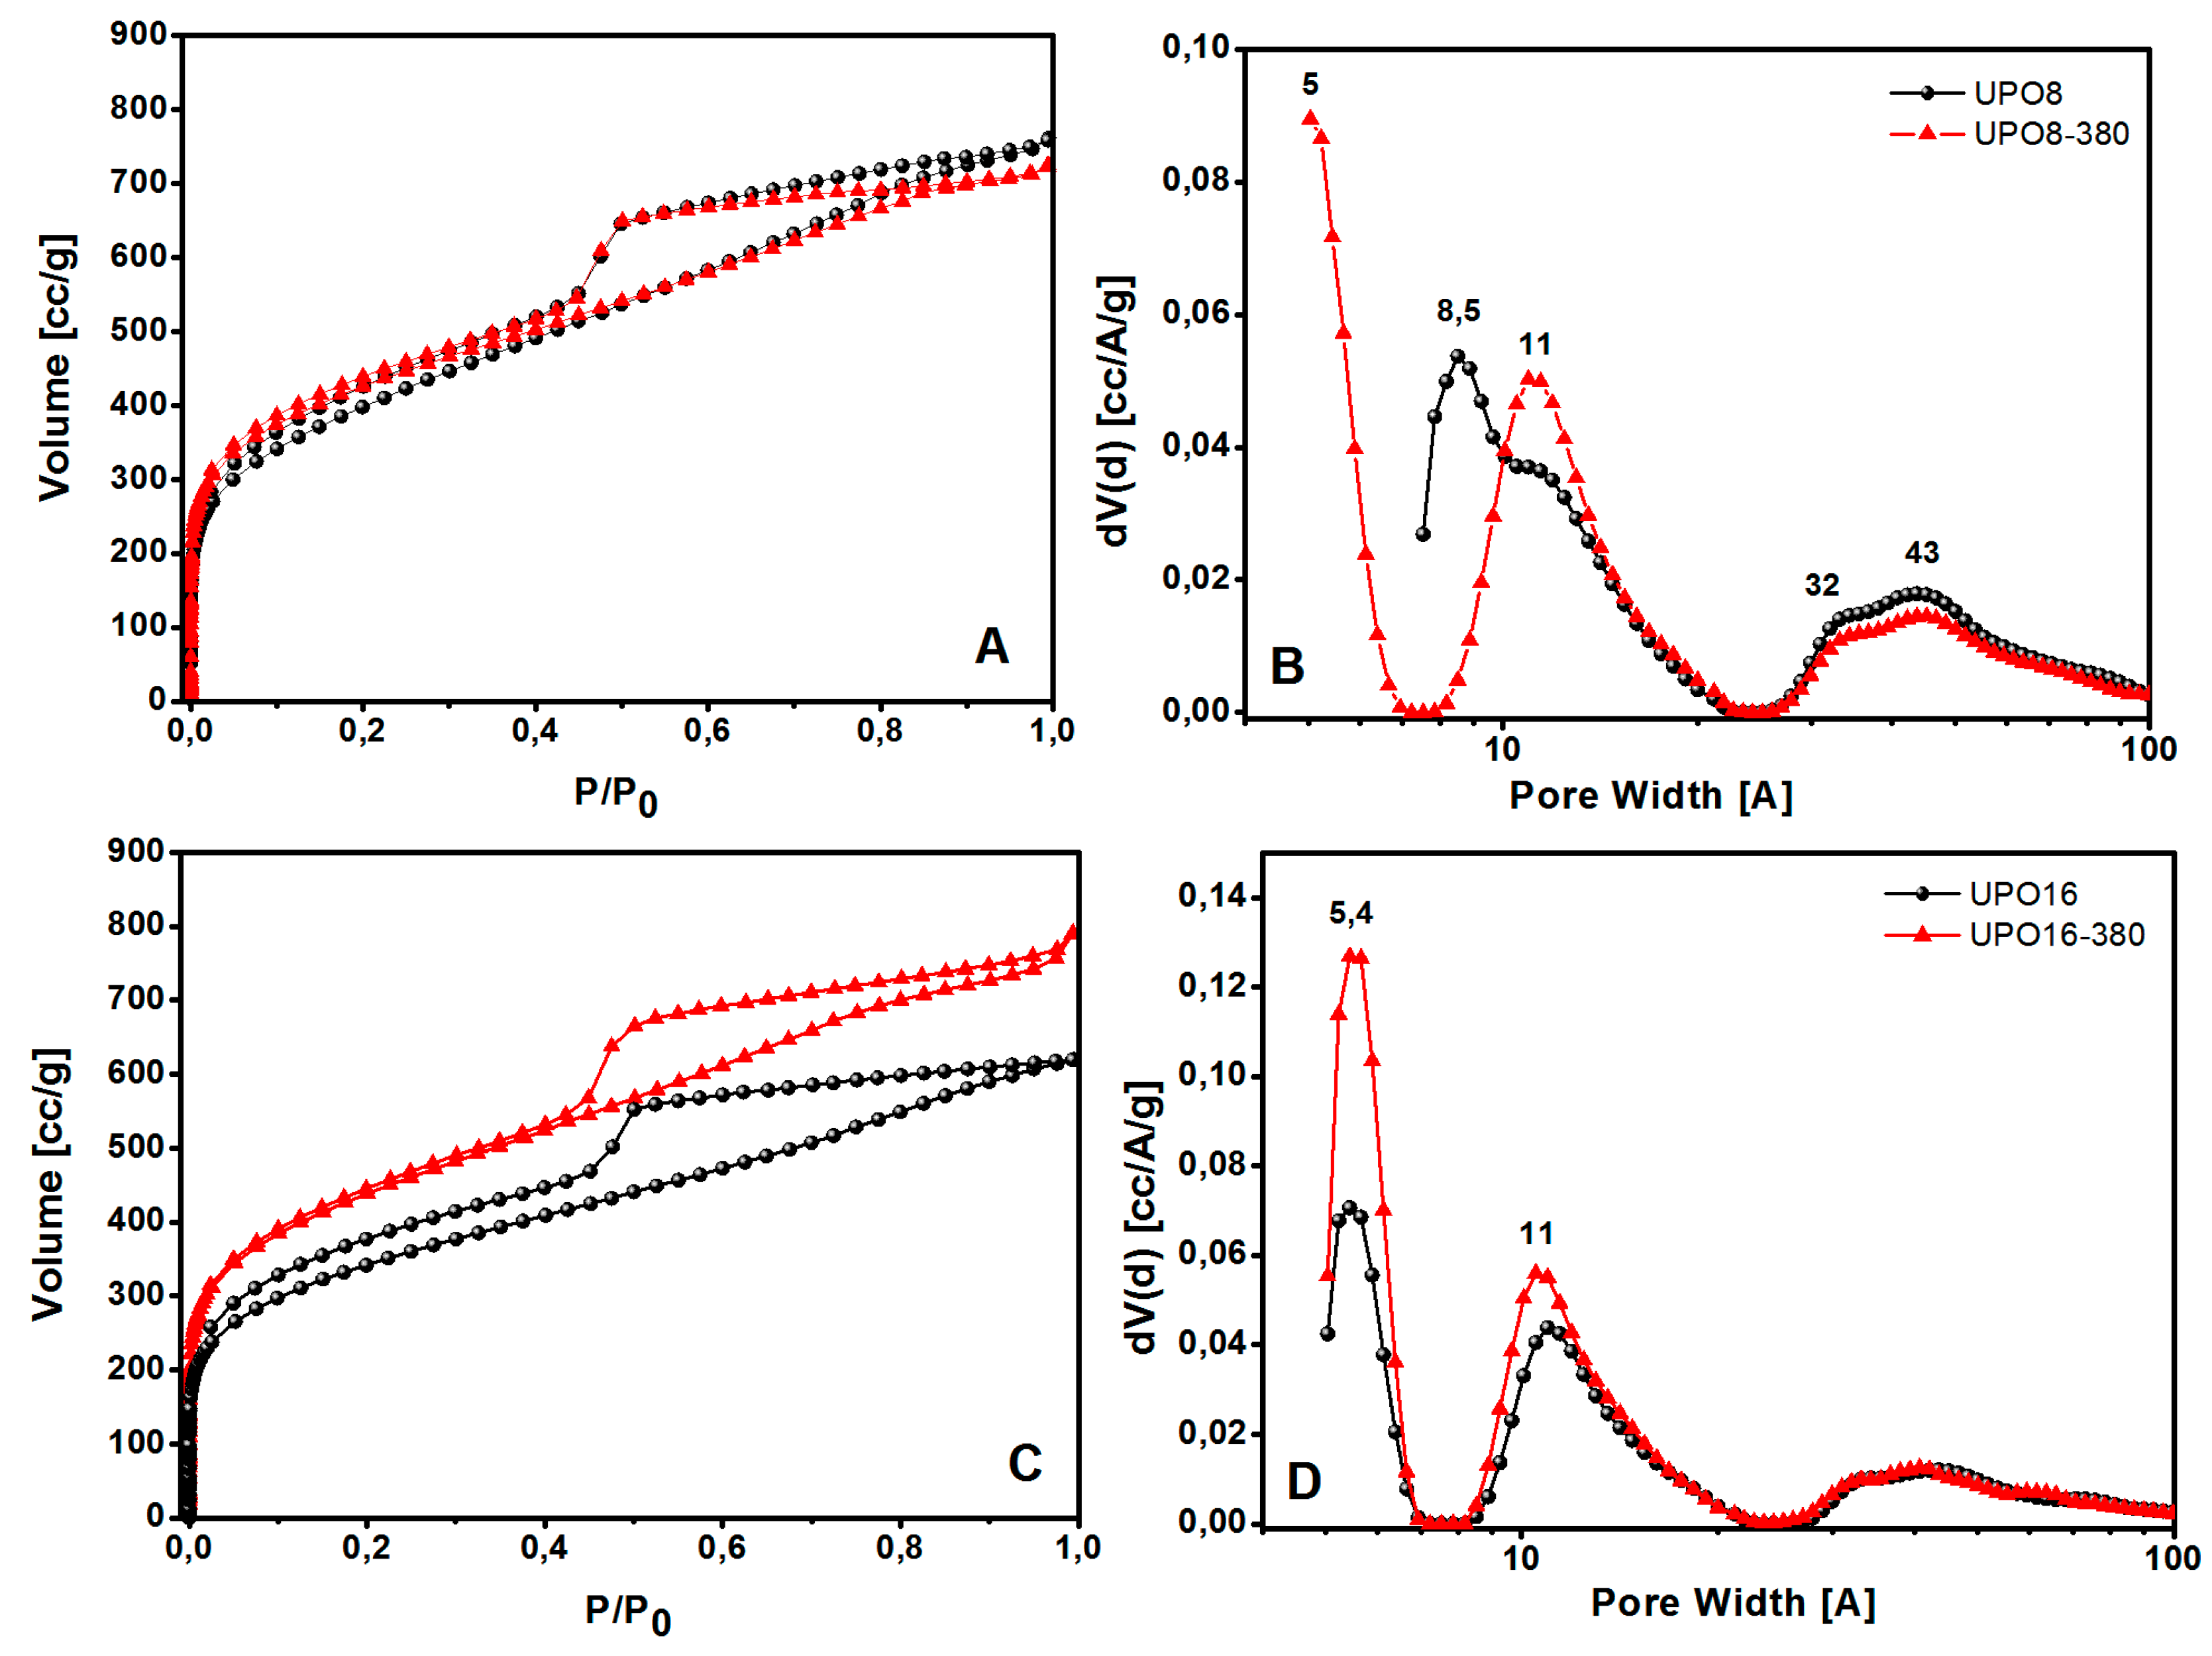
According to the IUPAC classification, all the isotherms shown in
Figure 5 are of type I in the adsorption branch with H
2-type hysteresis in the desorption branch. A large quantity of gas (>200 cm
3/g) is adsorbed at low relative pressures, as expected for microporous materials; the isotherms also display a further gradual filling of mesopores at higher relative pressures in the range of 0.45–1 P/P
0.
The porous properties of the polymers are summarized in
Table 1. UPO8 shows a higher BET surface area (1435 m
2∙g
−1) than UPO16 (1289 m
2∙g
−1). After the thermal treatment, the surface area increases for both the materials, reaching a similar value higher than 1500 m
2∙g
−1. The increment of surface area is much larger for UPO16 (17%) than for UPO8 (6.5%), showing that the former sample contains a higher amount of side-products of the cross-linking polymerization entrapped inside the micropores, in agreement with TGA and FTIR results. Interestingly, while UPO16 and UPO16-380 exhibit a similar PSD with ultramicropores at about 5.4 Å and micropores at 11 Å, the effect of thermal treatment on UPO8 is different: in fact, ultramicropores at about 5.4 Å appear only after the thermal treatment, when micropores at 8.5 Å disappear and a family at 11 Å increases. In other words, the parent materials (UPO8 and UPO16) exhibit quite a different PSD, while their counterparts after the treatment (UPO8-380 and UPO16-380) are much more similar to each other. In all the cases, the thermal treatment at 380 °C led the micropore volume to increase, and the mesoporous volume to decrease.
The observed increase of the microporous volume upon thermal treatment is particularly interesting for gas storage or gas separation applications, as these kind of pores are responsible for the adsorption at low pressure.
3.2. Effects of Chemical Activation at High Temperature
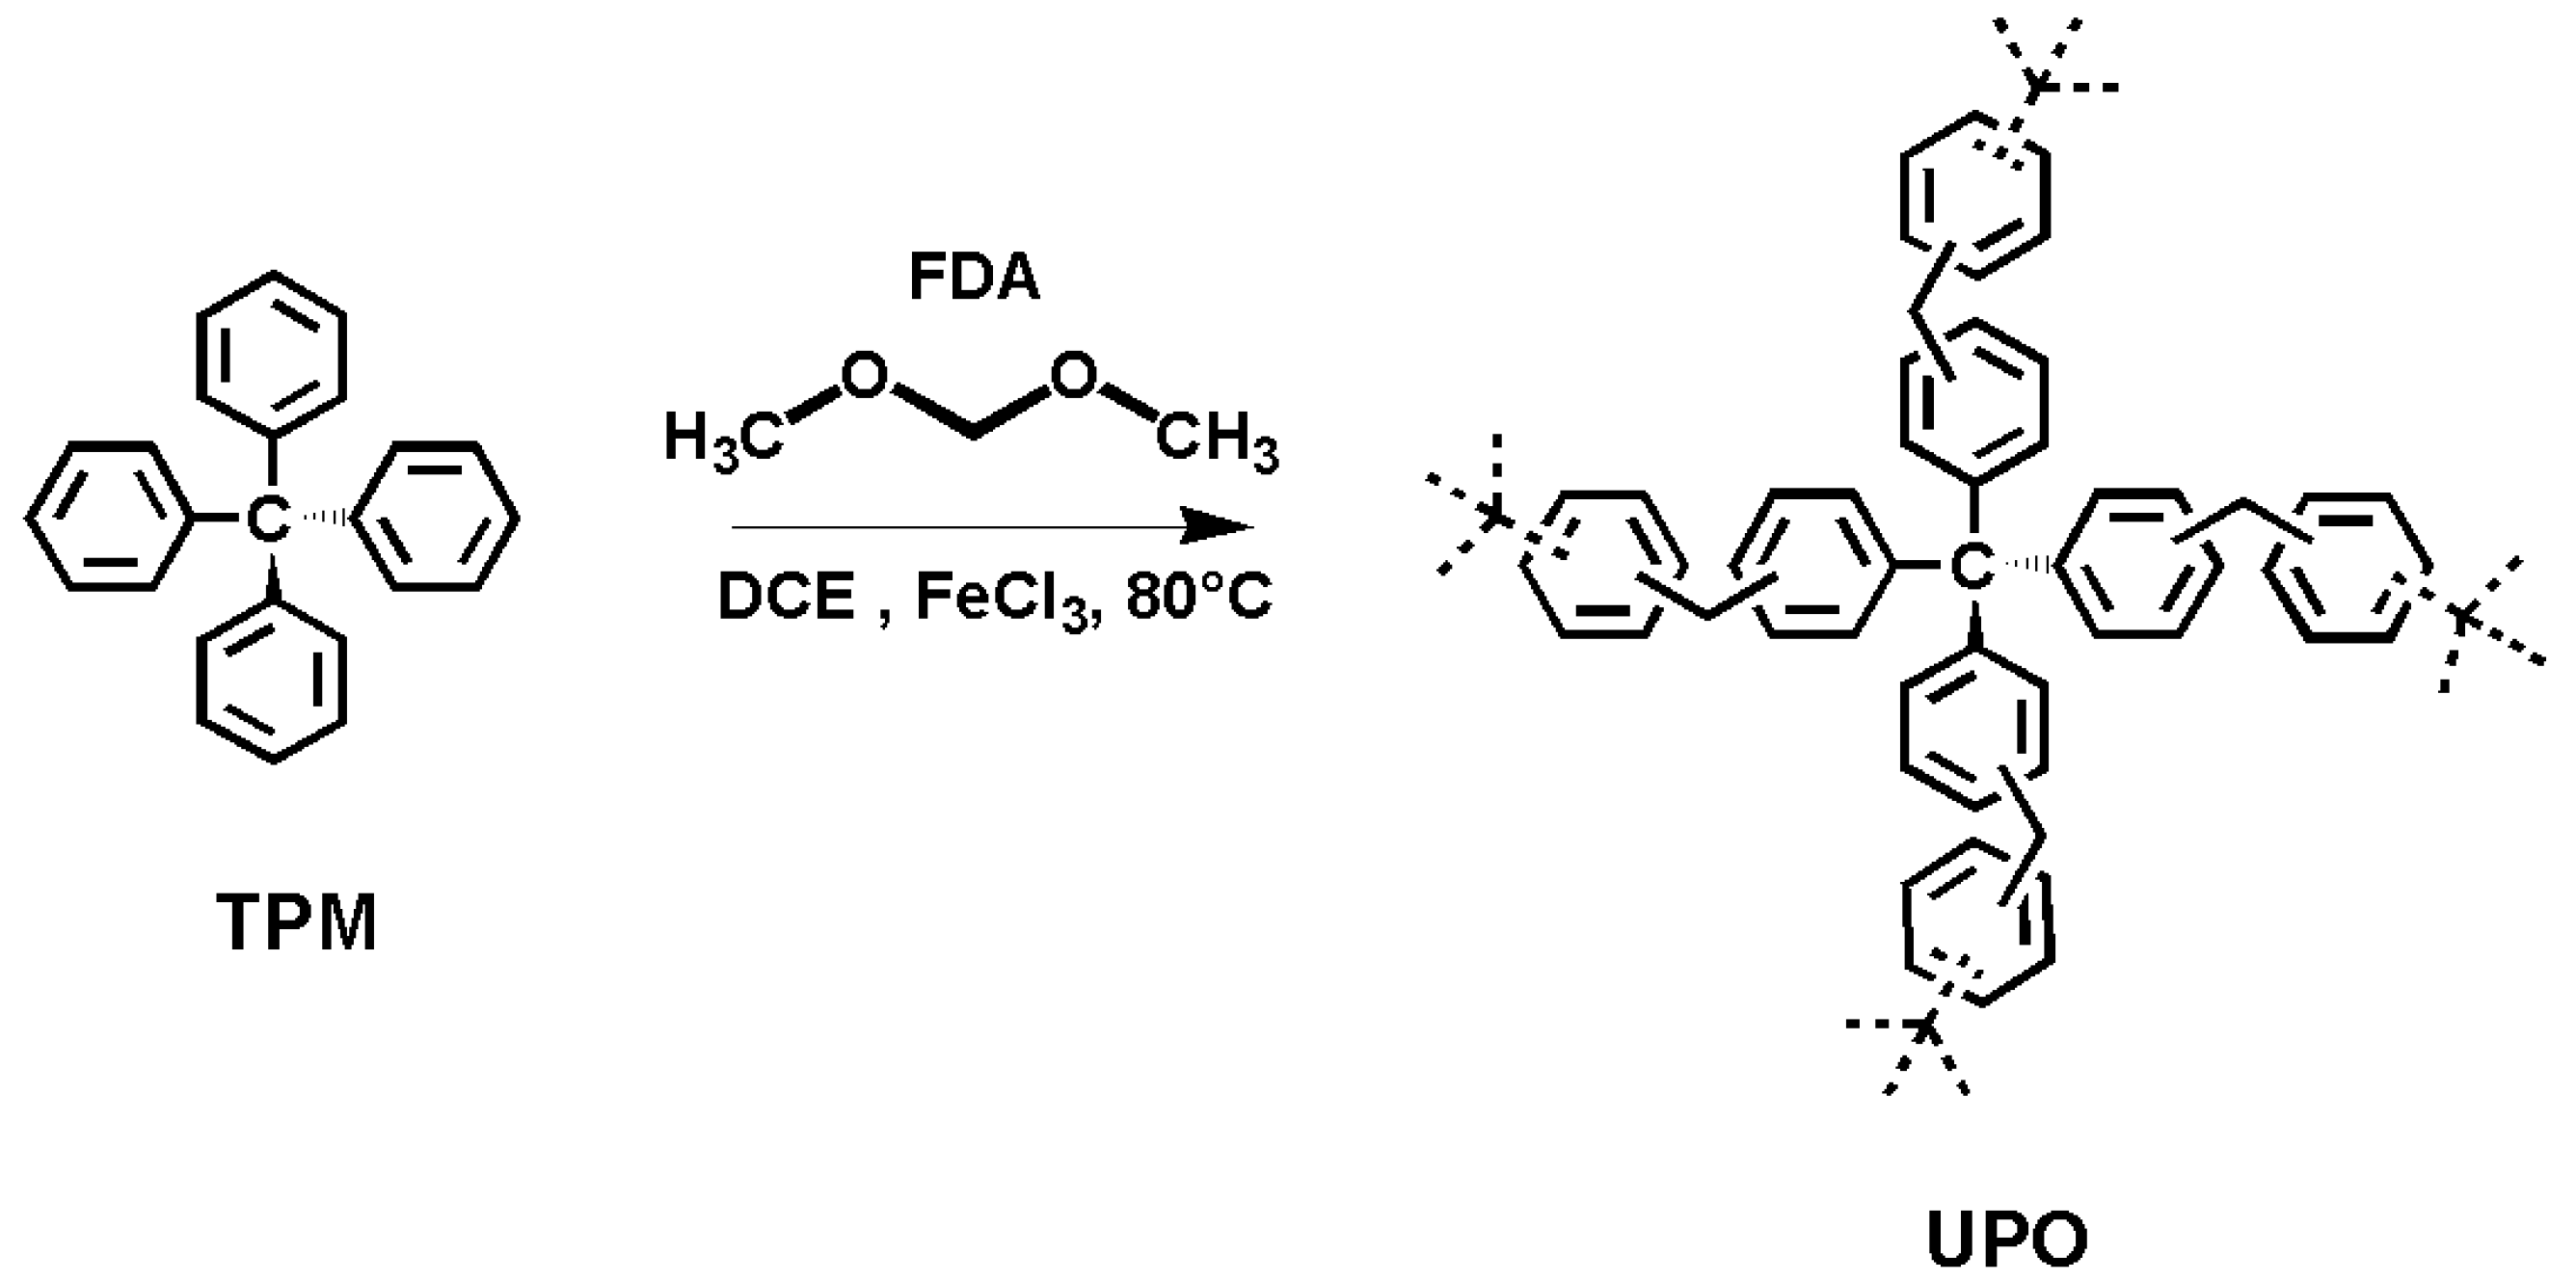
UPO8 and UPO16 were also activated chemically with KOH at high temperatures, causing the carbonization of the materials: this is an effective method for the preparation of highly microporous materials. The activation mechanism occurs as a stoichoimetric solid–solid/solid–liquid reaction [
63,
64], according to equation 6KOH + 2C → 2 K + 3H
2 + 2K
2CO
3. With the increase of the activation temperature above 700 °C, the resulting K
2CO
3 starts to decompose into K
2O and CO
2. Thus, the high microporosity in the carbon matrix is formed due to the ternary collaborative effects of chemical activation, physical activation, and the expansion of the carbon lattices by metallic potassium intercalation; this expansion is maintained even after the final wash.
The elemental composition of the KUPO materials was determined by EDX analysis, allowing exclusion of the presence of potassium in the washed samples.
In the literature [
65] it is known that the key parameters for obtaining an efficient carbonization are the temperature, the nature of the activating agent, and the precursor/activating agent ratio. Here we investigated the effect of different combinations of these factors on the textural properties of the resulting carbons. Thus, UPO8 was either homogeneously grinded with KOH, and then left in open air for 5 h before carbonization (Method 1), or stirred for 18 h in a 1 M KOH solution in EtOH, and then dried and carbonized (Method 2), or grinded with KOH in inert atmosphere and then carbonized (Method 3). Since the carbonization temperatures were either 750 or 800 °C, a total of 6 porous carbon materials were obtain from UPO8; as for UPO16, for each activation method only the temperature that gave the best results for KUPO8 was applied, thus obtaining three KUPO16 materials in total.
The carbonization degree after the KOH-activated thermal process described above was evaluated with Raman spectroscopy (
Figure 6).
The curves correspond to the samples reported in
Table 2.
The spectra show two main vibrational bands at 1340 and 1600 cm
−1: the latter (G peak) corresponds to the Raman-allowed E2g mode in the ideal graphite, while the signal at 1340 cm
−1 (D peak) corresponds to the disorder-induced band, which is associated with the large density of phonon states [
66].
In particular, since the ratio of the bands D and G (
ID/
IG) is inversely related to the crystalline domain dimension [
67], the strong D-peak in our samples demonstrates that the microporous carbons have an intermediate degree of graphitization (
ID/
IG = 1.27–1.81) and contain a significant amount of disordered domains and defects.
Considering the three different carbonization methods, in all cases the value of ID/IG decreases with the increase of temperature and the TPM/FDA ratio, indicating that these conditions lead to more ordered materials. Analogously, the ID/IG values for the carbons obtained from UPO16 are systematically lower than those from UPO8, revealing again a more ordered structure for the former.
Compared to carbonized PAF-302 (
ID/
IG = 0.70–0.90) [
55], KUPO carbons have a higher
ID/
IG ratio, and this can be explained by considering the structural difference of the parent materials. In HCPs, the –CH
2– linkers make the structure more flexible and disordered than in PAF-302, also reflecting on the carbonized materials.
The PSD and the pore volume were evaluated for KUPO materials with N
2 physisorption at 77 K. The adsorption isotherms and the related pore size distributions are reported in
Figure 7. The structural data were obtained from the adsorption branches by applying the QSDFT method, parameterized for carbon surfaces and slit/cylindrical pores (
Table 3) [
68].
All KUPO materials show a type I(b) isotherm with a minimal hysteresis at high relative pressures, and a large quantity of gas (>400 cm3∙g−1) adsorbed at low relative pressures, as expected for microporous materials. The carbonization of UPO16 with all three methods leads to similar PSD, with predominant micropores centered at 8.5 and 14 Å. On the contrary, the activated carbons obtained from UPO8 have different pore sizes depending on the activation method. Method 1 leads to a pore distribution centered at 8.5 and 14 Å (very similar to KUPO16), method 2 at 750 °C yields micro and mesopores, while at 800 °C ultramicropores at 5.2 Å are also formed; on the contrary, with method 3, micropores are obtained at 800 °C and both ultramicropores and micropores at 750 °C.
High surface areas, ranging from 2318 to 2975 cm
−1, and high total pore volume, ranging from 1.03 to 1.30 cm
3∙g
−1, characterize all the activated carbons (
Table 3). The apparent surface areas and pore volumes of the activated carbons are remarkably improved with respect to the parent materials.
It is noteworthy that all the results reported here refer to parent UPO materials not treated at 380 °C. If the same chemical and thermal activation procedures are applied to UPO8-380 or UPO16-380, the resulting carbons present systematically much lower surface areas and pore volumes (data not reported for simplicity). Thus, the removal of side-products obtained by heating at 380 °C with the consequent modifications of the textural properties described (see in
Table 1) affects the carbonization process adversely.
The above data demonstrate that the chemical activation leads to porous carbons with improved textural properties, increasing microporous volumes and decreasing mesoporous volumes. The PSD and the total volumes are affected not only by the temperature but also by the pre-treatment with KOH, as well as by the textural and structural properties of the parent polymers. The pore occlusion, more abundant in the UPO16 sample, may in fact play a role in determining the higher pore volume and surface area of the carbon KUPO16.
Among the porous carbons obtained, KUPO16-2-750 is characterized by the highest surface area and microporous volume (
Table 2), so we selected this material to test the gas storage capacity, measuring the excess adsorptions of CH
4, H
2, and CO
2 at high pressures. The KUPO16-2-750 uptakes are compared to the results of the parent UPO16 to highlight the effect of the carbonization treatment.
3.3. High Pressure Gas Uptake
In particular, narrow pores (i.e., ultramicropores) are important for adsorbing gas at low pressures, since in these conditions the uptake is dominated by the host-guest interactions between gas molecules and pore walls. On the other hand, micropores and mesopores with small diameter, contributing to high surface area and large pore volume, are very important for the adsorption at higher pressure.
Note that the performance of an adsorbent in gas storage applications can be described either on gravimetric or on volumetric scales (measuring the quantity of adsorbed gas per gram or per cubic centimeter of adsorbent, respectively). Gravimetric uptakes are usually correlated to textural properties (surface area, porous volume, pore size distribution) [
69,
70,
71], which are in turn often measured and reported per gram of material; on the other hand, volumetric uptakes also depend on the adsorbent density [
72,
73,
74]. When different materials are compared, volumetric capacities are usually more reliable (if the densities are very different, less-dense materials are artificially favored in the gravimetric comparison); moreover, in practical applications, the main interest is often the amount of gas that can be stored in a reservoir of given volume.
In the following, the gravimetric gas uptakes of methane, carbon dioxide, and hydrogen are discussed first, then we consider how to effectively measure the density of compact samples to obtain a useful estimate of the volumetric uptakes.
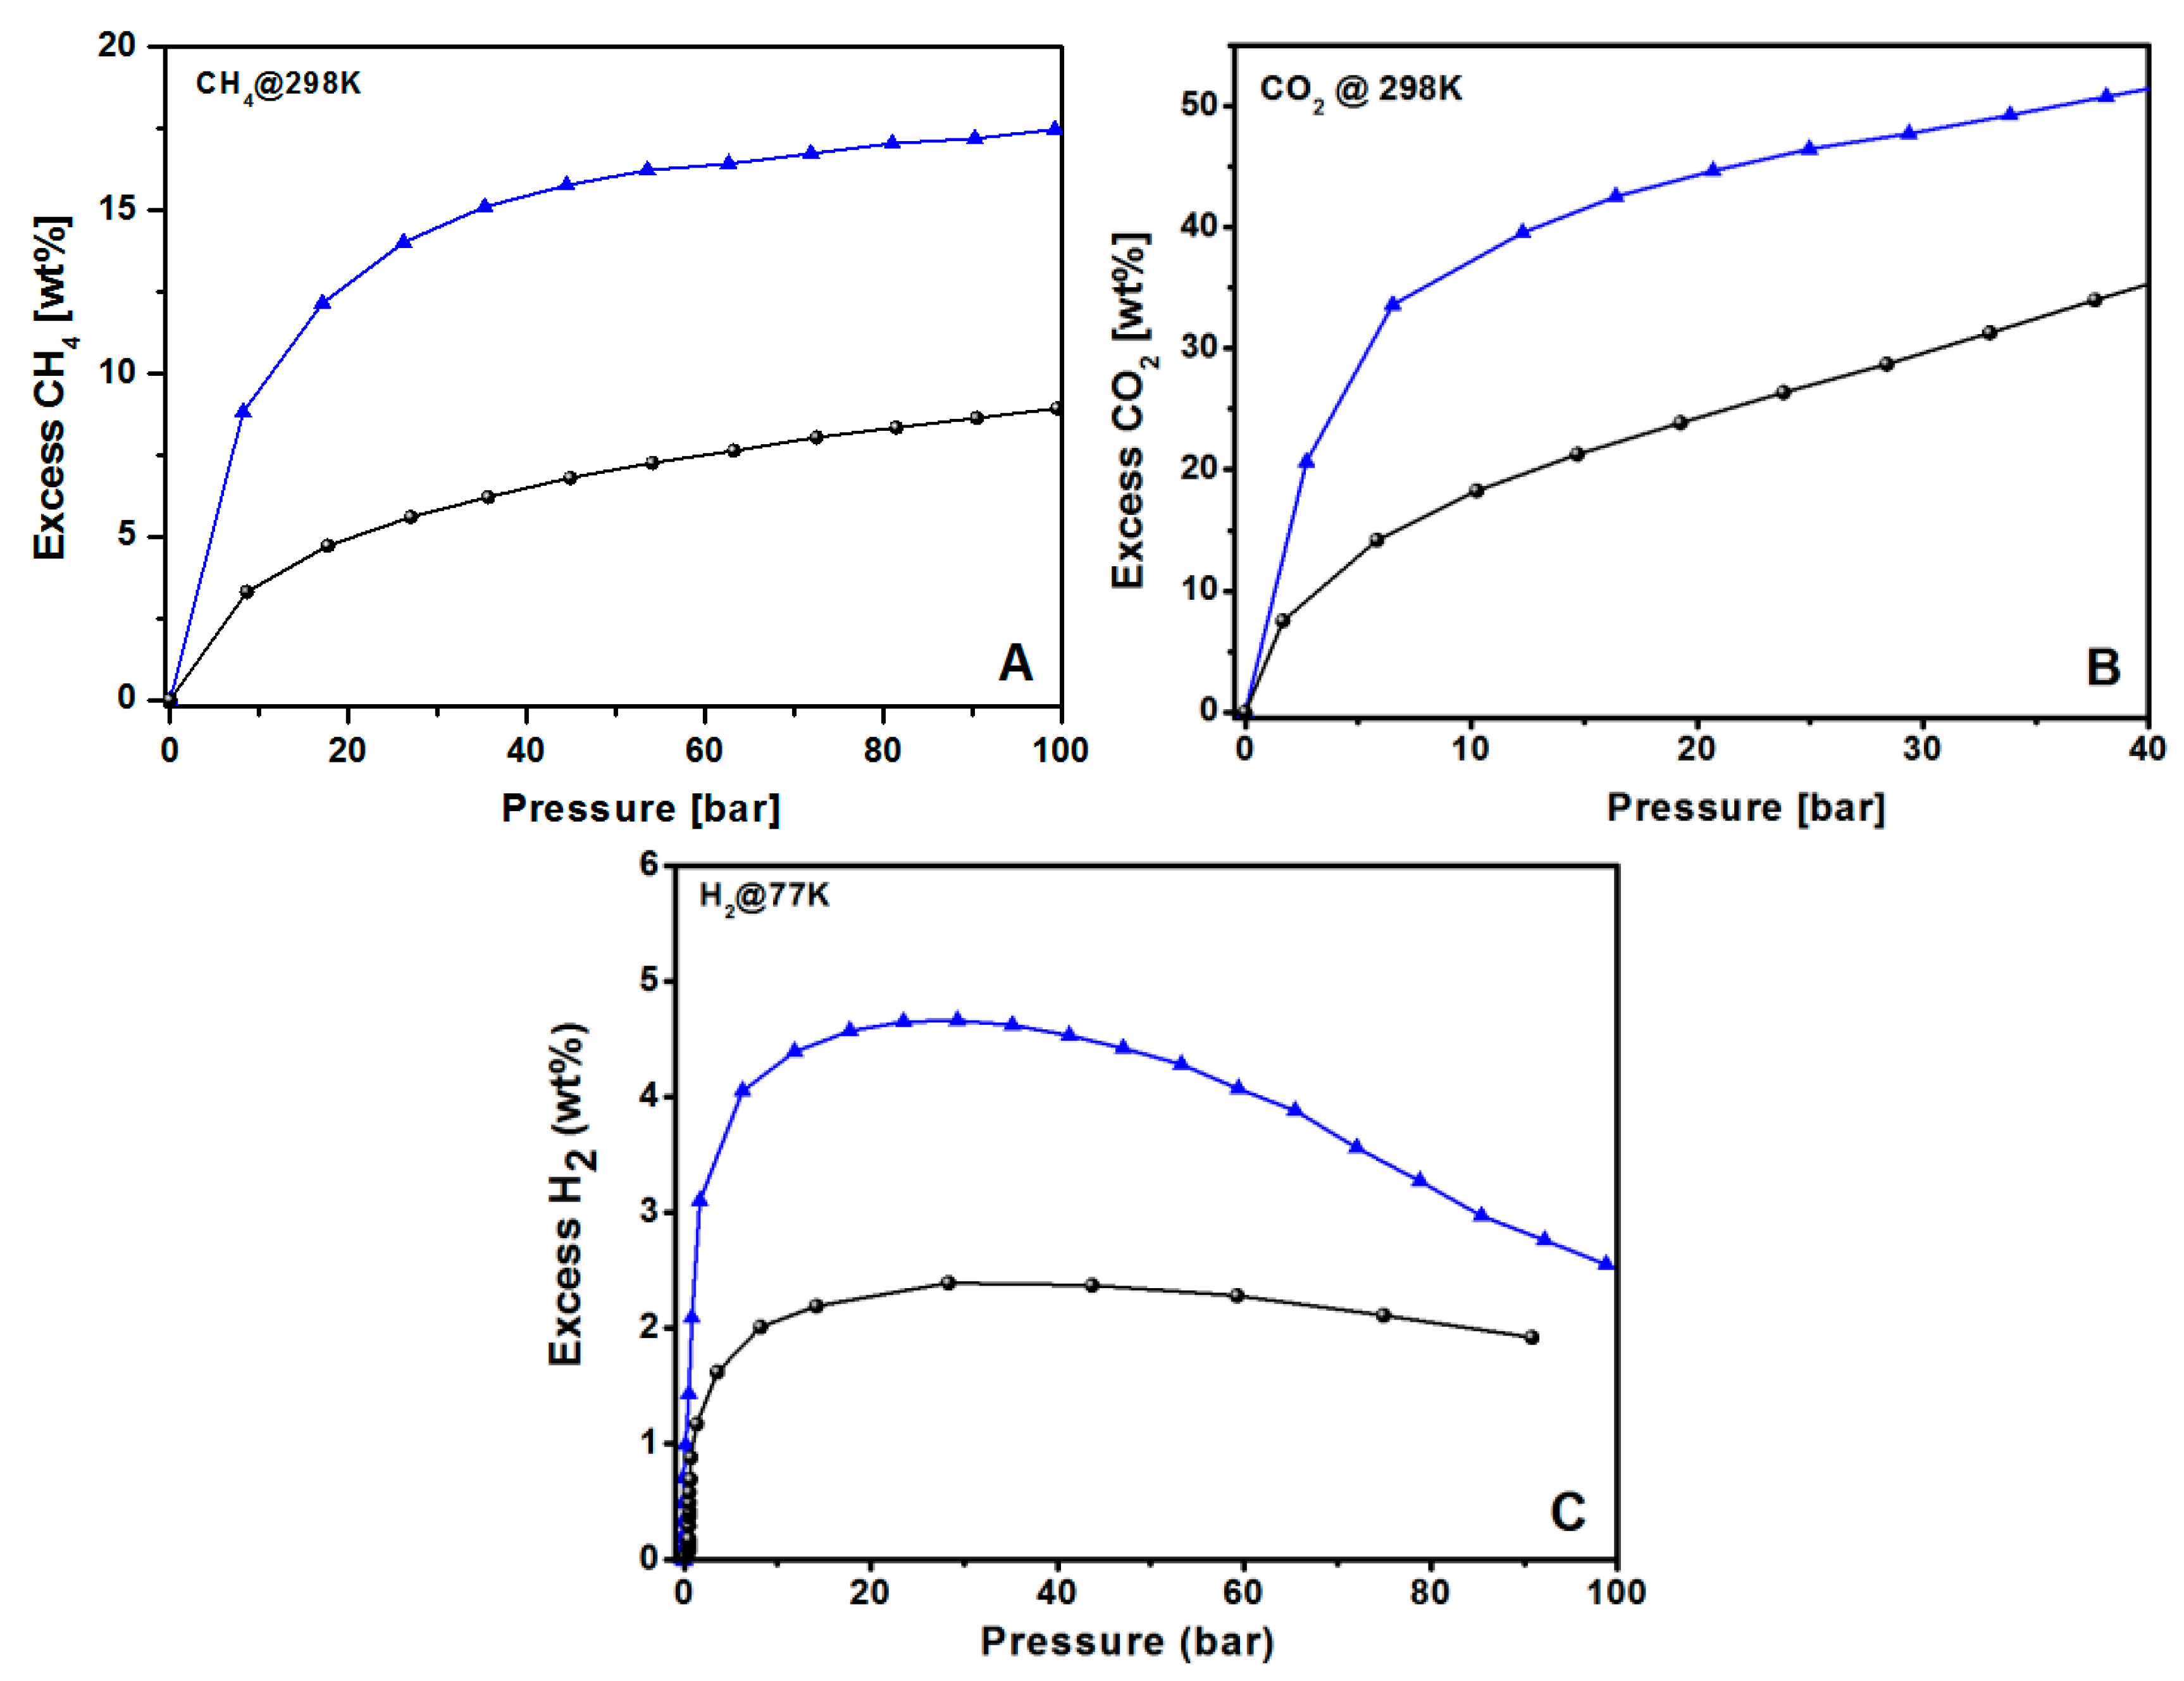
For all the tested molecules, KUPO16-2-750 uptakes are highly improved with respect to UPO16, as expected due to the higher surface area and optimal porosity obtained under controlled KOH chemical activation. For CH4 storage, both the materials do not reach saturation at 100 bar, but the storage is still increasing with pressure. The maximum CH4 adsorption at 100 bar is 9 and 18 wt % for UPO16 and KUPO16-2-750, respectively.
The CO
2 uptake at 40 bar reaches 35 and 52 wt % (12,4 and 24,0 mmol/g) for UPO16 and KUPO16-2-750, respectively (
Figure 8B). The excellent uptake of CO
2 by KUPO16-2-750 is explained by the presence of high amounts of pores with sizes in the range 8–11 Å.
For both CO
2 and CH
4 storage, KUPO16-2-750 sorption properties compare well with those of the top performing carbon materials described in the literature (
Table 4). For example, KUPO16-2-750 adsorbs 15.1 wt % of CH
4 at 35 bar, whereas K-PAFs adsorb in the 8.7–17.1 wt % range [
57], commercial activated carbons (ACs) (Maxsorb, F400, RGC30) in the 5.6–11 wt % range [
8], ACs obtained from mesophase pitches in the 15.2–16.6 wt % range [
8], and activated graphene-derived porous carbon in the 13.2–15.3 wt % range [
75]. As for CO
2 capture at 298 K and pressures up to 40 bar, the KUPO16-2-750 performance (52 wt %) is very high compared to other top performing carbons reported in the literature, namely K-PAFs (31.5–56.9 wt %) [
57], commercial carbon AX21 (49.7 wt %, 20 bar) [
76], and a-GDC graphene-derived carbons (41–48 wt %, 20 bar) [
75].
Concerning the hydrogen adsorption, the maximum storage capacities of KUPO16-2-750 and UPO16 are 4.7 wt % and 2.2 wt % at 30 bar, respectively (
Figure 8C). These data match well with the results from other porous carbon adsorbents with similar porosities. For example, Panella et al. [
77] reported a capacity storage of 4.5 wt % at 77 K for the Activated Carbon I obtained from coke, whereas J. Wang et al. [
78] reported H
2 uptake of 4.2–4.7 wt % at 77 K for fungi-based porous carbons. H
2 uptake of KUPO16-2-750 is also comparable (4.4–5.2 wt %) to different mesoporous carbide-derived carbons with very high surface areas (2500–3000 m
2g
−1) [
79,
80]. These results confirm the correlation of the hydrogen uptake capacity at high pressure with total micropore volume of ACs, with similar pore size and chemical surfaces [
81].
3.4. Packing Densities
Both UPO and KUPO materials are synthesized as highly fine-grained powders: in this case, the apparent density estimated from the skeletal density (usually measured with helium adsorption) and the porous volume is often poorly related to the effective volumetric uptakes and to the storage capacity discussed below, for the presence of macropores and grain–grain mispacking.
Then KUPO16-2-750 powder was pressed into compact tablets that could be handled more easily, also eliminating the dead volume to a good extent (clearly this is different from the process of pellet or monolith formation, requiring more severe conditions). The samples were pressed at 0.75 tons/cm
2 for variable times (from 10 to 180 min) until the density was stable; another sample was pressed at 15 tons/cm
2 for 10 min. The resulting packing densities are reported in
Table 5; a similar procedure with a pressure of 0.75 tons/cm
2 was applied to measure the density and the gas storage of porous carbons in other studies [
8,
85].
After the compression, the tablet obtained at 15 tons/cm
2 for 10 min (with the highest packing density) was further characterized with N
2 adsorption to verify the extent to which the micro- and mesoporosity were affected, with the results illustrated in
Table 6. The packing process cuts the total porous volume to 12%, entirely due to a small reduction of the microporous fraction.
3.5. Methane Storage Capacity of KUPO16-2-750
The performance of an adsorber in real working conditions is estimated better by the storage capacity (
nstg), which corresponds to the density of gas that can be stored in a container completely filled by the adsorber. In other words,
nstg is the absolute amount of gas per unit volume adsorbed inside the porous material plus the density of gas in the large macropores (which are not included in the porous volume measured by nitrogen) and in the interparticle space. To calculate this value, the following equation has been proposed [
8]:
combining the excess volumetric uptake (
nexc) with the free gas density (
rgas), the quantity in parentheses estimates the fraction of dead volume in the container from the adsorbent skeleton density (
rHe, determined by helium pycnometry) and its packing density (
rpack).
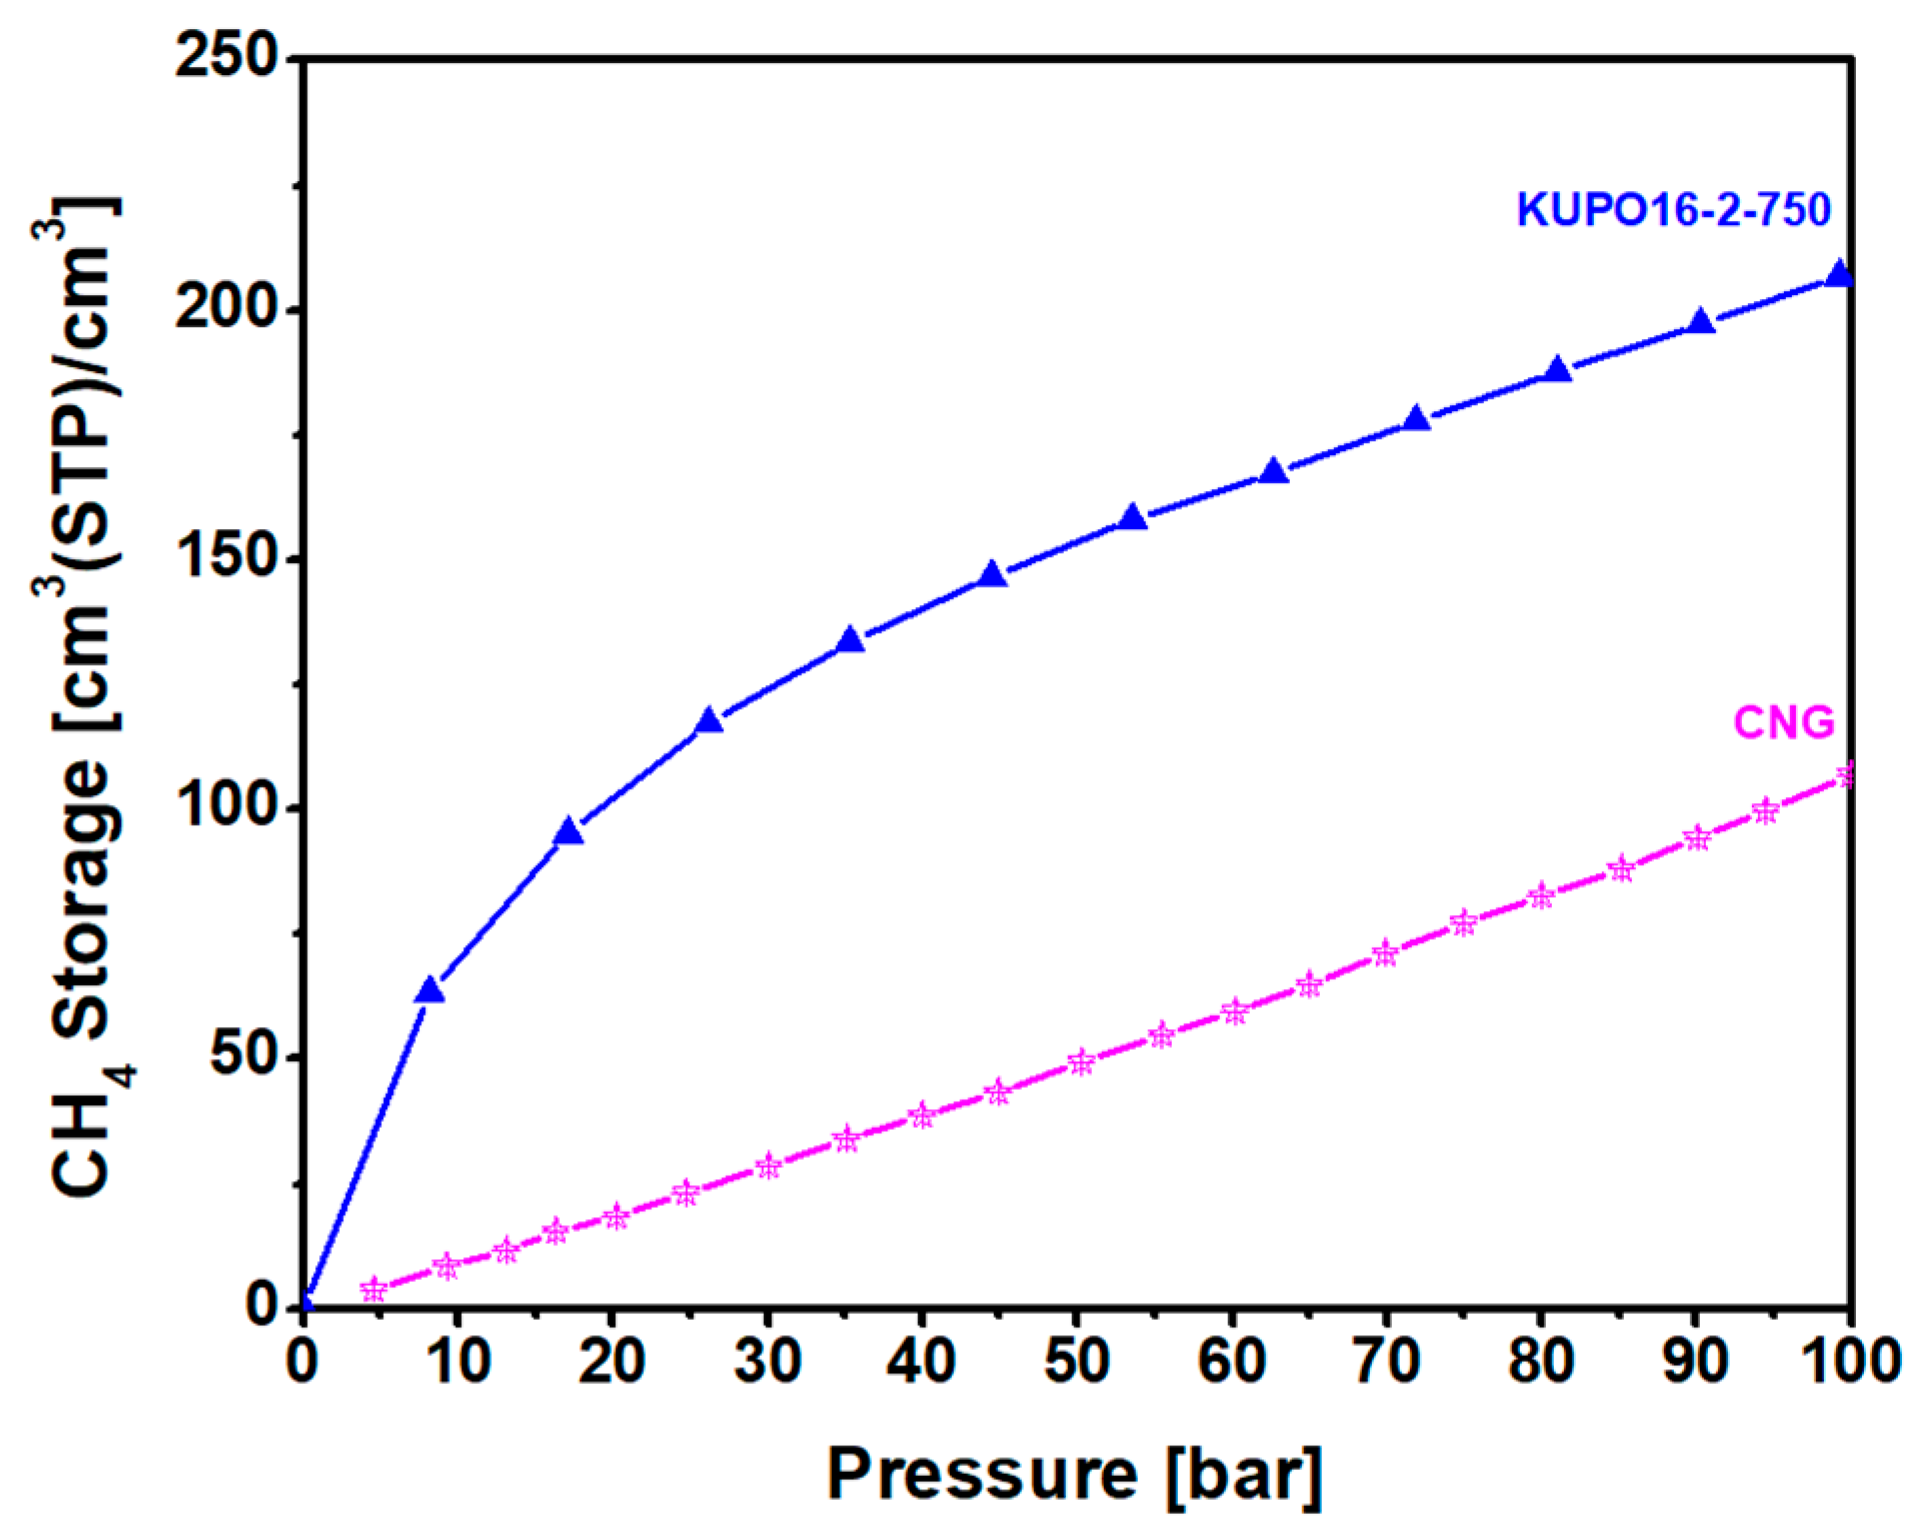
The methane storage capacity of KUPO16-2-750 is illustrated in
Figure 9 for pressures up to 100 bar. Considering the easy and low cost synthesis of the material, this performance is very satisfactory. At 20 bar, the storage capacity is almost equal to the capacity reported for LMA738, the best carbon material reported so far for this kind of application. For higher pressures, KUPO16-2-75 storage capacity is lower (210
v/v compared to 260
v/v for LMA738, at 100 bar) due to the smaller mesoporous volume. On the other hand, some widely-used commercial porous carbons (namely, F400 and Maxsorb) provide markedly lower storage capacities at 100 bar, at 166 and 210
v/
v, respectively [
8].


