New Perspective on Wood Thermal Modification: Relevance between the Evolution of Chemical Structure and Physical-Mechanical Properties, and Online Analysis of Release of VOCs

 and
and
Abstract
:1. Introduction
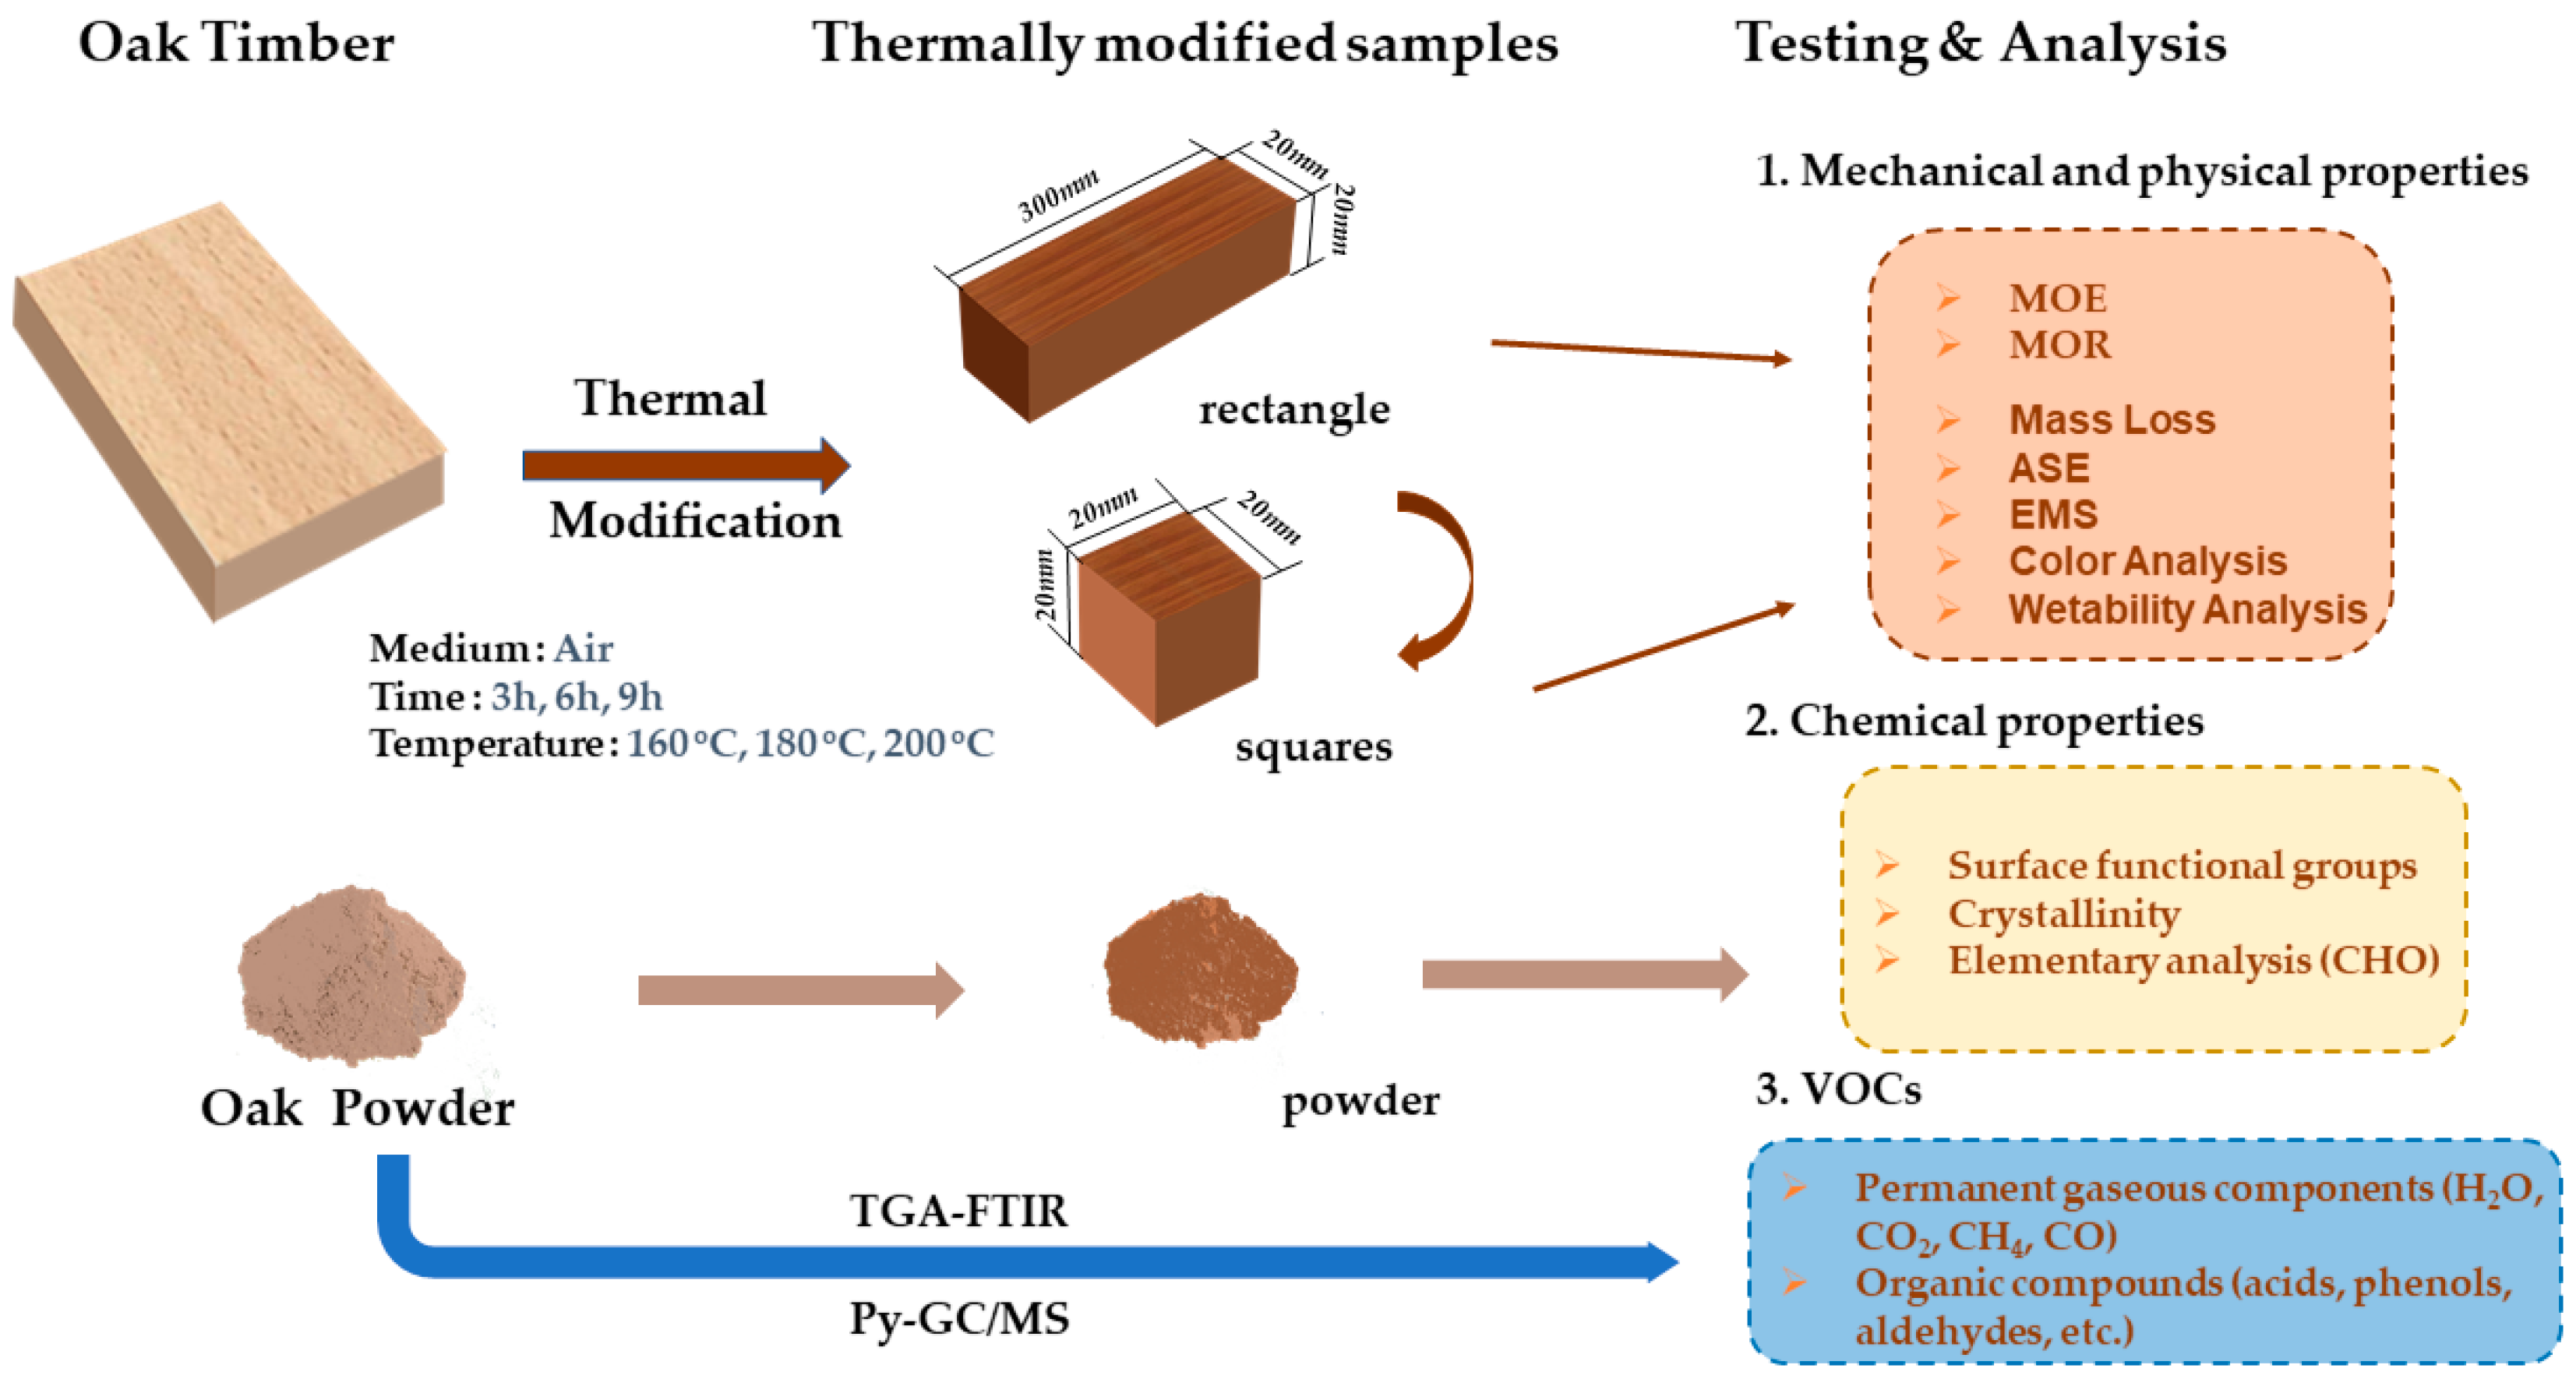
2. Materials and Methods
2.1. Materials
2.2. Thermal Modification Experiment
2.2.1. Mechanical and Physical Properties
2.2.2. Color Analysis
2.2.3. Chemical Properties
2.3. Online Analysis of VOCs by Using TGA-FTIR and Py-GC/MS
2.3.1. TGA-FTIR Analysis
2.3.2. Py–GC/MS Analysis
3. Results and Discussion
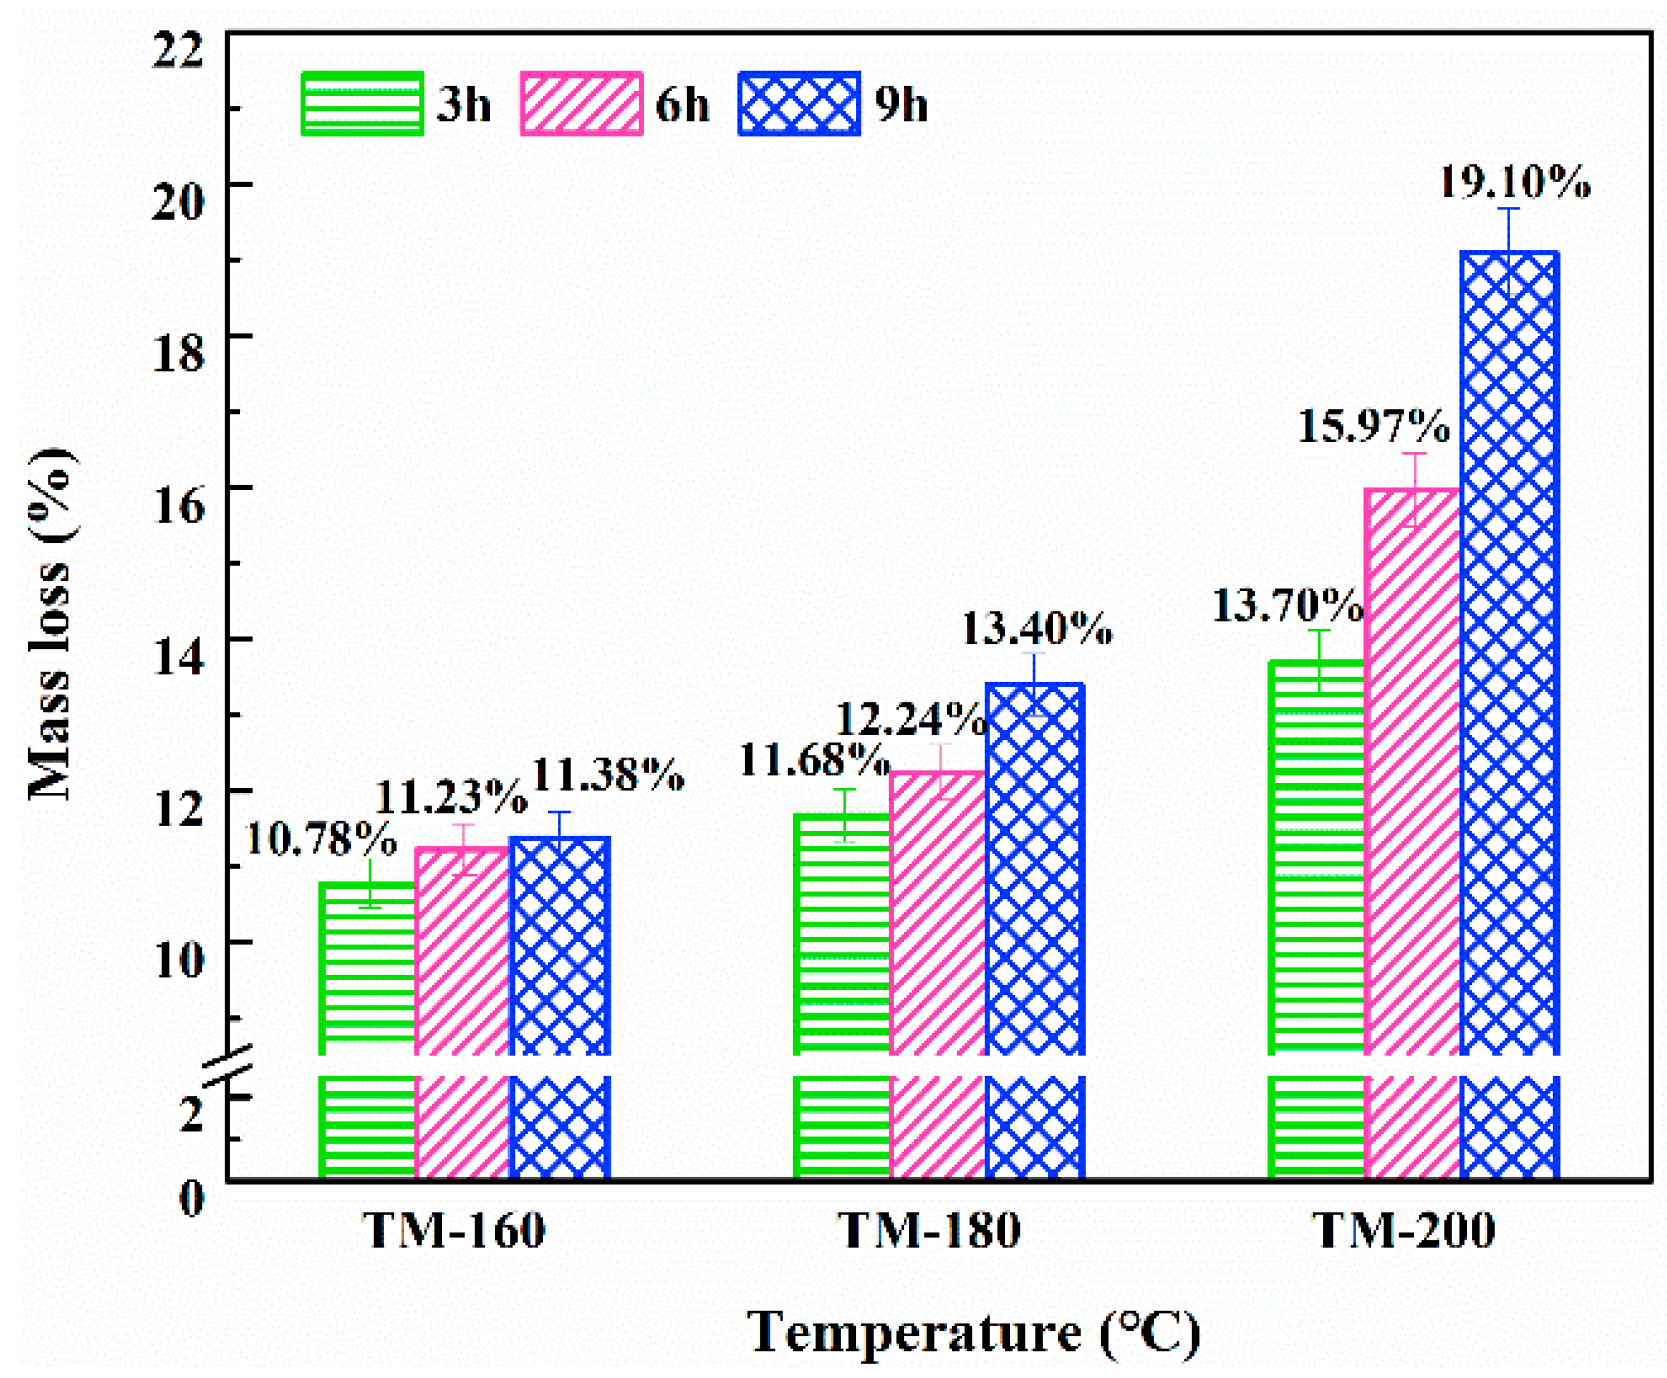
3.1. Mass Loss
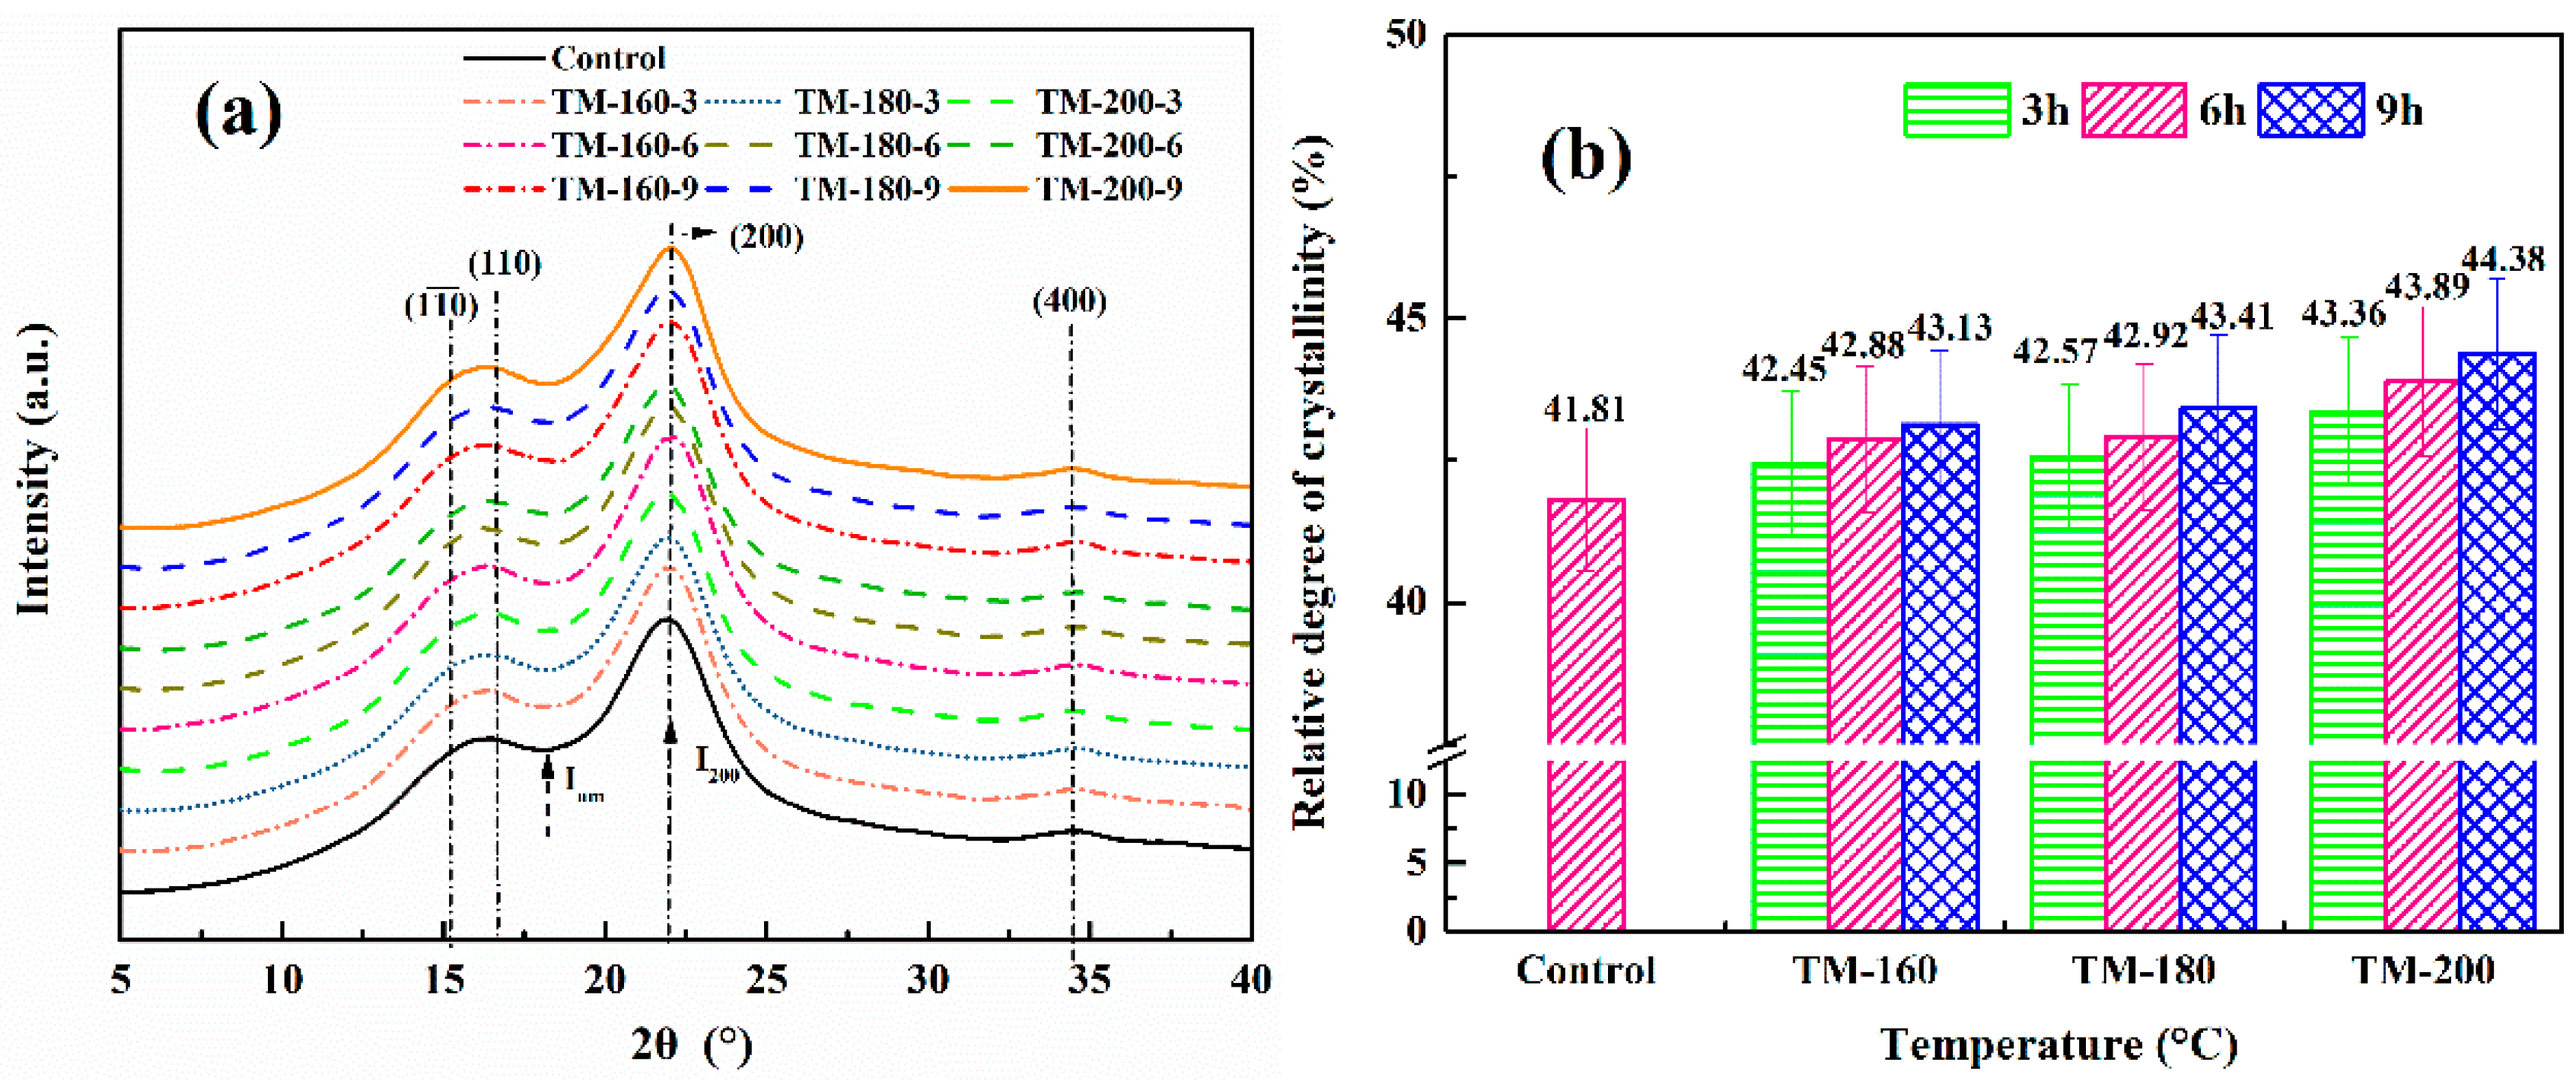
3.2. XRD Analysis
3.3. FTIR Analysis
3.4. Ultimate Analysis
3.5. Contact Angles
3.6. EMC and ASE
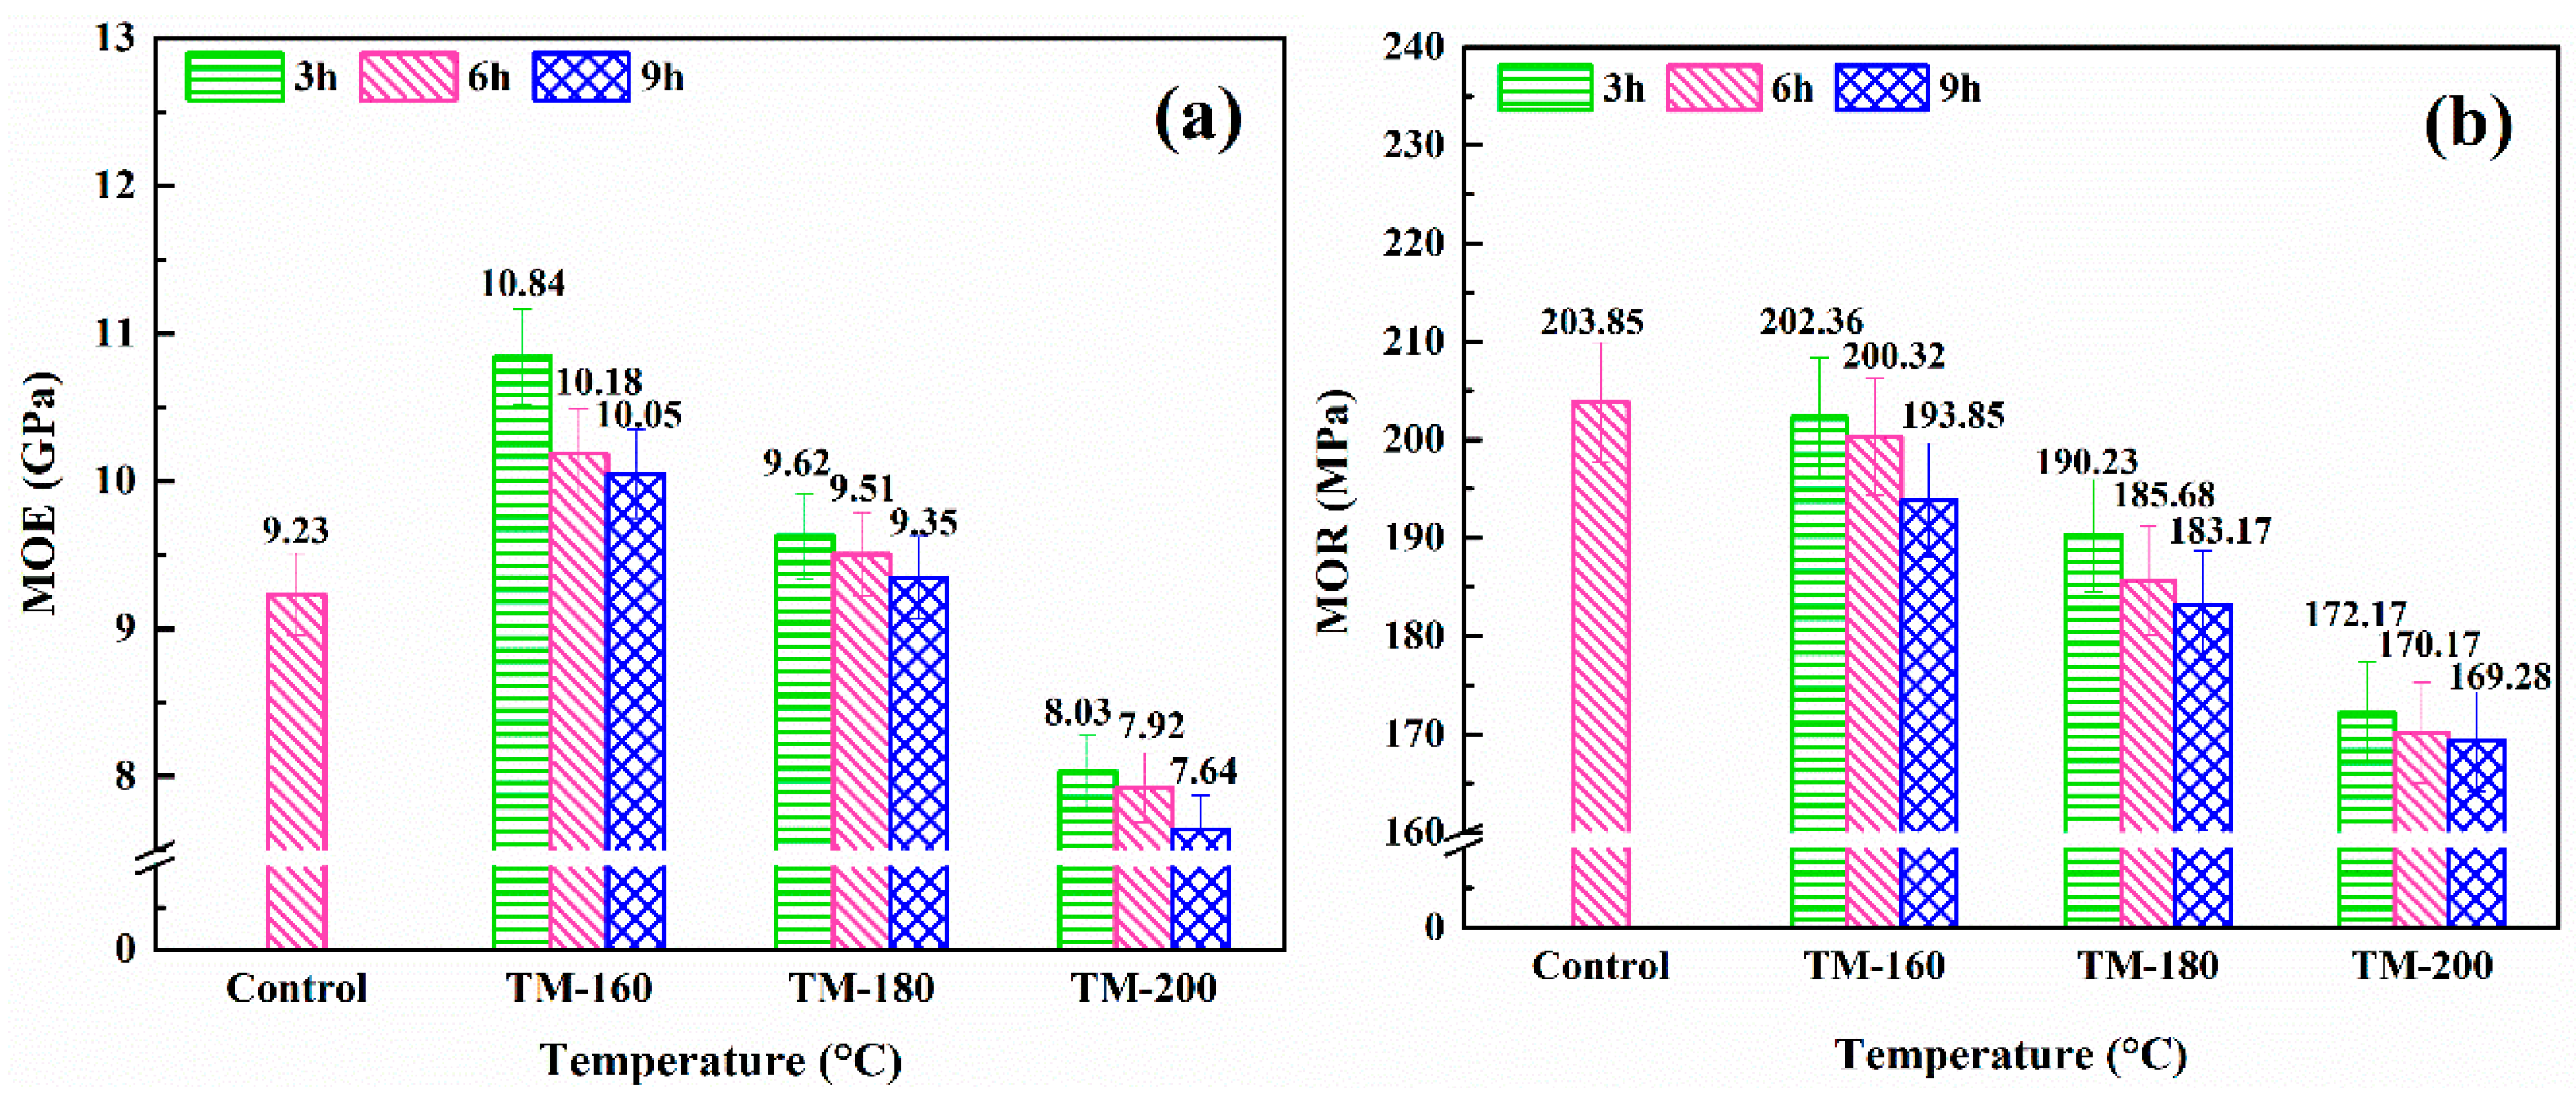
3.7. MOR and MOE
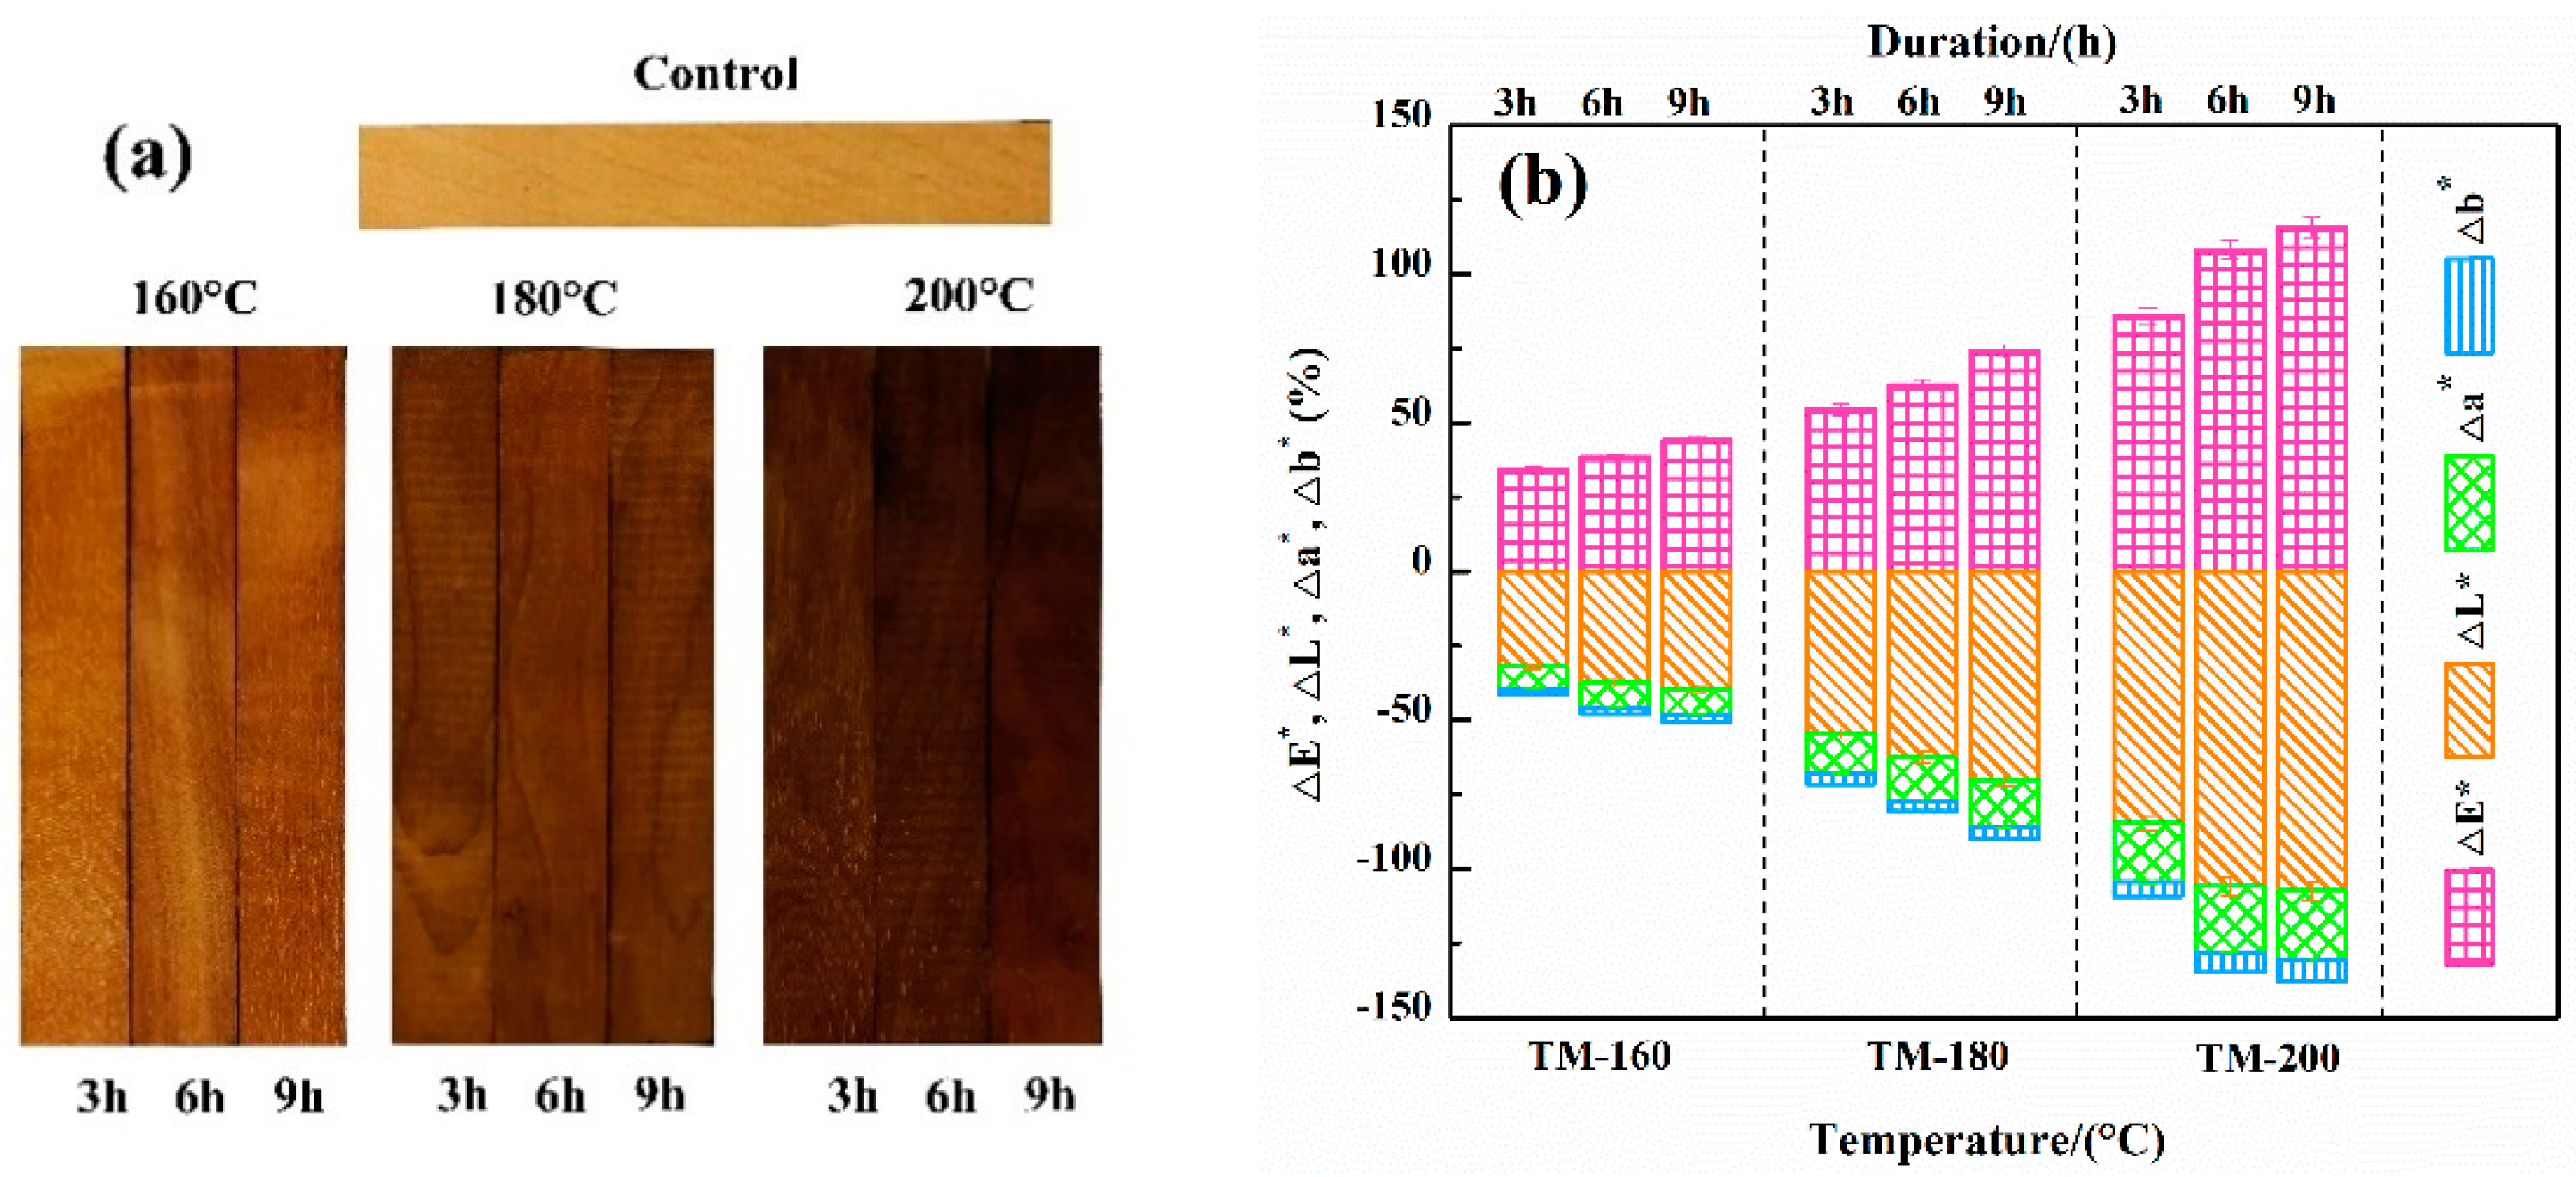
3.8. Color Analysis
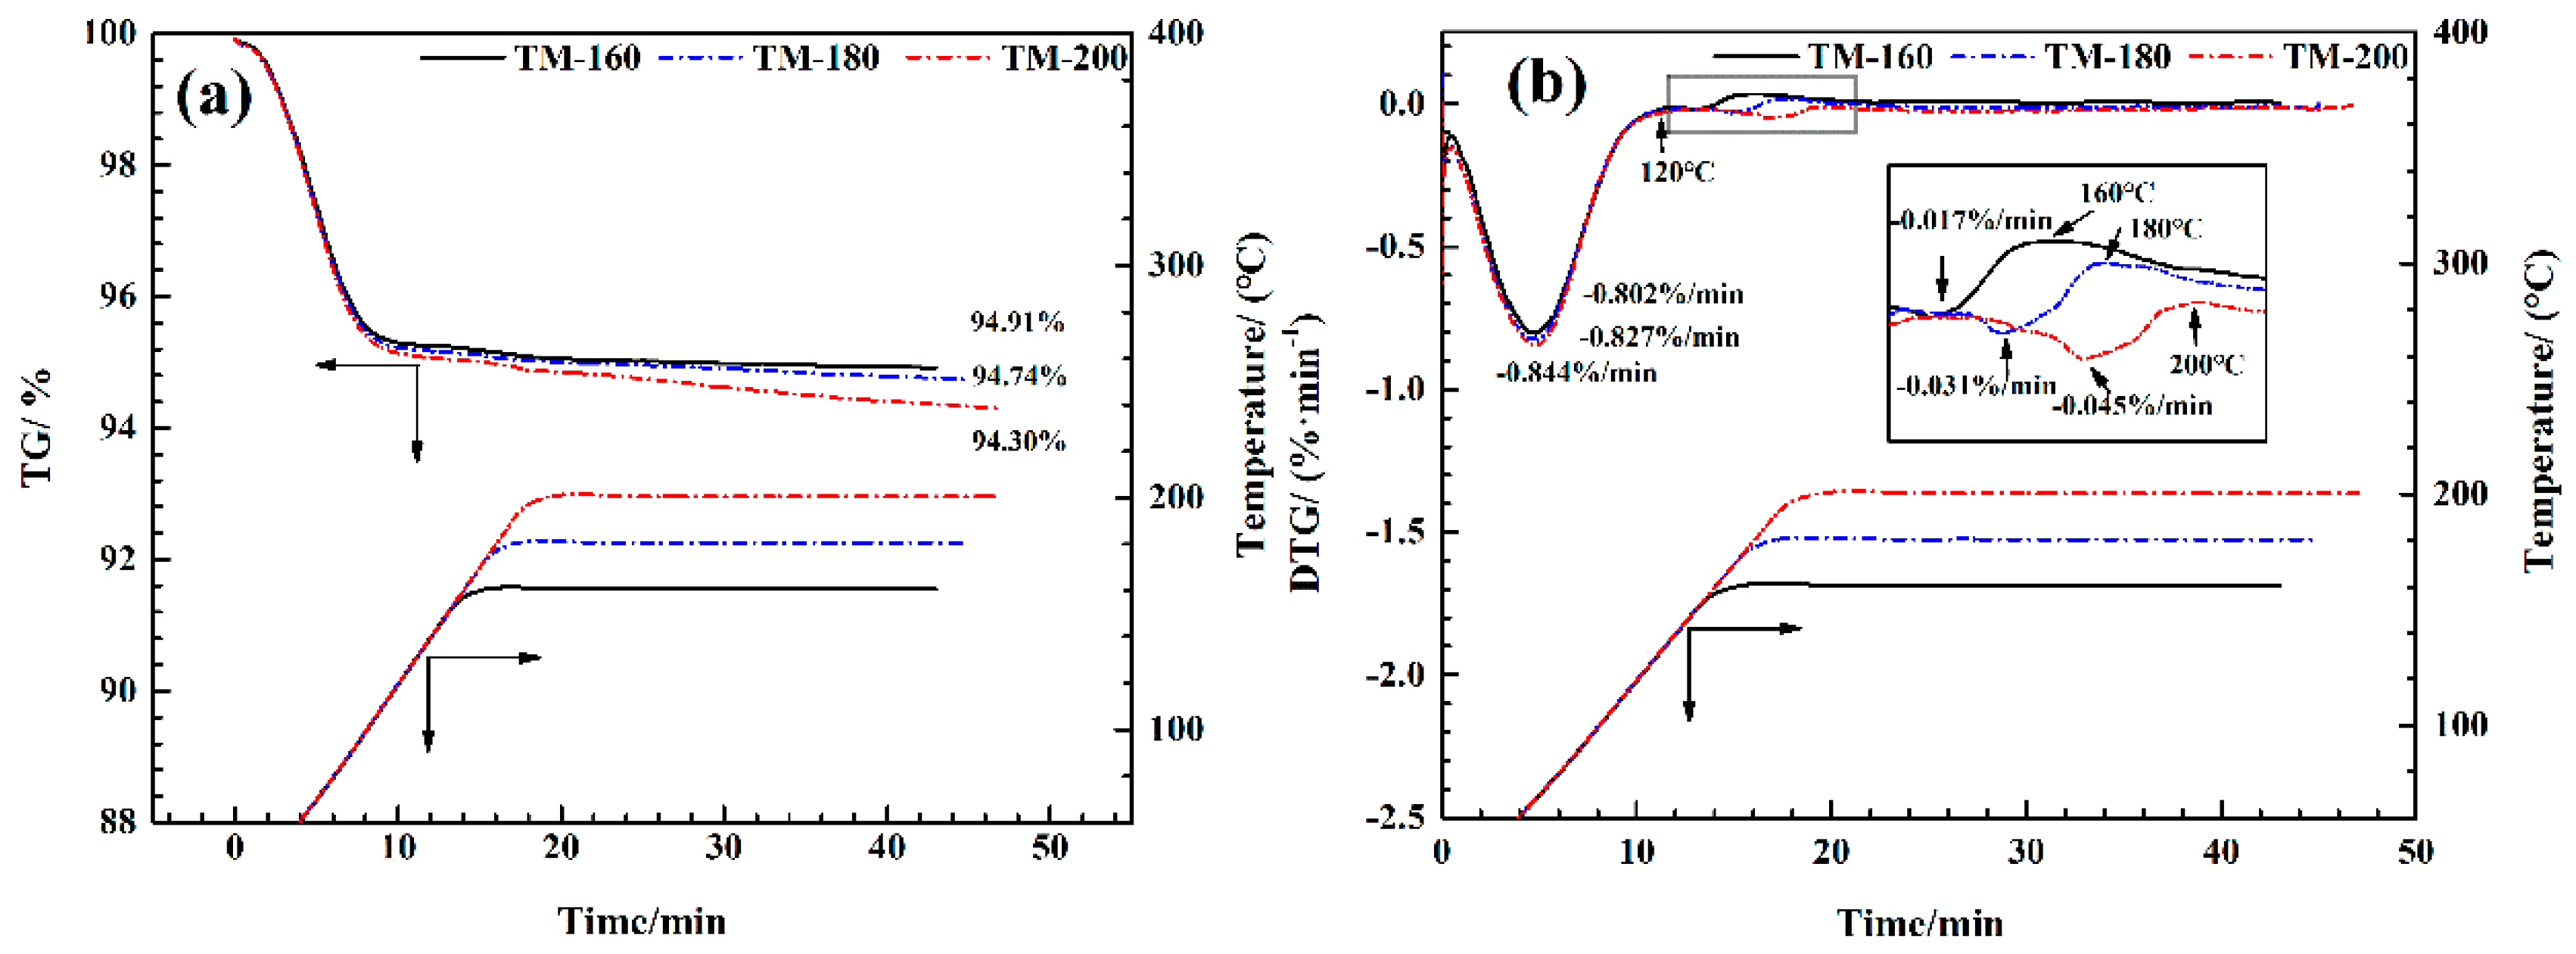
3.9. TG-FTIR Analysis
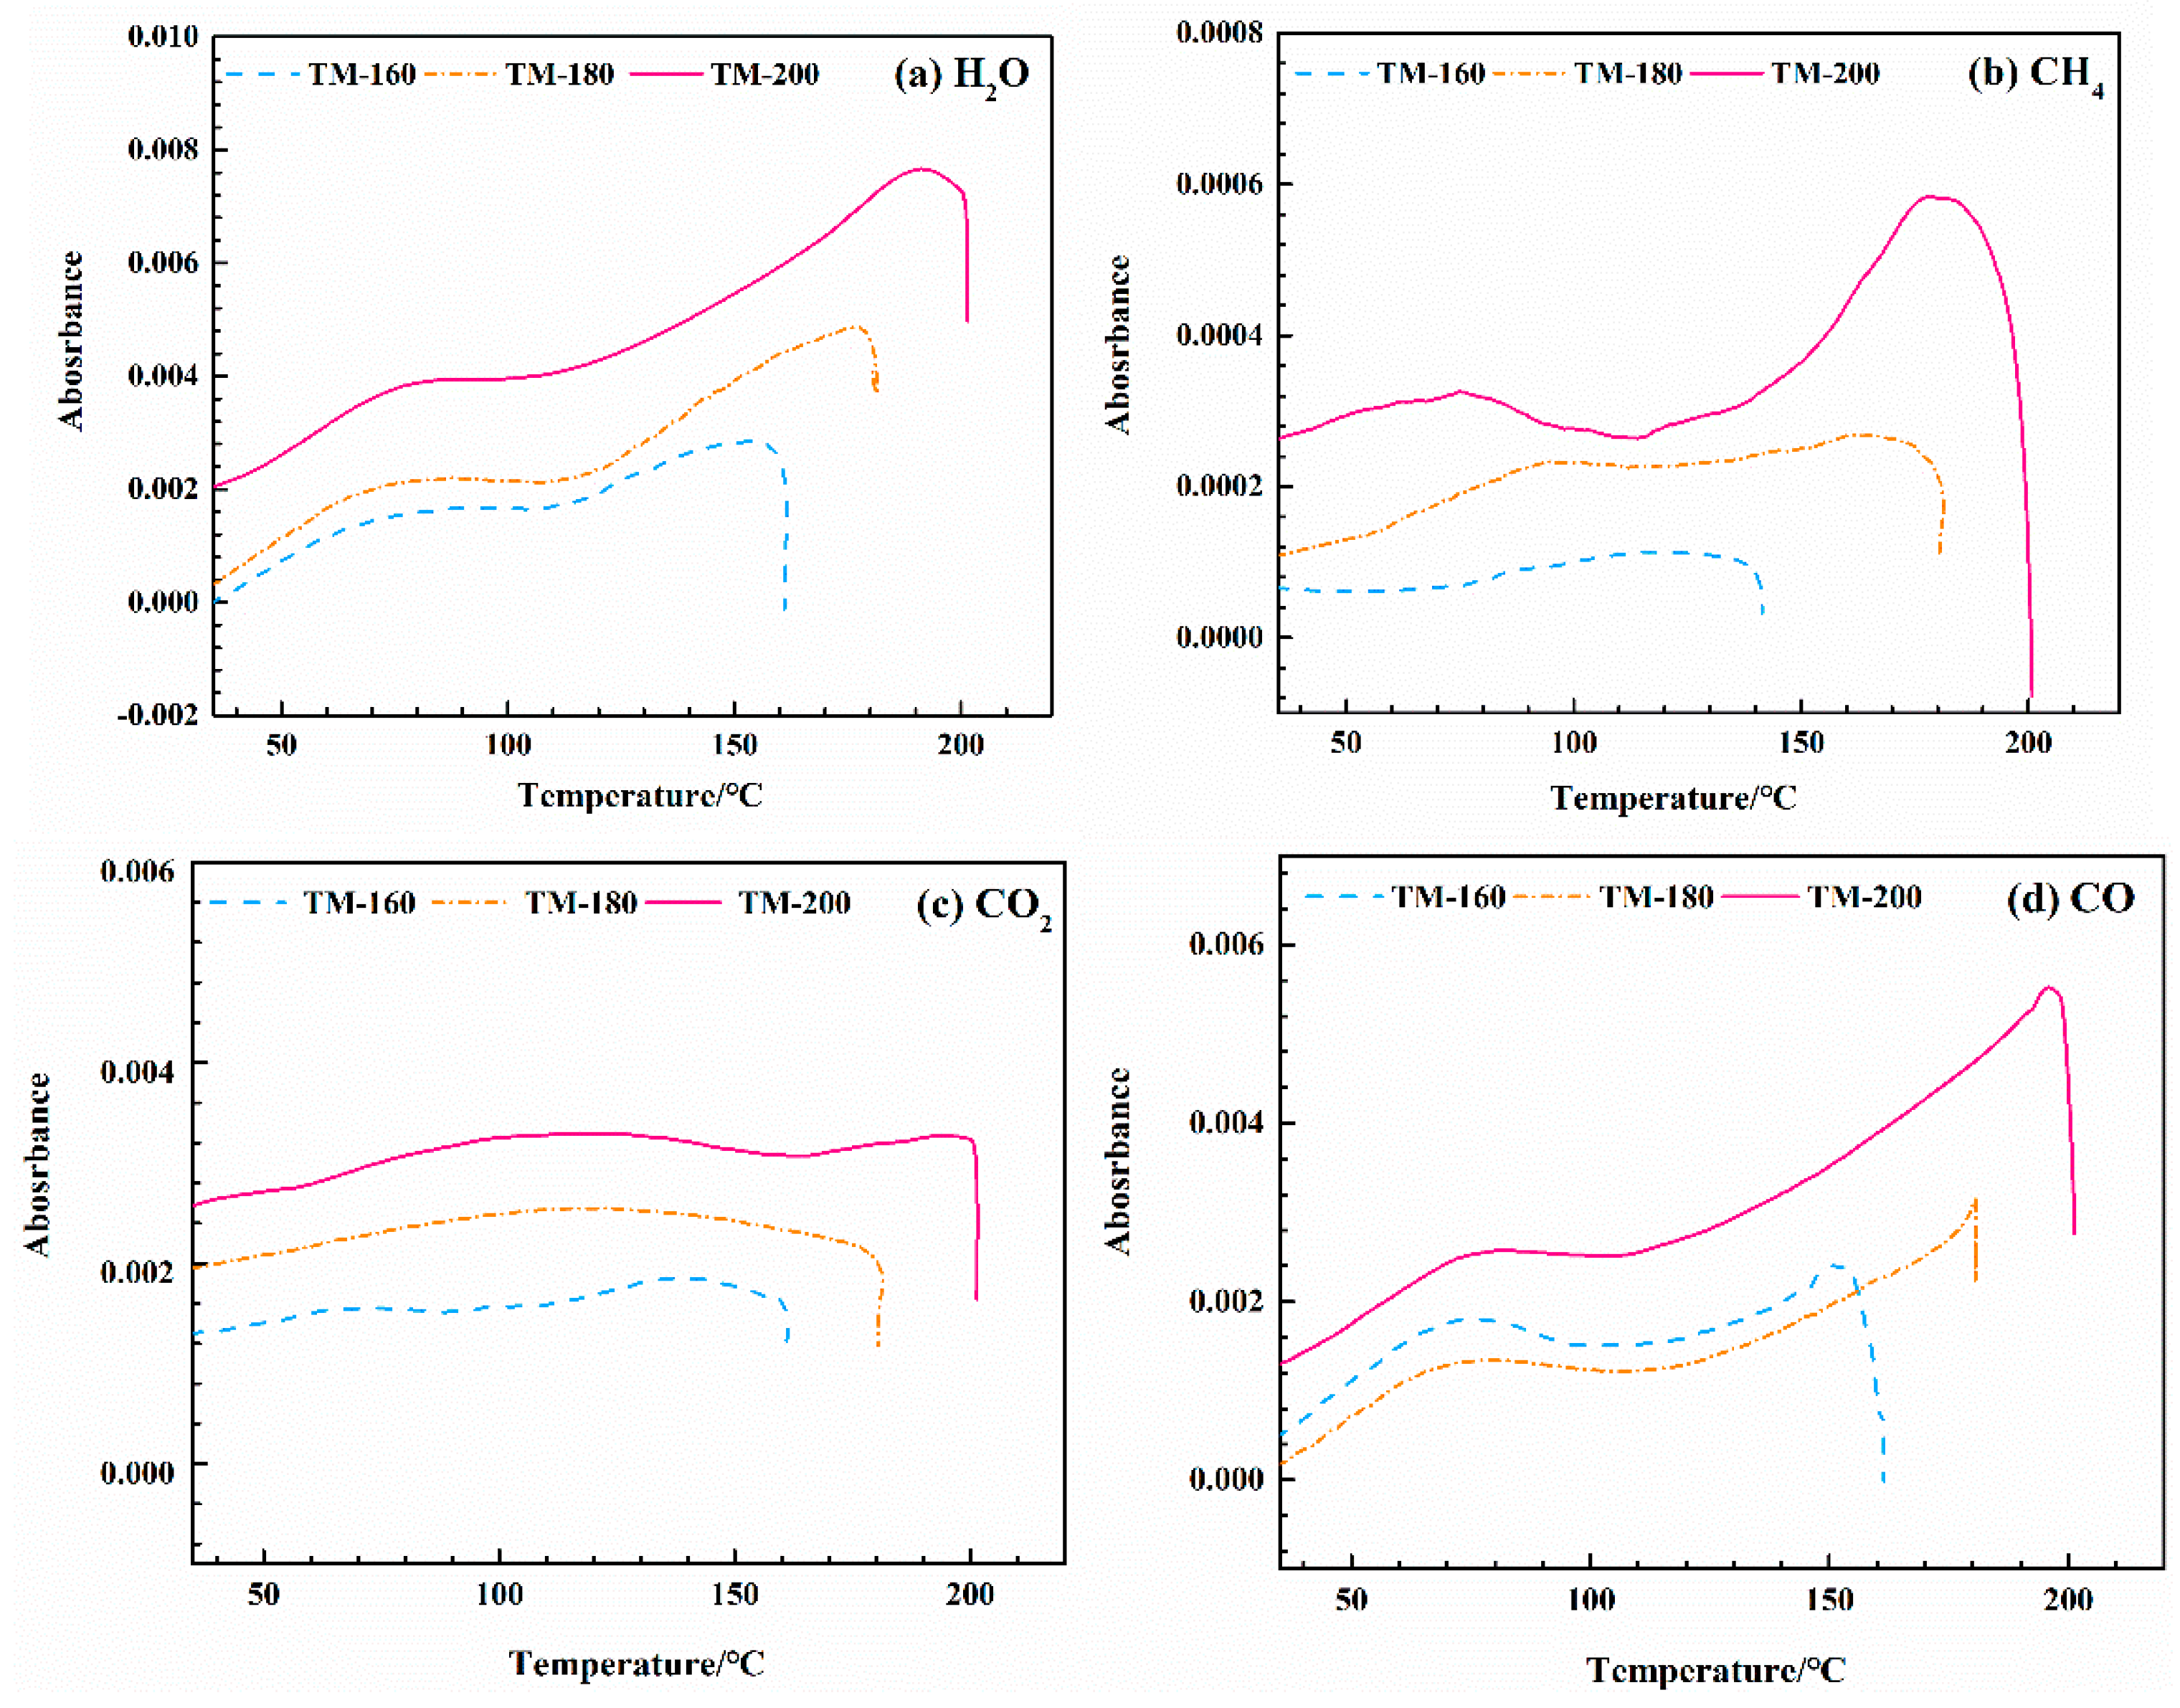
3.10. 3D−FTIR Analysis
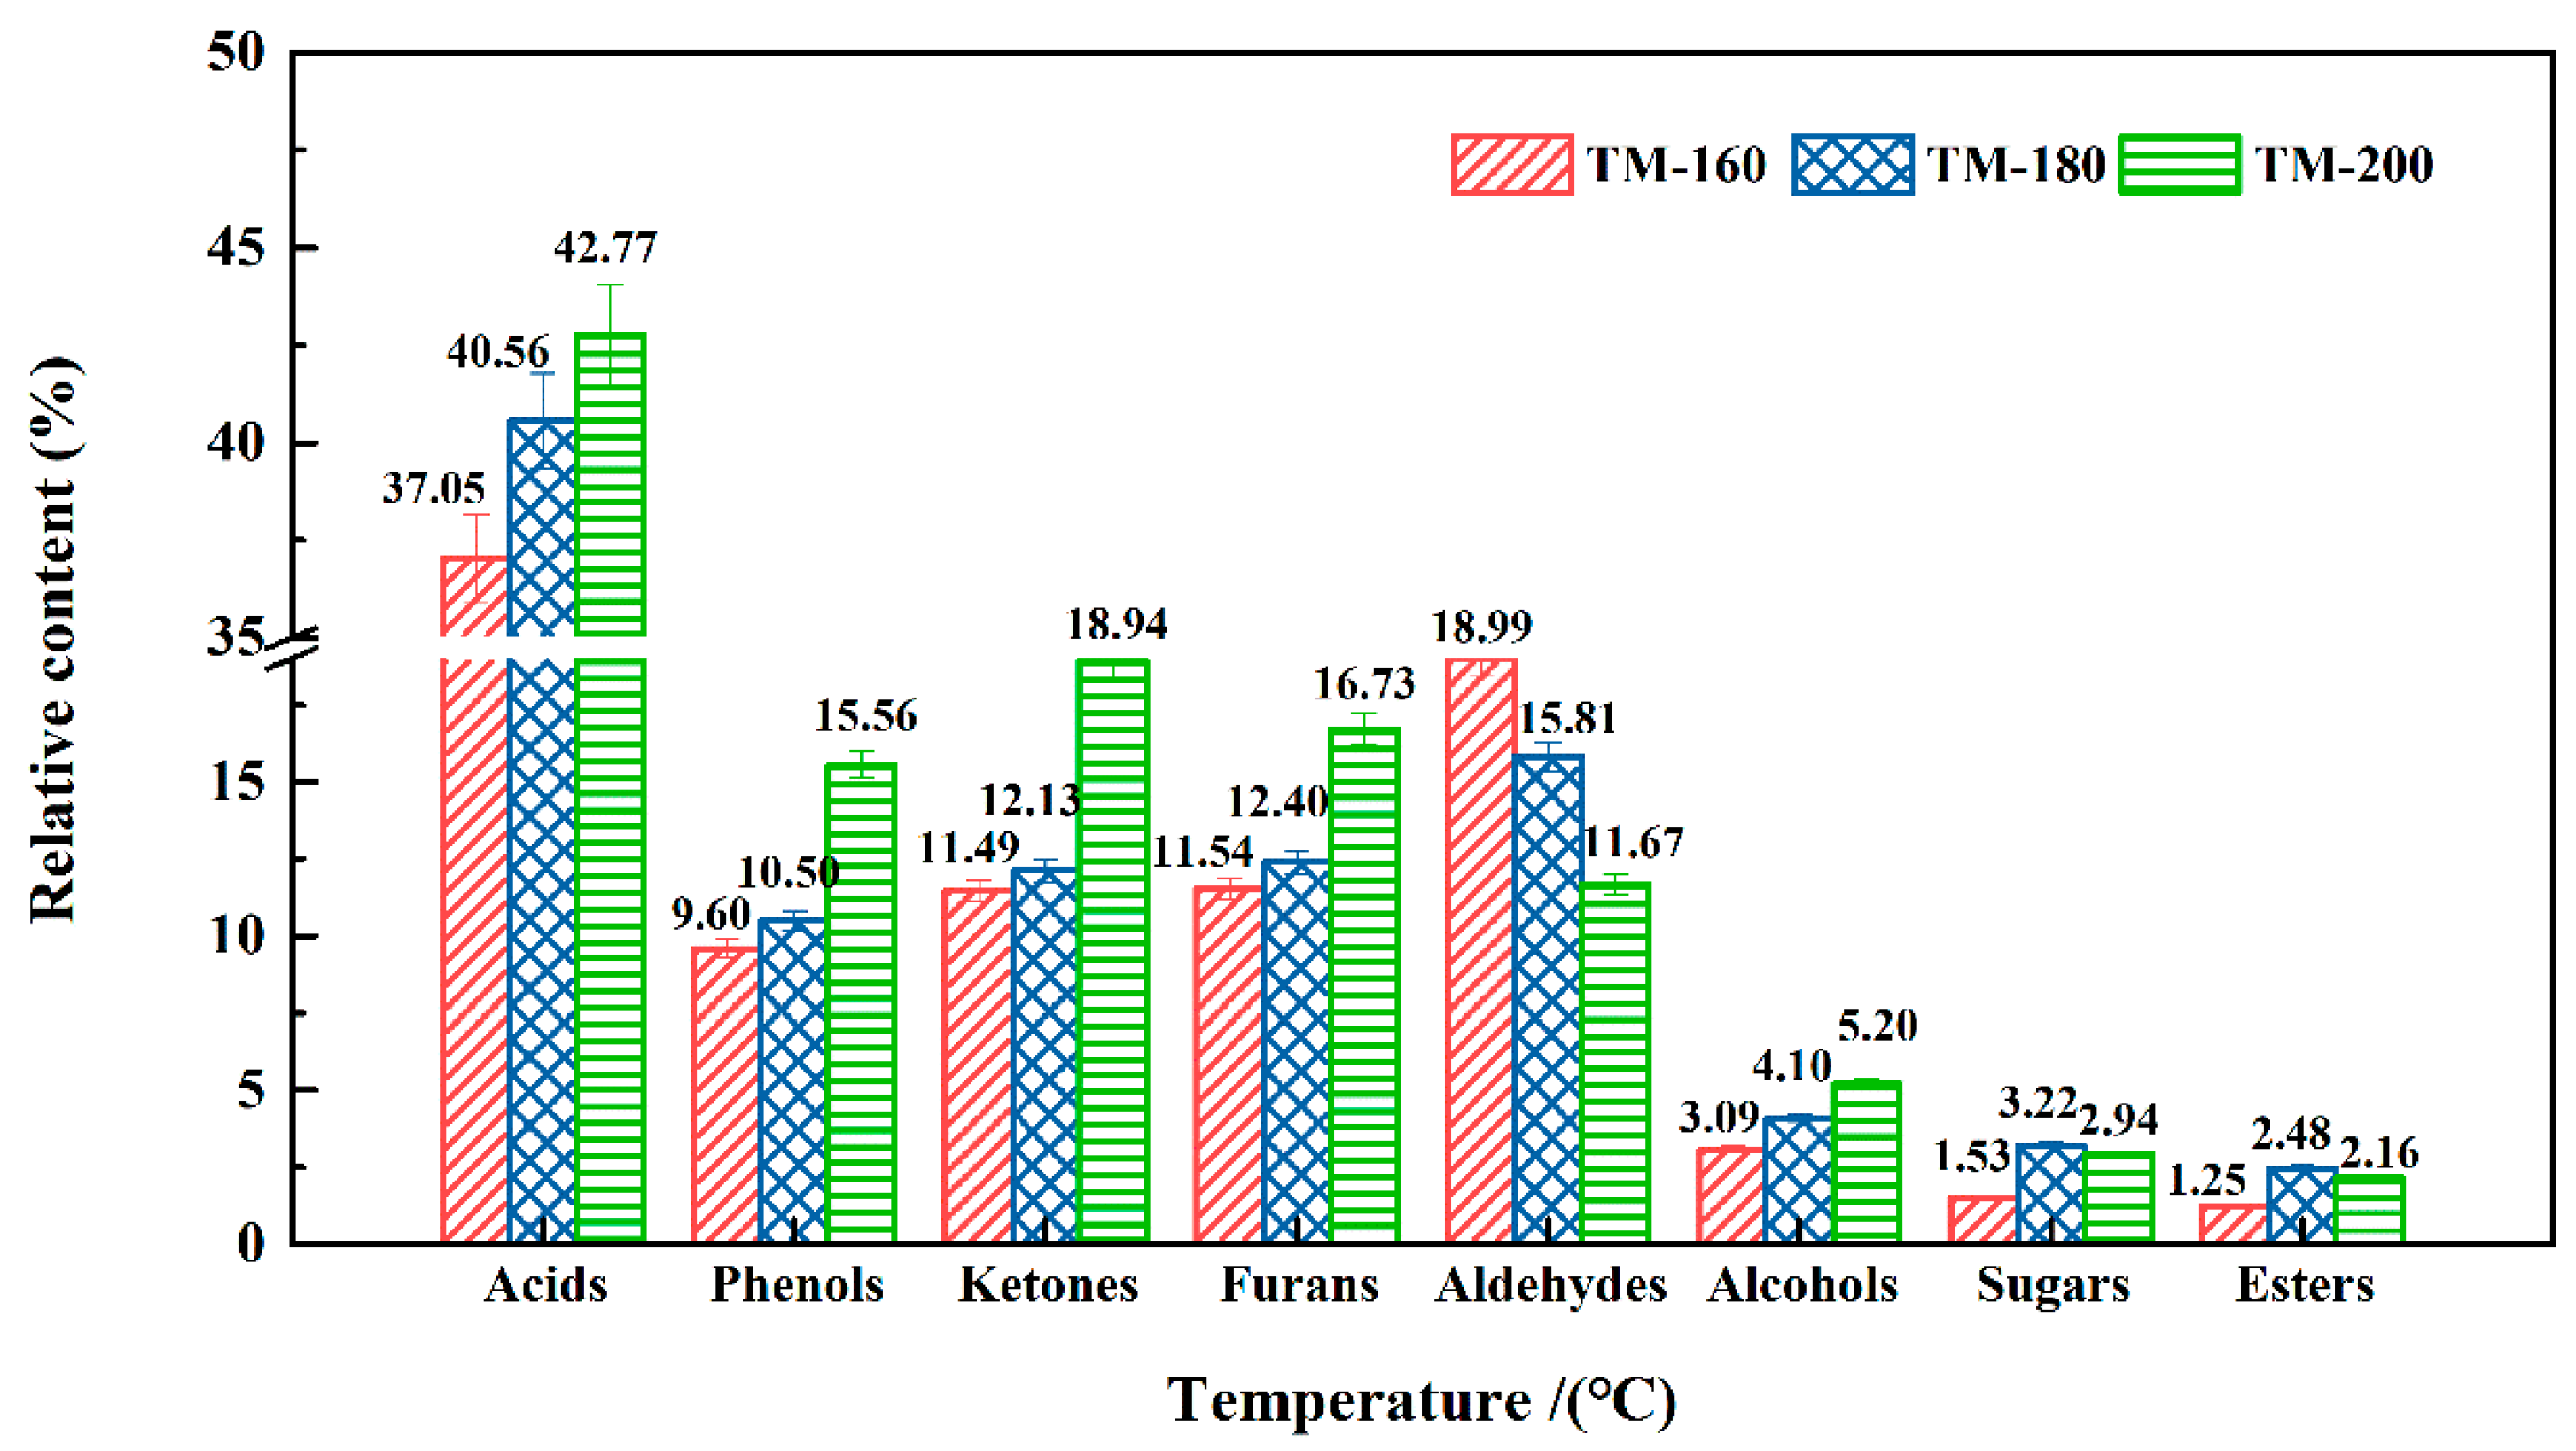
3.11. VOCs Analysis by PY-GC/MS
4. Conclusions
Supplementary Materials
Author Contributions
Funding
Conflicts of Interest
References
- Mahlberg, R.; Paajanen, L.; Nurmi, A.; Kivistö, A.; Koskela, K.; Rowell, R.M. Effect of chemical modification of wood on the mechanical and adhesion properties of wood fiber/polypropylene fiber and polypropylene/veneer composites. Holz. Roh. Werkst. 2001, 59, 319–326. [Google Scholar] [CrossRef]
- Tomak, E.D.; Ustaomer, D.; Yildiz, S.; Pesman, E. Changes in surface and mechanical properties of heat treated wood during natural weathering. Measurement 2014, 53, 30–39. [Google Scholar] [CrossRef]
- Boonstra, M.J.; Tjeerdsma, B. Chemical analysis of heat treated softwoods. Holz. Roh. Werkst. 2006, 64, 204–211. [Google Scholar] [CrossRef]
- Sikora, A.; Kačík, F.; Gaff, M.; Vondrová, V.; Bubeníková, T.; Kubovský, I. Impact of thermal modification on color and chemical changes of spruce and oak wood. J. Wood Sci. 2018, 64, 406–416. [Google Scholar] [CrossRef]
- Okon, K.E.; Lin, F.; Chen, Y.; Huang, B. Effect of silicone oil heat treatment on the chemical composition, cellulose crystalline structure and contact angle of chinese parasol wood. Carbohydr. Polym. 2017, 164, 179–185. [Google Scholar] [CrossRef] [PubMed]
- Hill, C.A.S.; Abdul Khalil, H.P.S. Effect of fiber treatments on mechanical properties of coir or oil palm fiber reinforced polyester composites. J. Appl. Polym. Sci. 2000, 78, 1685–1697. [Google Scholar] [CrossRef]
- Hakkou, M.; Pétrissans, M.; Gérardin, P.; Zoulalian, A. Investigations of the reasons for fungal durability of heat-treated beech wood. Polym. Degrad. Stabil. 2006, 91, 393–397. [Google Scholar] [CrossRef]
- Hamada, J.; Pétrissans, A.; Mothe, F.; Ruelle, J.; Pétrissans, M.; Gérardin, P. Intraspecific variation of european oak wood thermal stability according to radial position. Wood Sci. Technol. 2017, 51, 785–794. [Google Scholar] [CrossRef]
- Tjeerdsma, B.F.; Militz, H. Chemical changes in hydrothermal treated wood: Ftir analysis of combined hydrothermal and dry heat-treated wood. Holz. Roh. Werkst. 2005, 63, 102–111. [Google Scholar] [CrossRef]
- Hill, C.A.S.; Ramsay, J.; Gardiner, B. Variability in water vapour sorption isotherm in japanese larch (larix kaempferi lamb.) – earlywood and latewood influences. Inter. Wood Prod. J. 2015, 6, 53–59. [Google Scholar] [CrossRef]
- Rautkari, L.; Honkanen, J.; Hill, C.A.S.; Ridley-Ellis, D.; Hughes, M. Mechanical and physical properties of thermally modified scots pine wood in high pressure reactor under saturated steam at 120, 150 and 180 °C. Eur. J. Wood Prod. 2014, 72, 33–41. [Google Scholar] [CrossRef]
- Rowell, R.M.; Ibach, R.E.; McSweeny, J.; Nilsson, T. Understanding decay resistance, dimensional stability and strength changes in heat-treated and acetylated wood. Wood Mater. Sci. Eng. 2009, 4, 14–22. [Google Scholar] [CrossRef]
- Hill, C.A.S. Wood modification: Chemical, thermal and other processes. In Wood modification; Stevens, C.V., Ed.; John Wiley & Sons: Hoboken, NJ, USA, 2006; Volume 5, pp. 99–127. [Google Scholar]
- Esteves, B.; Domingos, I.; Pereira, H. Improvement of technological quality of eucalypt wood by heat treatment in air at 170–200 °C. For. Prod. J. 2007, 57, 47–52. [Google Scholar]
- Bal, B.C.; Bektaş, İ. The effects of heat treatment on some mechanical properties of juvenile wood and mature wood of eucalyptus grandis. Dry Technol. 2013, 31, 479–485. [Google Scholar] [CrossRef]
- Candelier, K.; Dumarçay, S.; Pétrissans, A.; Gérardin, P.; Pétrissans, M. Comparison of mechanical properties of heat treated beech wood cured under nitrogen or vacuum. Polym. Degrad. Stabil. 2013, 98, 1762–1765. [Google Scholar] [CrossRef]
- Lin, B.-J.; Colin, B.; Chen, W.-H.; Pétrissans, A.; Rousset, P.; Pétrissans, M. Thermal degradation and compositional changes of wood treated in a semi-industrial scale reactor in vacuum. J. Anal. Appl. Pyrol. 2018, 130, 8–18. [Google Scholar] [CrossRef]
- Jensen, L.K.; Larsen, A.; M⊘lhave, L.; Hansen, M.K.; Knudsen, B. Health evaluation of volatile organic compound (voc) emissions from wood and wood-based materials. Arch. Environ. Health 2001, 56, 419–432. [Google Scholar] [CrossRef] [PubMed]
- Risholmsundman, M.; Lundgren, M.; Vestin, E.; Herder, P. Emissions of acetic acid and other volatile organic compounds from different species of solid wood. Holz. Roh. Werkst. 1998, 56, 125–129. [Google Scholar] [CrossRef]
- Makowski, M.; Ohlmeyer, M.; Meier, D. Long-term development of voc emissions from osb after hot-pressing. Holzforschung 2005, 59, 519. [Google Scholar] [CrossRef]
- Liu, Y.; Shen, J.; Zhu, X.-D. Influence of processing parameters on voc emission from particleboards. Environ. Monit. Assess. 2010, 171, 249–254. [Google Scholar] [CrossRef]
- Kačík, F.; Veľková, V.; Šmíra, P.; Nasswettrová, A.; Kačíková, D.; Reinprecht, L. Release of terpenes from fir wood during its long-term use and in thermal treatment. Molecules 2012, 17, 9990–9999. [Google Scholar] [CrossRef] [PubMed]
- Manninen, A.M.; Pasanen, P.; Holopainen, J.K. Comparing the voc emissions between air-dried and heat-treated scots pine wood. Atmos. Environ. 2002, 36, 1763–1768. [Google Scholar] [CrossRef]
- Hyttinen, M.; Masalinweijo, M.; Kalliokoski, P.; Pasanen, P. Comparison of voc emissions between air-dried and heat-treated norway spruce (picea abies), scots pine (pinus sylvesteris) and european aspen (populus tremula) wood. Atmos. Environ. 2010, 44, 5028–5033. [Google Scholar] [CrossRef]
- Chen, D.; Gao, A.; Cen, K.; Zhang, J.; Cao, X.; Ma, Z. Investigation of biomass torrefaction based on three major components: Hemicellulose, cellulose, and lignin. Energ. Convers. Manage. 2018, 169, 228–237. [Google Scholar] [CrossRef]
- Ma, Z.; Sun, Q.; Ye, J.; Yao, Q.; Chao, Z. Study on the thermal degradation behaviors and kinetics of alkali lignin for production of phenolic-rich bio-oil using tga–ftir and py–gc/ms. J. Anal. Appl. Pyrol. 2016, 117, 116–124. [Google Scholar] [CrossRef]
- Zhang, Y.; Ma, Z.; Zhang, Q.; Wang, J.; Ma, Q.; Yang, Y.; Luo, X.; Zhang, W. Comparison of the physicochemical characteristics of bio-char pyrolyzed from moso bamboo and rice husk with different pyrolysis temperatures. BioResources 2017, 12, 4652–4669. [Google Scholar] [CrossRef]
- Ma, Z.; Chen, D.; Jie, G.; Bao, B.; Zhang, Q.; Ma, Z.; Chen, D.; Jie, G.; Bao, B.; Zhang, Q. Determination of pyrolysis characteristics and kinetics of palm kernel shell using tga–ftir and model-free integral methods. Energ. Convers. Manage. 2015, 89, 251–259. [Google Scholar] [CrossRef]
- Chen, D.; Gao, A.; Ma, Z.; Fei, D.; Chang, Y.; Shen, C. In-depth study of rice husk torrefaction: Characterization of solid, liquid and gaseous products, oxygen migration and energy yield. Bioresour. Technol. 2018, 253, 148–153. [Google Scholar] [CrossRef]
- Chen, D.; Mei, J.; Li, H.; Li, Y.; Lu, M.; Ma, T.; Ma, Z. Combined pretreatment with torrefaction and washing using torrefaction liquid products to yield upgraded biomass and pyrolysis products. Bioresour. Technol. 2017, 228, 62–68. [Google Scholar] [CrossRef]
- Ma, Z.; Wang, J.; Zhou, H.; Zhang, Y.; Yang, Y.; Liu, X.; Ye, J.; Chen, D.; Wang, S. Relationship of thermal degradation behavior and chemical structure of lignin isolated from palm kernel shell under different process severities. Fuel Process Technol. 2018, 181, 142–156. [Google Scholar] [CrossRef]
- Chen, D.; Cen, K.; Jing, X.; Gao, J.; Li, C.; Ma, Z. An approach for upgrading biomass and pyrolysis product quality using a combination of aqueous phase bio-oil washing and torrefaction pretreatment. Bioresour. Technol. 2017, 233, 150–158. [Google Scholar] [CrossRef] [PubMed]
- Ma, Z.; Yang, Y.; Ma, Q.; Zhou, H.; Luo, X.; Liu, X.; Wang, S. Evolution of the chemical composition, functional group, pore structure and crystallographic structure of bio-char from palm kernel shell pyrolysis under different temperatures. J. Anal. Appl. Pyrol. 2017, 127, 350–359. [Google Scholar] [CrossRef]
- Qiang, L.; Yang, X.C.; Dong, C.Q.; Zhang, Z.F.; Zhang, X.M.; Zhu, X.F. Influence of pyrolysis temperature and time on the cellulose fast pyrolysis products: Analytical py-gc/ms study. J. Anal. Appl. Pyrol. 2011, 92, 430–438. [Google Scholar]
- Shen, D.K.; Gu, S.; Bridgwater, A.V. Study on the pyrolytic behaviour of xylan-based hemicellulose using tg–ftir and py–gc–ftir. J. Anal. Appl. Pyrol. 2010, 87, 199–206. [Google Scholar] [CrossRef]
- Wang, S.; Ru, B.; Dai, G.; Sun, W.; Qiu, K.; Zhou, J. Pyrolysis mechanism study of minimally damaged hemicellulose polymers isolated from agricultural waste straw samples. Bioresour. Technol. 2015, 190, 211–218. [Google Scholar] [CrossRef] [PubMed]
- Ma, Z.; Wang, J.; Li, C.; Yang, Y.; Liu, X.; Zhao, C.; Chen, D. New sight on the lignin torrefaction pretreatment: Relevance between the evolution of chemical structure and the properties of torrefied gaseous, liquid, and solid products. Bioresour. Technol. 2019, 288, 121528. [Google Scholar] [CrossRef] [PubMed]
- Segal, L.; Creely, J., Jr.; Martin, A.E.J.; Conrad, C. An empirical method for estimating the degree of crystallinity of native cellulose using the x-ray diffractometer. Text Res. J. 1959, 29, 786–794. [Google Scholar] [CrossRef]
- Ma, Z.; Wang, J.; Yang, Y.; Zhang, Y.; Zhao, C.; Yu, Y.; Wang, S. Comparison of the thermal degradation behaviors and kinetics of palm oil waste under nitrogen and air atmosphere in tga-ftir with a complementary use of model-free and model-fitting approaches. J. Anal. Appl. Pyrol. 2018, 134, 12–24. [Google Scholar] [CrossRef]
- Cen, K.; Zhang, J.; Ma, Z.; Chen, D.; Zhou, J.; Ma, H. Investigation of the relevance between biomass pyrolysis polygeneration and washing pretreatment under different severities: Water, dilute acid solution and aqueous phase bio-oil. Bioresour. Technol. 2019, 278, 26–33. [Google Scholar] [CrossRef]
- Srinivas, K.; Pandey, K.K. Effect of heat treatment on color changes, dimensional stability, and mechanical properties of wood. J. Wood Chem. Technol. 2012, 32, 304–316. [Google Scholar] [CrossRef]
- Wang, X.; Chen, X.; Xie, X.; Wu, Y.; Zhao, L.; Li, Y.; Wang, S. Effects of thermal modification on the physical, chemical and micromechanical properties of masson pine wood (pinus massoniana lamb.). Holzforschung 2018, 72, 1063. [Google Scholar] [CrossRef]
- Ma, Z.; Yang, Y.; Wu, Y.; Xu, J.; Peng, H.; Liu, X.; Zhang, W.; Wang, S. In-depth comparison of the physicochemical characteristics of bio-char derived from biomass pseudo components: Hemicellulose, cellulose, and lignin. J. Anal. Appl. Pyrol. 2019, 140, 195–204. [Google Scholar] [CrossRef]
- Yin, J.; Yuan, T.; Lu, Y.; Song, K.; Li, H.; Zhao, G.; Yin, Y. Effect of compression combined with steam treatment on the porosity, chemical compositon and cellulose crystalline structure of wood cell walls. Carbohyd. Polym. 2017, 155, 163–172. [Google Scholar] [CrossRef] [PubMed]
- Akgül, M.; Gümüşkaya, E.; Korkut, S. Crystalline structure of heat-treated scots pine (pinus sylvestris l.) and uludag fir [abies nordmanniana (stev.) subsp. Bornmuelleriana (mattf.)] wood. Wood Sci. Technol. 2007, 41, 281–289. [Google Scholar] [CrossRef]
- Bhuiyan, M.T.R.; Hirai, N.; Sobue, N. Changes of crystallinity in wood cellulose by heat treatment under dried and moist conditions. J. Wood Sci. 2000, 46, 431–436. [Google Scholar] [CrossRef]
- Esteves, B.; Marques, A.V.; Domingos, I.; Pereira, H. Chemical changes of heat treated pine and eucalypt wood monitored by ftir. Maderas. Cienc. y Tecnol. 2013, 15, 245–258. [Google Scholar] [CrossRef]
- González-Peña, M.M.; Curling, S.F.; Hale, M.D.C. On the effect of heat on the chemical composition and dimensions of thermally-modified wood. Polym. Degrad. Stabil. 2009, 94, 2184–2193. [Google Scholar] [CrossRef]
- Popescu, M.-C.; Froidevaux, J.; Navi, P.; Popescu, C.-M. Structural modifications of tilia cordata wood during heat treatment investigated by ft-ir and 2d ir correlation spectroscopy. J. Mol. Struct. 2013, 1033, 176–186. [Google Scholar] [CrossRef]
- Yang, H.; Rong, Y.; Chen, H.; Dong, H.L.; Zheng, C. Characteristics of hemicellulose, cellulose and lignin pyrolysis. Fuel 2007, 86, 1781–1788. [Google Scholar] [CrossRef]
- Tjeerdsma, B.F.; Boonstra, M.; Pizzi, A.; Tekely, P.; Militz, H. Characterisation of thermally modified wood: Molecular reasons for wood performance improvement. Holz. Roh. Werkst. 1998, 56, 149–153. [Google Scholar] [CrossRef]
- Cademartori, P.H.G.; dos Santos, P.S.B.; Serrano, L.; Labidi, J.; Gatto, D.A. Effect of thermal treatment on physicochemical properties of gympie messmate wood. Ind. Crop Prod. 2013, 45, 360–366. [Google Scholar] [CrossRef]
- Gérardin, P.; Petrič, M.; Petrissans, M.; Lambert, J.; Ehrhrardt, J.J. Evolution of wood surface free energy after heat treatment. Polym. Degrad. Stabil. 2007, 92, 653–657. [Google Scholar] [CrossRef]
- Chaouch, M.; Dumarçay, S.; Pétrissans, A.; Pétrissans, M.; Gérardin, P. Effect of heat treatment intensity on some conferred properties of different european softwood and hardwood species. Wood Sci. Technol. 2013, 47, 663–673. [Google Scholar] [CrossRef]
- Huang, S.; Ma, Z.; Nie, Y.; Lu, F.; Ma, L. Comparative study of the performance of acetylated bamboo with different catalysts. Bioresources 2018, 14, 44–57. [Google Scholar]
- Bakar, B.F.; Hiziroglu, S.; Md Tahir, P. Properties of some thermally modified wood species. Mater. Des. 2013, 43, 348–355. [Google Scholar] [CrossRef]
- Lee, C.-H.; Yang, T.-H.; Cheng, Y.-W.; Lee, C.-J. Effects of thermal modification on the surface and chemical properties of moso bamboo. Constr. Build. Mater. 2018, 178, 59–71. [Google Scholar] [CrossRef]
- Kamdem, D.P.; Pizzi, A.; Jermannaud, A. Durability of heat-treated wood. Holz Roh Werkst 2002, 60, 1–6. [Google Scholar] [CrossRef]
- Ayrilmis, N.; Jarusombuti, S.; Fueangvivat, V.; Bauchongkol, P. Effect of thermal-treatment of wood fibres on properties of flat-pressed wood plastic composites. Polym. Degrad. Stabil. 2011, 96, 818–822. [Google Scholar] [CrossRef]
- Kačíková, D.; Kačík, F.; Čabalová, I.; Ďurkovič, J. Effects of thermal treatment on chemical, mechanical and colour traits in norway spruce wood. Bioresour. Technol. 2013, 144, 669–674. [Google Scholar] [CrossRef]
- Boonstra, M.J.; Acker, J.V.; Tjeerdsma, B.F.; Kegel, E.V. Strength properties of thermally modified softwoods and its relation to polymeric structural wood constituents. Ann. For. Sci. 2007, 64, 679–690. [Google Scholar] [CrossRef] [Green Version]
- Guo, F.; Huang, R.; Lu, J.; Chen, Z.; Cao, Y. Evaluating the effect of heat treating temperature and duration on selected wood properties using comprehensive cluster analysis. J. Wood Sci. 2014, 60, 255–262. [Google Scholar] [CrossRef]
- Yildiz, S.; Tomak, E.D.; Yildiz, U.C.; Ustaomer, D. Effect of artificial weathering on the properties of heat treated wood. Polym. Degrad. Stabil. 2013, 98, 1419–1427. [Google Scholar] [CrossRef]
- Gunduz, G.; Aydemir, D.; Karakas, G. The effects of thermal treatment on the mechanical properties of wild pear (pyrus elaeagnifolia pall.) wood and changes in physical properties. Mater. Des. 2009, 30, 4391–4395. [Google Scholar] [CrossRef]
- Sundqvist, B.; Karlsson, O.; Westermark, U. Determination of formic-acid and acetic acid concentrations formed during hydrothermal treatment of birch wood and its relation to colour, strength and hardness. Wood Sci. Technol. 2006, 40, 549–561. [Google Scholar] [CrossRef]
- Bekhta, P.; Niemz, P. Effect of high temperature on the change in color, dimensional stability and mechanical properties of spruce wood. Holzforschung 2003, 57, 539–546. [Google Scholar] [CrossRef]
- Chen, W.H.; Peng, J.; Bi, X.T. A state-of-the-art review of biomass torrefaction, densification and applications. Renew. Sustain. Energy Rev. 2015, 44, 847–866. [Google Scholar] [CrossRef]
- Wang, S.; Guo, X.; Wang, K.; Luo, Z. Influence of the interaction of components on the pyrolysis behavior of biomass. J. Anal. Appl. Pyrol. 2011, 91, 183–189. [Google Scholar] [CrossRef]
- Weiland, J.J.; Guyonnet, R. Study of chemical modifications and fungi degradation of thermally modified wood using drift spectroscopy. Holz. Roh. Werkst. 2003, 61, 216–220. [Google Scholar] [CrossRef]
- Banerjee, S.; Su, W.; Wild, M.P.; Otwell, L.P.; Hittmeier, M.E.; Nichols, K.M. Wet line extension reduces vocs from softwood drying. Environ. Sci. Technol. 1998, 32, 1303–1307. [Google Scholar] [CrossRef]
- Werner, K.; Pommer, L.; Broström, M. Thermal decomposition of hemicelluloses. J. Anal. Appl. Pyrol. 2014, 110, 130–137. [Google Scholar] [CrossRef]


| Element Content/(wt.%) | Control and Thermally-Modified Wood | |||||||||
|---|---|---|---|---|---|---|---|---|---|---|
| Control | TM-160-3 | TM-160-6 | TM-160-9 | TM-180-3 | TM-180-6 | TM-180-9 | TM-200-3 | TM-200-6 | TM-200-9 | |
| C | 45.83 | 46.74 | 46.89 | 46.95 | 47.07 | 47.68 | 47.62 | 47.62 | 47.93 | 48.14 |
| H | 6.46 | 6.01 | 5.99 | 5.93 | 6.04 | 6.04 | 5.95 | 6.00 | 5.97 | 5.92 |
| O | 47.60 | 47.26 | 47.10 | 47.00 | 46.99 | 46.16 | 46.34 | 46.26 | 45.95 | 45.84 |
| Category | RT (min) | Compounds | Relative Content (Peak Area%) | ||
|---|---|---|---|---|---|
| TM-160 | TM-180 | TM-200 | |||
| Acids | 4.44 | Acetic acid | 1.53 | 3.32 | 5.51 |
| 7.91 | 2-Hydroxy-6-methyl-3-cyclohexen-1-carboxylic acid | 1.47 | 1.39 | 1.29 | |
| 9.09 | Z-3-Methyl-2-hexenoic acid | 0.91 | 0.56 | 0.78 | |
| 9.43 | 1,2-Dimethylcyclopropanecarboxylic acid | 0.23 | 0.20 | 0.17 | |
| 9.79 | (E)-3-Methyl-4-decenoic acid | 0.31 | 0.21 | 0.16 | |
| 11.87 | 2-Hydroxy-6-methyl-3-cyclohexen-1-carboxylic acid | 0.21 | 0.32 | 0.47 | |
| 12.50 | (E)-3-Hexenoic acid | 0.28 | 0.75 | 1.02 | |
| 12.92 | 3-Ethyl-3-methyl-pentanedioic acid | 0.16 | 0.25 | 0.37 | |
| 16.25 | Dodecanoic acid | 1.27 | 1.10 | / | |
| 17.67 | 7-Methoxybenzofuran-2-carboxylic acid | 0.88 | 0.71 | 0.79 | |
| 17.97 | 3,5-Dimethoxy-4-hydroxyphenylacetic acid | 0.76 | 0.33 | 0.70 | |
| 18.49 | Tetradecanoic acid | 1.06 | 1.23 | 0.39 | |
| 19.53 | 3,5-Dimethoxy-4-hydroxyphenylacetic acid | 0.00 | 0.44 | 0.31 | |
| 20.35 | n-Hexadecanoic acid | 0.00 | 0.30 | 0.33 | |
| 20.60 | Heptadecanoic acid | 10.2 | 11.32 | 12.43 | |
| 21.50 | (Z,Z)-9,12-Octadecadienoic acid | 0.16 | 0.26 | / | |
| 22.19 | Oleic Acid | 0.69 | 1.36 | 1.41 | |
| 22.23 | Octadecanoic acid | 1.23 | 1.43 | 1.32 | |
| 22.50 | Eicosanoic acid | 15.70 | 15.08 | 15.32 | |
| Total | 37.05 | 40.56 | 42.77 | ||
| Phenols | 13.11 | 2-Methoxy-4-vinylphenol | 1.33 | 0.90 | 1.07 |
| 13.62 | 2,6-Dimethoxy-phenol | 0.29 | 0.33 | 0.37 | |
| 13.70 | Eugenol | 0.40 | 0.35 | 0.28 | |
| 14.91 | trans-Isoeugenol | 2.26 | 2.23 | 2.24 | |
| 16.78 | 2,6-Dimethoxy-4-(2-propenyl)-phenol | 0.47 | 0.43 | 0.63 | |
| 17.90 | (E)-2,6-Dimethoxy-4-(prop-1-en-1-yl) phenol | 3.74 | 4.18 | 5.77 | |
| 18.70 | Desaspidinol | 0.61 | 0.71 | 1.34 | |
| 19.98 | 5-(3-Hydroxypropyl)-2,3-dimethoxyphenol | 0.34 | 0.31 | 0.50 | |
| 27.14 | 3,5-bis(1,1-Dimethylethyl)-1,2-benzenediol | 0.00 | 0.00 | 0.31 | |
| 31.97 | 2,6-bis(1,1-Dimethylethyl)-1,4-benzenediol | 0.16 | 1.06 | 3.05 | |
| Total | 9.60 | 10.50 | 15.56 | ||
| Aldehydes | 14.28 | Vanillin | 3.13 | 2.33 | 0.59 |
| 15.28 | 4-(t-Butyl)benzaldehyde | 0.57 | 0.38 | 0.24 | |
| 17.48 | 4-Hydroxy-3,5-dimethoxy-benzaldehyde | 3.71 | 2.97 | 1.83 | |
| 18.31 | 4-Hydroxy-2-methoxycinnamaldehyde | 5.8 | 5.26 | 4.02 | |
| 20.86 | 3,5-Dimethoxy-4-hydroxycinnamaldehyde | 5.78 | 4.87 | 4.99 | |
| Total | 18.99 | 15.81 | 11.67 | ||
| Ketones | 8.38 | 2,4-Hexanedione | 7.50 | 8.18 | 15.71 |
| 15.96 | 1-(4-Hydroxy-3-methoxyphenyl)-2-propanone | 0.38 | 0.36 | 0.38 | |
| 16.33 | 3′,5′-Dimethoxyacetophenone | 1.27 | 1.73 | 1.88 | |
| 16.63 | 1-(2-Hydroxy-4-methoxyphenyl)propan-1-one | 1.98 | 1.56 | 0.34 | |
| 19.34 | 1-[2-(5-hydroxy-1,1-dimethylhexyl)-3-methyl-2-cyclopropen-1-yl]-ethanone | 0.36 | 0.30 | 0.28 | |
| 24.41 | 3-Tridecanoyl-3-cyclohexen-4-ol-1-one | 0.00 | 0.00 | 0.35 | |
| Total | 11.49 | 12.13 | 18.94 | ||
| Furans | 5.39 | 2(5H)-Furanone | 0.00 | 0.00 | 0.40 |
| 6.18 | Furfural | 8.45 | 9.34 | 13.41 | |
| 11.99 | 5,6-Dihydro-6-pentyl-2H-pyran-2-one, | 0.68 | 0.76 | 0.89 | |
| 12.23 | 6-Ethoxy-3,6-dihydro-3-hydroxy-2H-pyran-2-methanol | 0.28 | 0.34 | 0.45 | |
| 13.24 | 5-Butyldihydro-4-methyl-2(3H)-furanone | 0.38 | 0.25 | 0.14 | |
| 17.76 | 5-(1-Hexynyl)-furan-2-carboxylic acid | 0.00 | 0.20 | 0.22 | |
| 19.26 | 5-tert-Butyl-2-(4-tert-butylphenoxymethyl)-furane-3-carboxylic acid | 1.75 | 1.51 | 1.22 | |
| Total | 11.54 | 12.40 | 16.73 | ||
| Alcohols | 15.06 | α-Ethyl-4-methoxy-benzenemethanol | 0.76 | 0.22 | 0.29 |
| 16.33 | (2α,3α,4α)- 2-(3,4-dimethoxyphenyl)-3,4-dihydro-6-methyl-2H-1-benzopyran-3,4-diol | 1.27 | 0.73 | 1.88 | |
| 17.35 | 4-Hydroxy-3-methoxy-benzenepropanol | 0.67 | 0.64 | 0.62 | |
| 27.786 | (all-E)-(±)- 2,6,10,15,19,23-hexamethyl-1,6,10,14,18,22-tetracosahexaen-3-ol | 0.39 | 2.51 | 2.41 | |
| Total | 3.09 | 4.10 | 5.20 | ||
| Sugars | 11.16 | 2-Deoxy-D-galactose | 0.91 | 0.66 | 0.44 |
| 13.98 | D-Allose | 0.62 | 0.7 | 0.75 | |
| 15.45 | 1,6-Anhydro-β-D-glucopyranose | 0.00 | 1.86 | 1.75 | |
| Total | 1.53 | 3.22 | 2.94 | ||
| Esters | 10.14 | Heptamethylene diacetate | 0.38 | 0.42 | 0.55 |
| 12.23 | Carbonic acid-but-2-yn-1-yl undecyl ester | 0.28 | 0.38 | 0.45 | |
| 22.11 | Heptadecanoic acid-16-methyl-methyl ester | 0.38 | 0.29 | 0.11 | |
| 23.73 | Octadecanoic acid-2-hydroxy-1,3-propanediyl ester | 0.00 | 0.74 | 0.21 | |
| 25.68 | Diisooctyl phthalate | 0.00 | 0.30 | 0.51 | |
| 25.96 | Cholesteryl formate | 0.21 | 0.35 | 0.33 | |
| Total | 1.25 | 2.48 | 2.16 | ||
© 2019 by the authors. Licensee MDPI, Basel, Switzerland. This article is an open access article distributed under the terms and conditions of the Creative Commons Attribution (CC BY) license (http://creativecommons.org/licenses/by/4.0/).
Share and Cite
Xu, J.; Zhang, Y.; Shen, Y.; Li, C.; Wang, Y.; Ma, Z.; Sun, W. New Perspective on Wood Thermal Modification: Relevance between the Evolution of Chemical Structure and Physical-Mechanical Properties, and Online Analysis of Release of VOCs. Polymers 2019, 11, 1145. https://doi.org/10.3390/polym11071145
Xu J, Zhang Y, Shen Y, Li C, Wang Y, Ma Z, Sun W. New Perspective on Wood Thermal Modification: Relevance between the Evolution of Chemical Structure and Physical-Mechanical Properties, and Online Analysis of Release of VOCs. Polymers. 2019; 11(7):1145. https://doi.org/10.3390/polym11071145
Chicago/Turabian StyleXu, Jiajia, Yu Zhang, Yunfang Shen, Cong Li, Yanwei Wang, Zhongqing Ma, and Weisheng Sun. 2019. "New Perspective on Wood Thermal Modification: Relevance between the Evolution of Chemical Structure and Physical-Mechanical Properties, and Online Analysis of Release of VOCs" Polymers 11, no. 7: 1145. https://doi.org/10.3390/polym11071145