Preparation of Fly Ash/Epoxy Composites and Its Effects on Mechanical Properties


Abstract
:1. Introduction
2. Materials and Methods
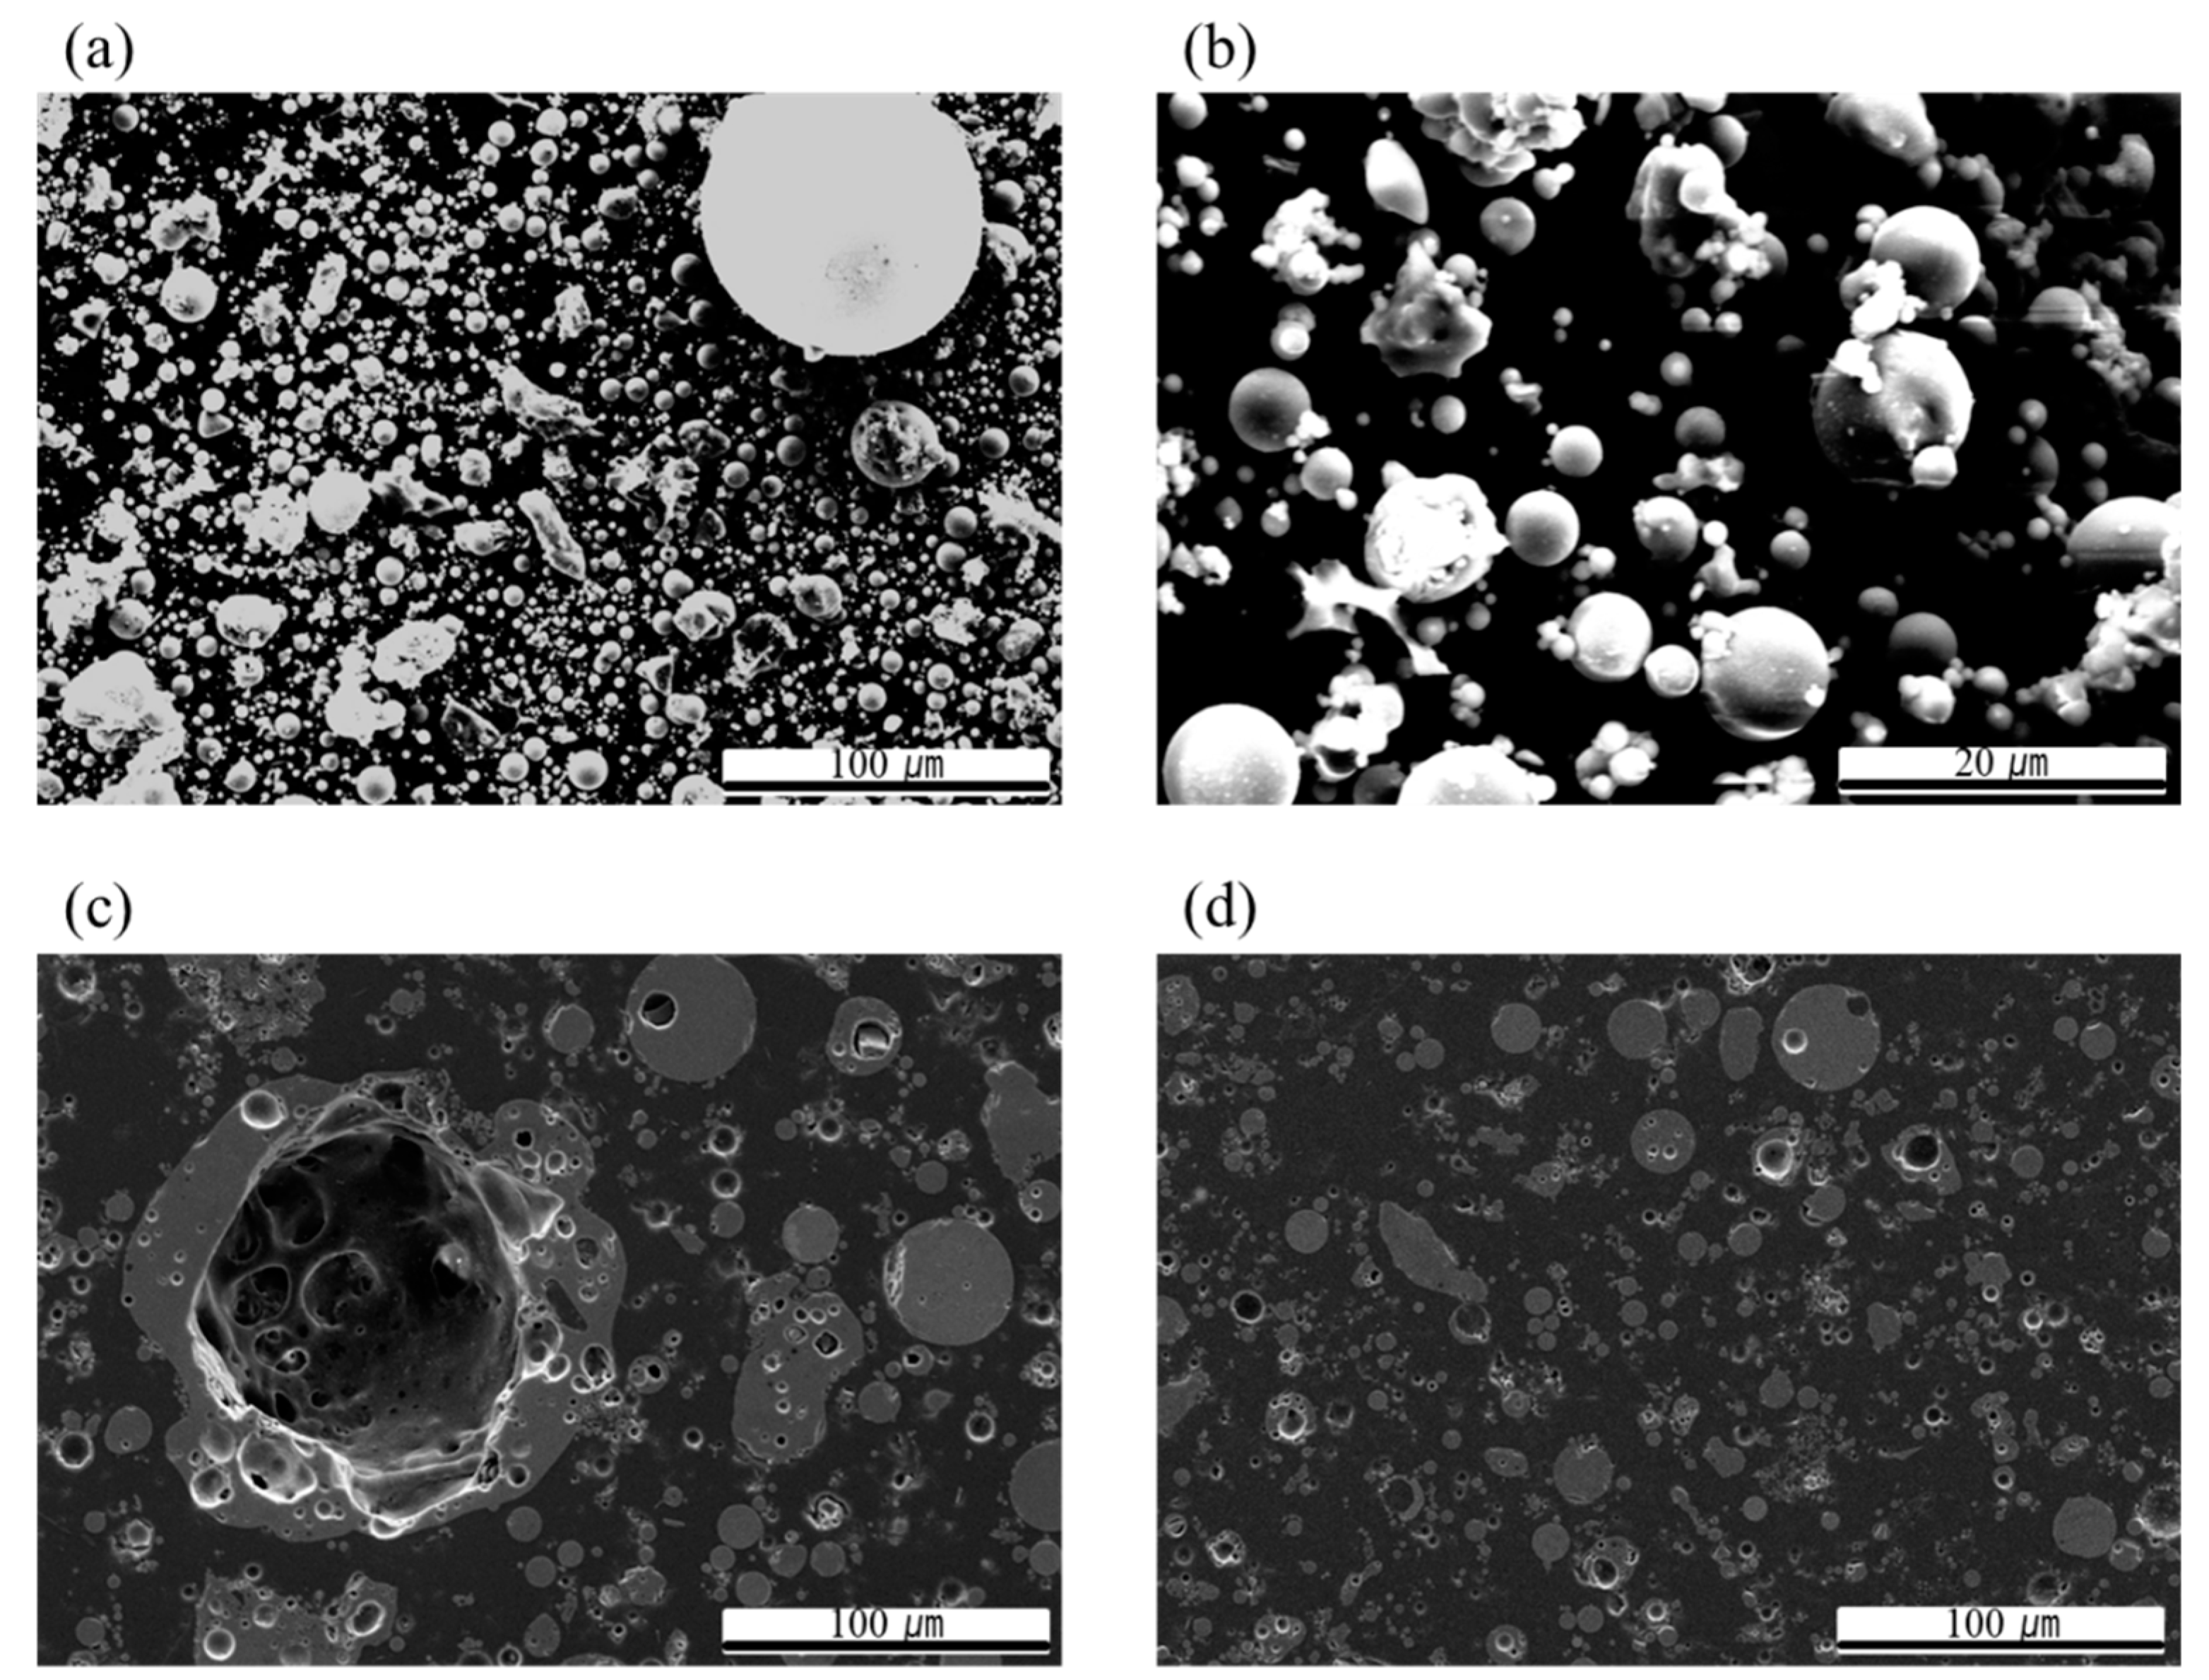
2.1. Materials
2.2. Characterization Methods for Resin Viscosity
2.3. Manufacture of Fly Ash/Epoxy Composite
2.4. Mechanical Properties
3. Results
3.1. Effect of Viscosity
3.1.1. Viscosity of Composites at Various Temperatures
3.1.2. Mechanical Properties of Composites According to Viscosity
3.2. Effect of Filler Size
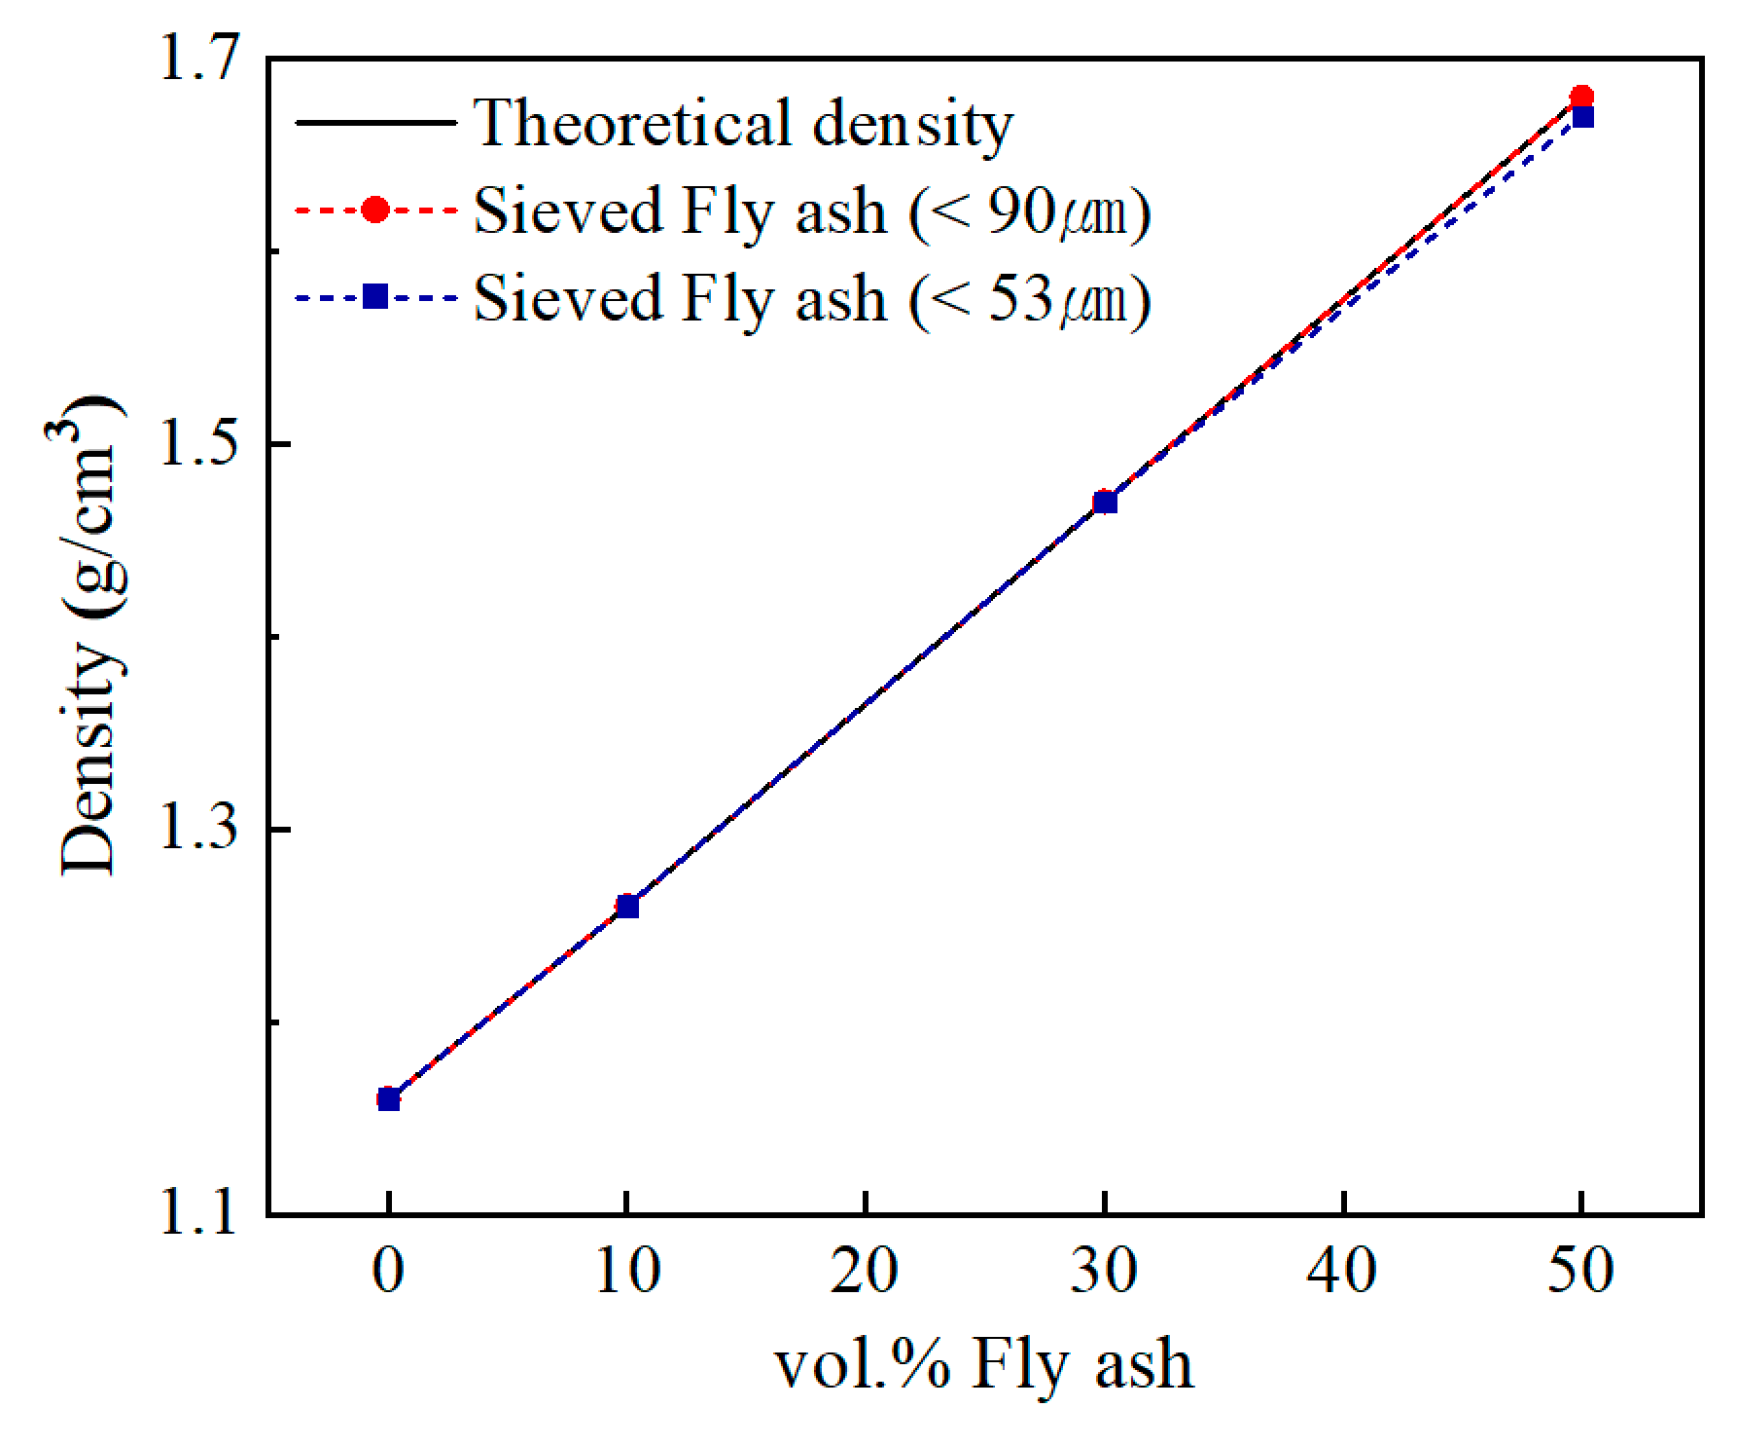
3.2.1. Density
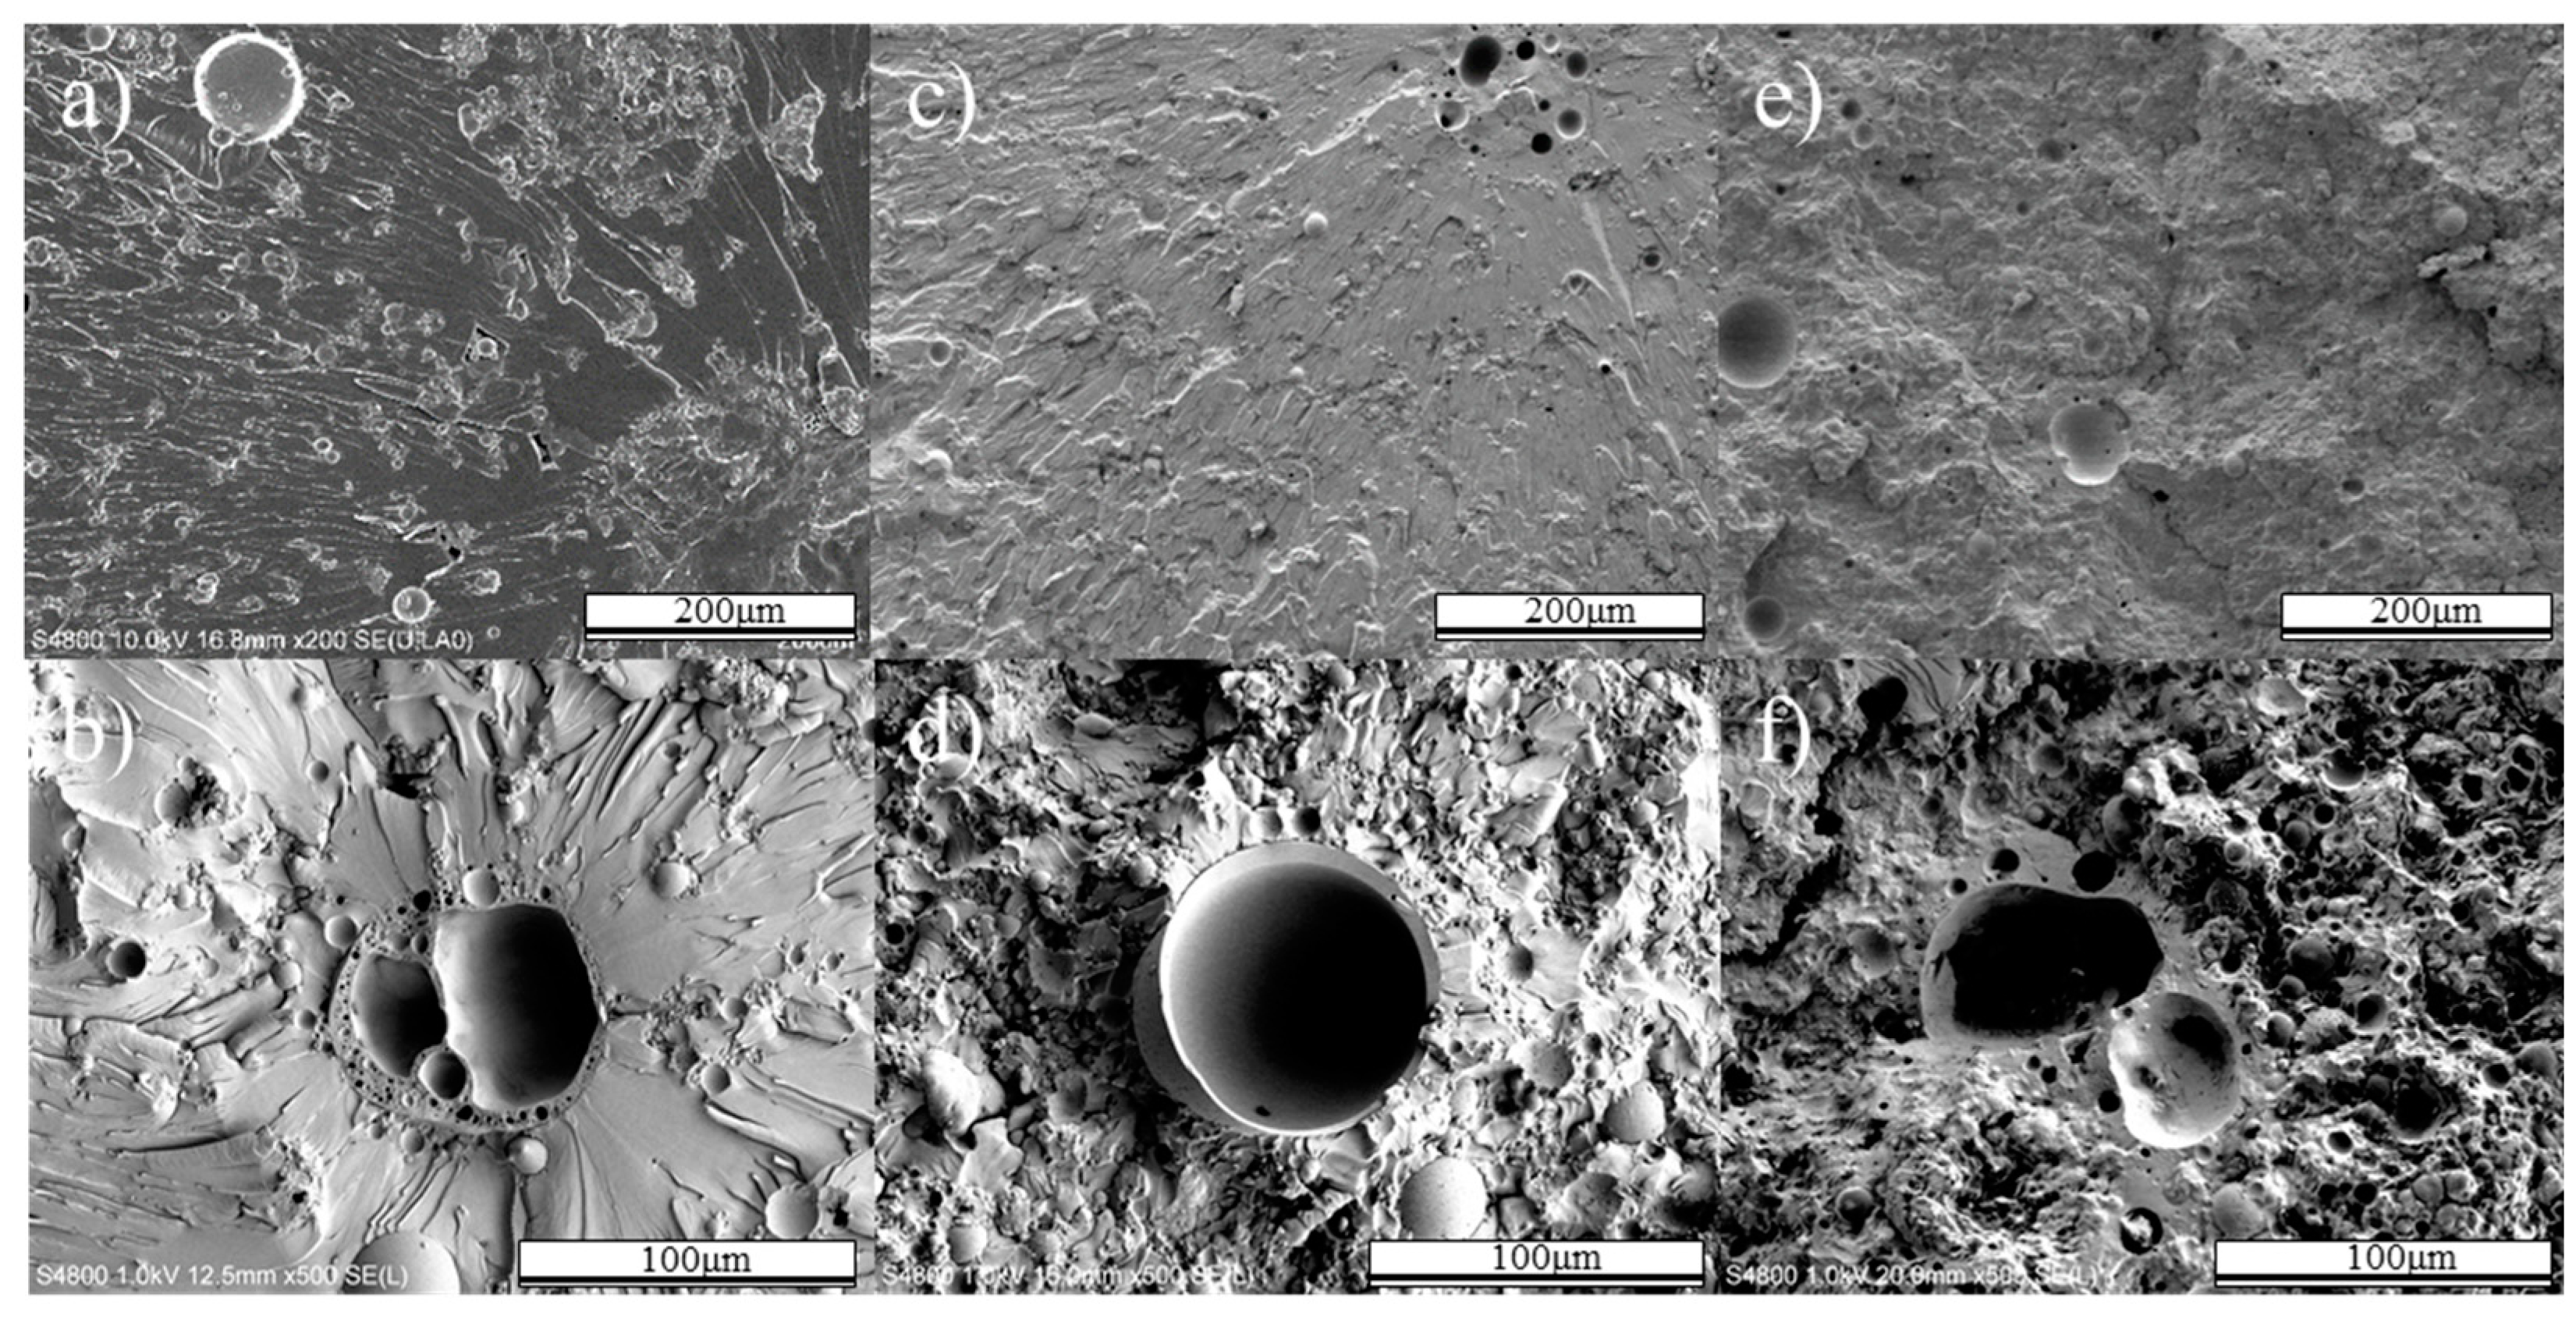
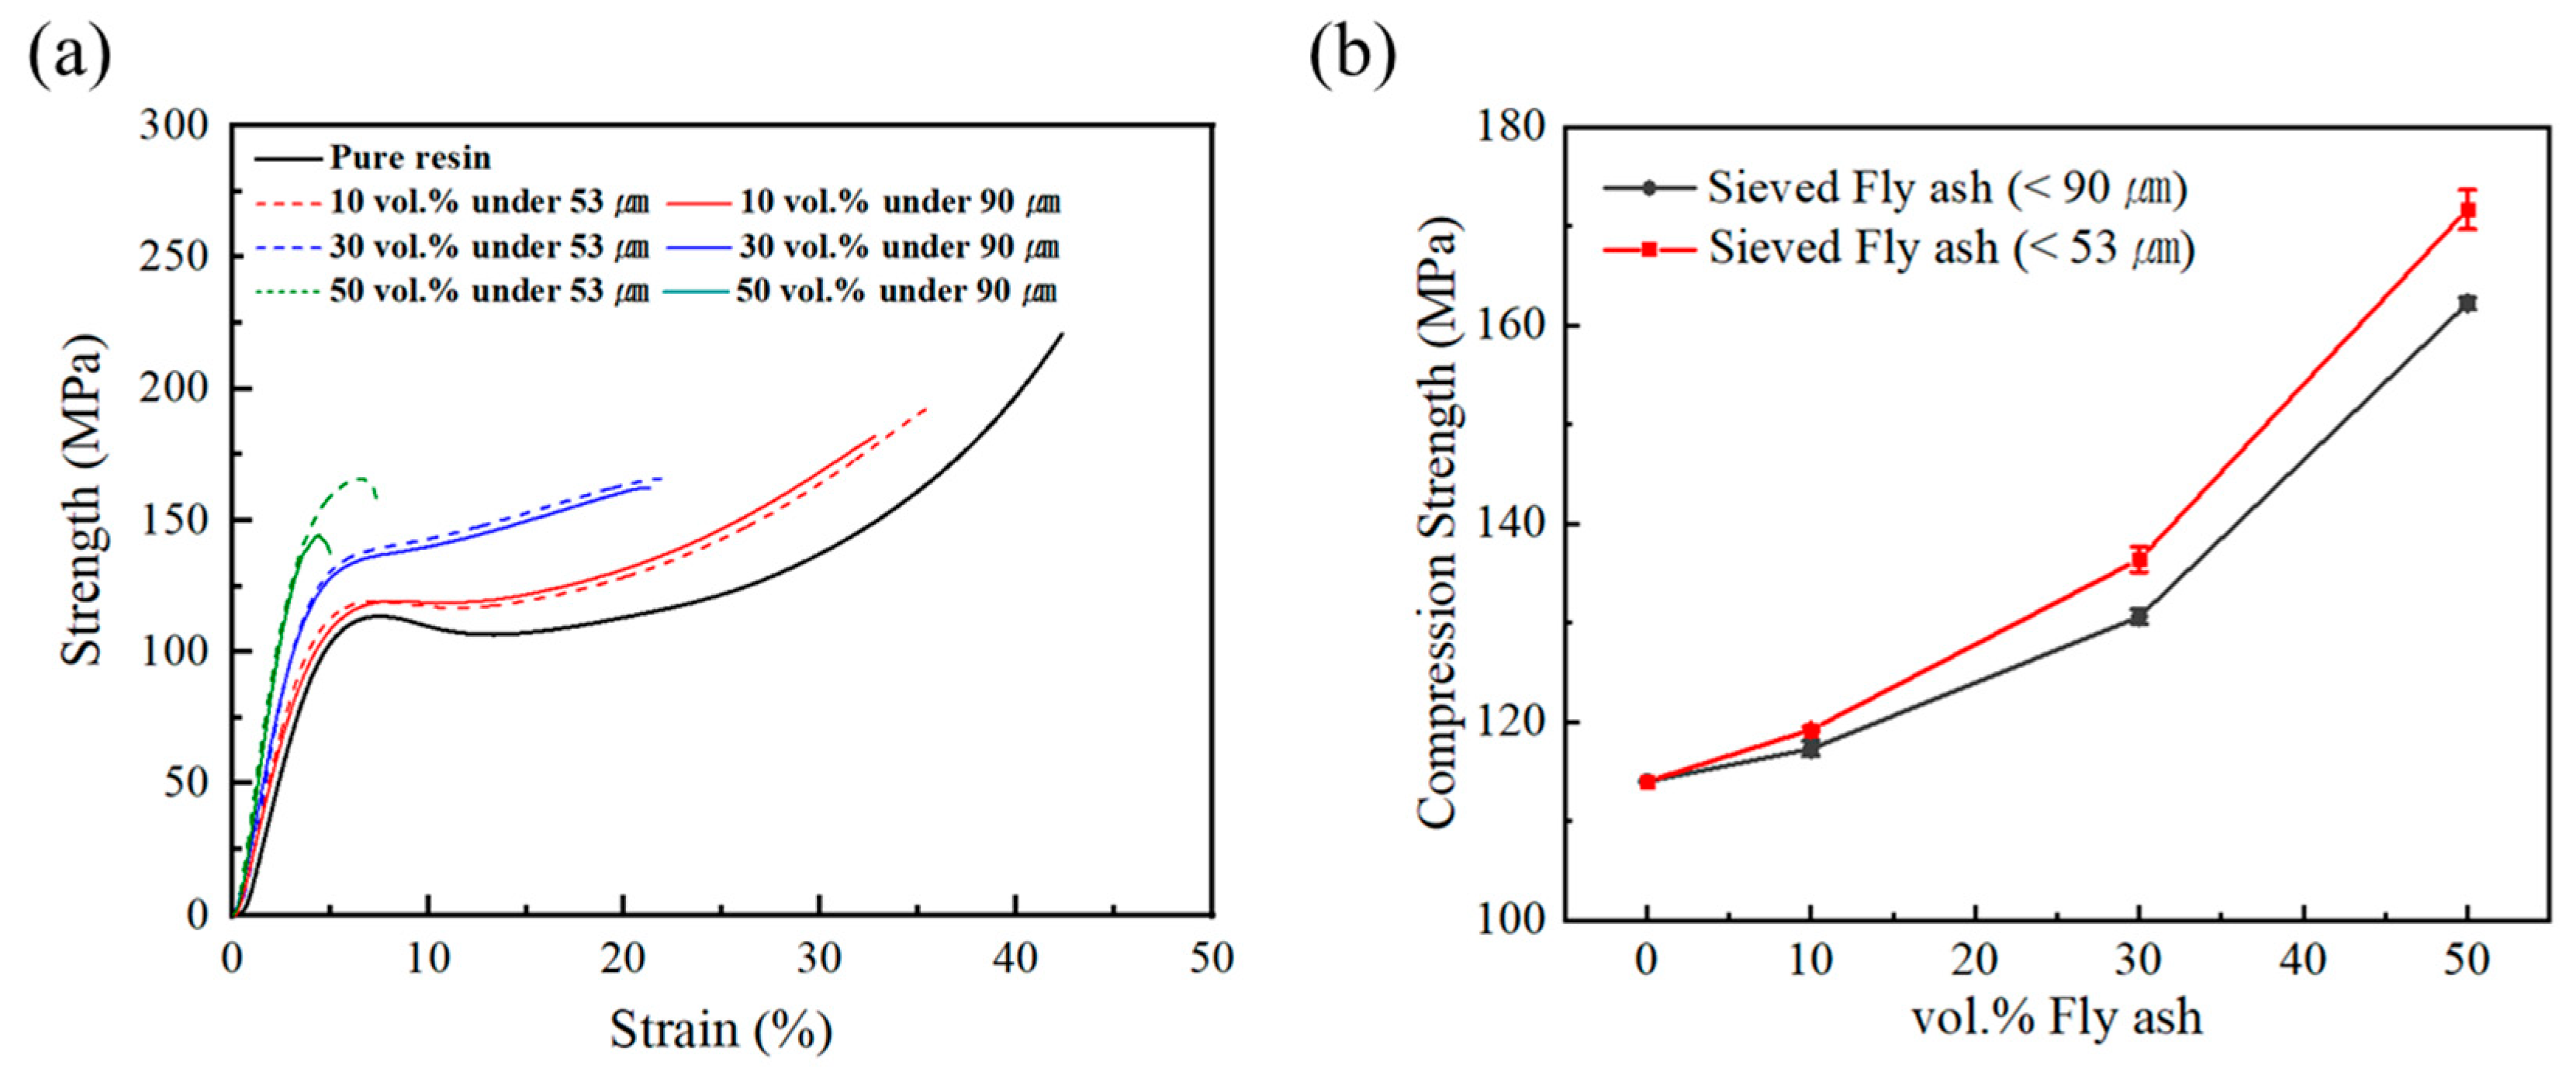
3.2.2. Tensile Test
3.2.3. Compression Test
4. Conclusions
Author Contributions
Funding
Conflicts of Interest
References
- Liu, Y.; Du, H.; Liu, L.; Leng, J. Shape memory polymers and their composites in aerospace applications: A review. Smart Mater. Struct. 2014, 23, 023001. [Google Scholar] [CrossRef]
- Yu, Z.; Niu, X.; Liu, Z.; Pei, Q. Intrinsically stretchable polymer light-emitting devices using carbon nanotube-polymer composite electrodes. Adv. Mater. 2011, 23, 3989–3994. [Google Scholar] [CrossRef] [PubMed]
- Holbery, J.; Houston, D. Natural-fiber-reinforced polymer composites in automotive applications. JOM 2006, 58, 80–86. [Google Scholar] [CrossRef]
- Patankar, S.N.; Kranov, Y.A. Hollow glass microsphere HDPE composites for low energy sustainability. Mater. Sci. Eng. A 2010, 527, 1361–1366. [Google Scholar] [CrossRef]
- Lau, K.; Gu, C.; Hui, D. A critical review on nanotube and nanotube/nanoclay related polymer composite materials. Compos. Part B Eng. 2006, 37, 425–436. [Google Scholar] [CrossRef]
- Sumita, M.; Sakata, K.; Asai, S.; Miyasaka, K.; Nakagawa, H. Dispersion of fillers and the electrical conductivity of polymer blends filled with carbon black. Polym. Bull. 1991, 25, 265–271. [Google Scholar] [CrossRef]
- Poslinski, A.J.; Ryan, M.E.; Gupta, R.K.; Seshadri, S.G.; Frechette, F.J. Rheological behavior of filled polymeric systems II. The effect of a bimodal size distribution of particulates. J. Rheol. 1988, 32, 751–771. [Google Scholar] [CrossRef]
- Evora, V.M.F.; Shukla, A. Fabrication, characterization, and dynamic behavior of polyester/TiO2 nanocomposites. Mater. Sci. Eng. A 2003, 361, 358–366. [Google Scholar] [CrossRef]
- Gupta, N.; Brar, B.S.; Woldesenbet, E. Effect of filler addition on the compressive and impact properties of glass fibre reinforced epoxy. Bull. Mater. Sci. 2001, 24, 219–223. [Google Scholar] [CrossRef]
- Tilbrook, M.T.; Moon, R.J.; Hoffman, M. On the mechanical properties of alumina-epoxy composites with an interpenetrating network structure. Mater. Sci. Eng. A 2005, 393, 170–178. [Google Scholar] [CrossRef]
- Kuo, D.H.; Chang, C.C.; Su, T.Y.; Wang, W.K.; Lin, B.Y. Dielectric properties of three ceramic/epoxy composites. Mater. Chem. Phys. 2004, 85, 201–206. [Google Scholar] [CrossRef]
- Kaynak, C.; Orgun, O.; Tincer, T. Matrix and interface modification of short carbon fiber-reinforced epoxy. Polym. Test. 2005, 24, 455–462. [Google Scholar] [CrossRef]
- Pothan, L.A.; Oommen, Z.; Thomas, S. Dynamic mechanical analysis of banana fiber reinforced polyester composites. Compos. Sci. Technol. 2003, 63, 283–293. [Google Scholar] [CrossRef]
- Chand, N. SEM observation of fractured flyash-polyester composites. J. Mater. Sci. Lett. 1988, 7, 36–38. [Google Scholar] [CrossRef]
- Kishore; Kulkarni, S.M.; Sharathchandra, S.; Sunil, D. On the use of an instrumented set-up to characterize the impact behaviour of an epoxy system containing varying fly ash content. Polym. Test. 2002, 21, 763–771. [Google Scholar] [CrossRef] [Green Version]
- Kulkarni, S.M.; Kishore. Effect of filler-fiber interactions on compressive strength of fly ash and short-fiber epoxy composites. J. Appl. Polym. Sci. 2003, 87, 836–841. [Google Scholar] [CrossRef]
- Garde, K.; McGill, W.J.; Woolard, C.D. Surface modification of fly ash—Characterisation and evaluation as reinforcing filler in polyisoprene. Plast. Rubber Compos. 1999, 28, 1–10. [Google Scholar] [CrossRef]
- Sombatsompop, N.; Thongsang, S.; Markpin, T.; Wimolmala, E. Fly ash particles and precipitated silica as fillers in rubbers. I. Untreated fillers in natural rubber and styrene-butadiene rubber compounds. J. Appl. Polym. Sci. 2004, 93, 2119–2130. [Google Scholar] [CrossRef]
- Nakamura, Y.; Yamaguchi, M.; Okubo, M.; Matsumoto, T. Effect of particle size on the fracture toughness of epoxy resin filled with spherical silica. Polymer. 1992, 33, 3415–3426. [Google Scholar] [CrossRef]
- Nakamura, Y.; Yamaguchi, M.; Okubo, M.; Matsumoto, T. Effects of particle size on mechanical and impact properties of epoxy resin filled with spherical silica. J. Appl. Polym. Sci. 1992, 45, 1281–1289. [Google Scholar] [CrossRef]
- Barnes, H.A.; Hutton, J.F.; Walters, K. An Introduction to Rheology; Elsevier: Amsterdam, The Netherlands, 1989. [Google Scholar]
- Kang, Y.; Lee, W.; Hwang, J.; Lee, Y. Influence of glass microsphere filler on the rheological behavior of an epoxy resin. Int. Polym. Process. 2018, 33, 146–152. [Google Scholar] [CrossRef]
- Mooney, M. The viscosity of a concentrated suspension of spherical particles. J. Colloid Sci. 1951, 6, 162–170. [Google Scholar] [CrossRef]
- Song, Y.S.; Youn, J.R. Influence of dispersion states of carbon nanotubes on physical properties of epoxy nanocomposites. Carbon N. Y. 2005, 43, 1378–1385. [Google Scholar] [CrossRef]
- Schulze, K.A.; Zaman, A.A.; Söderholm, K.J.M. Effect of filler fraction on strength, viscosity and porosity of experimental compomer materials. J. Dent. 2003, 31, 373–382. [Google Scholar] [CrossRef]
- Li, X.; Cao, Z.; Zhang, Z.; Dang, H. Surface-modification in situ of nano-SiO2 and its structure and tribological properties. Appl. Surf. Sci. 2006, 252, 7856–7861. [Google Scholar] [CrossRef]
- Matsuoka, S. (Ed.) Relaxation Phenomena in Polymers; Hanser Publishers: Munich, Germany, 1992. [Google Scholar]
- Yang, K.; Ritchie, R.O.; Gu, Y.; Wu, S.J.; Guan, J. High volume-fraction silk fabric reinforcements can improve the key mechanical properties of epoxy resin composites. Mater. Des. 2016, 108, 470–478. [Google Scholar] [CrossRef] [Green Version]


| SiO2 | Al2O3 | Fe2O3 | CaO | MgO | K2O | SO3 | Na2O |
|---|---|---|---|---|---|---|---|
| 54.3 | 25.8 | 7.41 | 5.69 | 1.51 | 1.43 | 0.66 | 0.5 |
| Temperature | A | b | R Statistic |
|---|---|---|---|
| 20 °C | 3.41 | 8.84 | 0.9966 |
| 40 °C | 0.649 | 9.07 | 0.9992 |
| 60 °C | 0.107 | 8.93 | 0.9994 |
| Volume (%) | Viscosity at 20 °C (Pa∙s) | Viscosity at 40 °C (Pa∙s) | Viscosity at 60 °C (Pa∙s) |
|---|---|---|---|
| 0 | 3.69 | 0.456 | 0.09 |
| 10 | 7.36 | 1.41 | 0.256 |
| 30 | 39.8 | 8.53 | 1.66 |
| 50 | 681 | 62.2 | 8.9 |
| Fly Ash Volume Fraction (%) | Temperature (°C) | Viscosity (Pa∙s) | Tensile Strength (MPa) | Compressive Strength (MPa) |
|---|---|---|---|---|
| 10 | 20 | 7.36 | 53.3 | 119.2 |
| 10 | 40 | 1.41 | 40 | 118.3 |
| 10 | 60 | 0.26 | 39.4 | 115.4 |
| 30 | 20 | 39.8 | None | None |
| 30 | 40 | 8.53 | 53.3 | 136.5 |
| 30 | 60 | 1.65 | 42.5 | 125.7 |
| 50 | 20 | 681 | None | None |
| 50 | 40 | 62.2 | None | None |
| 50 | 60 | 8.9 | 33.9 | 165.6 |
© 2020 by the authors. Licensee MDPI, Basel, Switzerland. This article is an open access article distributed under the terms and conditions of the Creative Commons Attribution (CC BY) license (http://creativecommons.org/licenses/by/4.0/).
Share and Cite
Sim, J.; Kang, Y.; Kim, B.J.; Park, Y.H.; Lee, Y.C. Preparation of Fly Ash/Epoxy Composites and Its Effects on Mechanical Properties. Polymers 2020, 12, 79. https://doi.org/10.3390/polym12010079
Sim J, Kang Y, Kim BJ, Park YH, Lee YC. Preparation of Fly Ash/Epoxy Composites and Its Effects on Mechanical Properties. Polymers. 2020; 12(1):79. https://doi.org/10.3390/polym12010079
Chicago/Turabian StyleSim, Jeesoo, Youngjeong Kang, Byung Joo Kim, Yong Ho Park, and Young Cheol Lee. 2020. "Preparation of Fly Ash/Epoxy Composites and Its Effects on Mechanical Properties" Polymers 12, no. 1: 79. https://doi.org/10.3390/polym12010079