Article

Dielectric Properties of P(VDF-TrFE-CTFE) Composites Filled with Surface-Coated TiO2 Nanowires by SnO2 Nanoparticles

State Key Lab Silicon Mat, School of Materials Science and Engineering, Zhejiang University, Hangzhou 310027, China
*
Author to whom correspondence should be addressed.
Polymers 2020, 12(1), 85; https://doi.org/10.3390/polym12010085
Submission received: 9 December 2019 / Revised: 23 December 2019 / Accepted: 24 December 2019 / Published: 3 January 2020

Abstract

:
Nanocomposites containing inorganic fillers embedded in polymer matrices have exhibited great potential applications in capacitors. Therefore, an effective method to improve the dielectric properties of polymer is to design novel fillers with a special microstructure. In this work, a combination of hydrothermal method and precipitation method was used to synthesize in situ SnO2 nanoparticles on the surface of one-dimensional TiO2 nanowires (TiO2 NWs), and the TiO2NWs@SnO2 fillers well-dispersed into the poly (vinylidene fluoride-trifluoroethylene-chlorotrifluoroethylene) [P(VDF-TrFE-CTFE)] polymer. Hybrid structure TiO2NWs @SnO2 introduce extra interfaces, which enhance the interfacial polarization and the dielectric constant. Typically, at 10 vol.% low filling volume fraction, the composite with TiO2NWs @SnO2 shows a dielectric constant of 133.4 at 100 Hz, which is almost four times that of polymer. Besides, the TiO2 NWs prevents the direct contact of SnO2 with each other in the polymer matrix, so the composites still maintain good insulation performance. All the improved performance indicates these composites can be widely useful in electronic devices.

Graphical Abstract

1. Introduction

With the rapid growth of the microelectronics industry, electron components are integrated and miniaturized. Polymer dielectrics are widely applied in flexible displays, capacitors and energy storage devices because of good flexibility, easy processing and light-weight [1,2,3,4,5,6,7]. A relatively high dielectric constant is critical for dielectric materials. However, most polymers have low dielectric permittivity εr < 10, which hinders their application [8,9,10,11,12]. Therefore, plenty of studies have introduced ceramic particles (Pb(Zr,Ti)O3, BaTiO3, KTaxNb1−xO3) as fillers into polymers to achieve a high dielectric constant [13,14,15,16,17]. Compared with spherical particles, the one-dimensional filler with a higher aspect ratio has a higher dipole moment inside, and a relatively high dielectric permittivity can be obtained at a low filling concentration [18,19]. Furthermore, theoretical calculations and experimental results show that adding a proper amount of nanowires aligned perpendicular to the external electric field direction in the composite system can help maintain or even enhance the breakdown field strength of the polymer matrix [20,21]. Among them, TiO2NWs have attracted more and more attention due to their moderate dielectric constant and the special role of homogenizing electric fields [22,23]. For example, Sodano et al. demonstrated that a polyvinylidene fluoride-based composite filled with 7.5 vol.% KH550 surface-modified TiO2 nanowires can enhance the εr of PVDF from 10 to 16 [24]. However, the ability of TiO2 nanowires to improve the εr is limited. When the filling volume fraction is greater than 10%, the dielectric properties of the composite material no longer improve, and may even deteriorate, showing similar characteristics to the percolation system. The reason for this result is that after reaching a certain amount of addition, the nanowires begin to overlap and aggregate with each other, and introduce defects such as holes, instead of reducing the dielectric constant and increase losses.
Tin dioxide (SnO2) is a semiconductor with wide band gap. Some recent studies have confirmed that nanometer-sized SnO2 can effectively improve the εr of polymer matrix [25,26]. Zha et al. loaded a small amount of SnO2 quantum dots on the surface of 100 nm BaTiO3, and the results showed that the εr of SnO2 loaded BaTiO3 composites did not show an advantage at the loading lower than 20 vol.%. After the volume fraction increased to 45 vol.%, BT/SnO2-PVDF showed a significantly improved dielectric constant (90 at 1 kHz), which is 1.4 times that of PVDF-BT [27].
In this study, a combination of hydrothermal method and precipitation method was used to synthesize in situ SnO2 nanoparticles on the surface of one-dimensional TiO2 NWs. The TiO2NWs @SnO2 fillers were successfully introduced into poly (vinylidene fluoride-trifluoroethylene-chlorotrifluoroethylene) [P(VDF-TrFE-CTFE)] with relatively high εr. The small difference in dielectric constant between the matrix and the filler results in a more uniform electric field distribution, which is beneficial to maintain relatively high breakdown strength of composites. The hybrid structure TiO2NWs @SnO2 introduces additional interfaces, thereby the interfacial polarization and εr of composites is increased. Moreover, the TiO2 NWs prevent the direct contact of SnO2 from each other in polymer matrix, so the composites still maintain good insulation performance.

2. Materials and Methods

2.1. Materials

Ethanol, tin chloride dihydrate (SnCl2•2H2O), ethylene glycol (EG), hydrochloric acid, and sodium hydroxide (NaOH) were bought from Sinopharm Chemical Reagent Co., Ltd., Shanghai, China. Urea and N,N-dimethylformamide (DMF) were provided by Aladdin Industrial Corporation, Shanghai, China. Titanium dioxide (TiO2 < 25 nm) was supplied by Sigma-Aldrich (St. Louis, MO, USA). P(VDF-TrFE-CTFE) (64/27/9 mol.%) terpolymer was bought from Piezotech, Pierre-Benite, France.

2.2. Synthesis of TiO2@SnO2 Hybrid Nanopaticles

2.2.1. Synthesis of TiO2 NWs

Firstly, 1.25 g TiO2 were dispersed in a mixture solution with 40 mL NaOH (10 M), 6.25 mL EG and ethanol. Secondly, the solution was transferred into a Teflon-lined autoclave and maintained at 180 °C for 48 h. The white precipitate obtained by the reaction was sufficiently washed with distilled water and immersed in a diluted 0.2 M HCl solution for 12 h. Finally, the powders were washed, dried and calcined at 700 °C for 2 h in air.

2.2.2. Synthesis of TiO2@SnO2 Hybrid Nanoparticles

0.6 g TiO2 nanowires were distributed in 40 mL deionized water, then transferred to a three-neck round-bottom flask and heated to 60 °C. After stirring for 10 min, 0.324 mL of hydrochloric acid and stoichiometric amounts of tin chloride dihydrate and urea were added to the suspension in sequence, and kept at 60 °C for 30 min. Finally, the powders were washed, dried and calcined at 450 °C for 2 h in air. TiO2@SnO2 composite with different molar ratios of Sn:Ti (2:5; 4:5; 8:5; 16:5) were also prepared, respectively (abbreviated as TS1, TS2, TS3, and TS4).

2.3. Fabrication of P(VDF-TrFE-CTFE)-Based Composites

Firstly, P(VDF-TrFE-CTFE) was dissolved in DMF. Then a stoichiometric amount of TiO2@SnO2 were added with vigorously stirring and sonication. The mixture was drop-cast onto a clean substrate and dried at 80 °C overnight. Finally, the generated films followed by hot-press (2500 psi, 180 °C, 10 min). For comparison, pure polymer was also generated.

2.4. Characterization

The cross-section of films and the morphology of the particles were tested by scanning electron microscopy (FESEM, SU-70, Hitachi Ltd., Tokyo, Japan) and transmission electron microscopy (TEM, Tecnai G2 F20, FEI, Hillsboro, OR, USA). The crystal structure of nanoparticles and composites were performed by x-ray diffraction (XRD, EMPYREAN, PANalytical Co., Almelo, Netherlands). Escalab 250Xi x-ray photoelectron spectroscopy (XPS, Thermo Fisher Scientific, Inc., Hampton, NH, USA) was used to measure the elemental composition of nanoparticles. A Perkin–Elmer DSC-7 analyzer (Perkin–Elmer, Waltham, MA, USA) at 80–180 °C (10 °C/min) was used to measure differential scanning calorimetry (DSC). The dielectric properties were obtained by Agilent 4294A LCR Meter (Agilent, Palo Alto, CA, USA) from 102–106 Hz. The DC breakdown was tested at room temperature under a direct-current voltage ramp of 400 V/s (CS2674AX, Nanjing Changsheng, Nanjing, China).

3. Results and Discussion

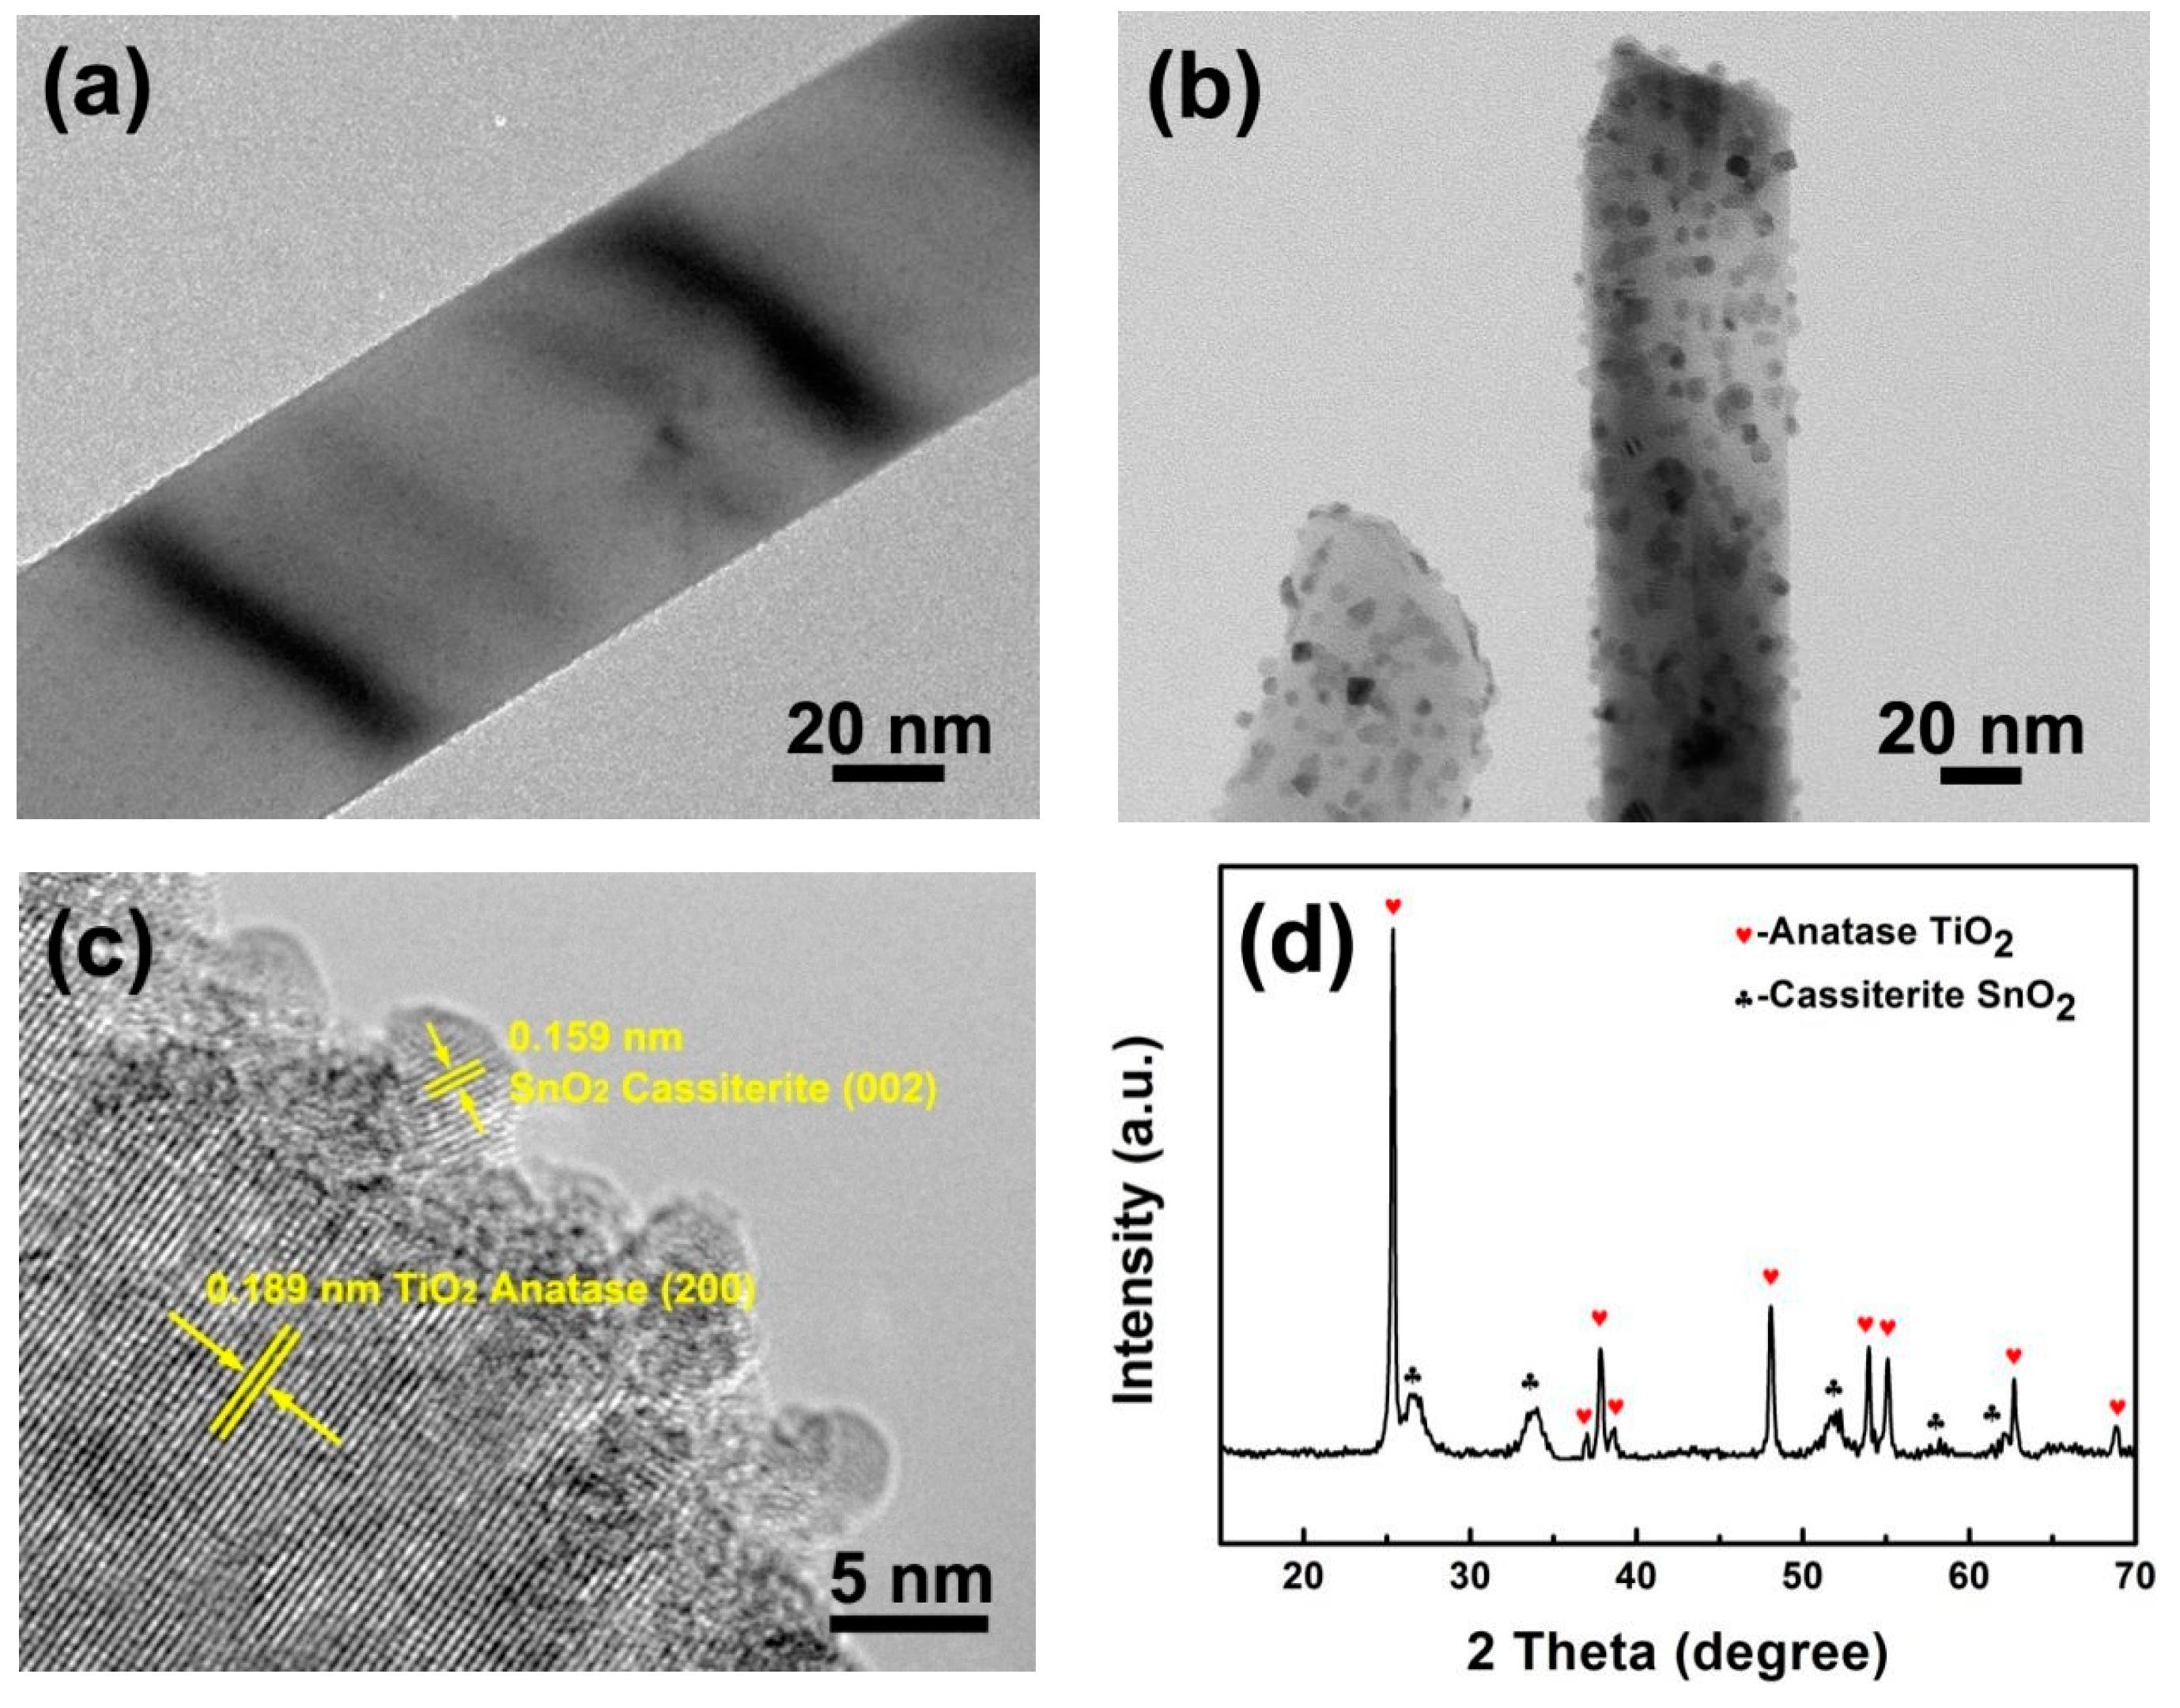
3.1. Structure and Morphology of TiO2@SnO2 Nanoparticles

In Figure S1, the XRD pattern and SEM images exhibit that the as-synthesized TiO2 NWs possess homogenous, one-dimensional morphology without additional phases. Figure 1b shows the TEM image of TS2, which retained the original TiO2 nanowire morphology, but compared to the smooth pure TiO2 nanowires (Figure 1a), its surface was rougher and many nanoparticles were uniformly loaded. In Figure 1c, HRTEM was used to observe the nanowire/nanoparticle interface. It can be seen that the composite structure consists of two phases, where the interplanar spacing of the nanowires corresponds to the anatase phase of TiO2. The fringe spacing of the nanoparticles corresponds to the (002) plane of the tetragonal SnO2. Figure 1d is the XRD spectrum of the composite. The sharp diffraction peaks are all attributed to the anatase-type TiO2. In addition, diffraction peaks of other phases have been observed. The peak position is consistent with the standard spectrum (JCPDS No. 41-1445) of the tetragonal SnO2. It is worth mentioning that in the composite structure, all SnO2 nanoparticles are loaded on the surface of TiO2. After a long period of ultrasonic and centrifugal separation, no free particles were observed, and no exposed TiO2 nanowires appeared, indicating the stability of the nanoparticles and the reliability of loading method. This relatively stable structure is important for the subsequent fabrication of composite materials.
The XPS test was used to further characterize the valence information of the elements in the TiO2@SnO2 composite structure. In Figure 2a, the binding energy of the Ti 2p3/2 and Ti 2p1/2 peaks are 458.6 eV and 464.3 eV, respectively. The difference in the binding energy (5.7 eV) corresponds to Ti4+ in TiO2. In the Sn 3d spectrum (Figure 2b), the peaks centered on 486.8 eV and 495.2 eV appear, corresponding to the binding energies of Sn 3d5/2 and Sn 3d3/2, respectively. At the same time, it can be seen that the shape of the peaks is more symmetrical. Figure 2c is the spectrum of O 1s. It can be observed that there is only one peak with asymmetric peak shape. After fitting it, it can be divided into three peaks. The strongest peak at 530.0 eV corresponds to O–Ti bond in TiO2, the second strongest peak (530.8 eV) corresponds to the O–Sn bond in SnO2, and the peak at 531.8 eV is connected with the hydroxyl group, which may be derived from water chemically adsorbed during sample preparation [28,29].
Figure S2 illustrates the morphology of the product with various SnCl2/TiO2 molar ratios. As the initial molar ratio of Sn/Ti increased, the SnO2 loading on the surface of TiO2 nanowires also increased significantly. Moreover, SnO2 was well distributed on the TiO2 nanowires without obvious aggregations. Figure 3 shows the XRD pattern of the TiO2@SnO2 composite structure. For the TS1 sample, the main phase in the spectrum was anatase TiO2, and the peak of the second phase was extremely weak. With the molar ratios of Sn:Ti increased, the diffraction peak of the SnO2 (JCPDS No. 41-1445) gradually increased, and at the same time, the peak of the anatase TiO2 showed a weakening trend, which is consistent with the phenomenon of TEM. In Figure S3, it can be found that the peaks of Ti 2p and Sn 3d are separated symmetrically. The peak position and the differences between binding energy correspond to the Ti4+ in TiO2 and Sn4+ in SnO2, respectively. By increasing the Sn/Ti molar ratio, the Sn peak intensity gradually increases, while the Ti peak gradually decreases, which is consistent with XRD and TEM.

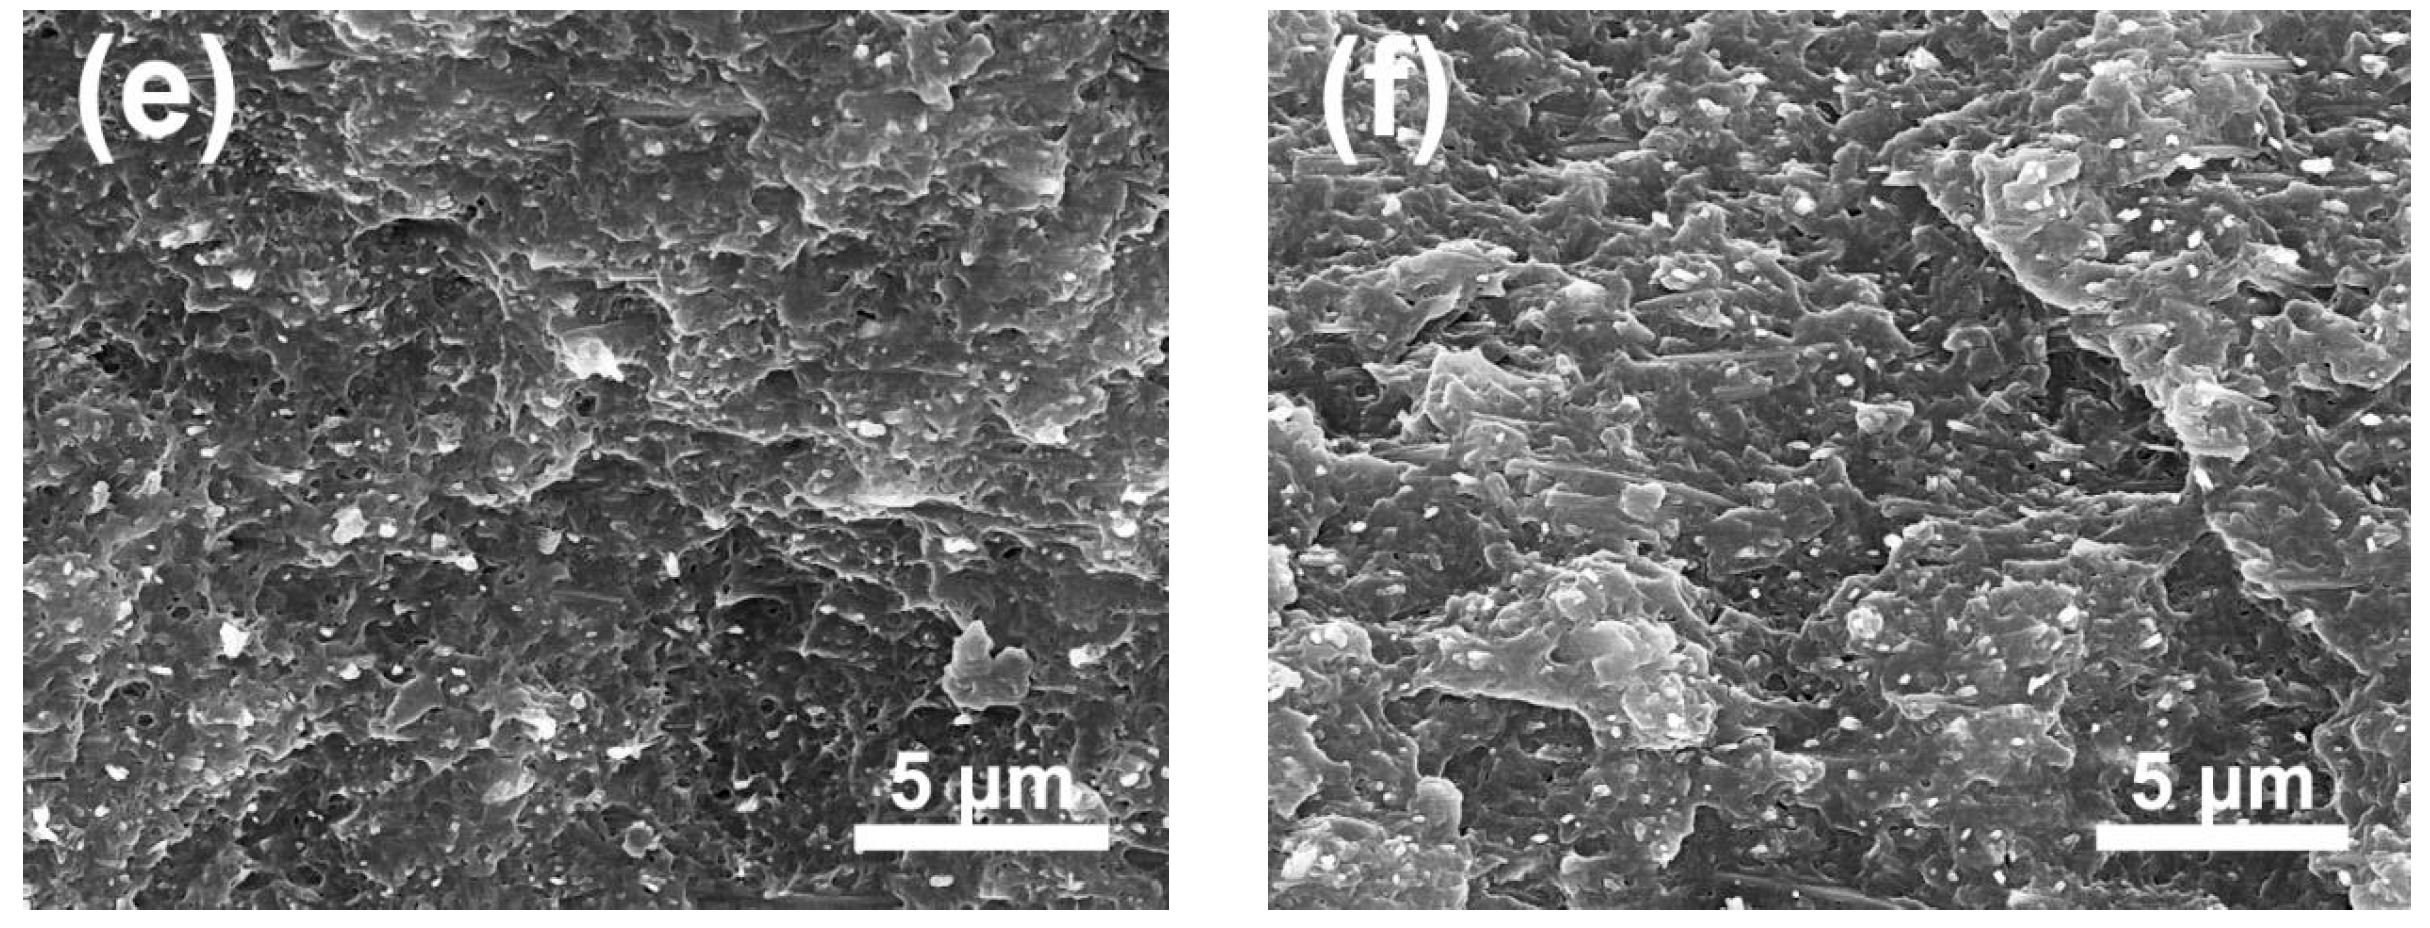
3.2. Morphology and Structure of TiO2 @SnO2/P(VDF-TrFE-CTFE) Composites

Figure 4 exhibits cross-section morphology of composites. The nanocomposites exhibited dense microstructure without holes and cracks, and the interfaces between the polymer and fillers were well bonded without large-scale agglomeration. In addition, it can be observed that the arrangement direction of the filler was substantially parallel to the surface of the composites, which helps to maintain or even increase the breakdown strength (BS) of the composites [20]. Figure 5 exhibits the XRD patterns of pure polymer and nanocomposite films. In Figure 5, the peak at 18° corresponds to the compound (020) and (002) diffractions of α and γ-P(VDF-TrFE-CTFE) [30,31]. The peaks of fillers also can be observed in the composite films without secondary phase, indicating that the introduction of TiO2@SnO2 has no effect on the polymer matrix.

3.3. Crystallization and Melting Behavior of TiO2 @SnO2/P(VDF-TrFE-CTFE) Composites

DSC analysis was used to explore the crystallinity (χc) of the polymer, which can be calculated according to the formula:
χ c = Δ H m ( 1 ω ) × Δ H m 0 × 100 %
where Δ H m 0   is the enthalpy of 100% crystalline P(VDF-TrFE-CTFE), Δ H m   is the heat enthalpy of the sample and ω is the mass percentage of TiO2@SnO2 nanoparticles in the polymer. Figure 6 and Table 1 show the cooling and heating curves and the crystallinities of composites. When the filling volume fraction was low, the effect of different SnO2 loadings on the crystallization and melting behavior of the polymer was similar. When the loading increased to 10 vol.%, the Tm of and χc generally showed a trend of rising first and then falling with the growth of SnO2 in the filler. Compared with the pure polymer, the crystallinity of matrix in the composite with a filling volume of 5 vol.% and 10 vol.% samples (TO, TS1) improved, and the maximum χc can be increased by 4.56% (TS1—5 vol.%). The results show that adding a suitable amount of filler in the composite system can serve as nucleating agent and promote crystallization. It can be found that in addition to the slightly obvious crystallization peak, there is a less obvious peak around 70°, indicating that the sample may undergo a very weak Curie transition around this temperature [32].

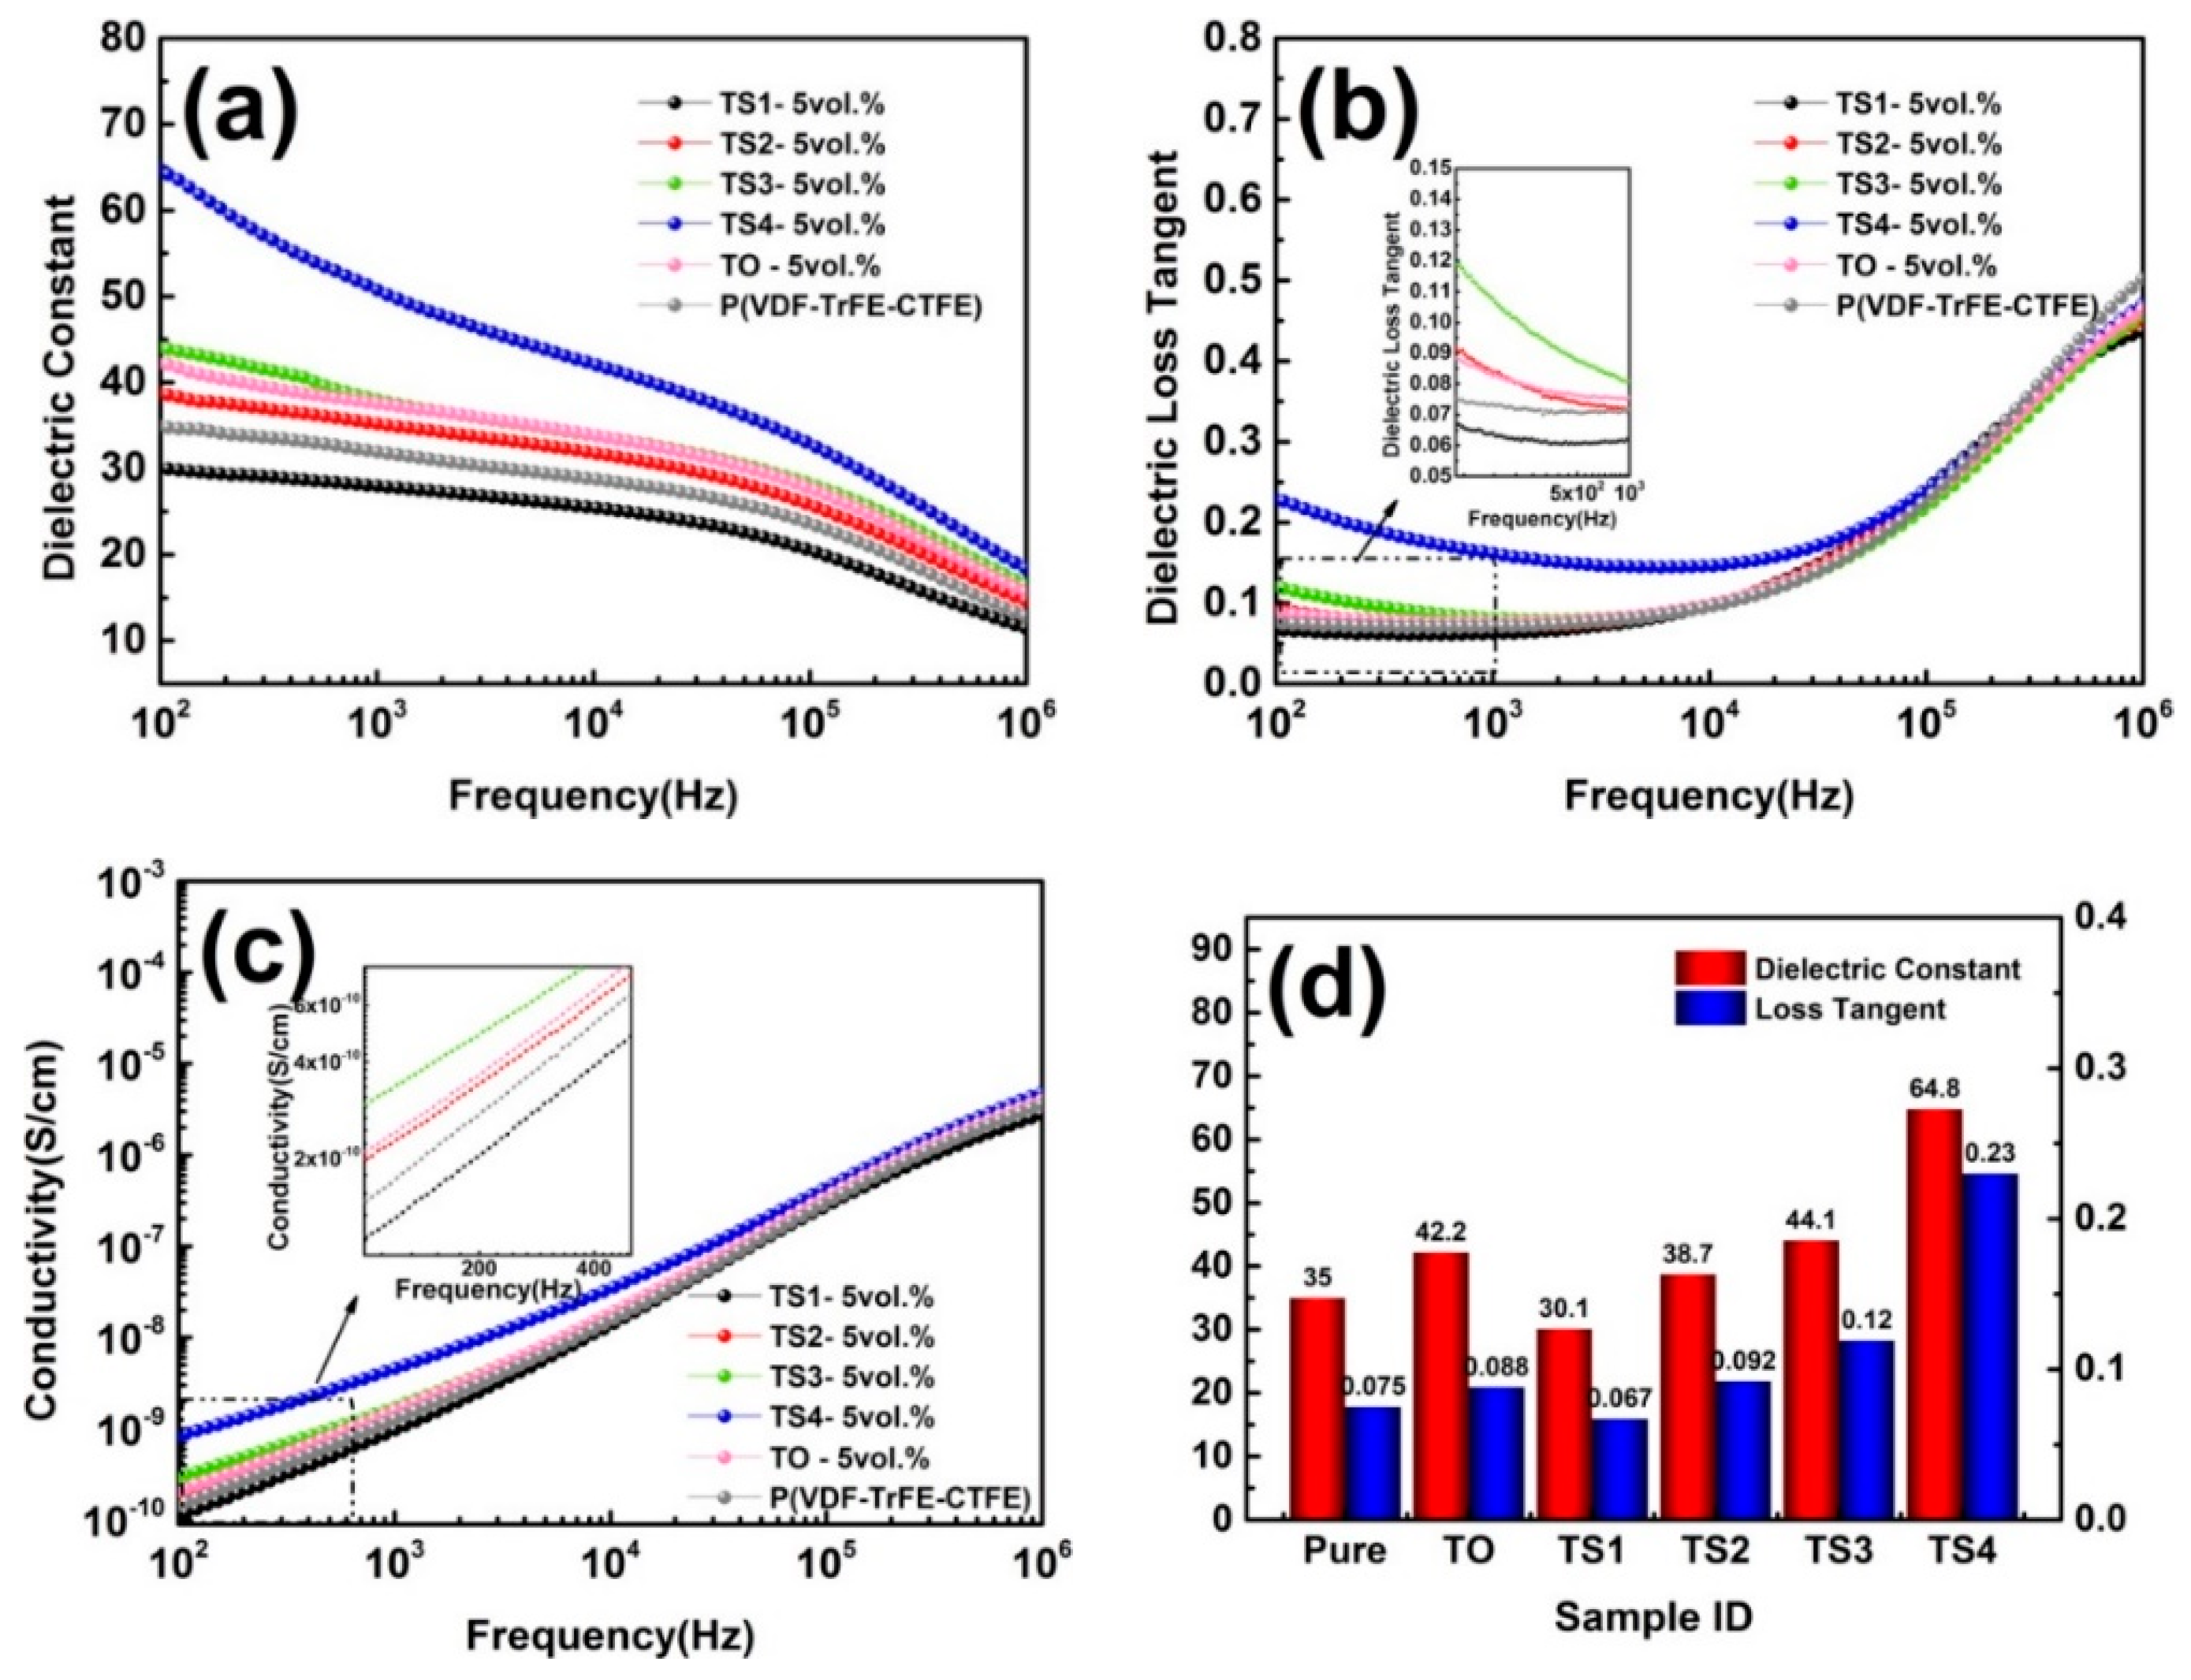
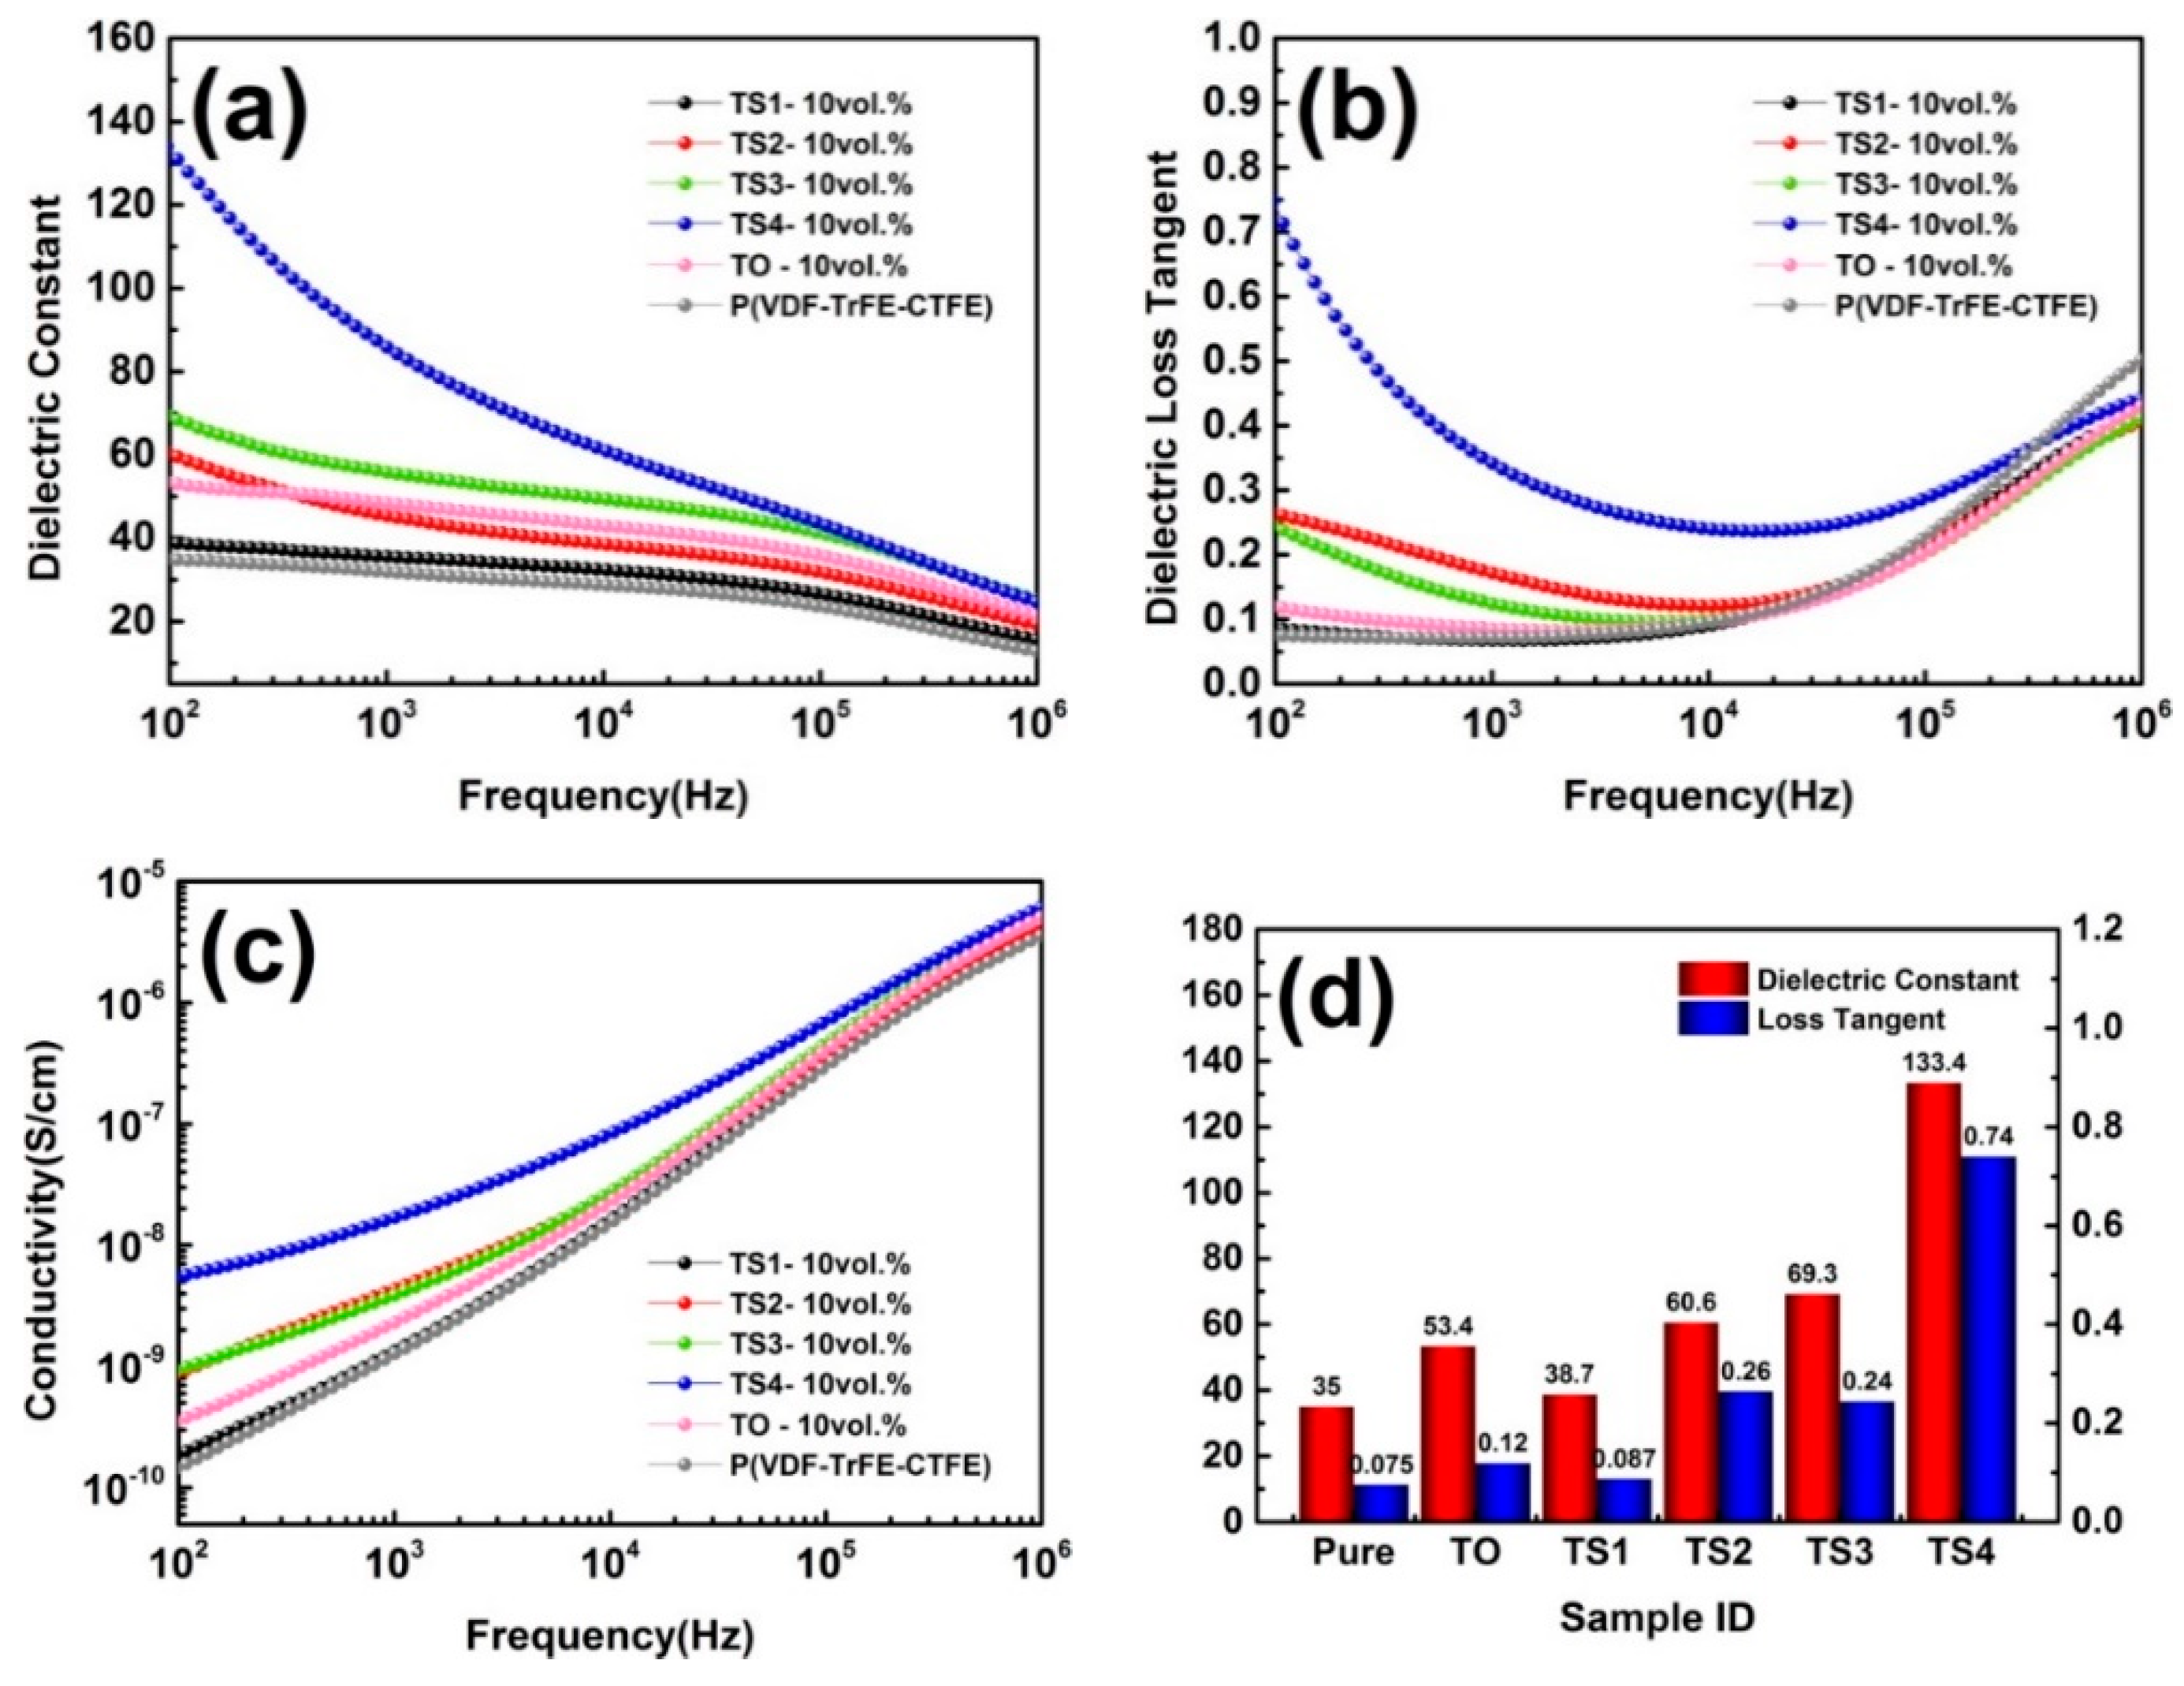
3.4. Dielectric Performances of TiO2 @SnO2/P(VDF-TrFE-CTFE) Composites

Figure 7 displays the dielectric properties of polymer and its composites (5 vol.%). When a small amount of SnO2 nanoparticles were loaded on the surface of TiO2 nanowires (TS1), the εr of composite was lower than that of other samples, but it also showed lower dielectric loss and conductivity over the entire frequency range, even lower than the pure polymer. When the SnO2 was further increased, the εr showed a significantly increased. For example, the εr of the composite filled with TS4 at 100 Hz is 64.8, in contrast to 35 and 42.2 for pure polymer and the composite filled with TiO2. The conductivity and dielectric loss of composites also remained at a relatively low level. When the filling volume fraction of the TiO2 and TiO2/SnO2 increased to 10%, the dielectric performances of the sample changed. In Figure 8, when a small amount of SnO2 (TS1) was loaded, the εr and loss were lower than that of composite filled with TiO2, but greater than that of pure polymer. The filler with high SnO2 loading had a more significant improvement in the εr of the matrix. The composite (TS4) had the largest increase, and the εr reached 133.4 at 100 Hz. It can be seen from the above results that the effect of SnO2 nanoparticles introduced on the surface of TiO2 NWs on the dielectric properties of the composite has two sides. At low SnO2 loading concentration, the εr and loss of the composites were suppressed. As the load increased, the εr, loss, and conductivity all gradually increased. This phenomenon is mainly related to the size and quantity of SnO2 [33]. On the one hand, the size of SnO2 particles in this work was 1–4 nm while the exciton Bohr radius of SnO2 particles is 2.7 nm [34]. Therefore, quantum size effect will be occurred. This effect causes the energy gap of some nanoparticles to widen, which makes charge transfer difficult, and there may be particles with reduced energy gap, which makes it easier for the charge to migrate. On the other hand, the concentration of SnO2 also had a significant effect on the dielectric performances of composites. At low loading concentration, the nanoparticles were far away from each other, as an isolated Coulomb Island, capturing electrons and space charges, and hindering carrier transport and inhibiting charge migration, which reduces interface polarization effects [35]. As the load increased, the distance between nanoparticles decreased. For the TS4 sample, many SnO2 nanoparticles loaded on the TiO2 nanowire formed a local network, and the distance between adjacent particles was <1 nm. At this time, the tunneling effect is very easy to occur, which causes the electrons to travel in the network [27]. Moreover, the hybrid structured TiO2@SnO2 nanoparticles introduce extra interfaces including TiO2@SnO2 interface, SnO2/polymer interface and TiO2/polymer interface. Therefore, the interface polarization and the dielectric constant are greatly improved. In addition, SnO2 is supported on the dispersed TiO2 nanowires, so SnO2 networks are separated from each other by a certain distance. Even if a percolation channel is formed locally, the composites still maintain good insulation performance as a whole.
The breakdown strength is significant characteristic in dielectric materials, and determine the energy density of composites. The characteristic breakdown strength (CBS) of each sample could be calculated with a two parameter Weibull distribution function [36]:
P   = 1 e ( E E 0 ) β
where β is the shape parameter, P is the cumulative probability of electrical failure, E represents breakdown strength, and E0 is the characteristic breakdown strength (p = 0.632). All TiO2@SnO2/P(VDF-TrFE-CTFE) composites can withstand a high electric field exceeding 50 MV/m, as shown in Figure 9. Moreover, loading a small amount of SnO2 nanoparticles on TiO2 NWs can significantly increase the CBS of the composite. For instance, the composite filled with 5 vol.% TiO2 nanowires has a CBS of 168.2 MV/m, while the TS1 composite CBS with the same volume fraction is increased to higher than 250 MV/m. When the filling amount is 10 vol.%, the CBS of the TiO2 composite decreases to 108.5 MV/m, while the CBS of the composite filled with TS1 and TS2 is 127.3 and 110.9 MV/m, respectively. This phenomenon is consistent with the previous changes in dielectric loss, and is the result of combined effects of the quantum size and Coulomb blockade of SnO2 nanoparticles.

4. Conclusions

In conclusion, the special structure of TiO2 NWs/SnO2 fillers have successfully fabricated, and introduced into the polymer to form a novel dielectric composite. Hybrid structured TiO2 NWs/SnO2 introduce extra interfaces in the composites. The effects of TiO2@SnO2 hybrid structure with different SnO2 loadings on the microstructure, dielectric properties and dielectric strength of composites were explored. Typically, when a small amount of SnO2 nanoparticles are loaded on the surface of TiO2 nanowires, due to the combined effects of quantum size and Coulomb blockade, the SnO2 nanoparticles effectively hinder the carrier transport, thereby inhibiting the conductivity and dielectric loss of TiO2/P(VDF-TrFE-CTFE) composites and pure polymer, and effectively enhance the CBS of composites. As the SnO2 increases, the nanoparticles gradually form a local network, greatly enhancing the interface polarization effect and the εr of the composites. The composites with 10 vol.% TS4 show a dielectric constant of 133.4 at 100 Hz, which is almost four times that of the P(VDF-TrFE-CTFE). In the meantime, TiO2 nanowires promote the dispersion of SnO2 nanoparticles, so the composites maintain good insulation properties.

Supplementary Materials

The following are available online at https://www.mdpi.com/2073-4360/12/1/85/s1, Figure S1: SEM images of (a,b) H2Ti3O7 and (c) TiO2 nanowires; (d) XRD patterns of H2Ti3O7 and TiO2 nanowires. Figure S2. TEM images of the powders prepared with various SnCl2/TiO2 molar ratios: (a) 2:5, (b) 4:5, (c) 8:5, (d) 16:5. Figure S3. (a,c,e) TiO2, (b,d,f) Sn 3d XPS spectra of TiO2@SnO2 hybrid structure.

Author Contributions

Conceptualization, Q.Z.; data curation, Z.Z. and N.X.; formal analysis, Z.Z. and N.X.; funding acquisition, Q.Z.; investigation, Z.Z., N.X., H.Y. and Q.Z.; methodology, Z.Z. and N.X.; supervision, Q.Z. and H.Y.; writing—original draft, Z.Z. and N.X.; writing—review and editing, Q.Z. and H.Y. All authors have read and agreed to the published version of the manuscript.

Funding

The authors gratefully acknowledge the financial support from the National Natural Science Foundation of China (Grant No. 51772267), and the Key R&D Program of Zhejiang Province (Grant No. 2019C05001).

Conflicts of Interest

The authors declare no conflict of interest.

References

  1. Guo, M.F.; Jiang, J.Y.; Shen, Z.H.; Lin, Y.H.; Nan, C.W.; Shen, Y. High-energy-density ferroelectric polymer nanocomposites for capacitive energy storage: Enhanced breakdown strength and improved discharge efficiency. Mater Today 2019, 29, 49–67. [Google Scholar] [CrossRef]
  2. Li, H.; Liu, F.H.; Fan, B.Y.; Ai, D.; Peng, Z.R.; Wang, Q. Nanostructured ferroelectric-polymer composites for capacitive energy storage. Small Methods 2018, 2, 1700399. [Google Scholar] [CrossRef]
  3. Zhou, L.; Jiang, Y.F. Recent progress in dielectric nanocomposites. Mater. Sci. Technol. 2019, 1–16. [Google Scholar] [CrossRef]
  4. Zou, K.L.; Dan, Y.; Xu, H.J.; Zhang, Q.F.; Lu, Y.M.; Huang, H.T.; He, Y.B. Recent advances in lead-free dielectric materials for energy storage. Mater. Res. Bull. 2019, 113, 190–201. [Google Scholar] [CrossRef]
  5. Yang, L.T.; Kong, X.; Li, F.; Hao, H.; Cheng, Z.X.; Liu, H.X.; Li, J.F.; Zhang, S.J. Perovskite lead-free dielectrics for energy storage applications. Prog. Mater. Sci. 2019, 102, 72–108. [Google Scholar] [CrossRef]
  6. Yao, Z.H.; Song, Z.; Hao, H.; Yu, Z.Y.; Cao, M.H.; Zhang, S.J.; Lanagan, M.T.; Liu, H.X. Homogeneous/Inhomogeneous-Structured dielectrics and their energy-storage performances. Adv. Mater. 2017, 29, 1601727. [Google Scholar] [CrossRef]
  7. Li, H.; Ai, D.; Ren, L.L.; Yao, B.; Han, Z.B.; Shen, Z.H.; Wang, J.J.; Chen, L.Q.; Wang, Q. Scalable polymer nanocomposites with record high-temperature capacitive performance enabled by rationally designed nanostructured inorganic fillers. Adv. Mater. 2019, 31, 1900875. [Google Scholar] [CrossRef]
  8. Zhu, Y.K.; Jiang, P.K.; Zhang, Z.C.; Huang, X.Y. Dielectric phenomena and electrical energy storage of poly (vinylidene fluoride) based high-k polymers. Chinese. Chem. Lett. 2017, 28, 2027–2035. [Google Scholar] [CrossRef]
  9. Chen, Q.; Shen, Y.; Zhang, S.H.; Zhang, Q.M. Polymer-based dielectrics with high energy storage density. Annu. Rev. Mater. Res. 2015, 45, 433–458. [Google Scholar] [CrossRef]
  10. Huan, T.D.; Boggs, S.; Teyssedre, G.; Laurent, C.; Cakmak, M.; Kumar, S.; Ramprasad, R. Advanced polymeric dielectrics for high energy density applications. Prog. Mater. Sci. 2016, 83, 236–269. [Google Scholar] [CrossRef]
  11. Wang, Y.; Zhou, X.; Chen, Q.; Chu, B.J.; Zhang, Q.M. Recent development of high energy density polymers for dielectric capacitors. IEEE Trans. Dielectr. Electr. Insul. 2010, 17, 1036–1042. [Google Scholar] [CrossRef]
  12. Li, H.; Liu, F.H.; Tian, H.D.; Wang, C.; Guo, Z.H.; Liu, P.; Peng, Z.R.; Wang, Q. Synergetic enhancement of mechanical and electrical strength in epoxy/silica nanocomposites via chemically-bonded interface. Compos. Sci. Technol. 2018, 167, 539–546. [Google Scholar] [CrossRef]
  13. Hao, Y.N.; Wang, X.H.; Bi, K.; Zhang, J.M.; Huang, Y.H.; Wu, L.W.; Zhao, P.Y.; Xu, K.; Lei, M.; Li, L.T. Significantly enhanced energy storage performance promoted by ultimate sized ferroelectric BaTiO3 fillers in nanocomposite films. Nano Energy 2017, 31, 49–56. [Google Scholar] [CrossRef]
  14. Tang, H.X.; Lin, Y.R.; Sodano, H.A. Enhanced energy storage in nanocomposite capacitors through aligned PZT nanowires by uniaxial strain assembly. Adv. Energy. Mater. 2012, 2, 469–476. [Google Scholar] [CrossRef]
  15. Zhang, Z.; Yang, H.; Wang, H.; Ding, X.G.; Zhang, Q.L.; Zhu, Z.C. Enhanced dielectric properties and energy density of flexible KTa0.2Nb0.8O3-BaTiO3/P(VDF-TrFE-CTFE) nanocomposite. J. Mater. Sci. Mater. Electron. 2019, 30, 2501–2511. [Google Scholar] [CrossRef]
  16. Bobić, J.D.; Teixeira, G.F.; Grigalaitis, R.; Gyergyek, S.; Petrović, M.M.V.; Zaghete, M.A.; Stojanovic, B.D. PZT–NZF/CF ferrite flexible thick films: Structural, dielectric, ferroelectric, and magnetic characterization. J. Adv. Ceram. 2019, 8, 545–554. [Google Scholar] [CrossRef] [Green Version]
  17. Liu, S.H.; Zhai, J.W.; Wang, J.W.; Xue, S.X.; Zhang, W.Q. Enhanced energy storage density in poly(Vinylidene Fluoride) nanocomposites by a small loading of surface-hydroxylated Ba0.6Sr0.4TiO3 nanofibers. ACS Appl. Mater. Interfaces 2014, 6, 1533–1540. [Google Scholar] [CrossRef]
  18. Huang, X.Y.; Sun, B.; Zhu, Y.K.; Li, S.T.; Jiang, P.K. High-k polymer nanocomposites with 1D filler for dielectric and energy storage applications. Prog. Mater. Sci. 2019, 100, 187–225. [Google Scholar] [CrossRef]
  19. Liang, L.Y.; Kang, X.L.; Sang, Y.H.; Liu, H. One-Dimensional ferroelectric nanostructures: Synthesis, properties, and applications. Adv. Sci. 2016, 3, 1500358. [Google Scholar] [CrossRef] [Green Version]
  20. Tomer, V.; Randall, C.A. High field dielectric properties of anisotropic polymer-ceramic composites. J. Appl. Phys. 2008, 104, 074106. [Google Scholar] [CrossRef]
  21. Hu, P.H.; Wang, J.J.; Shen, Y.; Guan, Y.H.; Lin, Y.H.; Nan, C.W. Highly enhanced energy density induced by hetero-interface in sandwich-structured polymer nanocomposites. J. Mater. Chem. A 2013, 1, 12321–12326. [Google Scholar] [CrossRef]
  22. Yao, L.M.; Pan, Z.B.; Liu, S.H.; Zhai, J.W.; Chen, H.H.D. Significantly enhanced energy density in nanocomposite capacitors combining the TiO2 nanorod array with poly (vinylidene fluoride). ACS Appl. Mater. Interfaces 2016, 8, 26343–26351. [Google Scholar] [CrossRef]
  23. Zhang, X.; Chen, W.W.; Wang, J.J.; Shen, Y.; Gu, L.; Lin, Y.H.; Nan, C.W. Hierarchical interfaces induce high dielectric permittivity in nanocomposites containing TiO2@BaTiO3 nanofibers. Nanoscale 2014, 6, 6701–6709. [Google Scholar] [CrossRef]
  24. Tang, H.X.; Sodano, H.A. High energy density nanocomposite capacitors using non-ferroelectric nanowires. Appl. Phys. Lett. 2013, 102, 063901. [Google Scholar] [CrossRef]
  25. Liu, Z.; Wang, F.H.; Zhu, H. Enhanced dielectric properties of polyvinylidene fluoride with addition of SnO2 nanoparticles. Phys. Status Solidi R 2016, 10, 753–756. [Google Scholar] [CrossRef]
  26. Hoque, N.A.; Thakur, P.; Bala, N.; Kool, A.; Das, S.; Ray, P.P. Tunable photoluminescence emissions and large dielectric constant of the electroactive poly(vinylidene fluoride-hexafluoropropylene) thin films modified with SnO2 nanoparticles. RSC Adv. 2016, 6, 29931–29943. [Google Scholar] [CrossRef]
  27. Zha, J.W.; Meng, X.; Wang, D.R.; Dang, Z.M.; Li, R.K.Y. Dielectric properties of poly(vinylidene fluoride) nanocomposites filled with surface coated BaTiO3 by SnO2 nanodots. Appl. Phys. Lett. 2014, 104, 072906. [Google Scholar] [CrossRef]
  28. Tian, Q.H.; Zhang, Z.X.; Yang, L.; Hirano, S. Encapsulation of SnO2 nanoparticles into hollow TiO2 nanowires as high performance anode materials for lithium ion batteries. J. Power Sources 2014, 253, 9–16. [Google Scholar] [CrossRef]
  29. Bertoti, I.; Mohai, M.; Sullivan, J.L.; Saied, S.O. Surface characterization of plasma-nitrided titanium—An xps study. Appl. Surf. Sci. 1995, 84, 357–371. [Google Scholar] [CrossRef]
  30. Li, J.J.; Seok, S.I.; Chu, B.J.; Dogan, F.; Zhang, Q.M.; Wang, Q. Nanocomposites of ferroelectric polymers with TiO2 nanoparticles exhibiting significantly enhanced electrical energy density. Adv. Mater. 2009, 21, 217. [Google Scholar] [CrossRef]
  31. Lu, Y.Y.; Claude, J.; Norena-Franco, L.E.; Wang, Q. Structural dependence of phase transition and dielectric relaxation in ferroelectric poly(vinylidene fluoride-chlorotrifluoroethylene-trifluoroethylene)s. J. Phys. Chem. B 2008, 112, 10411–10416. [Google Scholar] [CrossRef]
  32. Lu, Y.Y.; Claude, J.; Neese, B.; Zhang, Q.M.; Wang, Q. A modular approach to ferroelectric polymers with chemically tunable Curie temperatures and dielectric constants. J. Am. Chem. Soc. 2006, 128, 8120–8121. [Google Scholar] [CrossRef]
  33. Brus, L. Electronic wave-functions in semiconductor clusters-experiment and theory. J. Phys. Chem. 1986, 90, 2555–2560. [Google Scholar] [CrossRef]
  34. Lee, E.J.H.; Ribeiro, C.; Giraldi, T.R.; Longo, E.; Leite, E.R.; Varela, J.A. Photoluminescence in quantum-confined SnO2 nanocrystals: Evidence of free exciton decay. Appl. Phys. Lett. 2004, 84, 1745–1747. [Google Scholar] [CrossRef] [Green Version]
  35. Xie, L.Y.; Huang, X.Y.; Li, B.W.; Zhi, C.Y.; Tanaka, T.; Jiang, P.K. Core-satellite Ag@BaTiO3 nanoassemblies for fabrication of polymer nanocomposites with high discharged energy density, high breakdown strength and low dielectric loss. Phys. Chem. Chem. Phys. 2013, 15, 17560–17569. [Google Scholar] [CrossRef]
  36. Li, Y.; Huang, X.Y.; Hu, Z.W.; Jiang, P.K.; Li, S.T.; Tanaka, T. Large dielectric constant and high thermal conductivity in poly(vinylidene fluoride)/barium titanate/silicon carbide three-phase nanocomposites. ACS Appl. Mater. Interfaces 2011, 3, 4396–4403. [Google Scholar] [CrossRef]
Figure 1. (a) TEM image of TiO2 nanowires; (b) TEM image, (c) HRTEM image and (d) XRD pattern of TiO2@SnO2 hybrid structure.
Polymers 12 00085 g001
Figure 2. XPS spectra of TiO2@SnO2 hybrid structure. (a) Ti 2p, (b) Sn 3d, (c) O 1s.
Polymers 12 00085 g002
Figure 3. XRD patterns of TiO2@SnO2 hybrid structure.
Polymers 12 00085 g003
Figure 4. SEM images of the cross-sectional of films. (a) poly (vinylidene fluoride-trifluoroethylene-chlorotrifluoroethylene) [P(VDF-TrFE-CTFE)] and filled with 10 vol.% (b) TO, (c) TS2, (d) TS4, and 5 vol.% (e) TS2, (f) TS4.
Polymers 12 00085 g004aPolymers 12 00085 g004b
Figure 5. XRD patterns of polymer and its composites filled with TiO2@SnO2 hybrid structure.
Polymers 12 00085 g005
Figure 6. Heating curves and cooling curves of polymer and composites with (a,b) 10 vol.% and (c,d) 5 vol.% TiO2-based nanowires.
Polymers 12 00085 g006
Figure 7. Frequency dependence of (a) dielectric constant, (b) dielectric loss, (c) conductivity, and (d) variation of dielectric constant and dielectric loss at 100 Hz of P(VDF-TrFE-CTFE) and its composites (5 vol.%).
Polymers 12 00085 g007
Figure 8. Frequency dependence of (a) dielectric constant, (b) dielectric loss, (c) conductivity, and (d) variation of dielectric constant and dielectric loss at 100 Hz of P(VDF-TrFE-CTFE) and its composites (10 vol.%).
Polymers 12 00085 g008
Figure 9. Breakdown strength of P(VDF-TrFE-CTFE) and its composites.
Polymers 12 00085 g009
Table 1. Tm, Tc and χc of polymer and its composites.
SampleTm (°C) χ c   ( % / Δ H m matrix ) Tc (°C)
P(VDF-TrFE-CTFE)122.8510092.15
5 vol.%TS2122.35104.5693.15
TS3122.35103.7492.98
TS4122.35104.1493.15
10 vol.%TO121.52100.0894.15
TS1122.02103.8594.15
TS2121.8599.2993.82
TS3121.3599.9293.82
TS4121.1896.0793.65

