3.2. Non-Isothermal Crystallization Experiments
In order to investigate the formation of the β modification in PVDF, various cooling–melting experiments were performed.
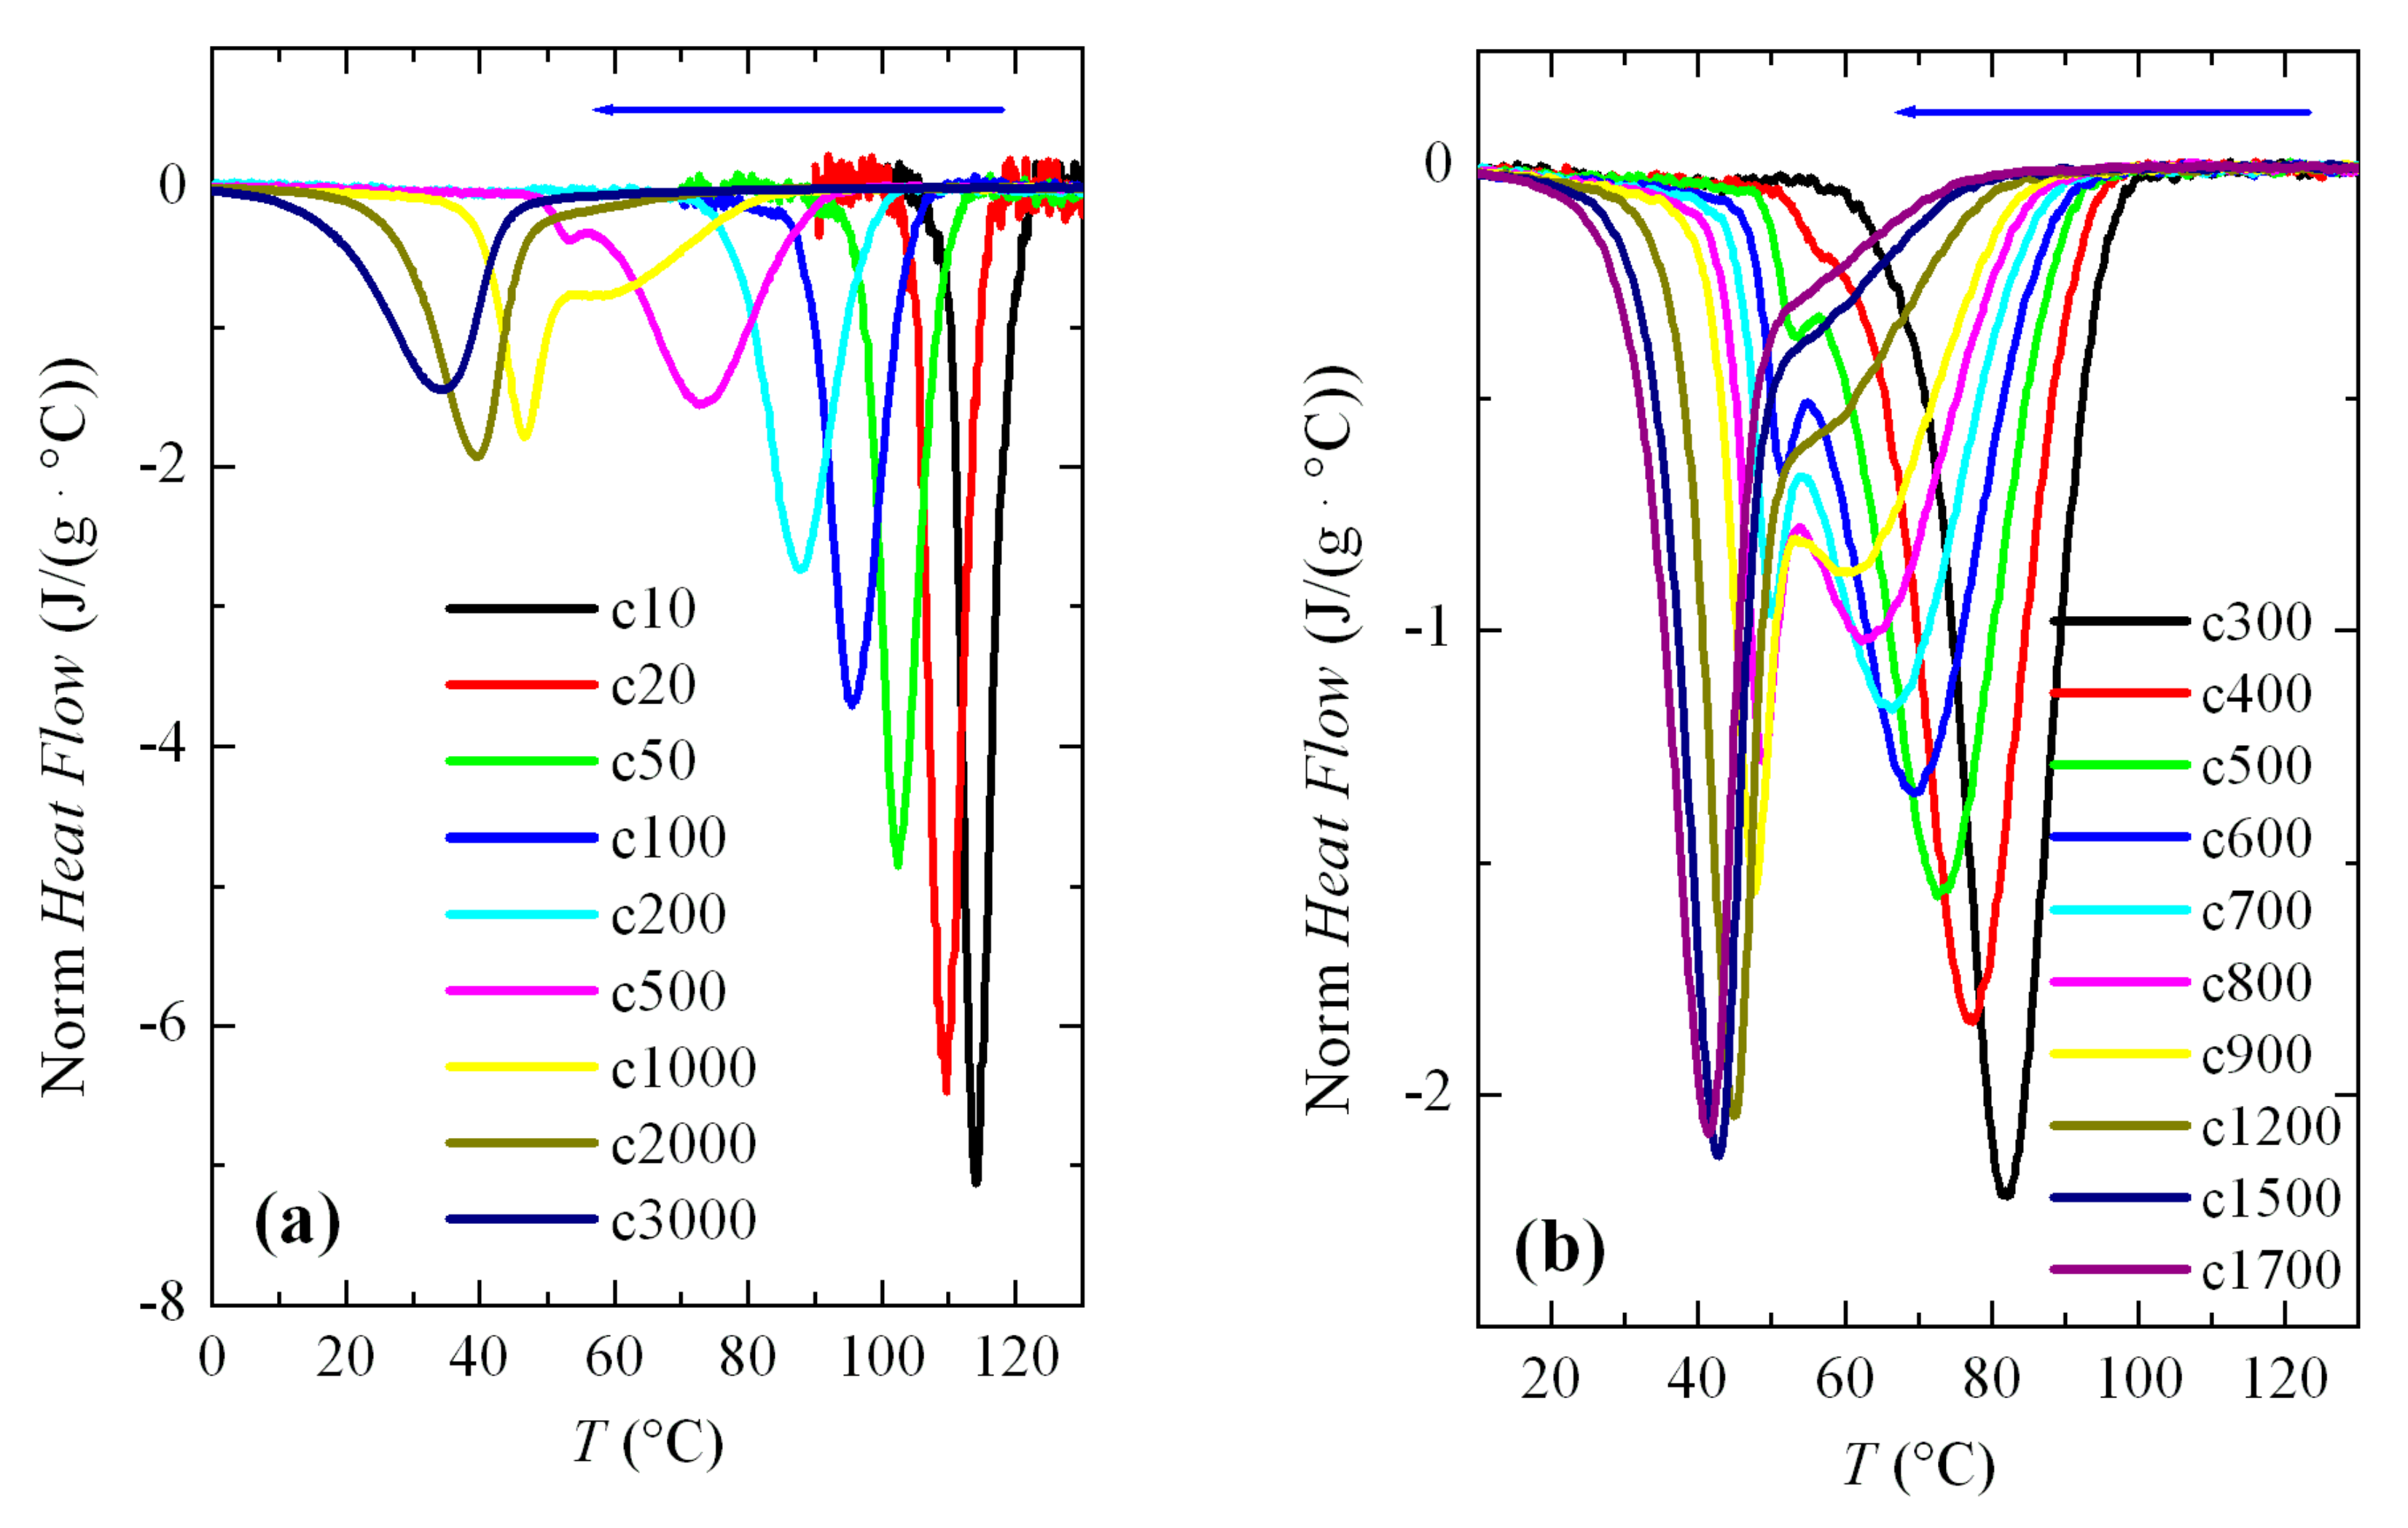
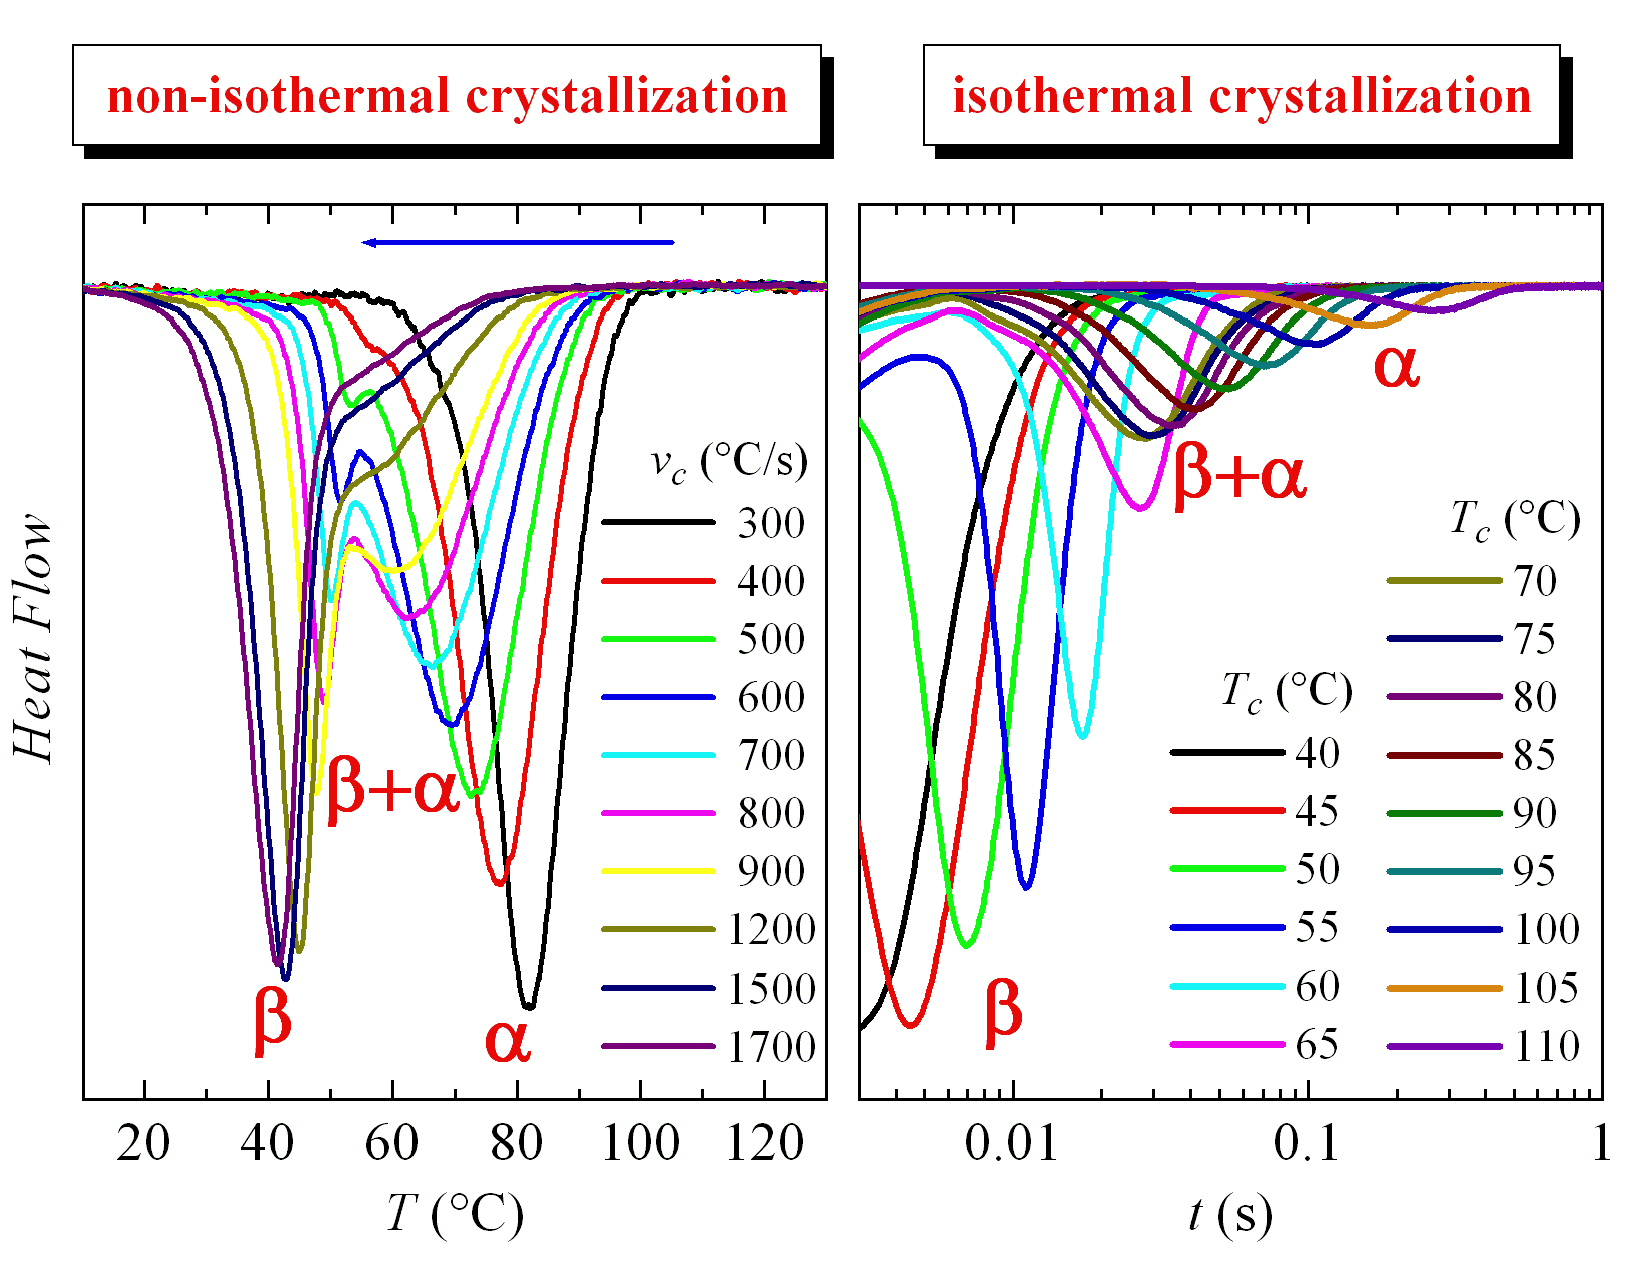
Figure 3a shows a series of FSC curves (normalized to sample weight and cooling rate) from cooling the PVDF sample at a wide range of rates, between 10 and 3000 °C/s. Two aspects are remarkable from
Figure 3a. Firstly, the signal-to-noise ratio deteriorated greatly at rates below 50 °C/s, although curves are perfectly quantifiable. Secondly, and more importantly, a second crystallization exotherm begins to appear at rates above 500 °C/s in the region of low temperatures, together with that observed at higher temperatures.
Intensity and width of this crystallization appearing at low temperatures increases as the cooling rate does. Thus, it starts just as a shoulder coexisting with a main exotherm located at higher temperature (see
Figure 3b), and becomes the only exothermic process observed at the rate of 3000 °C/s, as noticeable in
Figure 3a. Both peaks were moved to lower temperatures with an increasing cooling rate, their dependence on rate being smaller for that appearing at low temperatures. The high temperature exotherm was associated with crystallization of the α polymorph, while the peak at low temperature was ascribed to the formation of β crystals, as reported [
22,
23,
24,
25].
Figure 3b displays in more detail the region at rates ranging between 300 and 1700 °C/s where these two crystallization processes, formation of the α and β phases, coexist. It was observed that a small but appreciable amount of β phase was already detected at 400 °C/s. At higher rates, this exotherm was a very narrow peak with a low intensity. If the rate was raised further, the peak related to the α form began to involve less and less enthalpy and was transformed into a shoulder at the right temperature side of the β crystallization, i.e., the α crystallization becomes the secondary exotherm. These results agree rather well with those obtained by other groups [
22,
23,
24,
25]. Some differences found can be attributed to the distinct equipment used, self-made versus commercial calorimeter, as well as variations in the weight of the PVDF samples. In fact, cooling experiments performed at similar rates show lower crystallization temperatures,
Tc, in our research compared with those for the specimen reported, for instance in [
22]. The weight of that sample was 460 ng and ours weighed 78 ng.
All the cooling curves represented in
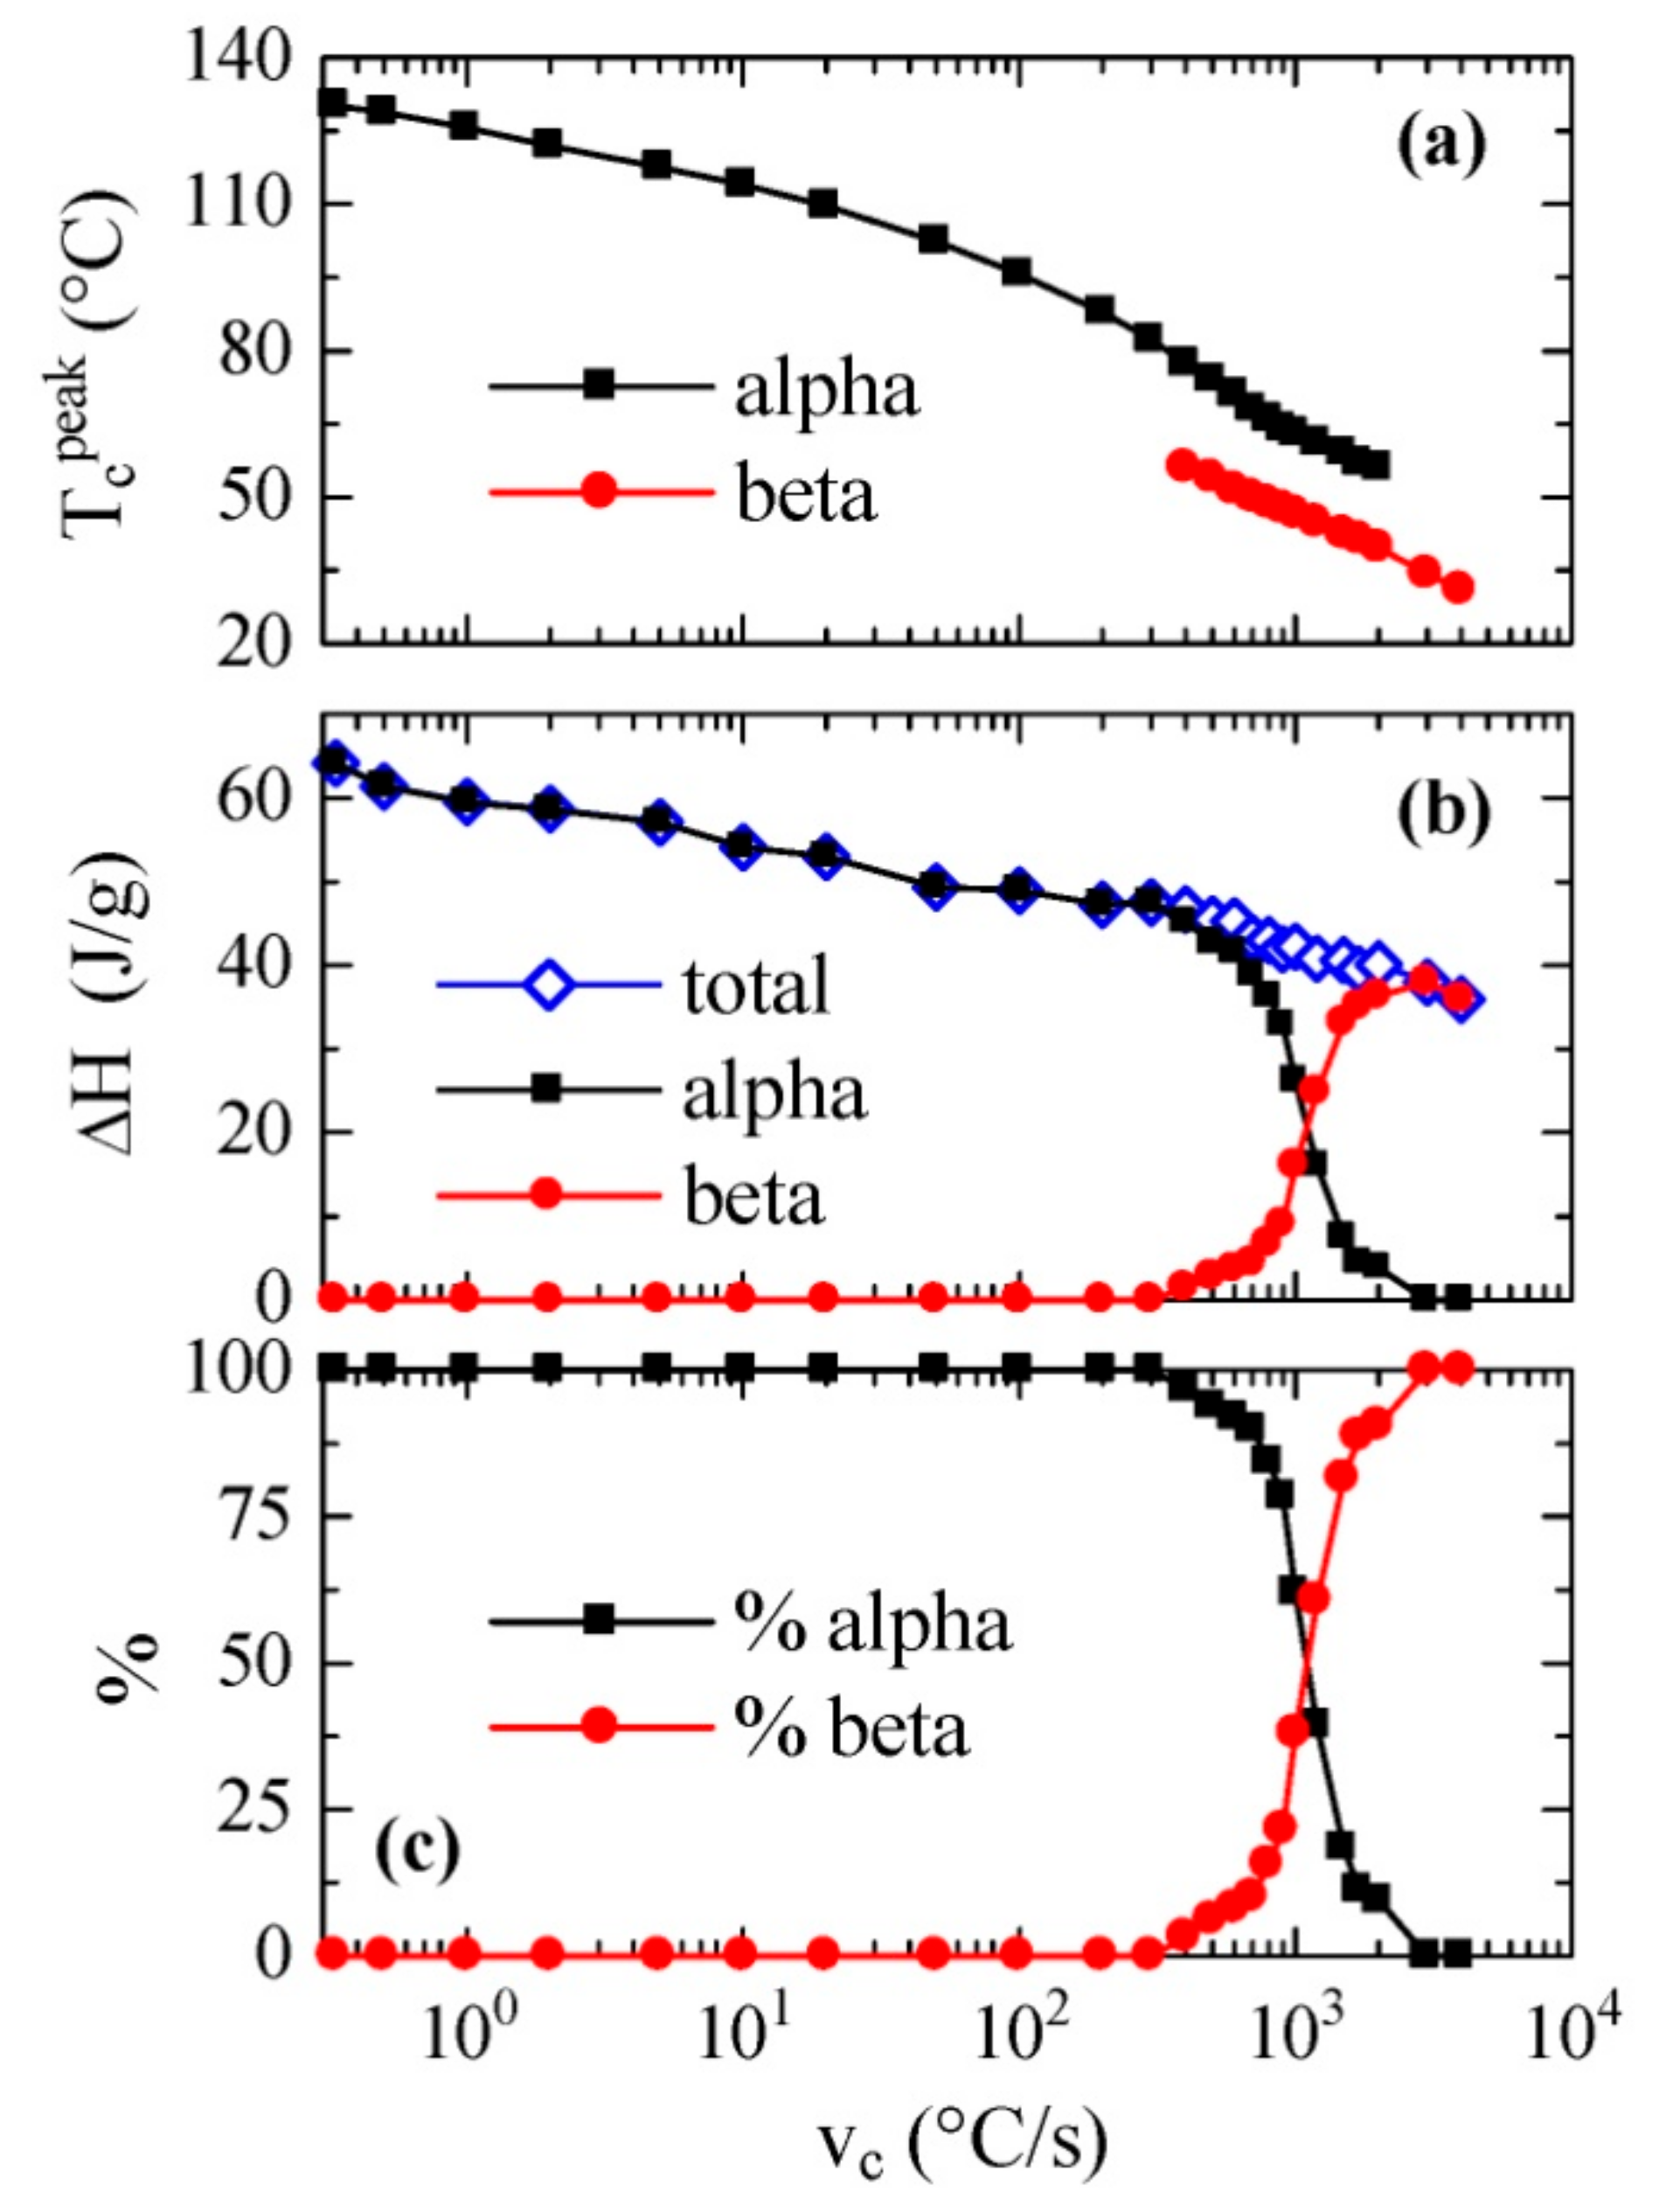
Figure 3, together with some others performed using FSC but at much smaller rates (not shown), typical of conventional DSC, have been analyzed and the values of the crystallization peak or peaks and their corresponding enthalpies have been achieved. The results are depicted on a logarithmic scale in
Figure 4 as a function of the cooling rate.
Figure 4a shows the temperature variation of the crystallization exotherm or exotherms. It is noticed that a fairly linear variation is observed for the low temperature exotherm, assigned to the β phase, with values of peak crystallization temperatures ranging between approximately 60 and 30 °C with a decreasing cooling rate. This trend is somewhat different to those described previously [
22,
23], because a constant value was reached at either the high or low temperatures of the rate interval, respectively. Nevertheless, it is analogous with that shown for neat PVDF in [
25], where commercial equipment was also used.
On the other hand, variation in the peak temperature corresponding to the α phase was almost parallel along the coexistence zone, although this exotherm was detected at temperatures approximately 15–20 °C higher than those observed for the β phase.
Figure 4b shows the dependence on cooling rate of both the total enthalpy of crystallization and the enthalpy of each of its two components. It is noticeable that the total enthalpy exhibited a continuous decrease as cooling rate increased, without very evident discontinuity when the β modification was formed. This means that there were not very significant differences between the enthalpies of both polymorphs α and β. Furthermore, the β form began to appear at rates greater than 400 °C/s, and its enthalpy proportion clearly increased progressively with the cooling rate.
The values found for the α and β polymorphs are in agreement with those previously reported for neat PVDF [
25] but they are significantly higher than those obtained previously using a self-made thin-film chip calorimeter [
22,
23].
The percentage of each phase as a function of rate is represented in
Figure 4c. It is remarkable that the 50% of each one of them was obtained at an approximate speed of 1100 °C/s, while, as mentioned, the α phase was only obtained at rates below 400 °C/s, and only the β polymorph was observed at rates above 3000 °C/s.
The melting processes after those crystallization experiments represented in
Figure 3 are shown in
Figure 5.
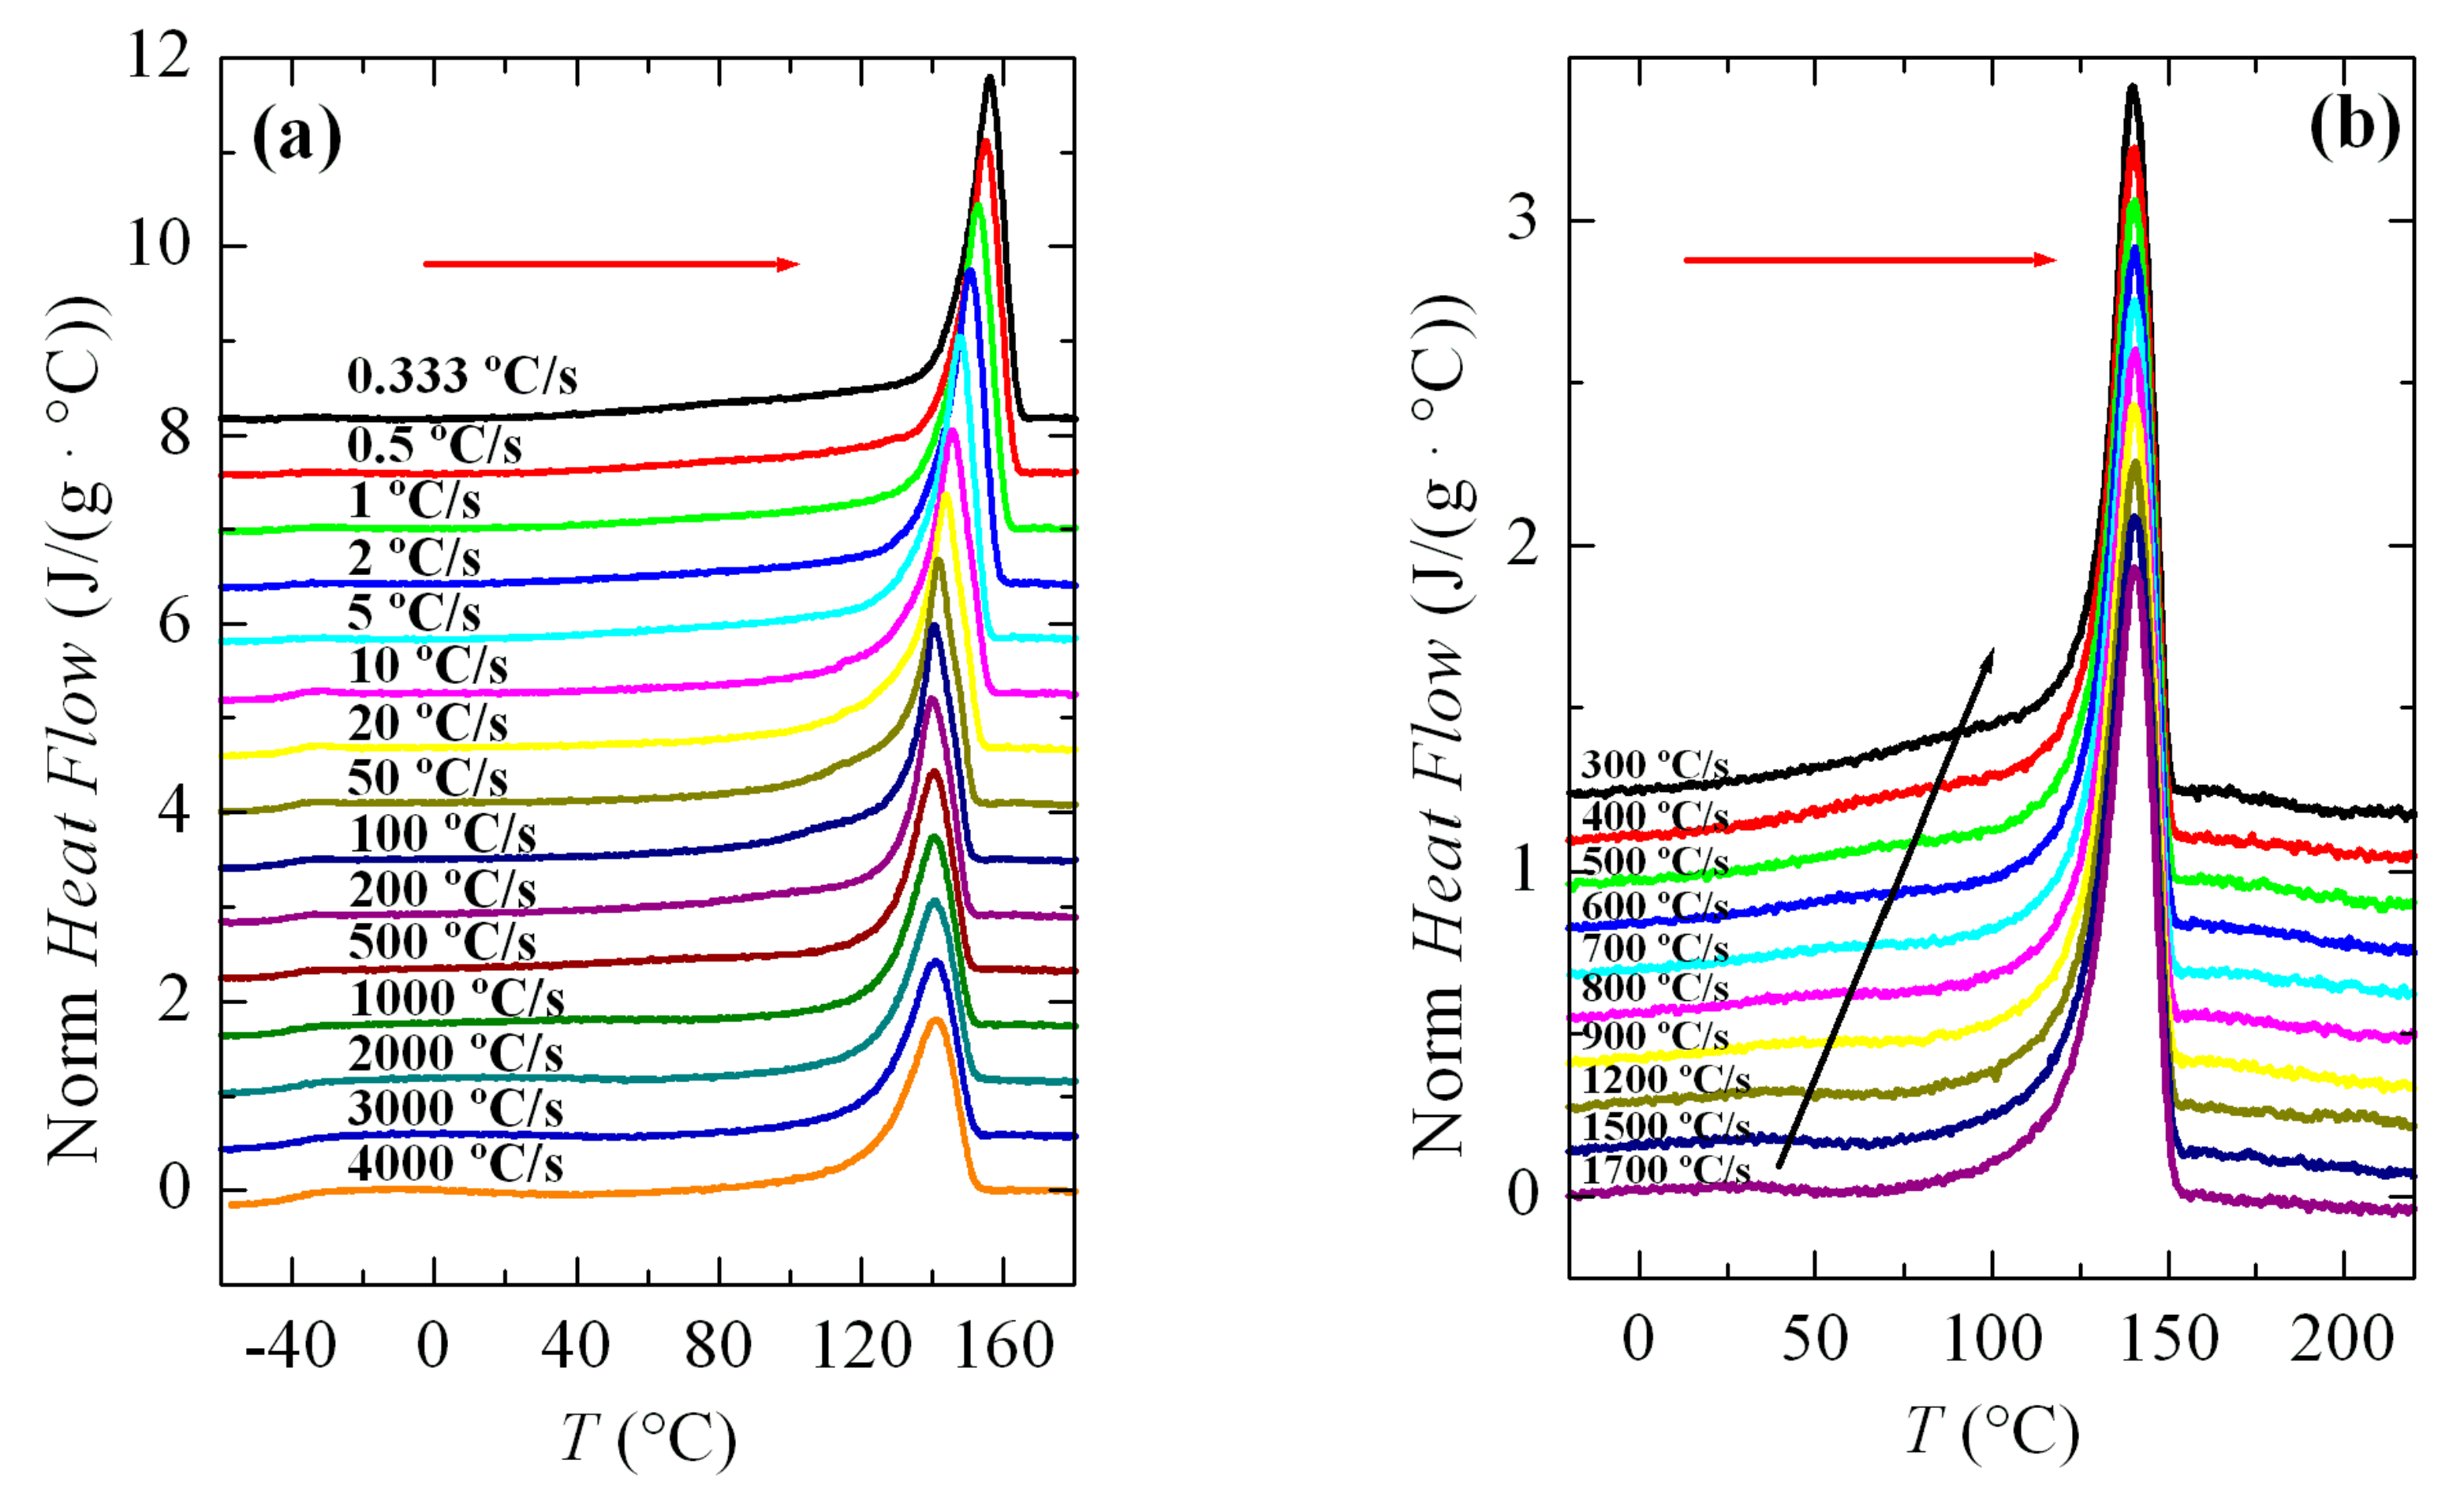
Figure 5a shows that the main melting temperature,
Tm, remained practically constant between rates from 4000 to 100 °C/s, and there was only a clear dependence of the melting temperature on cooling rate below about 50 °C/s. This tendency seems to indicate that the constancy in the maximum temperature of the main endotherm at high rates is due to recrystallization phenomena. We will return to this topic later.
Another aspect to point out in
Figure 5a is the observation of the glass transition temperature,
Tg, at around −40 °C, which is especially noticeable at higher rates.
Figure 5b shows the melting curves run at 500 °C/s for specimens crystallized at rates where both α and β polymorphs were developed. In this interval, the main melting point remained unchanged with the cooling rate. Nevertheless, because this figure is more enlarged than
Figure 5a, a small endotherm (indicated by the black arrow) was observed, which would correspond to the melting-recrystallization of the crystals initially formed at those high rates. Accordingly, the main endotherm was ascribed to the melting of those recrystallized entities but not from the original ones. If the arrow was followed, a dependence on cooling rate would be observed for the initial melting process.
3.3. Isothermal Crystallization Experiments
One of the fundamental premises for studying isothermal crystallization is that cooling from the melt to the crystallization temperature must be fast enough to avoid crystallization on cooling down. Considering the limit for cooling rates in the equipment used (maximum cooling rate is 4000 °C/s), it was decided that a rate of 3000 °C/s would be applied for carrying out these experiments. Taking into account these considerations, it follows that the minimum crystallization temperature that could be analyzed was around 40 °C (see below). Nevertheless, there is no information of PVDF isothermal crystallization performed at this temperature, because the isothermal experiments reported in the literature for this polymer were carried out at various temperatures ranging from 60 to 180 °C [
22,
23].
Regarding the upper limit for the isothermal experiments, it must be remembered that crystallization rate is very slow at temperatures close to Tm, so there will be a practical compromise limit between the total crystallization time and the signal-to-noise ratio for the corresponding isotherm.
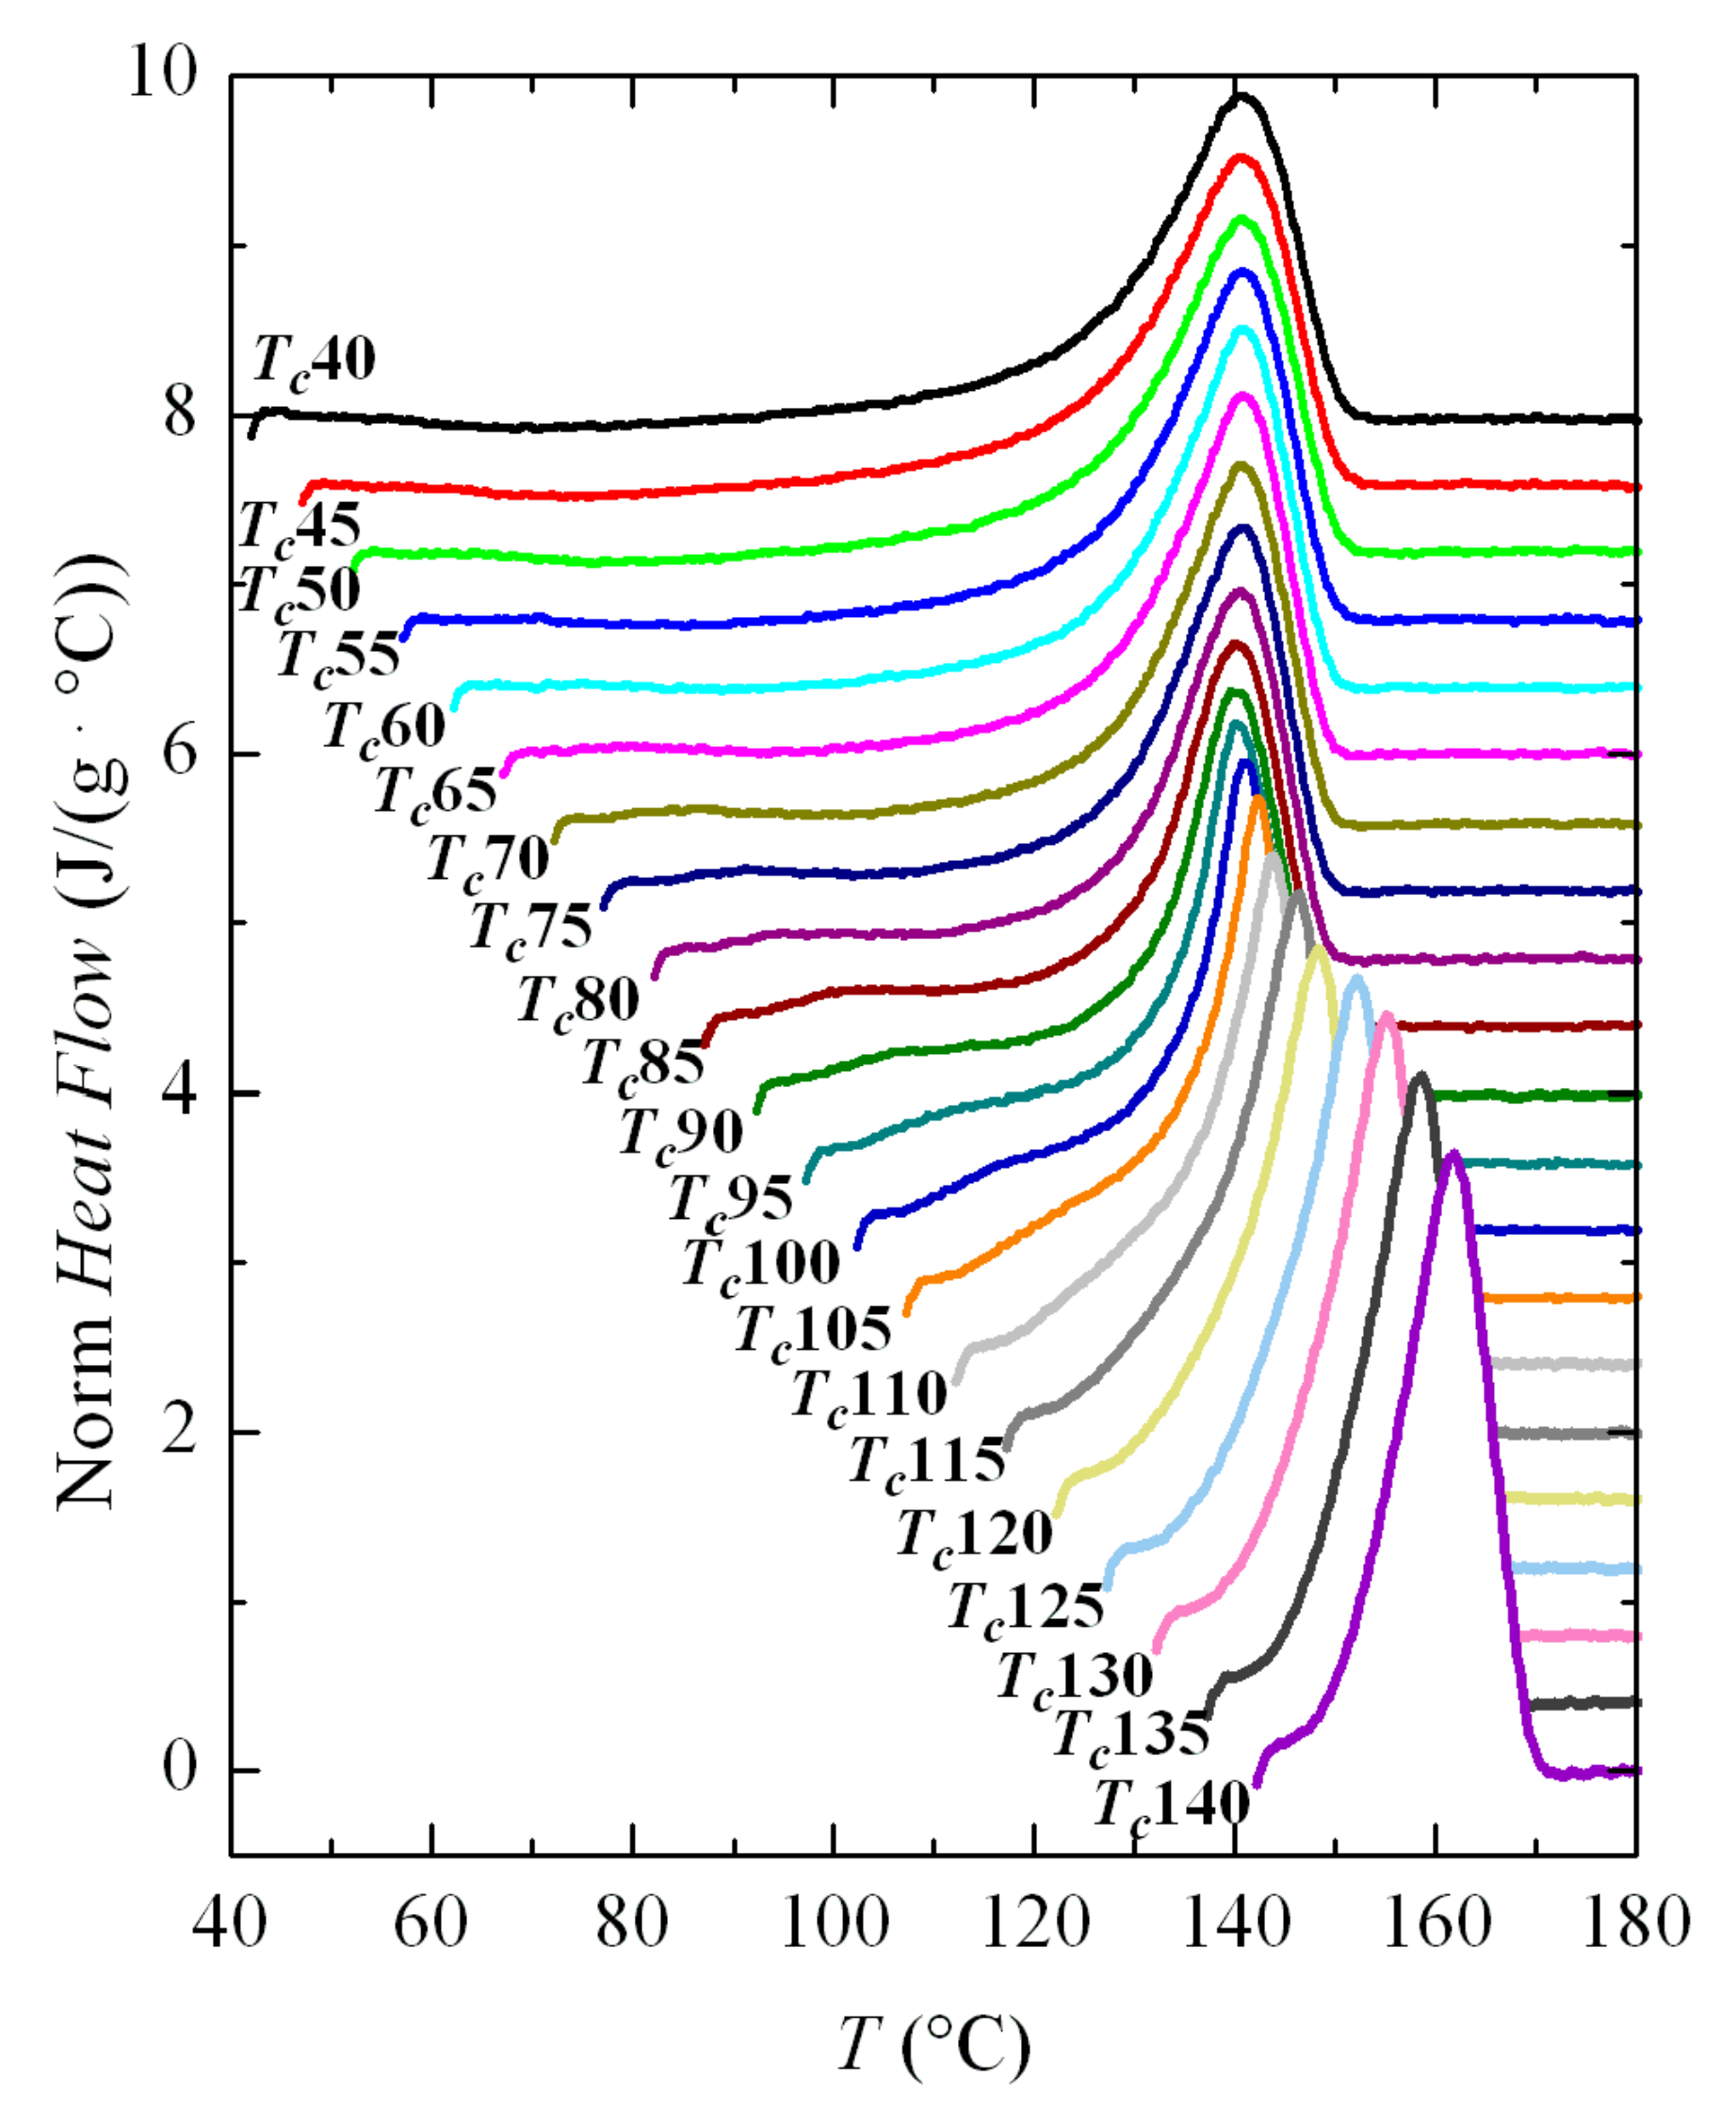
Therefore, the crystallization isotherms of PVDF in the temperature range from 40 to 110 °C have been analyzed by FSC. The corresponding isotherms can be seen in
Figure 6. Despite the fact that part of the sample was crystallized at 40 °C before isothermal equilibrium, three distinct regions are clearly observed in this figure.
The first one takes place up to a Tc of approximately 60 °C and crystallization time increases exponentially with temperature. Later, an intermediate zone is noticed in which a change of trend is observed in the isotherm curves, approximately between 65 and 75 °C; and, at higher temperatures, a third region is deduced where again an exponential increase in the crystallization time is observed with Tc. Considering the previous experiments, the most feasible explanation is that the first region concerns exclusively the formation of the β phase, while the α crystals will be obtained in the third region; coexistence of both polymorphs is presumed in the intermediate region.
These intervals are coincident in certain ways with those derived from the non-isothermal crystallization results (see
Figure 3 and
Figure 4). It was found that the maximum temperature at which the exotherm corresponding to the β phase appeared was precisely 60 °C. However, that bimodal behavior, ascribed to the presence of both the α and β phases, is now not observed in the isotherms. Consequently, evaluation of the percentage for each phase was not possible in this temperature interval of eventual coexistence of both polymorphs for these isothermal experiments.
An approximate description of the crystallization kinetics has been carried out by means of the Avrami theories [
32,
33,
34], widely used for describing the crystallization kinetics of polymers, despite the fact that this model was developed for metals. Analysis of the kinetics was carried out with stationary Avrami equation [
32,
33,
34]:
where
XC(
t) is the material weight fraction that crystallizes at time
t;
K is the rate constant, where terms dependent on temperature are included together with information related to diffusion and nucleation rates; and,
n is the Avrami exponent, which is a constant involving the types of processes that take place during nucleation and growth.
Determination of all of these parameters was carried out by conversion of the Avrami equation (numbered as (1)) into a double logarithmic form:
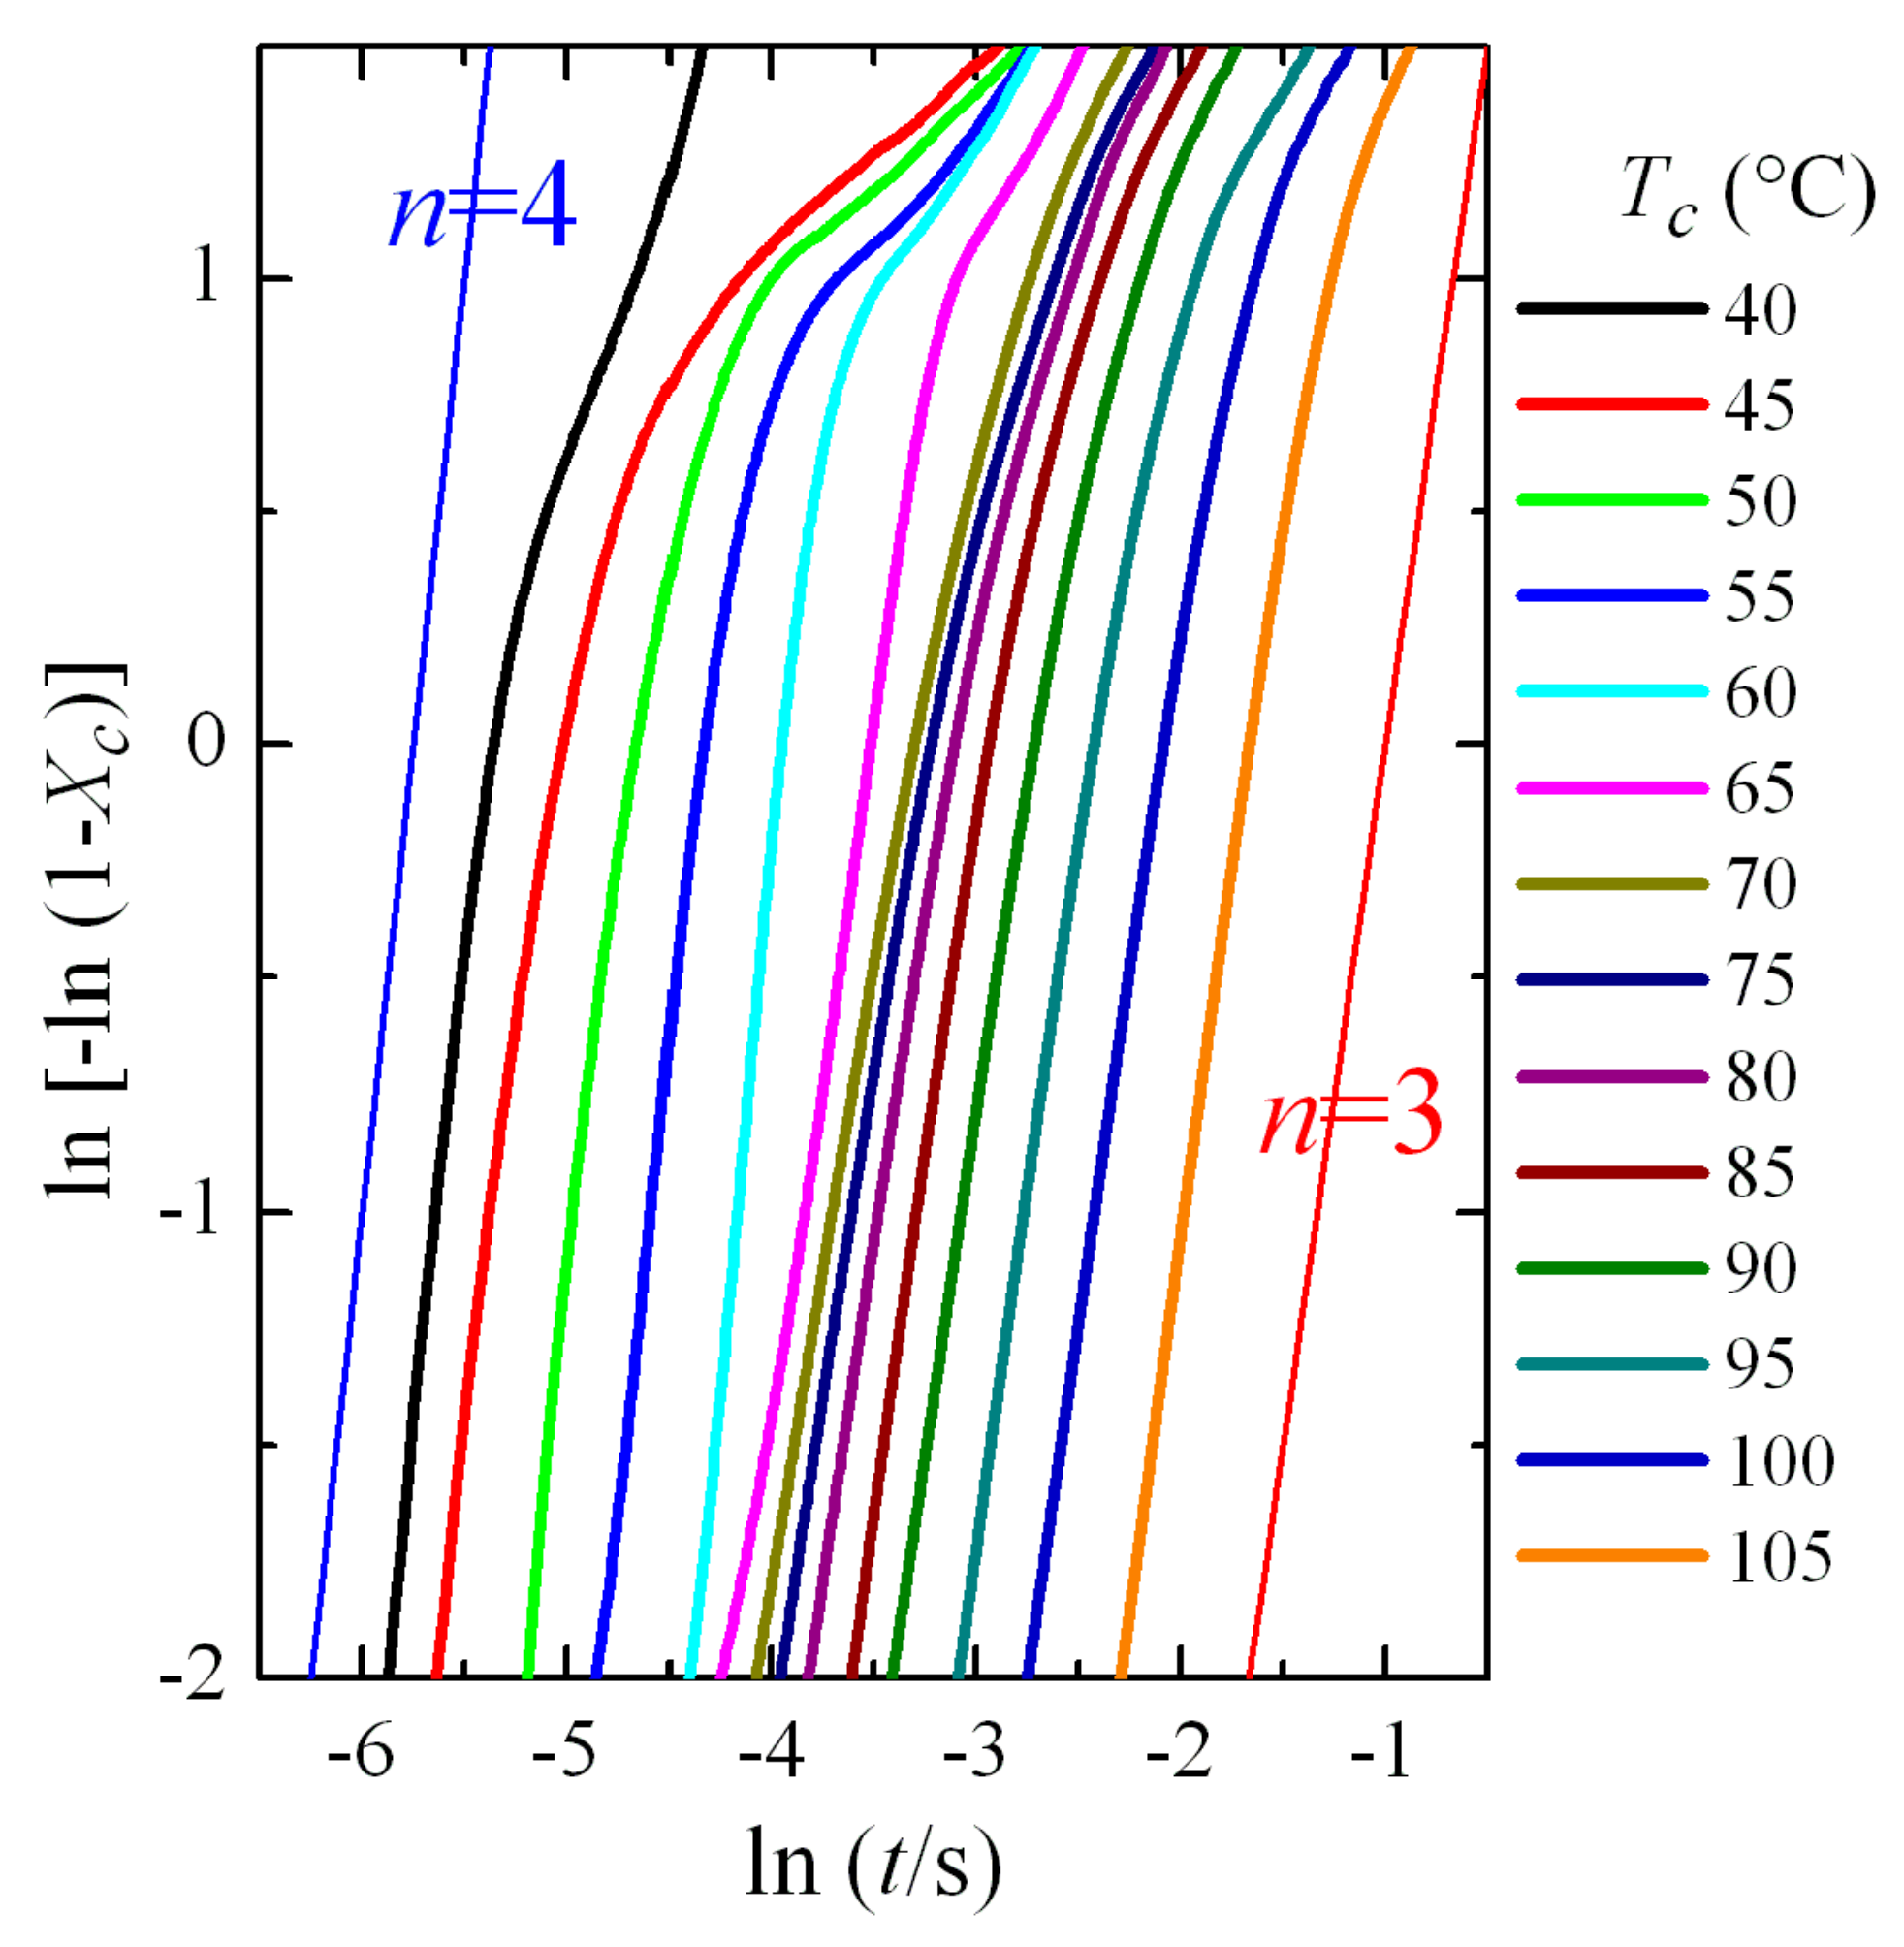
This Avrami double logarithmic representation is depicted in
Figure 7. The aforementioned three regions are more clearly noticeable. Furthermore, a change in the Avrami exponent is also deduced, which shifts from being
n = 4 at low crystallization temperatures to
n = 3 at the highest ones. These values seem to indicate that, assuming three-dimensional growth, the process passes from homogeneous nucleation at low crystallization temperatures (formation of the β modification) to heterogeneous nucleation at high temperatures (polymorph α). We will see later in more detail the analysis of the Avrami parameters as a function of the crystallization temperature and the crystal modification obtained.
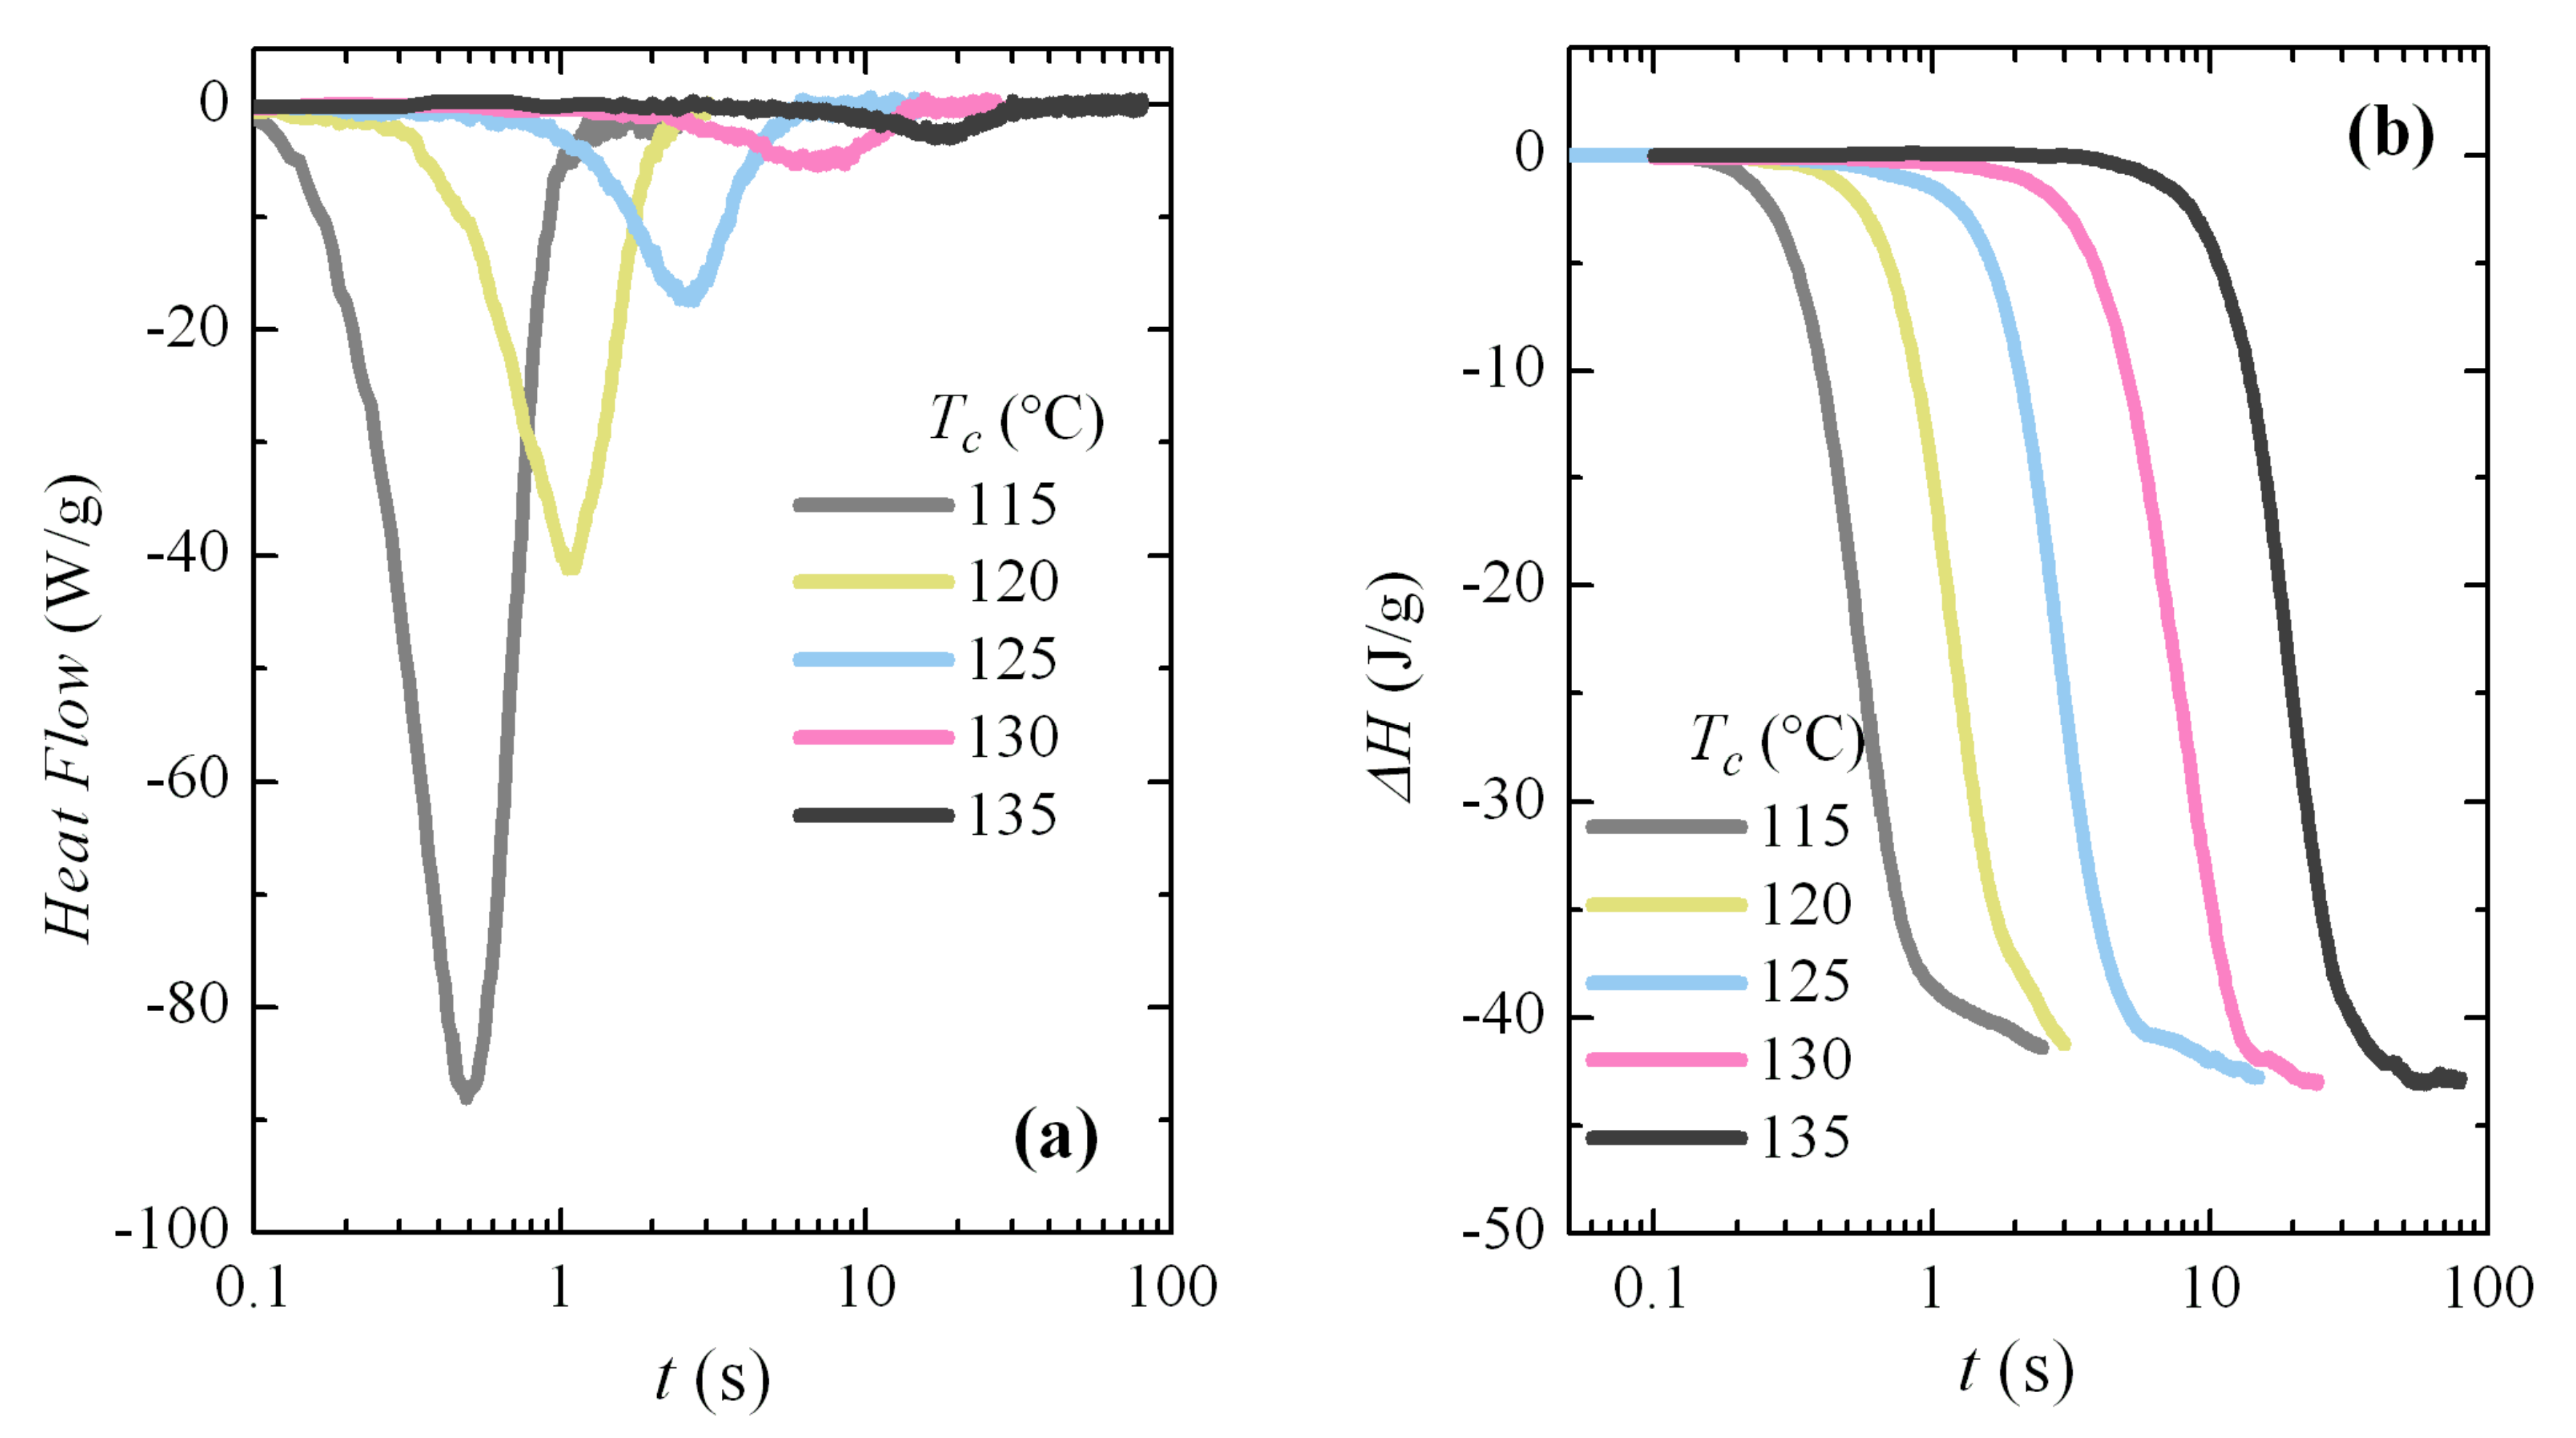
Additional isothermal crystallization experiments have been carried out at higher temperatures. A progressive deterioration for the signal-to-noise ratio was expected with decreasing crystallization rates, as seen in
Figure 8a. However, independently of the increase in noise, the curves can be analyzed with relative simplicity; for instance,
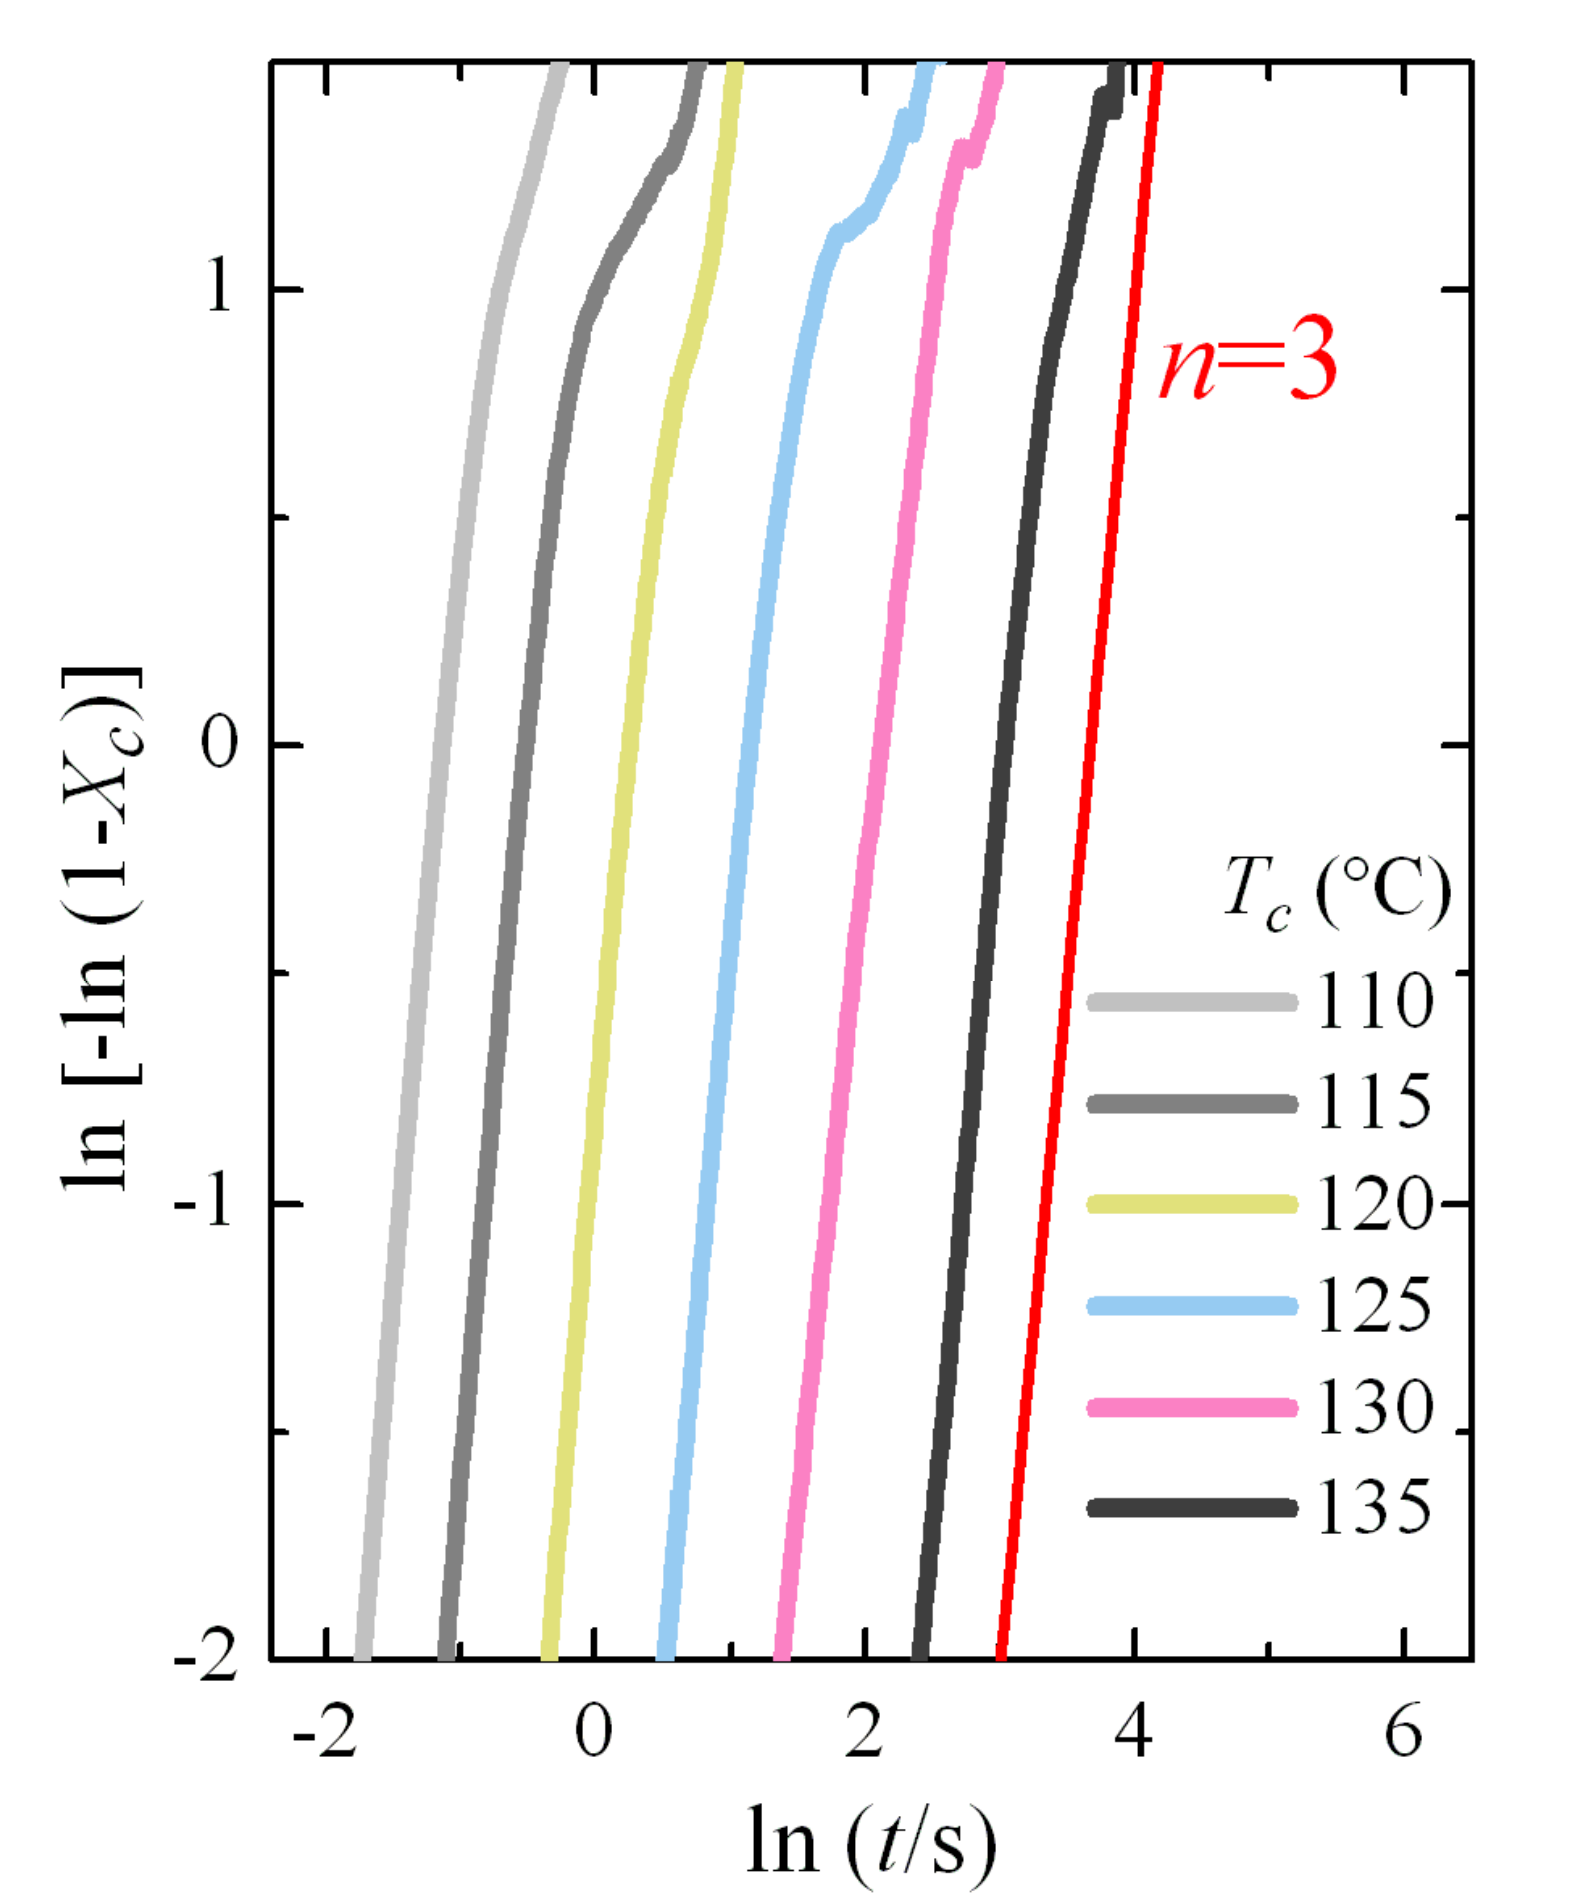
Figure 8b shows the variation in enthalpy with crystallization time for these isotherms. The typical sigmoidal shape is observed and the increase in the induction period is clearly deduced from them. The noise is especially evident at the highest times for each isotherm. The Avrami double logarithmic plot for these crystallization isotherms is shown in
Figure 9. As expected, the Avrami exponent is close to
n = 3 in this temperature range, where only the α modification is formed.
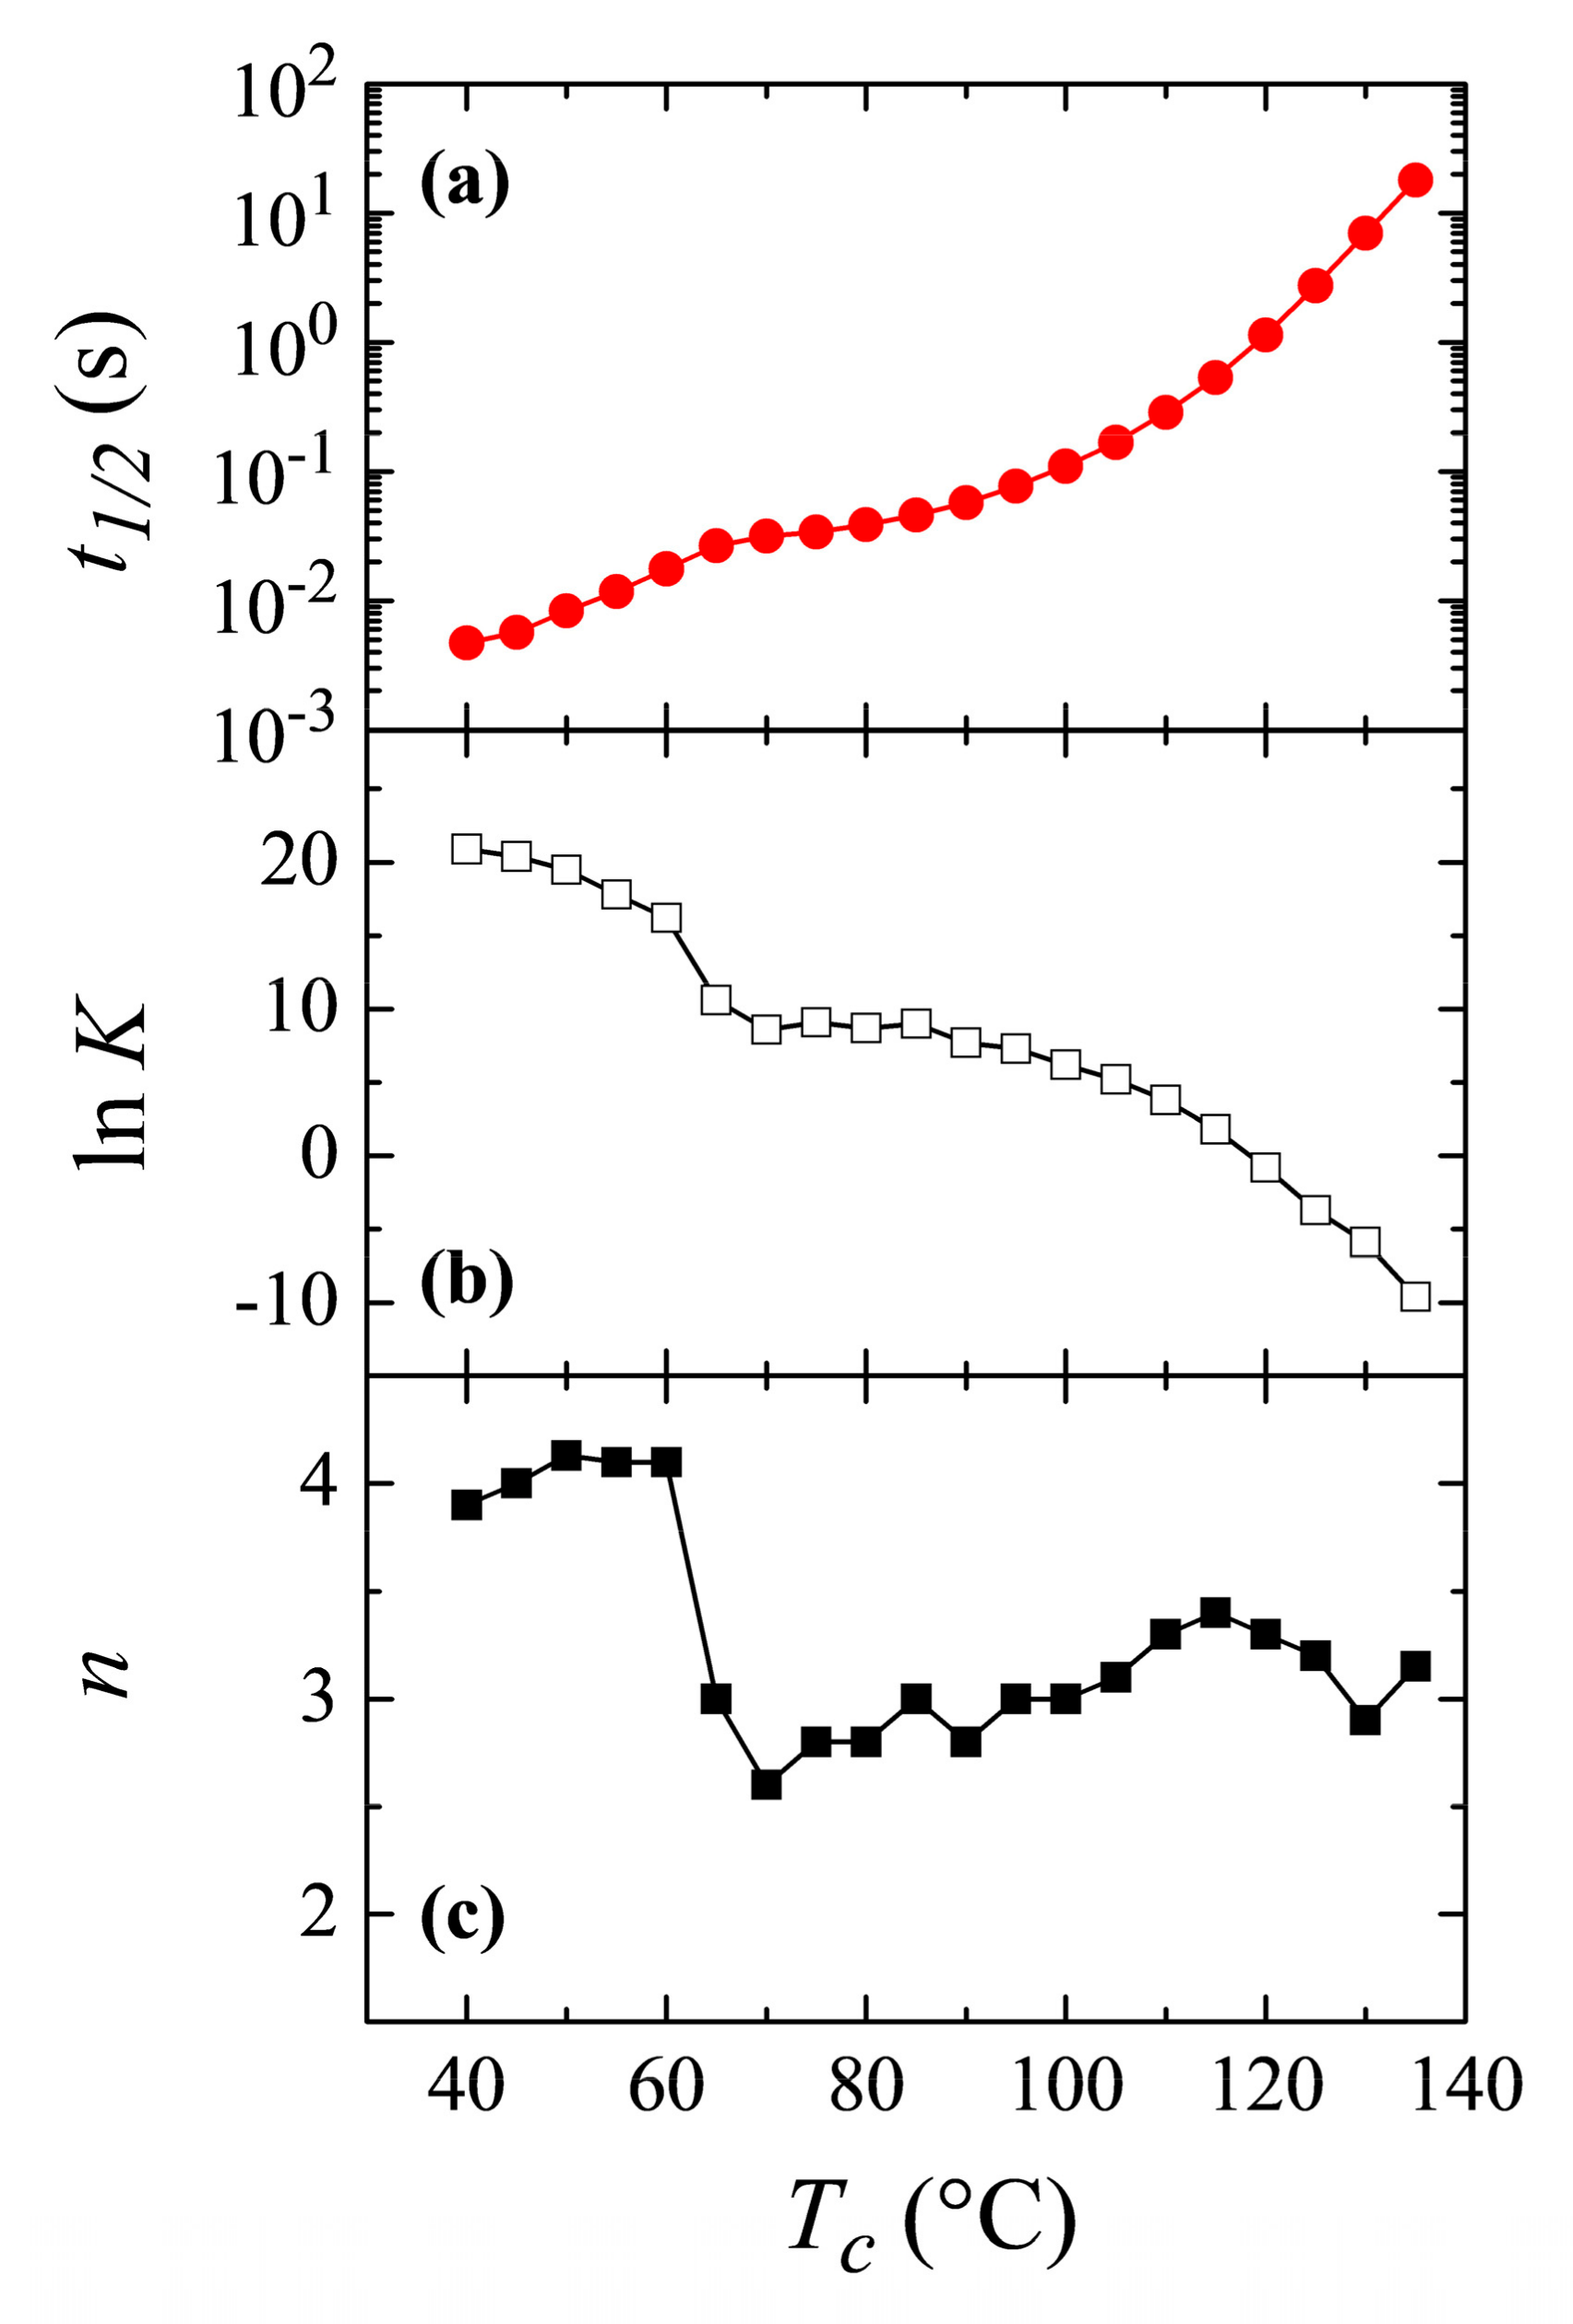
The Avrami parameters obtained from all the above crystallization isotherms are presented in
Figure 10b,c, together with the time required to reach 50% of the transformation,
t1/2 (
Figure 10a), as a function of the crystallization temperature. Both
t1/2 and
K constitute a measure of the rate of the process (actually the inverse of
t1/2 represents the crystallization rate), while the exponent
n is related to the nucleation and growth mode, as has been commented.
Crystallization rate exhibits a clear inflection point at temperatures around 60–65 °C, with higher rates in the region of low temperatures. It follows, evidently, that crystallization rate for the β modification is faster than that for the α polymorph and, because of this reason, the β form is the one achieved at low temperatures, being kinetically favored at those temperatures.
Regarding variation of the Avrami
n exponent,
Figure 10c clearly shows what was deduced and commented above: a change in the Avrami exponent is noticed. It takes the approximate value of 4 at low temperatures, exhibits a clear discontinuity at the temperature interval of 60–65 °C, and finally reaching values of around
n = 3 at higher temperatures. Therefore, the change in the nucleation/growth mode discussed above is clear, indicating, most probably, the transformation from a homogeneous nucleation at low crystallization temperatures, where formation of the β modification occurs, to a heterogeneous nucleation at high temperatures where polymorph α is attained. It has to be considered, however, the aforementioned problem of applicability of the Avrami model for the crystallization of polymers, so it is not straightforward to deduce a physical meaning of the Avrami exponent, and a change in its value indicates mainly that the crystallization does not obey to a single-step equation. Anyway, the clear discontinuities observed in
Figure 10 are, no doubt, indicative of the temperature interval where the formation of either the α or β polymorphs occurs.
Bimodality, derived from a possible coexistence of both the α and β phases, is not noticed in the crystallization isotherms. From the variation of Avrami exponent, seen in
Figure 10c, it seems to be deduced that coexistence of the two polymorphs only occurs in a narrow range of temperatures, between 60 and 70 °C in isothermal crystallization experiments.
Melting curves after these crystallizations are depicted in
Figure 11. As in the case of non-isothermal cooling, the main melting endotherm remains unchanged at low crystallization temperatures, and only a clear dependence of
Tm on
Tc is observed for the
Tc values above around 100 °C. The interpretation is again that there is a rapid process of fusion-recrystallization of the initial crystallites, which are very imperfect, so the main endotherm will correspond to the fusion of these recrystallized entities, and not the original ones. That occurs at the actual melting rate used (500 °C/s).
Higher melting rates have been tested, but it was not possible to avoid recrystallization and, therefore, observation of the true melting endotherm of these very imperfect crystallites did not become available in the FSC experiments performed because of limitations of the equipment. Unfortunately, the region in which these features occur completely involves the entire temperature range in which the β modification is developed, so it was not possible to attain information about the true melting temperatures of these β crystallites.
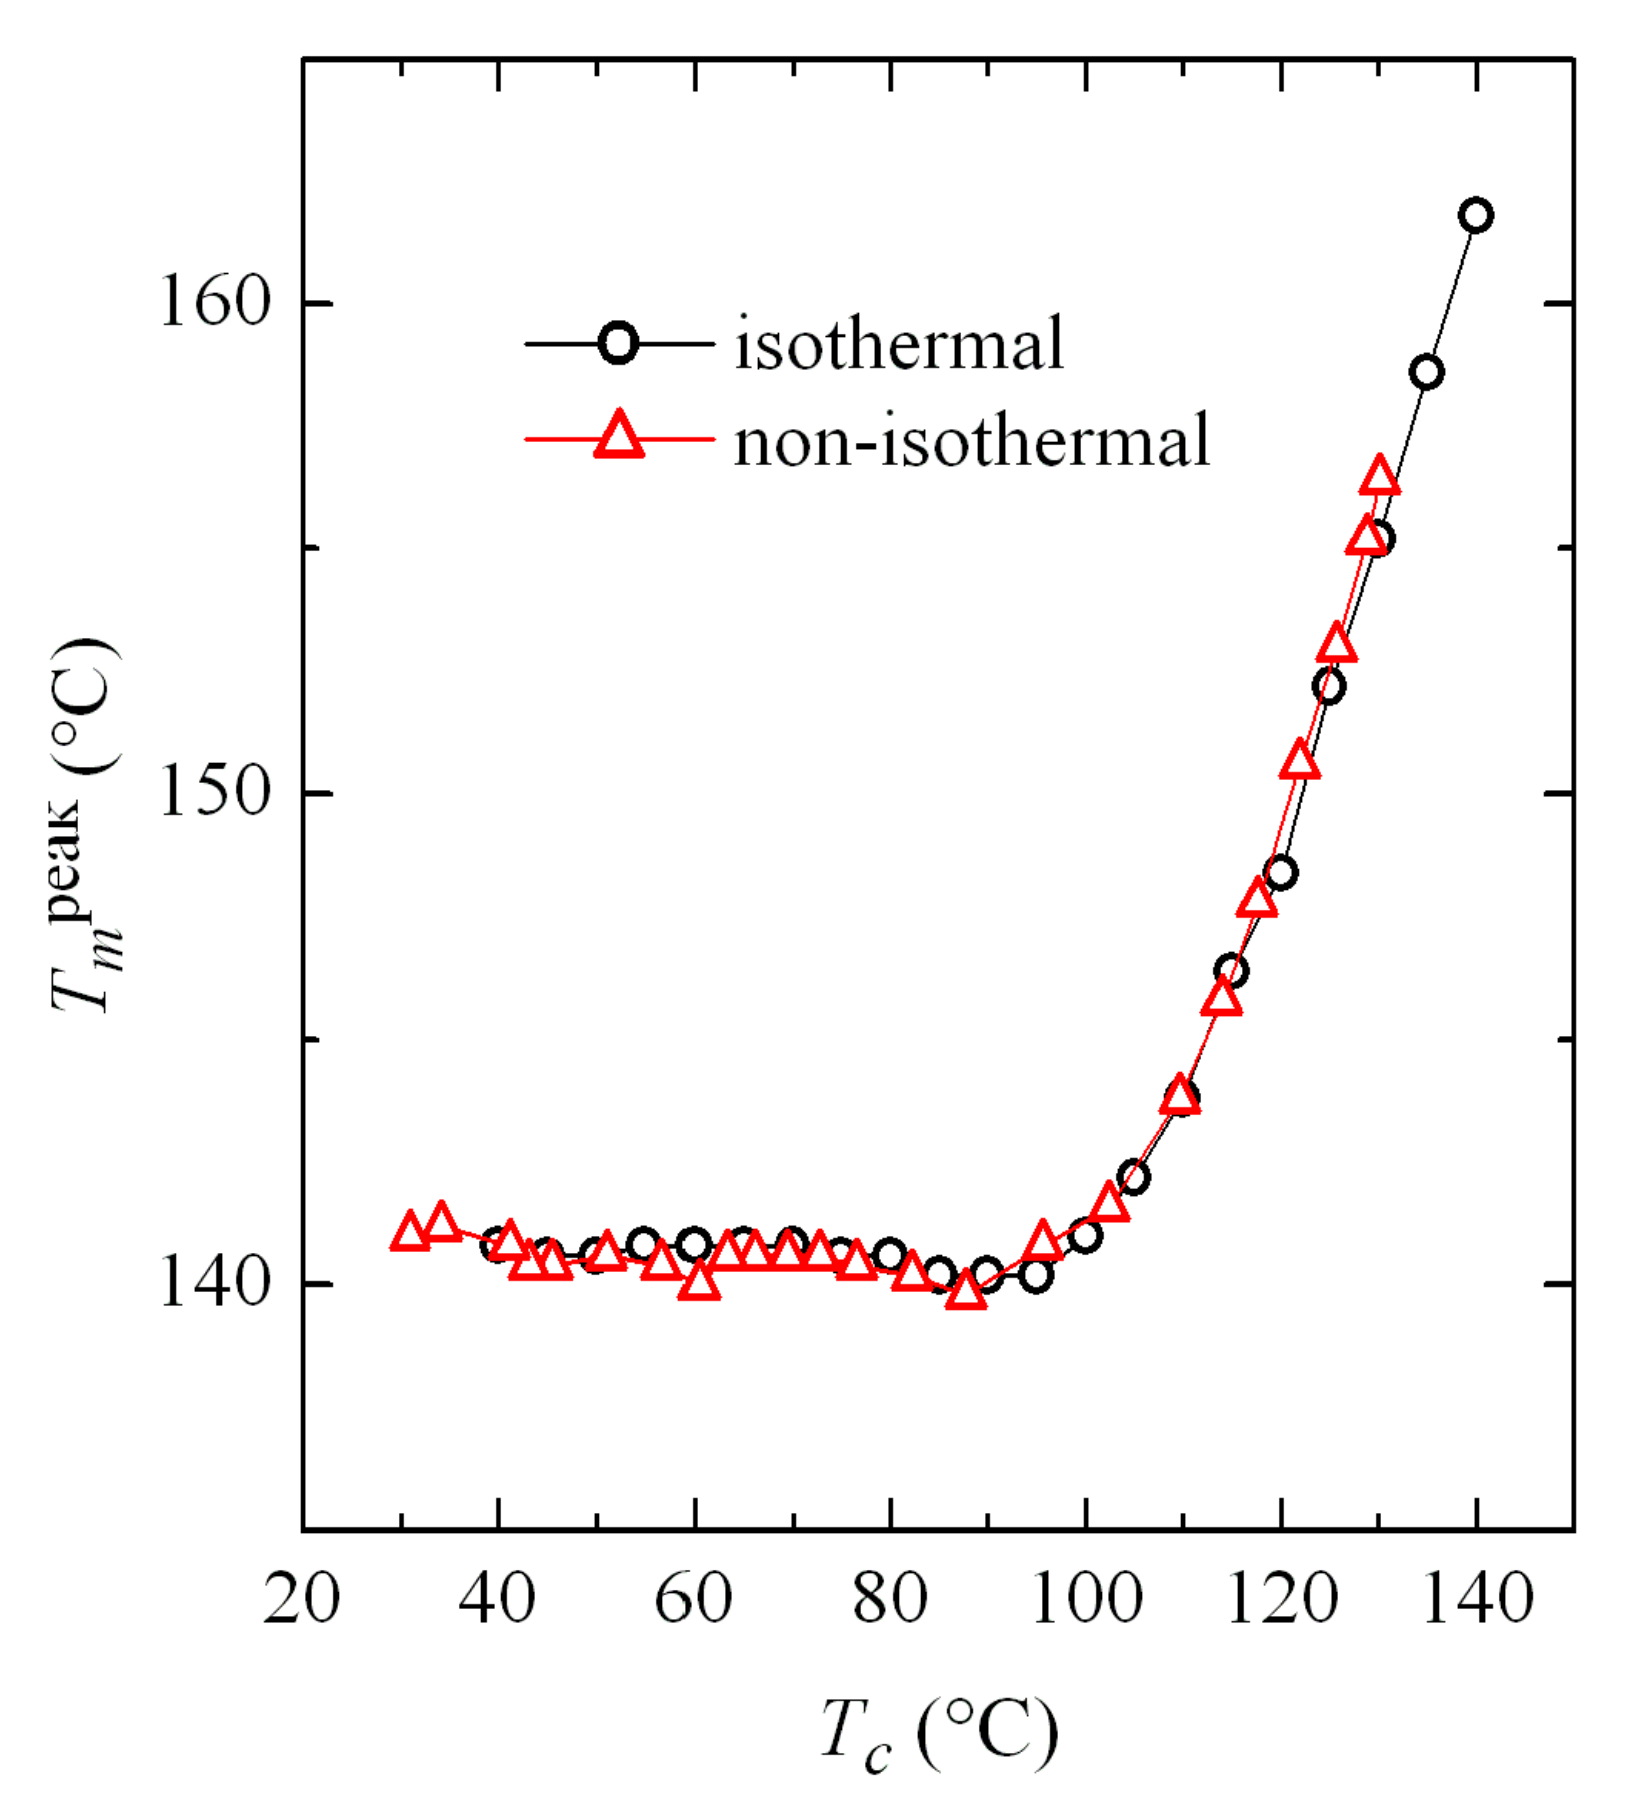
Comparison of the results obtained in both isothermal and non-isothermal crystallizations turns out very interesting.
Figure 12 shows the dependence on crystallization temperature of the melting temperature from the main endotherm (see
Figure 5 and
Figure 11). This crystallization temperature is obvious in the case of isothermal experiments. However, it is not so simple for non-isothermal tests, because the sample actually crystallizes in a wide range of temperatures. Accordingly,
Tc has been assigned as the most probable value defined by the minimum of the crystallization exotherm peak. However, there is a relatively broad temperature interval in which the α and β phases coexist, as observed in
Figure 4a, where the variation of
Tc with cooling rate was represented. In those cases, a weighted average can be taken as the value of
Tc, considering the percentage obtained for each phase, which also appeared in
Figure 4c.
Results represented in
Figure 12 show an excellent agreement for the values obtained in both types of crystallization, which allows the extrapolation of information between both kinds of tests: isothermal and non-isothermal.
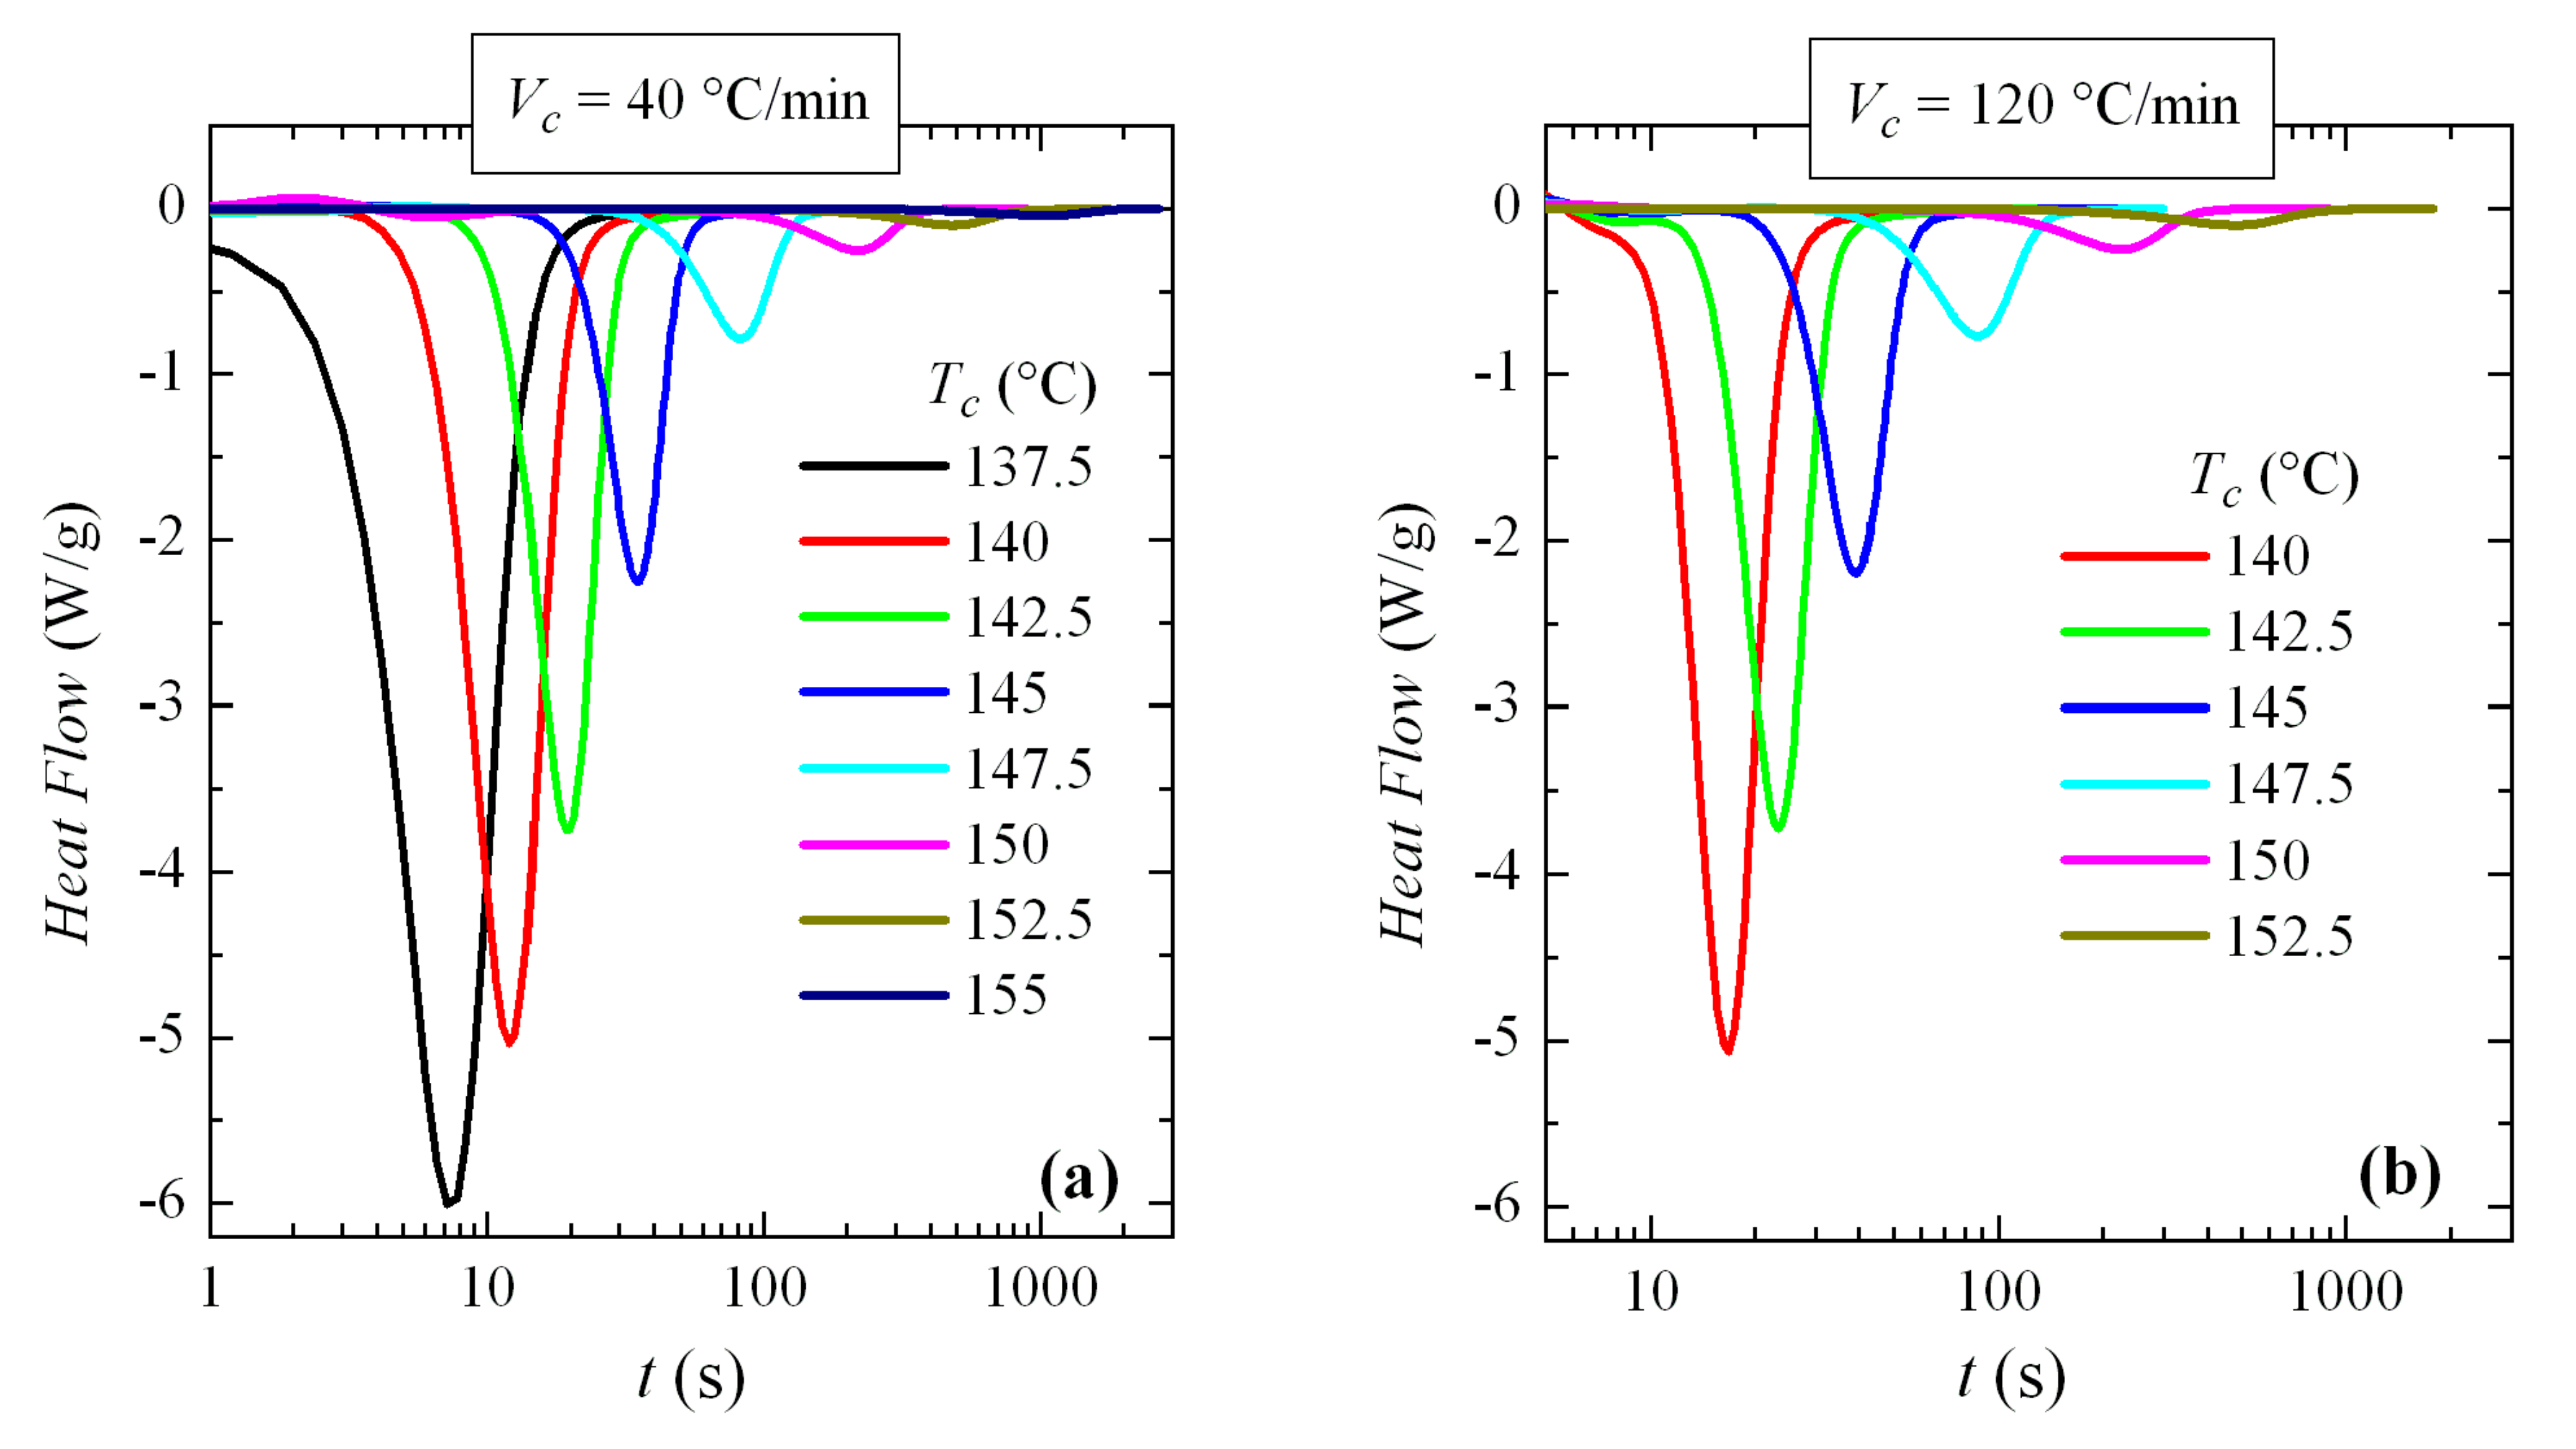
Isothermal crystallization of PVDF has also been studied by conventional DSC. Obviously, the available cooling rates are much slower in DSC than in FSC and, accordingly, the accessible range of crystallization temperatures is restricted to a much smaller range, and also in the high temperature zone, which implies that only crystallization of the α phase will be able to be observed. However, considering that the sample mass in DSC is several orders of magnitude greater than in FSC, the upper limit of crystallization temperatures achievable by DSC is noticeably higher.
Thus, the crystallization isotherms of PVDF over the available range of crystallization temperatures have been analyzed. For this, two different cooling rates from the melt have been used: 40 and 120 °C/min (remember, again, that the rates are usually expressed in °C/min in conventional DSC and in °C/s for FSC). The corresponding isotherms can be seen in
Figure 13. An exponential increase in crystallization time with
Tc is observed, without any apparent discontinuity.
These isotherms were then analyzed. The variation of enthalpy with crystallization time exhibited for all of them a common sigmoidal shape (similar to those depicted in
Figure 8b) and the exponent deduced from Avrami’s double logarithmic representation was of around 3. This was the expected behavior, because these experiments were performed at high temperatures where only the α modification was generated.
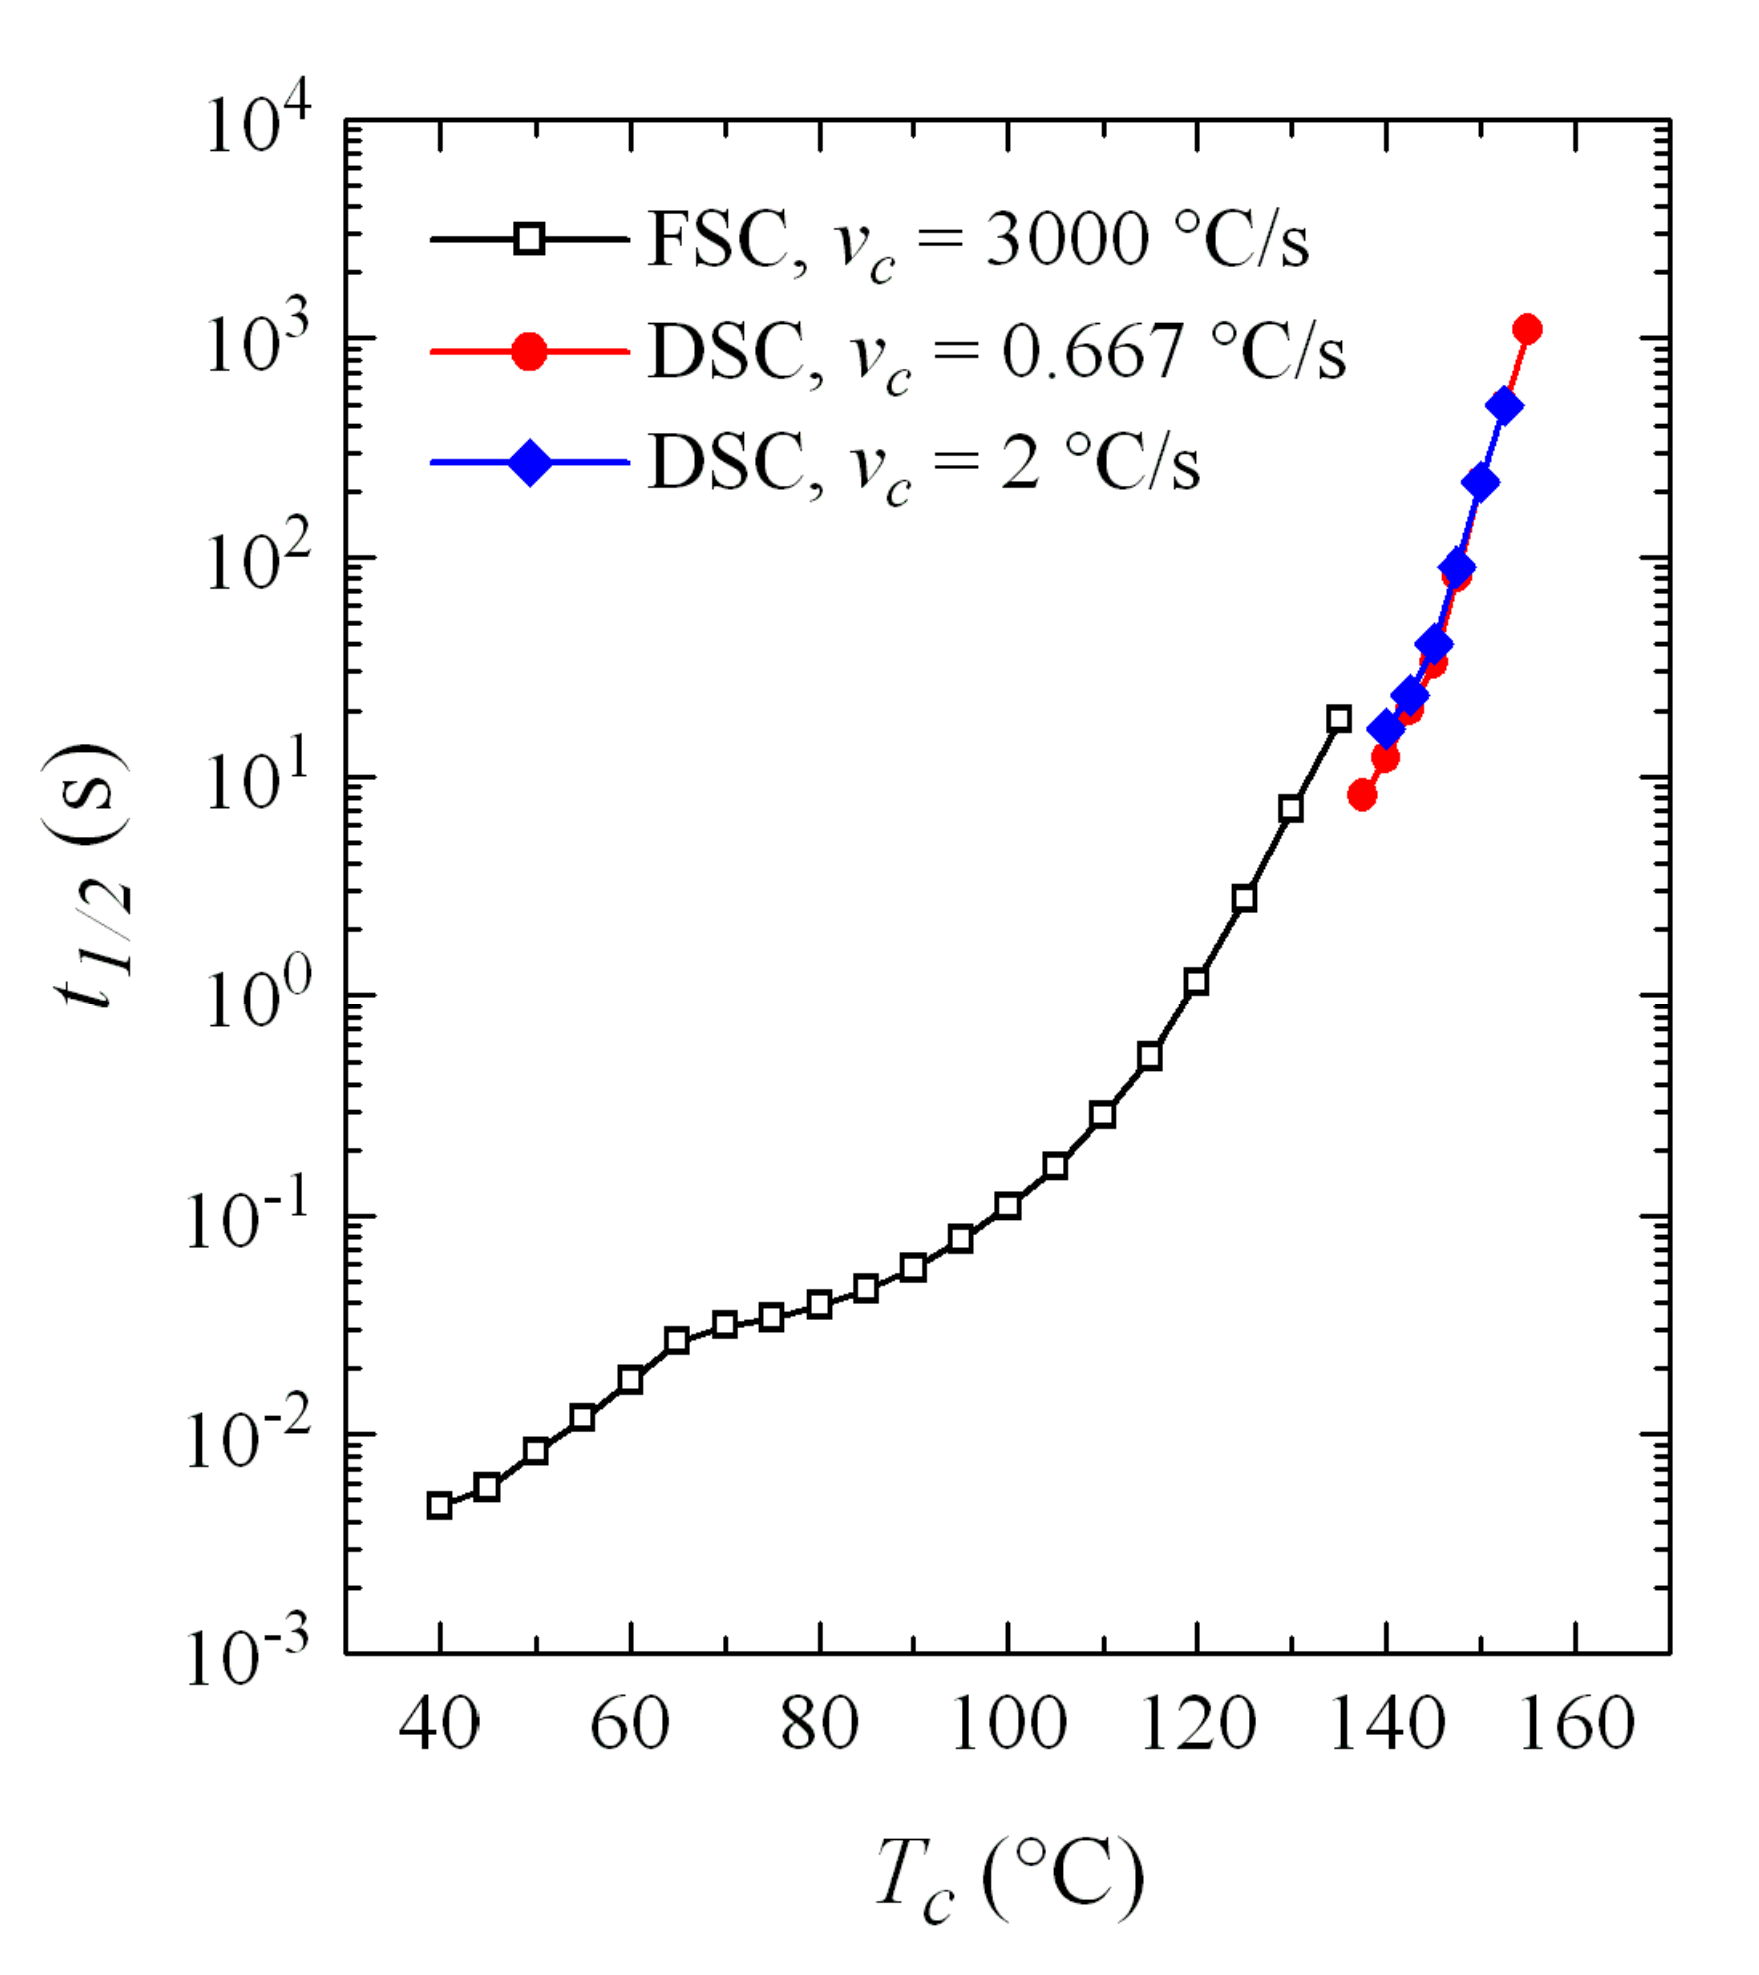
Time to reach 50% of the transformation,
t1/2, has also been determined, with the represented in
Figure 14, compared with those obtained by FSC. It is observed that the agreement is outstanding, especially if the great difference in cooling rates from the melt is taken into account. In fact, and focusing on the DSC experiments, a small but evident increase in the
t1/2 values was observed with the cooling rate: the data at 120 °C/min (2 °C/s) are slightly above those corresponding to cooling at 40 °C/min (0.667 °C/s). It is not surprising, therefore, that the
t1/2 values for FSC, with a cooling rate of 3000 °C/s, are slightly higher than those of DSC.


