1. Introduction
Techniques such as viscometry, light scattering (LS), and small angle X-ray (SAXS) or neutron (SANS) scattering have traditionally played a critical role in the characterization of macromolecules due to their ability to determine the internal density of macromolecules in solution. Since the internal density of a macromolecule can be related to its volume after the molecular weight has been determined, such measurements provide a means to assess the dimensions of macromolecules in solution. For instance, the existence of excluded volume experienced by macromolecules in solution is readily detected by a marked decrease in the internal density of macromolecules, which can be mathematically predicted and experimentally confirmed through intrinsic viscosity ([
η]) and LS measurements [
1]. These measurements are typically conducted with polymer concentrations in the 1–10 g/L range, a concentration range that is suitable for well-soluble samples, but that can lead to aggregation and challenging data analysis for less soluble macromolecules.
In contrast, fluorescence is better known for its ability to probe fast photochemical processes, which has led to the implementation of many fluorescence-based applications to characterize the internal dynamics of macromolecules in solution [
2]. In a typical fluorescence collisional quenching (FCQ) experiment, where quenching occurs solely upon contact between the excited dye and its quencher, a macromolecule is covalently labeled with a dye and its quencher at two specific positions, followed by the acquisition of the monoexponential fluorescence decay of the fluorescently labeled macromolecule. Analysis of the decay yields the decay time (
τ) corresponding to the quenching of the dye by the quencher, which is equal to (1/
τo +
kdiff × [
Q]
loc)
−1, where
τo,
kdiff, and [
Q]
loc are the dye natural lifetime, the bimolecular quenching rate constant describing the diffusive encounters between the excited dye and the quencher, and the quencher concentration experienced locally by the excited dye, respectively. Because [
Q]
loc is deemed impossible to measure experimentally, the fluorescence decay analysis yields the product
kdiff × [
Q]
loc, which is referred to as the pseudo-unimolecular rate constant
k. Information about the internal dynamics of the macromolecule is retrieved from
k, a larger
k reflecting a more flexible macromolecule. Yet, this interpretation of
k overlooks the fact that
k is not only a function of
kdiff but also of [
Q]
loc, which is related to the internal density of the macromolecule, since the quencher is covalently attached to the macromolecule.
The difficulty in establishing the relationship between
k and [
Q]
loc for fluorescently labeled macromolecules is rooted in a number of technical and theoretical hurdles that must be overcome, as described in an earlier review [
3]. First, most photophysical processes like FCQ occur over short distances of less than 5 nm [
3]. This constraint requires that the dye and quencher be relatively close to each other, limiting the application of FCQ experiments to oligomers, not macromolecules. To study macromolecules by FCQ and resolve this first hurdle, the dye and quencher must be brought closer to each other, typically by increasing the number of dyes and quenchers attached to the macromolecule. Unfortunately, this practice leads to the second hurdle of FCQ experiments, whereby each polymer segment spanning a dye and a quencher results in a different quenching rate constant, which leads to a complex distribution of quenching rate constant (
ki) [
3]. In turn, the fluorescence decay of the randomly labeled macromolecules turns into a sum of exponentials associated with a distribution of decay times
τi equal to (1/
τo +
ki)
−1. Since no multiexponential decay analysis can resolve all the
τi values resulting from the distribution of the
ki rate constants, the average rate constant for quenching <
k> is typically determined. The relationship between <
k> and [
Q]
loc now needs to be established, and this represents the third hurdle in FCQ experiments because [
Q]
loc is difficult to predict for a macromolecule labeled with more than one dye and one quencher [
3].
For reasons that have been presented in several reviews [
3,
4,
5], excimer formation upon encounter between an excited and a ground-state pyrenyl group covalently attached onto a macromolecule is a well-known and often used FCQ application to probe the internal dynamics of macromolecules. The multiexponential fluorescence decays acquired with macromolecules labeled with more than two pyrenes can be satisfyingly fit according to the model-free analysis (MFA), which yields the average rate constant <
k> of pyrene excimer formation (PEF) [
3,
6]. In this case, the ground-state pyrenes act as quenchers, and <
k> is related to the local pyrene concentration ([
Py]
loc) experienced by an excited pyrene according to Equation (1). Equation (1) is well accepted in the literature because it has been shown to hold for homogeneous pyrene solutions [
7], it agrees with the results obtained with end-labeled monodisperse polymers [
8,
9], and it has been predicted for polymers randomly labeled with pyrenes [
10]. The MFA has been shown to be a superior analytical tool [
11] compared to other procedures that have been applied previously to study the fluorescence of pyrene-labeled dendrimers [
12,
13,
14,
15,
16,
17,
18,
19,
20,
21,
22,
23,
24,
25,
26,
27,
28], as was reported in an earlier review [
4]. Yet, validation of Equation (1) is essential to demonstrate that FCQ experiments such as those based on PEF yield parameters that report on [
Py]
loc, and thus on the internal density of the macromolecule onto which the pyrenyl labels are attached.
The only study to have indicated that Equation (1) is valid was conducted in tetrahydrofuran (THF) with a series of pyrene labeled dendrons referred to as Py
x-G(
N). The Py
x-G(
N) dendrons were prepared with a 2,2-bis(hydroxymethyl) propionic acid backbone, the generation number (
N) of the dendrons ranged from 1 to 6, and
x (= 2
N) represented the number of pyrenyl labels covalently attached to the terminal ends of a dendron of generation
N [
29]. The published derivation of the average squared end-to-end distance, <
LPy2>
1/2, of the highly branched Py
x-G(
N) dendrons was employed to estimate [
Py]
loc for each Py
x-G(
N) dendron. The MFA of the fluorescence decays acquired with the Py
x-G(
N) dendrons yielded <
k>, which was found to increase linearly with increasing [
Py]
loc as predicted by Equation (1). This original study is now extended to the three additional solvents toluene,
N,
N-dimethylformamide (DMF), and dimethylsulfoxide (DMSO), which provide, after including THF, a series of four solvents with a broad range of polarity and viscosity. In turn, polarity and viscosity affected the probability (
p) of forming an excimer and the diffusion coefficient (
D) of the pyrene labels in different manner, which affected the results obtained by PEF. Fortunately, these effects could be accounted for by studying PEF with homogeneous solutions of ethyl 4-(1-pyrene)butyrate (PyBE) in the same solvents, which provided a means to assess how
kdiff in Equation (1) was affected by solvent polarity and viscosity. After accounting for the changes in
kdiff due to solvent polarity and viscosity, all <
k> vs. [
Py]
loc plots obtained for the Py
x-G(
N) samples in the different solvents merged into a single master curve, thus demonstrating the validity and generality of Equation (1).
3. Results and Discussion
The average squared end-to-end distance, <
LPy2>
1/2, of a series of 2,2-bis(hydroxymethyl)propionic acid backbone dendrons labeled with 1-pyrenebutyric acid at their terminal ends (Py
x-G(
N)) is shown in Equation (5), which has been derived in an earlier publication [
29]. The parameters
a (= 6) and
b (= 8) in Equation (5) represent the number of atoms connecting the pyrene label to the first junction point and the number of atoms resulting from the incorporation of each bis(hydroxymethyl)propionic acid in the construct, respectively. In Equation (5),
l represents the projection of a C–C bond length taken to equal 0.125 nm.
[
Py]
loc could then be determined with Equation (6), where
NA is the Avogadro number and the term (2
N–1) represents the number of ground-state pyrenes in the Py
x-G(
N) dendron after considering that one pyrenyl label must be excited in a PEF experiment. The [
Py]
loc concentrations corresponding to the different Py
x-G(
N) dendrons are provided in
Table 1. The very large [
Py]
loc concentrations reported in
Table 1 are a result of the short distances separating the ends of the dendrons in comparison to their overall size. For instance, a linear chain made of 16 bonds would have an end-to-end distance equal to 16
0.5 ×
l = 0.5 nm using an
l value of 0.125 nm. This end-to-end distance would result in a molar concentration for one chain end according to Equation (6) equal to 44 M, which is much larger than many organic solvents, but is a consequence of dealing with the end-to-end distance of a molecule instead of its overall size that is much larger. With their much higher number of chain ends, the Py
x-G(
N) dendrons have considerably higher local concentrations of chain ends, as reported in
Table 1.
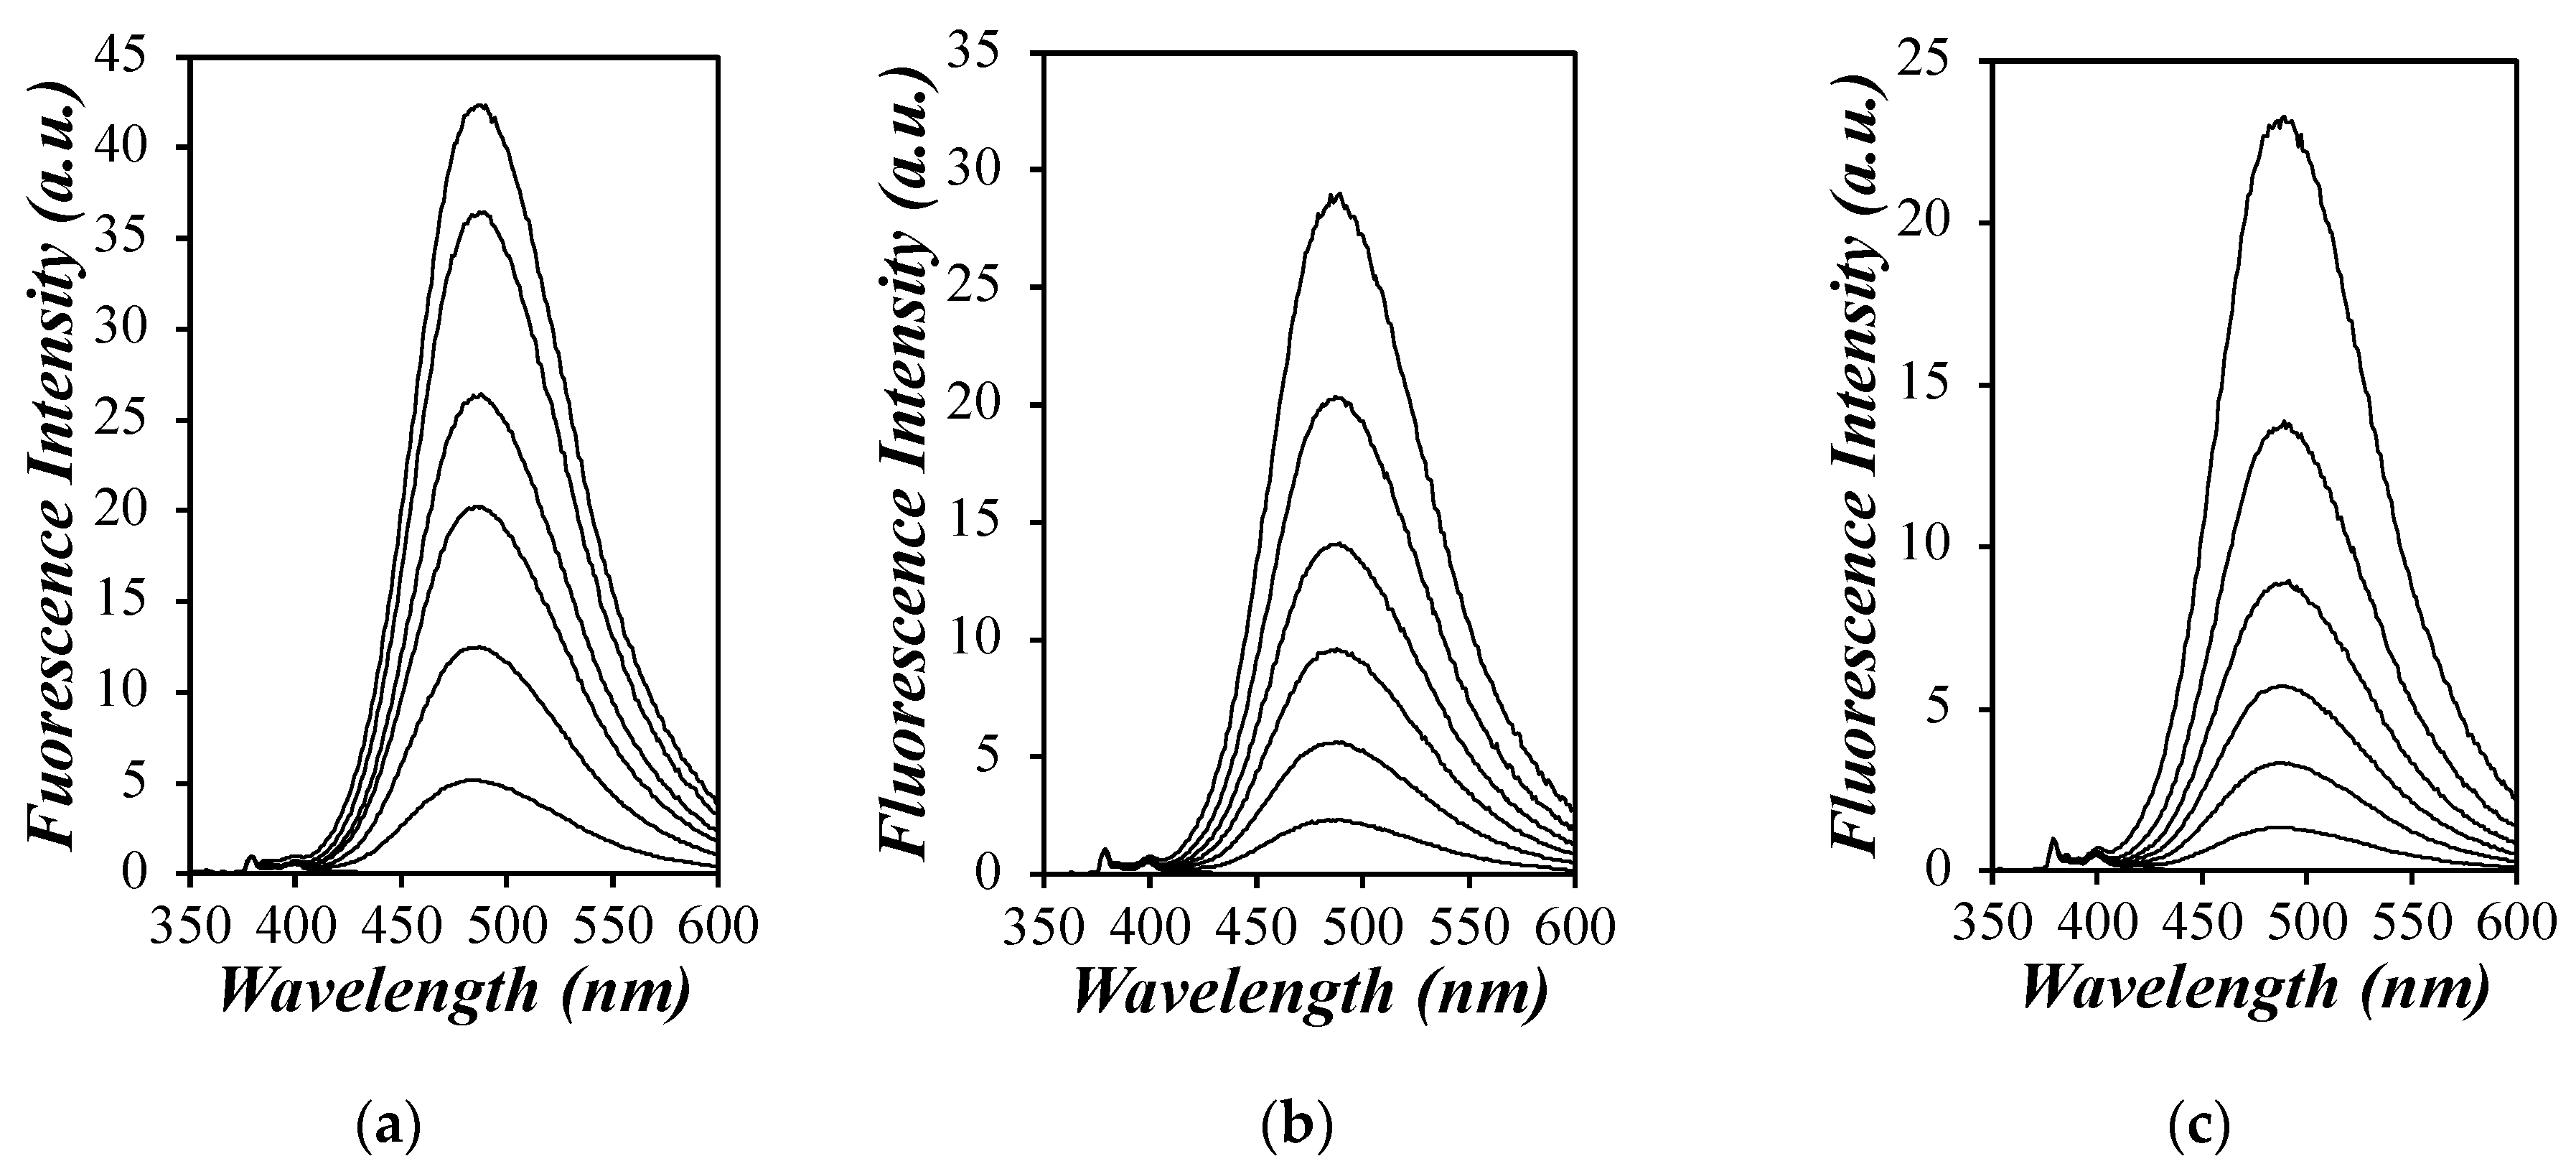
The steady-state fluorescence (SSF) spectra for each Py
x-G(
N) sample were acquired in the different solvents and are shown in
Figure 1 for toluene, DMF, and DMSO. Py
2-G(1), which contains two pyrenyl groups, produces the least amount of excimer in each solvent, and PEF was found to increase with generation number and the number of pyrenyl groups present in a given Py
x-G(
N) dendron, thus reflecting a direct relationship between the PEF efficiency and [
Py]
loc. The SSF spectra shown in
Figure 1 are typical of a pyrene-labeled macromolecule, and the PEF efficiency can be better quantified by considering the
IE/
IM ratio, which is proportional to
kdiff and [
Py]
loc, as shown in Equation (7). The expression of
kdiff is given in Equation (8), where
R,
D, and
p are the molecular diameter of pyrene, twice the diffusion coefficient of pyrene, and the probability of having PEF upon a diffusive encounter between an excited and a ground-state pyrene, respectively [
2]. The expression of the diffusion coefficient (
DPy) for one pyrene molecule is given in Equation (9), where
kB,
T,
η, and
Rh are the Boltzmann constant, the absolute temperature, the solvent viscosity, and the hydrodynamic radius of the dye, respectively. Based on Equations (7)–(9),
kdiff, and thus the
IE/
IM ratio, is proportional to the ratio
p/
η, which depends critically on the dielectric constant (reported at 20 °C) and viscosity (reported at 25 °C) of the solvent, which equal 2.4 and 0.56 mPa.s, 7.5 and 0.46 mPa.s, 38 and 0.79 mPa.s, and 47 and 1.99 mPa.s for toluene, THF, DMF, and DMSO, respectively [
33].
The
IE/
IM ratios of the Py
x-G(
N) dendrons were plotted in
Figure 2a for each solvent. The
IE/
IM ratio increased with increasing generation number. However, and as predicted by Equations (7)–(9), the
IE/
IM ratio did not depend solely on the viscosity of the solvent. For instance, toluene with a viscosity higher than THF was found to form excimer more efficiently, followed by THF, DMF, and finally DMSO. THF, which is more than four times less viscous than DMSO, yielded
IE/
IM ratios that were only 2.4-fold larger than those obtained in DMSO. This behaviour was a result of the different
p values taken in Equation (8) for different solvents. The
IE/
IM ratios were also plotted as a function of [
Py]
loc in
Figure 2b. Fairly linear trends were obtained between
IE/
IM and [
Py]
loc up to Py
32-G(5), but clear deviations from linearity were observed for Py
64-G(6). The linear increase in
IE/
IM with increasing [
Py]
loc agreed with the behavior expected from Equation (7).
The somewhat odd behavior observed in
Figure 2b for Py
64-G(
N), whereby the
IE/
IM ratio is smaller than anticipated, has two most plausible causes. One would be the presence of a small but strongly emissive amount of unattached pyrenyl labels, which would artificially increase the pyrene monomer emission, thus reducing the
IE/
IM ratio as was illustrated in an earlier publication [
11]. The second would be the enhanced crowding of the terminal pyrenyl groups for the Py
64-G(6) sample leading to a reduction in the number of pyrenyl groups available for diffusive PEF, and thus resulting in less efficient PEF as was suggested earlier for the trends obtained in THF [
29]. To address these concerns as well as the somewhat erratic behavior shown in
Figure 2b where each solvent yielded a different trend, a more detailed analysis of the fluorescence data is required by applying the model-free analysis (MFA) to the fluorescence decays of the Py
x-G(
N) samples. The MFA dissects the PEF process into its dynamic and structural components given by the average rate constant <
k> for PEF (see Equation (1)) and the molar fractions of the different pyrene species contributing to PEF, respectively.
The TRF decays of each Py
x-G(
N) dendron were acquired in toluene, DMF, and DMSO and then analysed using the model-free analysis (MFA). The global MFA of the decays gave excellent fits with a
χ2 ≤ 1.2, and residuals and autocorrelation residuals randomly distributed around zero. A sample fit is shown in
Figure S2. A detailed explanation of the MFA can be found as
Supplementary Materials (SM) as well as all the parameters retrieved from the fits in
Tables S3–S5. The MFA parameters were used to calculate <
k> from Equation (3) and the molar fractions of the different pyrene species. These molar fractions
ffree,
fdiff, and
fagg represent the pyrenes that do not form excimer in solution and are usually free unattached pyrene derivatives, form excimer through diffusive encounters, and form excimer through direct excitation of a pyrene aggregate, respectively. To ensure that the parameters retrieved from the MFA provided an accurate representation of the fluorescence spectra shown in
Figure 2, the parameters retrieved from the MFA of the decays were used to calculate the absolute
IE/
IMTRF ratios using Equation (4). The absolute
IE/
IMTRF ratios calculated from Equation (4) should be proportional to the relative
IE/
IMSSF ratios obtained from the analysis of the SSF spectra. The linear relationship observed in
Figure 3 between the
IE/
IMTRF and
IE/
IMSSF ratios demonstrated that the MFA parameters retrieved from the global analysis of the fluorescence decays agreed with the analysis of the fluoresce intensities in the fluorescence spectra. The average rate constant <
k> could now be studied in more detail.
Figure 4a shows a plot of <
k> vs. [
Py]
loc for the Py
x-G(
N) samples in the three solvents. As for the
IE/
IMSSF ratios in
Figure 2b, <
k> increased linearly with increasing [
Py]
loc for
N values ranging from 1 to 5 but showed a clear downward curvature for Py
64-G(6). The same behavior had been observed earlier in THF, and this behavior had been attributed to increased aggregation of the pyrenyl labels, which lowered the local concentration of active pyrenyl labels that could form excimer by diffusive encounters between an excited and a ground-state pyrene [
29]. The notion that the pyrenyl labels were strongly aggregated in the Py
64-G(6) sample was easily illustrated by plotting the molar fraction of aggregated pyrenes (
fagg) as a function of the generation number in
Figure 4b. While the Py
x-G(
N) samples with 1 ≤
N ≤ 5 yielded
fagg values that were smaller than 0.06,
fagg for the Py
64-G(6) sample took a value that was larger than 0.17 in all solvents studied. Since <
k> is unaffected by the presence of free pyrene derivatives, this result confirmed our earlier analysis [
29] that the unexpected behavior observed for Py
64-G(6) in
Figure 2b and
Figure 5a was probably a consequence of extensive aggregation of the pyrenyl labels due to overcrowding. Dividing <
k> by the molar fraction of pyrenyl groups, which form excimer exclusively though diffusive encounters (
fdiff) [
29], accounts for this artefact by increasing <
k> to the value that it should take if all its pyrenyl groups were dissolved in the solution, as assumed by Equation (6) for the calculation of [
Py]
loc.
This correction was applied, and the ratio <
k>/
fdiff was plotted as a function of [
Py]
loc in
Figure 4c. The linear relationships obtained in the plots shown in
Figure 4c for all Py
x-G(
N) dendrons in toluene, THF, DMF, and DMSO validated the proposal that the unexpected behavior observed for the
IE/
IMSSF and <
k> parameters in
Figure 2b and
Figure 5a was due to extensive aggregation of the pyrenyl groups in Py
64-G(6). Similarly to the trends obtained in
Figure 2b with the
IE/
IMSSF ratios, <
k> was found to be larger in the more viscous toluene than in THF. In an effort to identify the origin of this phenomenon and assess whether it was general or specific to the family of Py
x-G(
N) dendrons, the PEF process was investigated further with ethyl 4-(1-pyrene)butyrate (PyBE), which was used as a model compound, since it resembles the pyrene derivative covalently bound to the Py
x-G(
N) samples.
The fluorescence spectra of PyBE solutions with concentrations ranging from 6 to 14 mM were acquired in toluene, THF, DMF, and DMSO and are presented in
Figure S3 in SM. The fluorescence spectra showed the expected spectral features of a pyrene derivative forming excimer, with a set of sharp peaks observed between 370 and 410 nm indicative of the pyrene monomer and a broad structureless emission centered at 480 nm for the excimer. Increasing the PyBE concentration resulted in increased pyrene–pyrene encounters that resulted in increased PEF. The fluorescence spectra shown in
Figure S3 were analyzed to obtain their
IE/
IMSSF ratios, which were plotted as a function of the PyBE concentration in
Figure S4. The plots were linear as expected for PEF, but they also displayed the same unexpected trend observed with the Py
x-G(
N) dendrons that showed more viscous toluene yielding larger
IE/
IMSSF ratios than less viscous THF.
The fluorescence decays of the pyrene monomer and excimer of all the PyBE solutions were acquired and analyzed according to the Birks scheme and the MFA. The parameters retrieved from the Birks scheme analysis and MFA for the PyBE solutions are listed in
Tables S1 and S2, respectively. The fluorescence decay fits were excellent with the MFA in all solvents and for the Birks scheme in toluene and THF, but showed some slight deviations at the early times in DMF and DMSO, possibly due to the increased viscosity of the two latter solvents. Nevertheless, the product
kdiff × [
PyBE] obtained from the Birks scheme analysis of the fluorescence decays and <
k> obtained from the MFA are plotted as a function of the PyBE concentration in
Figure 5a. Both <
k> and
kdiff × [
PyBE] increased linearly with increasing PyBE concentration, with <
k> being always slightly smaller than the product
kdiff × [
PyBE], probably a consequence of the different assumptions made for the derivation of each model. The Birks scheme assumes that the pyrene excimer dissociates with a dissociation rate constant that is typically small compared to 1/
τE0, as found experimentally in
Table S1, whereas the MFA neglects the excimer dissociation altogether. The Birks scheme also assumes a single rate constant for excimer formation, whereas the MFA assumes that the excimer can be formed by several rate constants. The poorer fits obtained for the fit of the fluorescence decays with the Birks scheme analysis in DMF and DMSO suggest that the MFA is a more robust analysis method. Nevertheless, the slopes of the plots of <
k> and
kdiff × [
PyBE] as a function of PyBE concentration in
Figure 5a and of <
k> versus [
Py]
loc in
Figure 4c yielded the bimolecular rate constant (
kdiff) for diffusive encounters between two pyrene molecules for PyBE and the pyrenyl labels of the Py
x-G(
N) dendrons, respectively. They are plotted in
Figure 5b as a function of the inverse of the solution viscosity.
The three plots for
kdiff show some striking similarities with a sharp maximum for a 1/
η value of 1.79 (mPa·s)
−1 obtained in toluene. The common behavior observed for the pyrenyl labels of the Py
x-G(
N) dendrons and PyBE demonstrates that this behavior is a result of the pyrene dye and not due to the fact that it is attached onto the dendrons.
kdiff was found to be 360 ± 30 times larger for the PyBE model compound than for the pyrenyl labels covalently attached to the dendrons. This massive reduction in
kdiff reflects the equally massive loss in mobility experienced by a pyrene derivative upon covalent attachment to a macromolecule versus the same pyrene derivative freely diffusing in solution. Another important feature of
Figure 5b is that
kdiff is not inversely proportional to the solution viscosity, because PEF depends also on the probability (
p) of forming an excimer upon encounter between two pyrene moieties, as discussed in Equations (7)–(9). This aspect is further illustrated with
Figure 5c, which shows the product
η ×
kdiff, which is proportional to
p, plotted as a function of the solvent viscosity. For the four solvents investigated,
η ×
kdiff fluctuates from 0.86 × 10
9 M
−1·mPa in THF to 2.00 × 10
9 M
−1·mPa in DMSO. Additionally, the
η ×
kdiff value of 1.13 × 10
9 M
−1·mPa for DMF was almost half that of 2.00 × 10
9 M
−1·mPa in DMSO, suggesting a similar relationship for
p as had been suggested earlier with two other pyrene model compounds, namely 1-pyrenemethylacetamide [
34] and
n-butyl-1-pyreneacetamide [
35].
For the sake of consistency, the <
k>/
fdiff values obtained for the Py
x-G(
N) dendrons in different solvents were divided by the
kdiff values of 1.90, 2.93, 1.42, and 1.00 M
−1·ns
−1 obtained from the MFA of the PyBE decays acquired in THF, toluene, DMF, and DMSO (see
Figure 5b) to account for the changes in the ratio
p/
η between the different solvents. The quantity <
k>/(
fdiff ×
kdiff) was plotted as a function of [
Py]
loc in
Figure 6 for the four solvents considered. All data points in
Figure 4c collapsed along a master line in
Figure 6, indicating that this correction accounted for the different
p/η values of the solvents. The data points showed more scatter for the higher generation dendrimers, possibly because the pyrenyl labels were more aggregated, but also because the larger dendrons might have been subject to more excluded volume effects, which are not accounted for by the derivation of Equation (4). The smaller dendrons are likelier to be devoid of solvent effects, and their behavior is well-described by Equation (4), which assumes that each chain segment behaves like a Gaussian chain. Finally, the straight line obtained between <
k>/(
fdiff ×
kdiff) and [
Py]
loc demonstrates that <
k> responds directly to [
Py]
loc for the pyrene-labeled dendrons regardless of the nature of the solvent.


 ) toluene, (
  ) THF, (
  ) DMF, and (
  ) DMSO; Table S1: Parameters retrieved from the global Birks scheme analysis of both the monomer and excimer decays of ethyl 4-(1-pyrene)butyrate in degassed toluene (Tol), N,N-dimethylformamide (DMF), dimethylsulfoxide (DMSO), and tetrahydrofuran (THF). Analysis program: globirks32bg; Table S2: Parameters retrieved from the MFA (analysis program: sumegs10bg) of both the monomer and excimer decays of ethyl 4-(1-pyrene)butyrate in degassed tetrahydrofuran (THF), degassed toluene (Tol), degassed dimethylformamide (DMF), and degassed dimethylsulfoxide (DMSO); Table S3: Parameters retrieved from the MFA (analysis programs: sumegs14bg or sumegs33bg-4) of the monomer decays of the Pyx-G(N) dendrons in degassed toluene (Tol), degassed dimethylformamide (DMF), and degassed dimethylsulfoxide (DMSO); Table S4: Parameters retrieved from the MFA of the excimer decays of the Pyx-G(N) dendrons in degassed toluene (Tol), degassed dimethylformamide (DMF), and degassed dimethylsulfoxide (DMSO); Table S5: Molar fractions obtained from the MFA of the Pyx-G(N) dendrons in degassed toluene (Tol), degassed dimethylformamide (DMF), and degassed dimethylsulfoxide (DMSO).


 ) toluene, (
  ) THF, (
  ) DMF, and (
  ) DMSO; solid and hollow symbols are for the fluorescence decay analysis according to the Birks scheme and MFA, respectively. (b) Plot of kdiff for (


