3.4. Solvent Diffusion and Plasticization
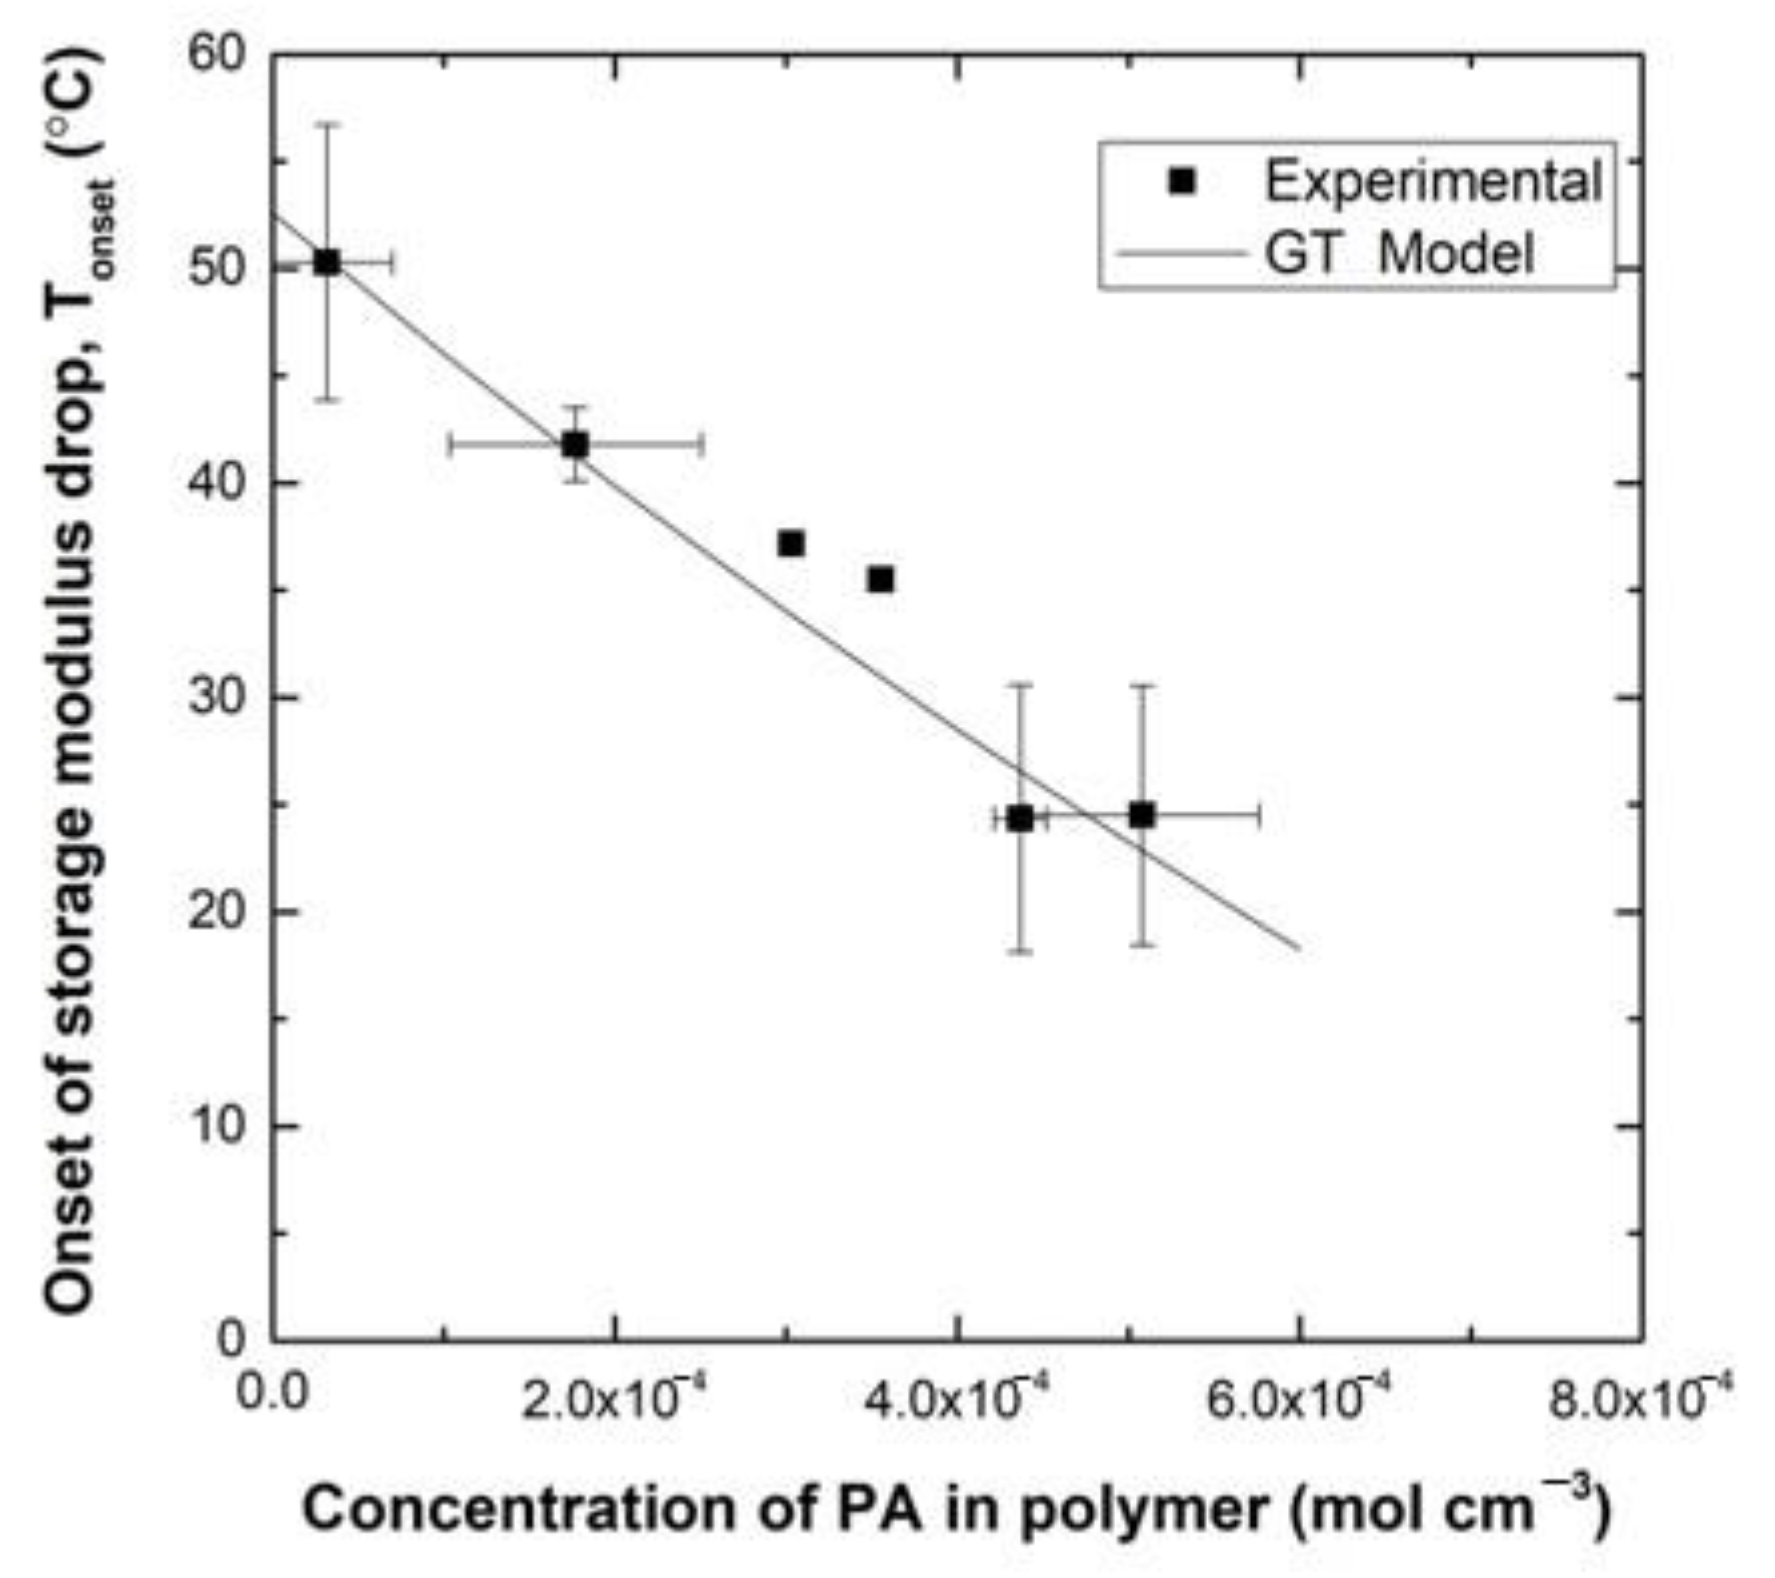
A plasticization study was conducted to investigate the influence of PA content on the properties of the epoxy network. DMA sample bars of the DGEBA:FGE(6:4)/PACM system were made and individually placed into sealed glass vials of PA, ensuring full immersion in solvent. The initial mass of the specimen was noted before immersion. Bars were left in the vials to allow uptake of varying concentrations of solvent and then subsequently removed and weighed to note the final mass. The specimen was then placed in an empty, sealed glass vial for an extended period to ensure that an equilibrium distribution of solvent throughout the polymer had been reached. Upon reaching equilibrium, DMA was used to measure the extrapolated onset of the storage modulus change, T
onset, for the varying concentrations of PA in polymer. This value represents the point at which the neat resin system moves from the glassy plateau to the glass transition region—the point at which the material starts to become compliant. The experimental T
onset values for varying concentrations of PA in the DMA bars are shown in
Figure 8. The experimental data show that with increasing mass uptake of solvent, T
onset of the polymer decreases significantly. Changes in T
g are related proportionally to changes in T
onset, thus a relationship between T
g and amount of plasticizer can also be used to study the relationship between T
onset and the amount of plasticizer.
The Gordon-Taylor equation [
12], given by Equation (2), describes the T
g of plasticized polymers as a function of weight percent of solvent (w) and T
g values, respectively, of the pure solvent, 1, and the polymer, 2. The adjustable parameter k
GT can be calculated from the experimental data of
Figure 8.
The Gordon-Taylor equation was used to fit the aforementioned experimental data and to estimate T
onset values for polymer samples with varying weight percentages of PA. The fit is also given in
Figure 8 and shows good agreement with the data. Based on this fit it is estimated that a concentration of 4.16 × 10
−4 mol/cm
3 (~4.8 wt%) PA to the epoxy network will cause T
onset to decrease to 25 °C.
The governing equation for the diffusion of PA through the compact tension sample during healing can be described by the one-dimensional diffusion equation, given by Equation (3).
CA represents the concentration of PA and
DA is the diffusion coefficient of PA in the polymer.
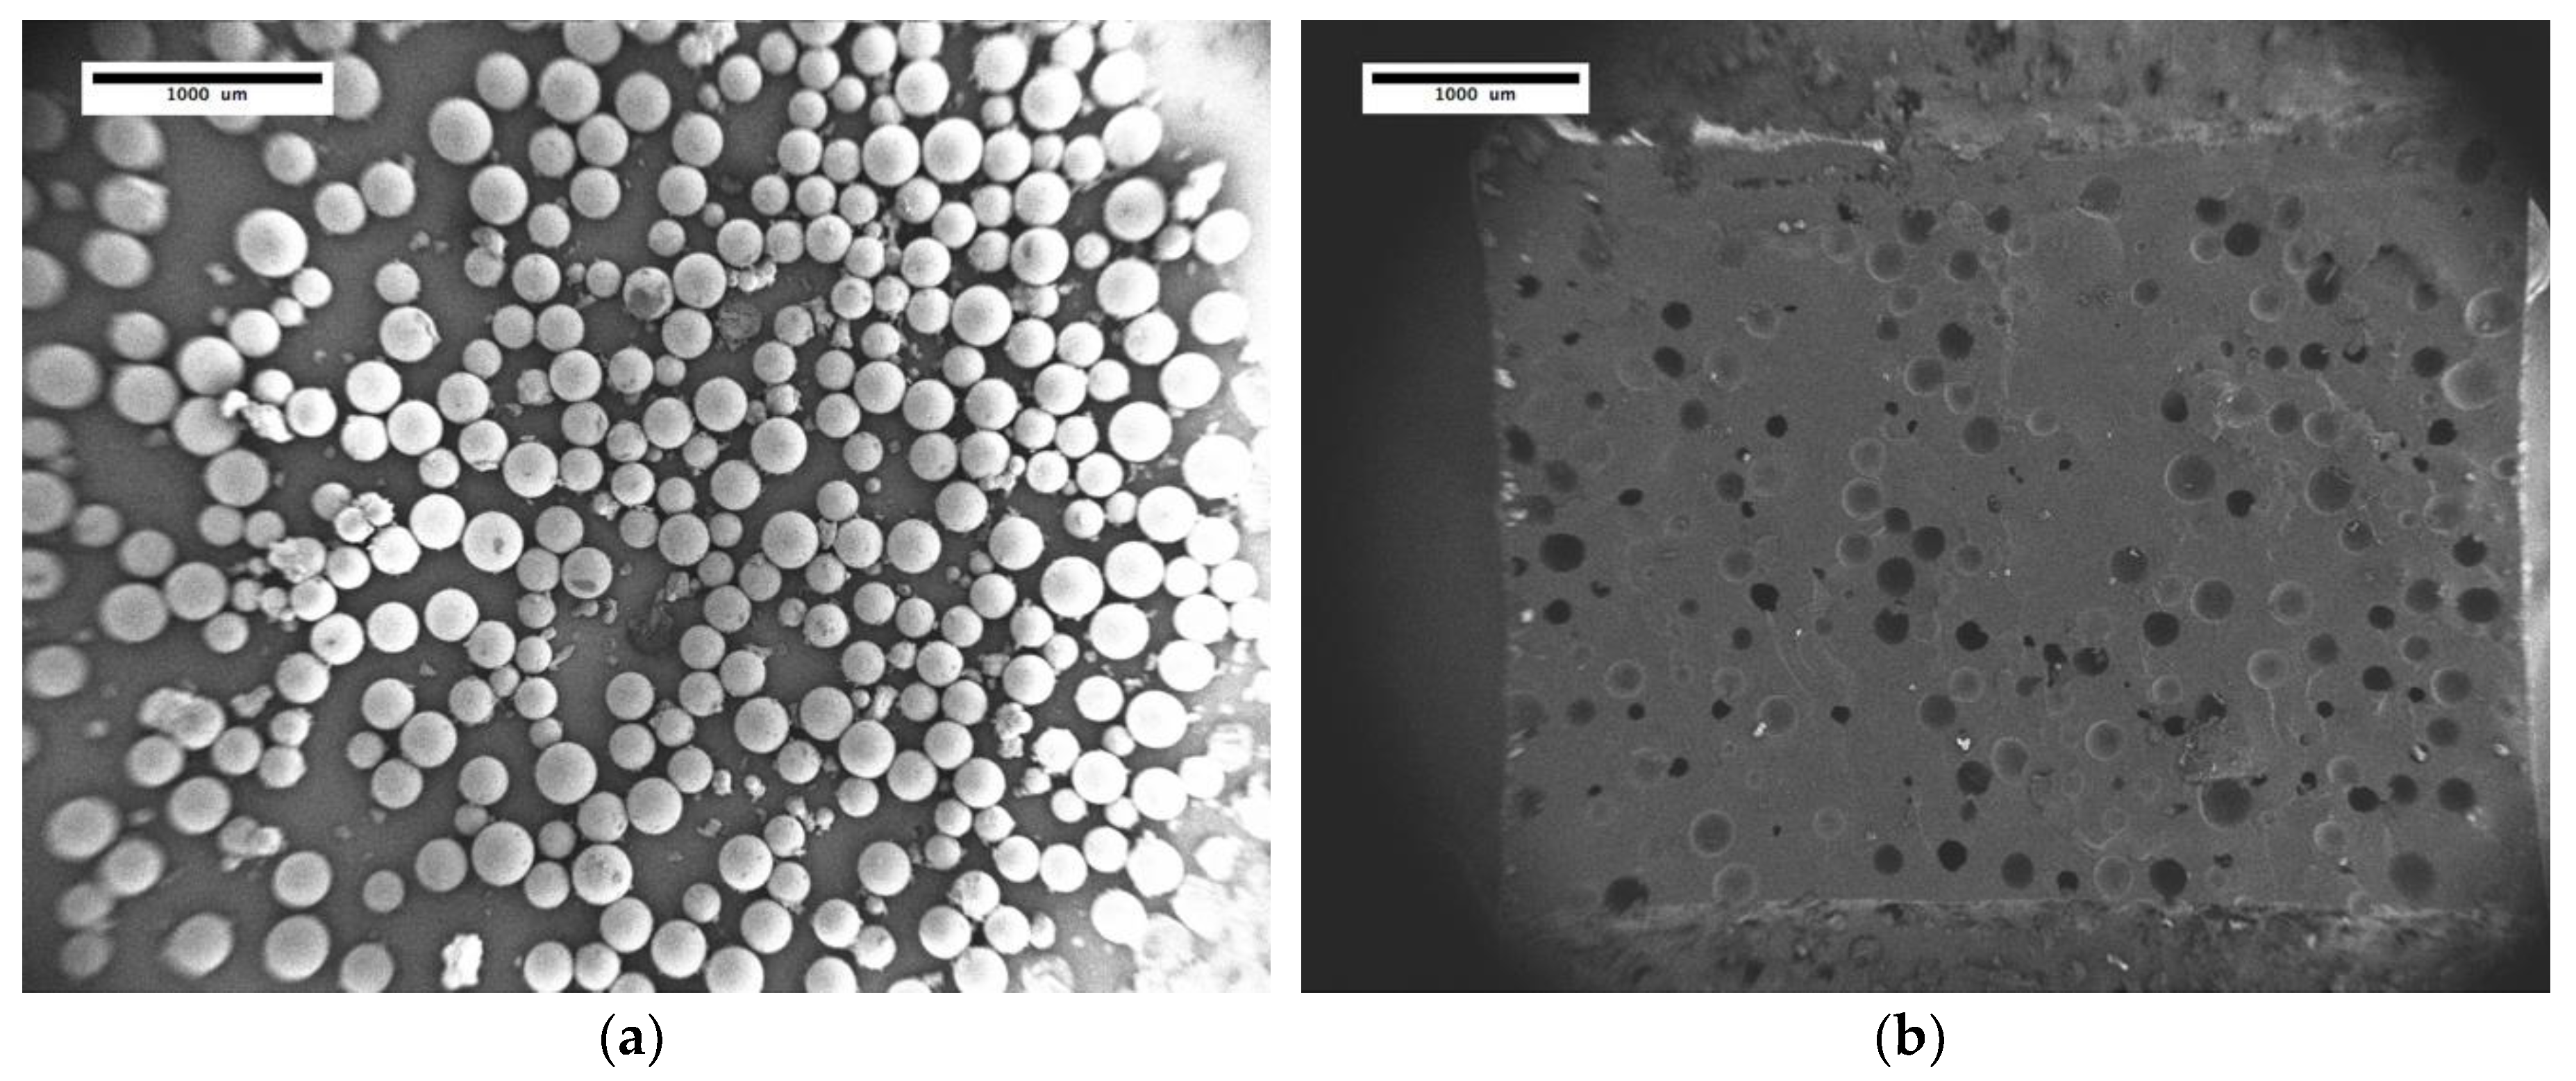
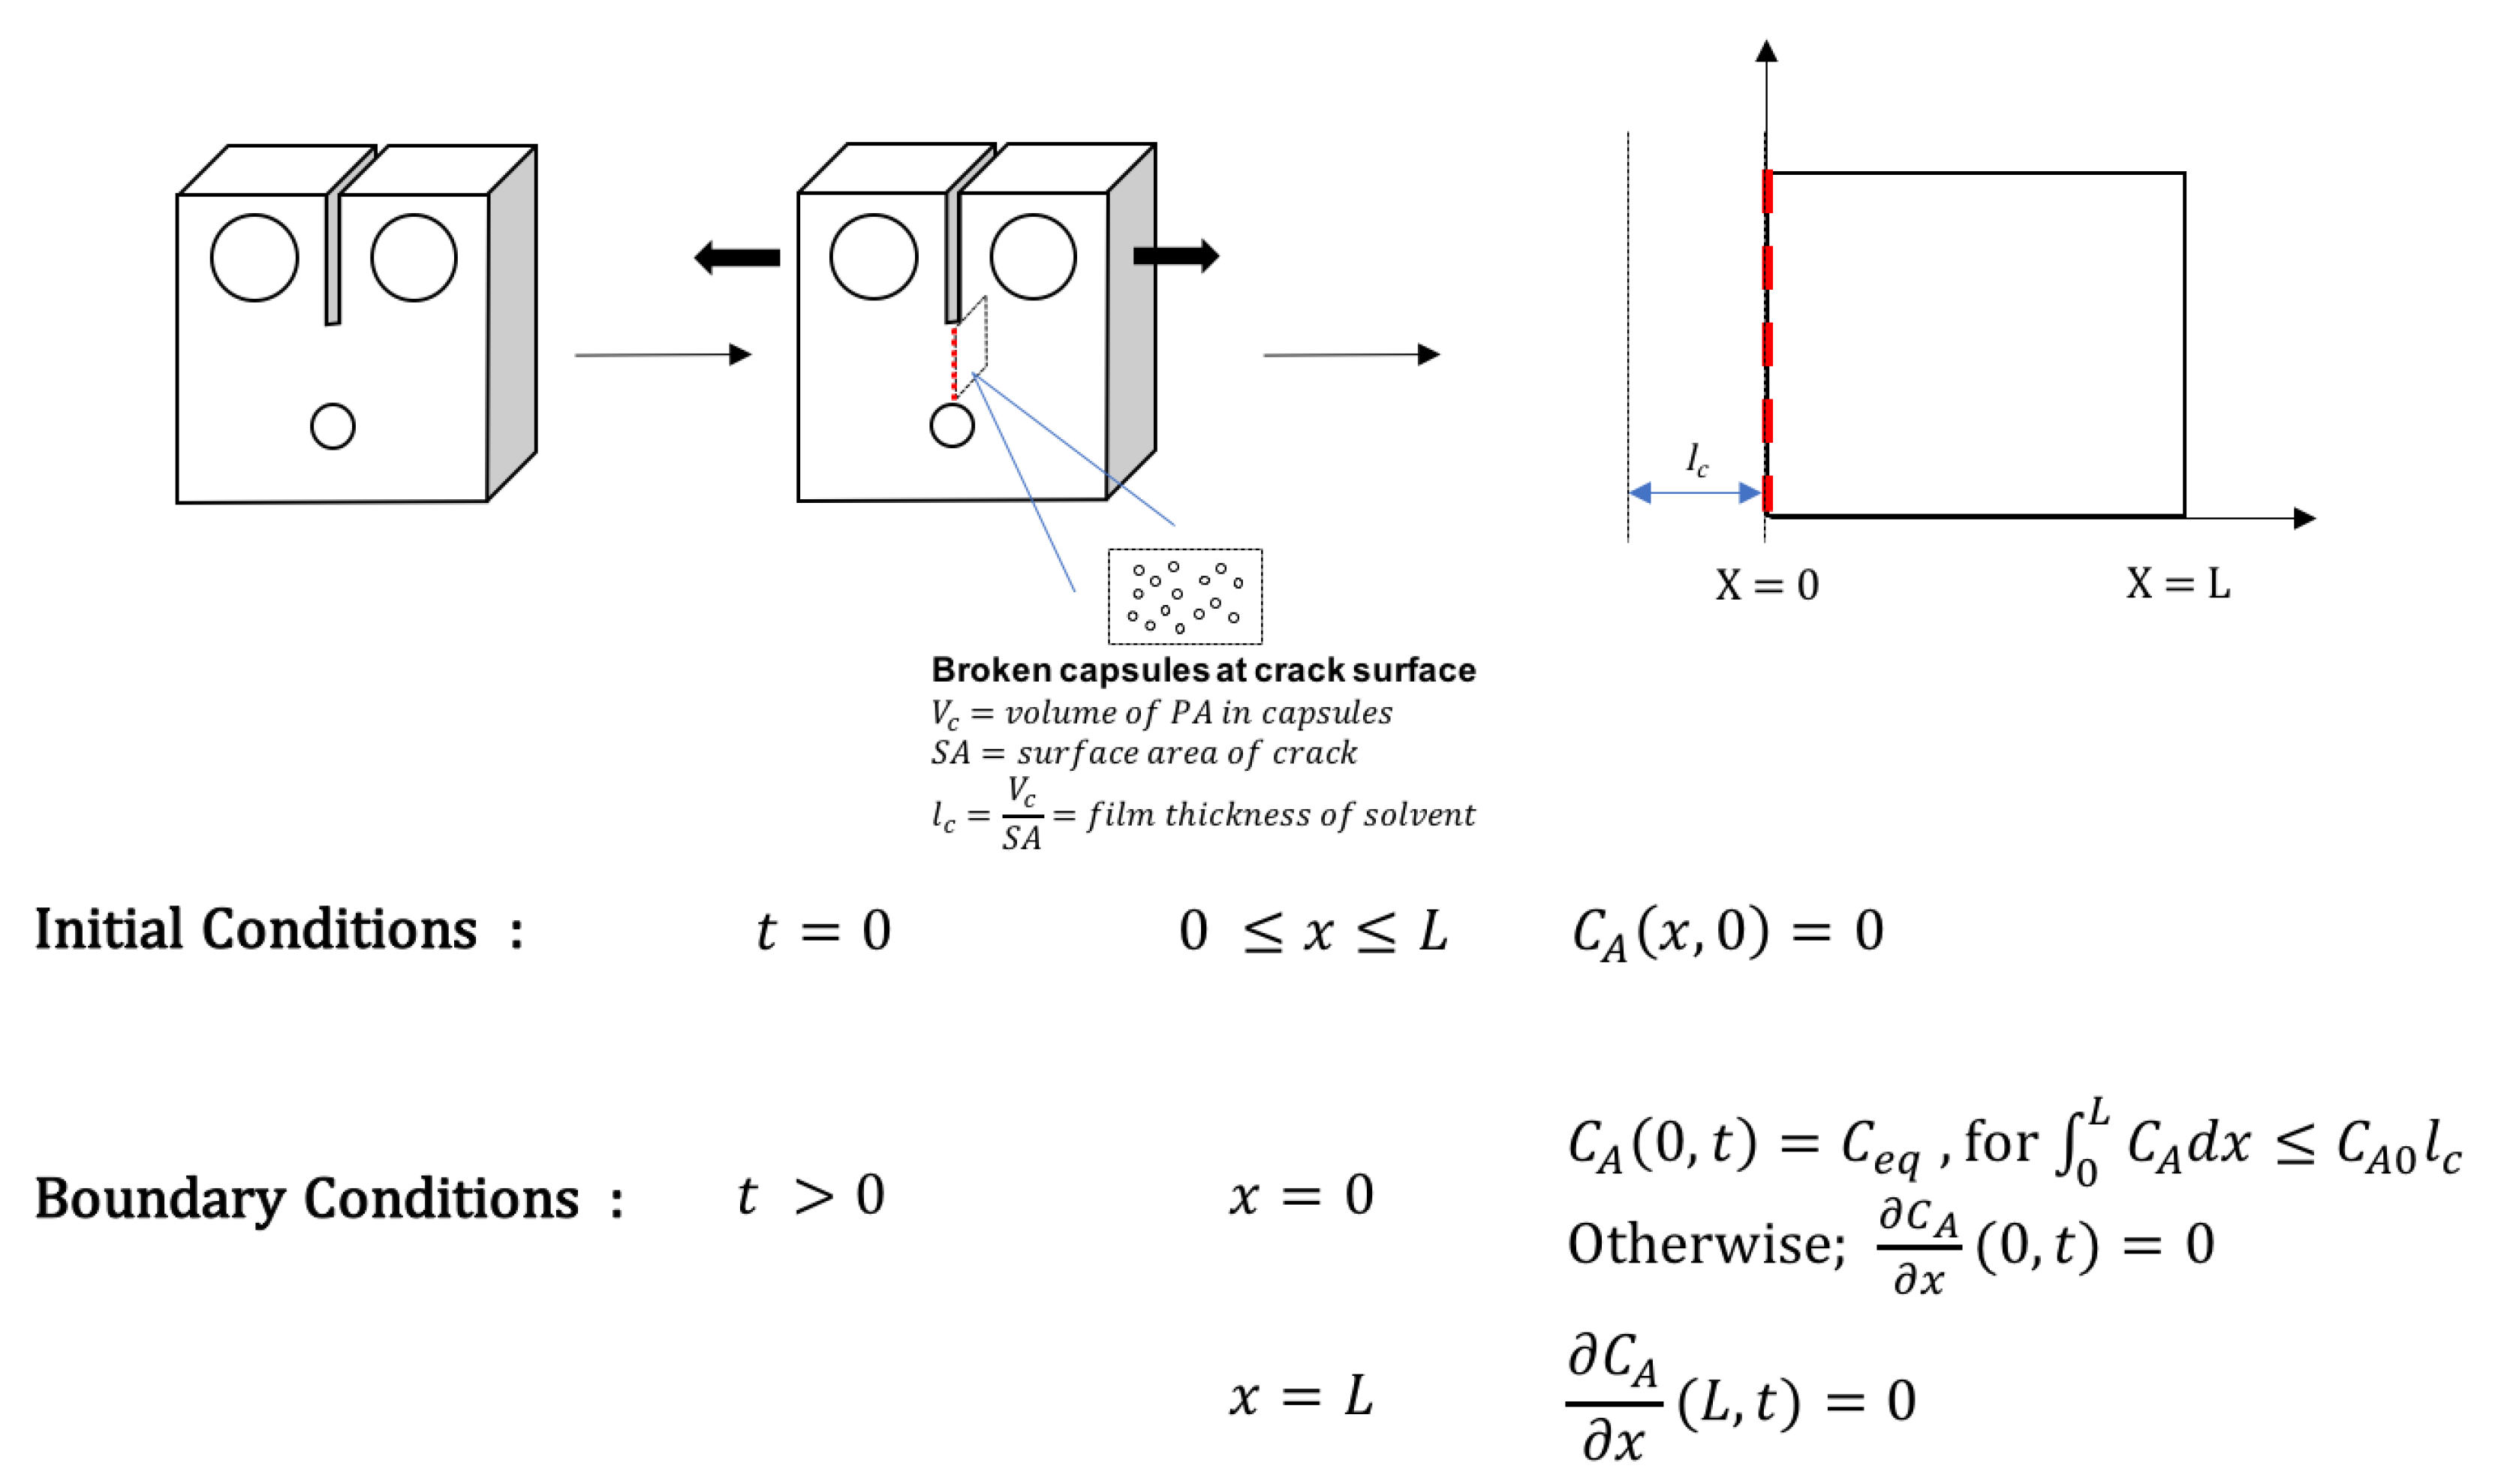
To model the diffusion of PA that occurs in the compact tension specimen, the zone of diffusion was defined as the distance from the crack surface (x = 0) to half of the width of the compact tension specimen (x = L). Upon damage, there is a finite amount of PA that can be delivered to the crack interface from fractured microcapsules. The released volumes of PA (Vc) for a given fracture surface area (SA) were estimated using SEM micrographs by counting the number of fractured capsules and assuming them to be 90% filled. Furthermore, if a uniform film is formed at the interface, it would have a thickness lc = Vc/SA. Two major assumptions are made to solve this diffusion problem: first, volume changes due to solvent diffusion into the polymer matrix are negligible; second, the diffusion coefficient is constant and does not decrease over time due to the Diels-Alder reaction with the healing agent increasing cross-link density.
To model the diffusion process, two stages were considered, each of which was solved analytically. In the first stage, solvent is released into the crack upon fracture. This volume (V
c) of solvent increases with increasing capsule content and is assumed to form a uniform film at the crack interface. At this stage, the diffusion of PA can be approximated as diffusion into a semi-infinite slab in which the initial concentration of solvent is
CA = 0 throughout the sample (0 <
x <
L), a no flux boundary condition is found at L (
x = L, ∂CA/∂x = 0), and a constant equilibrium concentration of PA is applied at the crack surface (
x = 0
, CA = Ceq). The analytical solution for this problem is given by Equation (4) [
13].
At the point that the solvent film volume is fully absorbed, the boundary condition at the crack interface also becomes no flux (
x = 0
, ∂CA/∂x = 0). This happens at a time,
tfill, when the amount of PA that has diffused through the system is equal to the initial amount of PA delivered from the fractured microcapsules. This time is found analytically as the time when Equation (5) is satisfied. In this equation,
CA0 is the molar concentration of pure PA.
Based on previous and current diffusion studies, [
10]
Ceq = 3.12 × 10
−3 mol/cm
3 and D = 7.68 × 10
−9 cm
2 s
−1, and using Equations (4) and (5), values of
tfill for samples with 5, 10, 15, and 20 wt% capsule content were calculated to be 0.22, 0.50, 0.66, and 1.14 h, respectively.
For the second stage of the diffusion process, when the solvent reservoir has been depleted, no flux boundary conditions are applied at
x =
L and
x = 0. At
x = 0, this is the case because two symmetrical halves of the fracture surfaces come together. The boundary condition at
x =
L is set to no flux for convenience and because the volatility of PA at 25 °C is low. Therefore, the second stage of the diffusion process is approximated by diffusion within a flat sheet, where both surfaces
x = 0 and
x =
L are impermeable, with the initial condition being the concentration profile defined by Equation (4) at
t = tfill. The analytical solution for this problem is given in Equation (6), where
f(x’) defines the initial concentration profile
13. A schematic representation of the two-stage model is shown in
Figure 9.
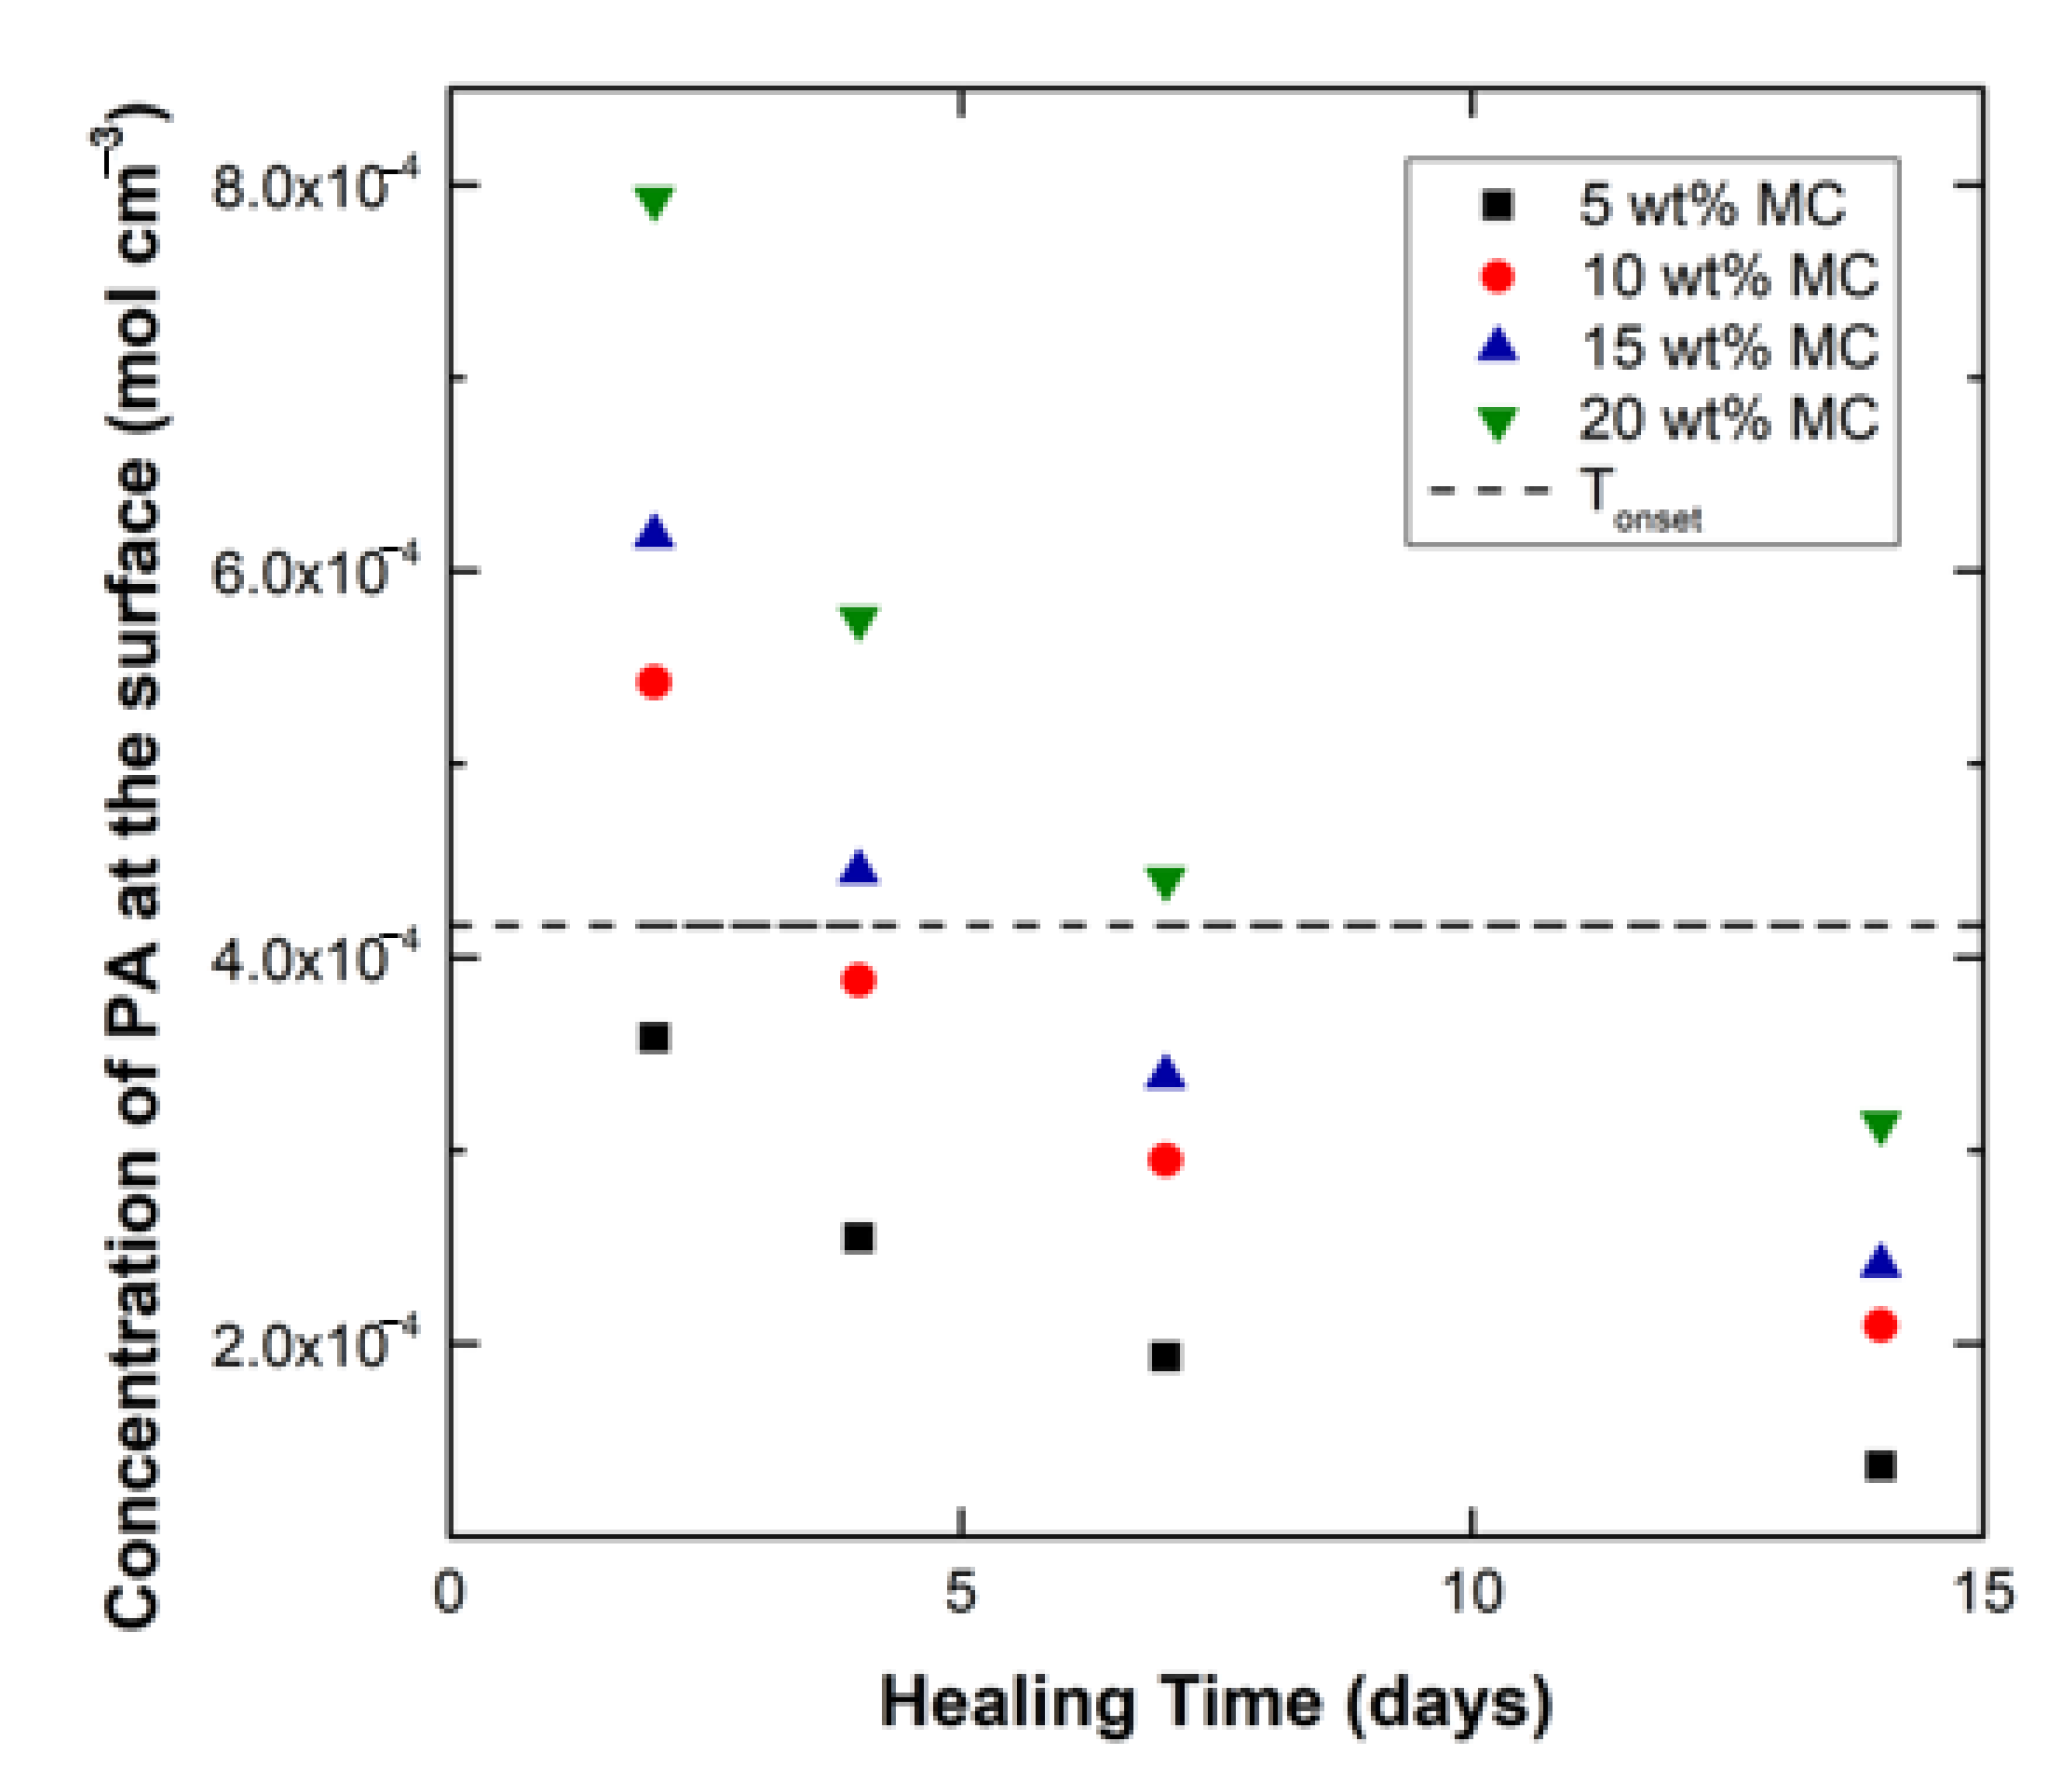
Equations (4) and (6) were used to solve for PA concentration profiles in the systems having 5, 10, 15, and 20 wt% microcapsules for healing times of 2, 4, 7, and 14 days. The resulting concentration profiles were used to obtain the surface concentration of PA for all the capsule systems at each healing time. The surface solvent concentration values in turn were used in Equation (2) to predict the T
onset values at the time of healing and subsequent testing. Using the procedures described above, the calculated concentrations of PA at the crack surface for the four capsule contents at varying healing times are plotted in
Figure 10. In addition, the concentration of PA that results in a T
onset of 25 °C is shown as a horizontal line on the plot.
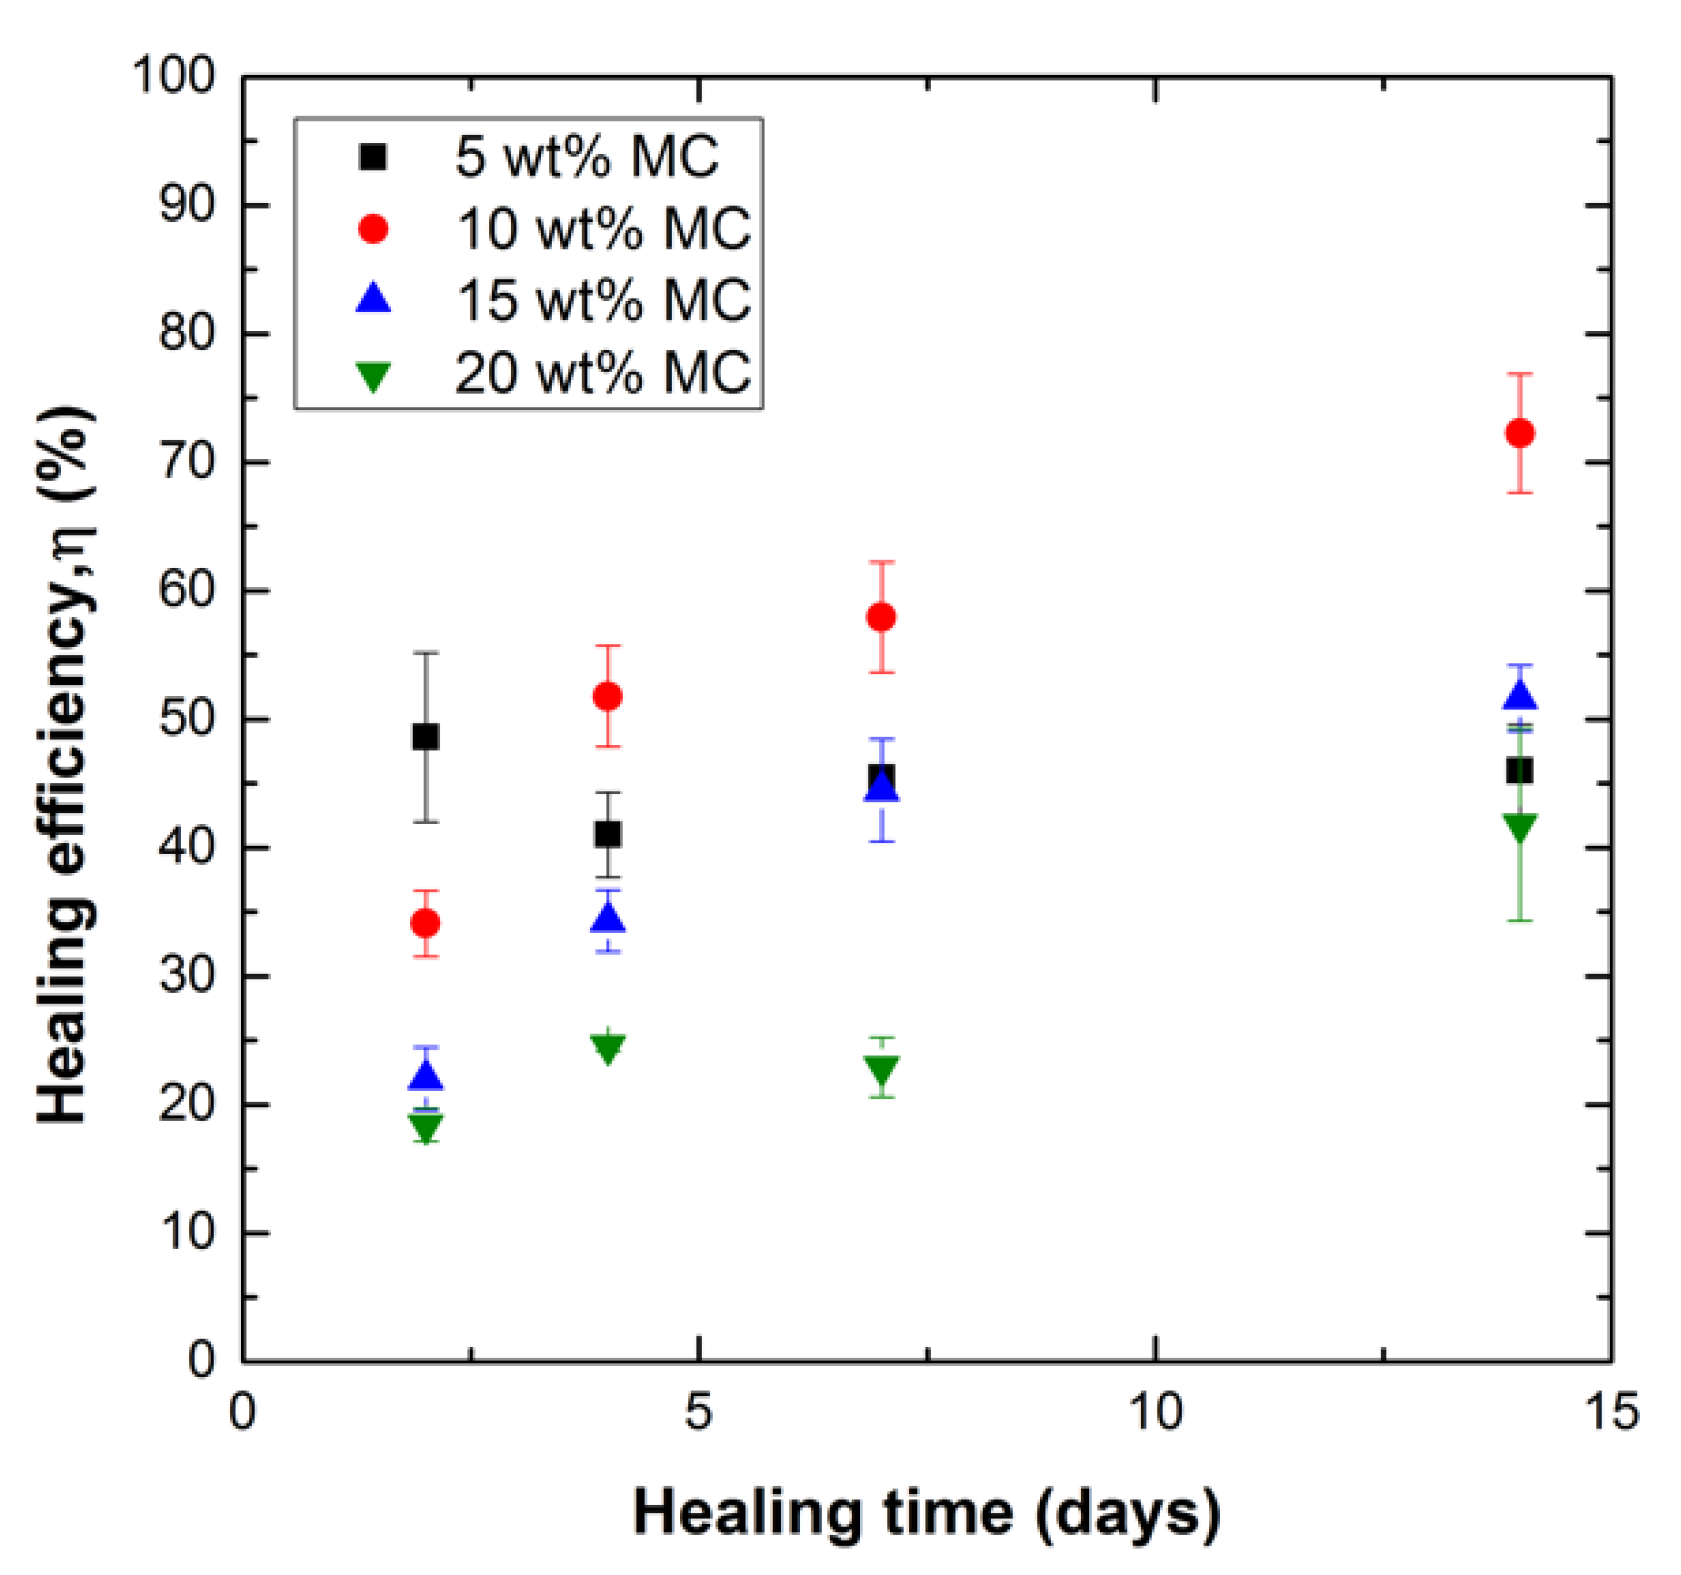
The model results suggest that for initial healing times (2–4 days), the samples with higher capsule content (10, 15, and 20 wt%) would be significantly affected by solvent plasticization. After 2 days of healing, the 10, 15, and 20 wt% samples are predicted to have very high concentrations of PA at the crack interface, as they are well above the Tonset = 25 °C threshold. This high amount of PA means that the plasticized crack interface of these samples will have a Tonset below 25 °C and a Tg much lower than that of the cured neat resin. As the healing time progresses to 4 and 7 days and the PA diffuses from the crack throughout the polymer, the 10 and 15 wt% systems move below the threshold line while the 20 wt% samples still contain enough PA to keep them fully plasticized and weak. At 14 days, all systems are below the threshold PA concentration, although the concentration varies proportionally to the capsule content. The healing efficiency of systems with Tonset less than 25 °C at the crack interface are predicted to exhibit poor healing efficiency.
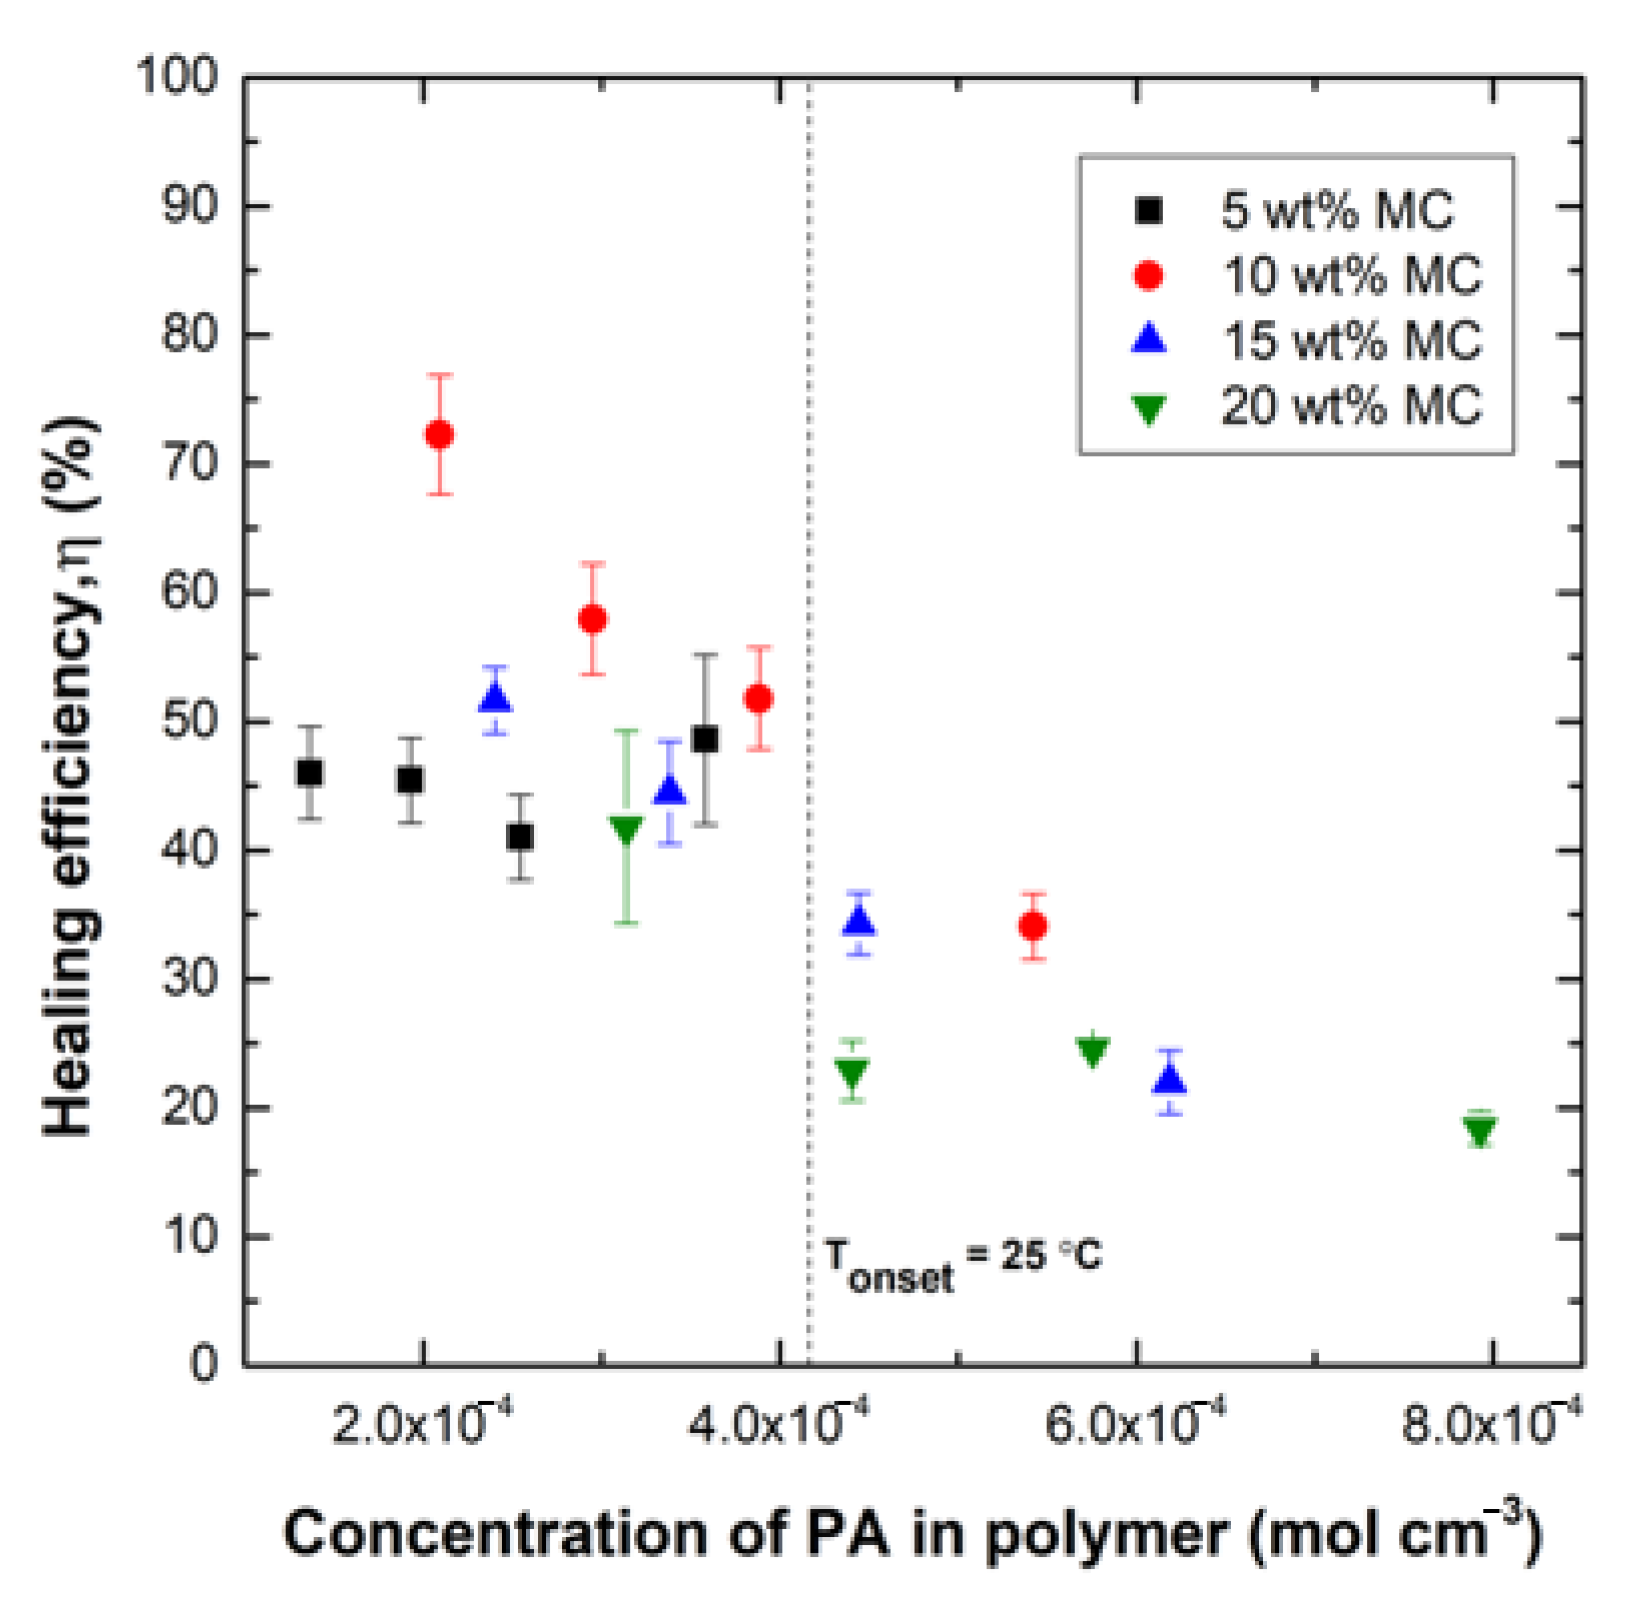
The healing efficiency values for all samples were compared to the PA surface concentration values predicted by the analytical model. These values are given in
Figure 11 as a plot of healing efficiency versus calculated surface concentration of PA. The concentration needed for T
onset = 25 °C is also plotted as a vertical line that can be used to differentiate which specimens would be severely affected by plasticization and which would not. The points to the right of the line are predicted to be highly plasticized and, in fact, show reduced healing efficiencies ranging from 20–35% than the points to the left of the line, which have healing efficiencies ranging from 40–75%. The plot also shows that for 5% loading, the interfacial solvent concentration is lower than the T
onset threshold for all healing times.
Figure 11 can also be used to define the sets of points that are not significantly affected by plasticization, allowing for meaningful comparisons to better understand the influence of capsule loading on healing efficiency. Comparisons of the datasets to the left of the T
onset concentration show that there is an optimum capsule loading in the range of 10% for these systems that is not a result of plasticization. For the same predicted low concentration of solvent, the healing efficiency for 10% capsule loading is always highest. There are several potential explanations for this result currently under investigation: (1) Greater amounts of maleimide could saturate furan sites at the interface, resulting in less bridging between fracture surfaces; (2) increasing capsule concentration decreases the surface area available for bonding; and (3) more debris is generated with a higher concentration of capsules, which further reduces the available surfaces for bonding. We conclude that the observed optimum capsule concentration is not only a result of the plasticization effect as it remains observable when the solvent dissipates.


