Supermolecular Structure of Poly(Butylene Terephthalate) Fibers Formed with the Addition of Reduced Graphene Oxide


Abstract
:
1. Introduction
2. Materials and Methods
2.1. Materials
2.2. Graphene Oxide Preparation
2.3. Reduced Graphene Oxide Preparation
2.4. Preparation of PBT/rGO Fibers
2.5. Methods
3. Results and Discussion
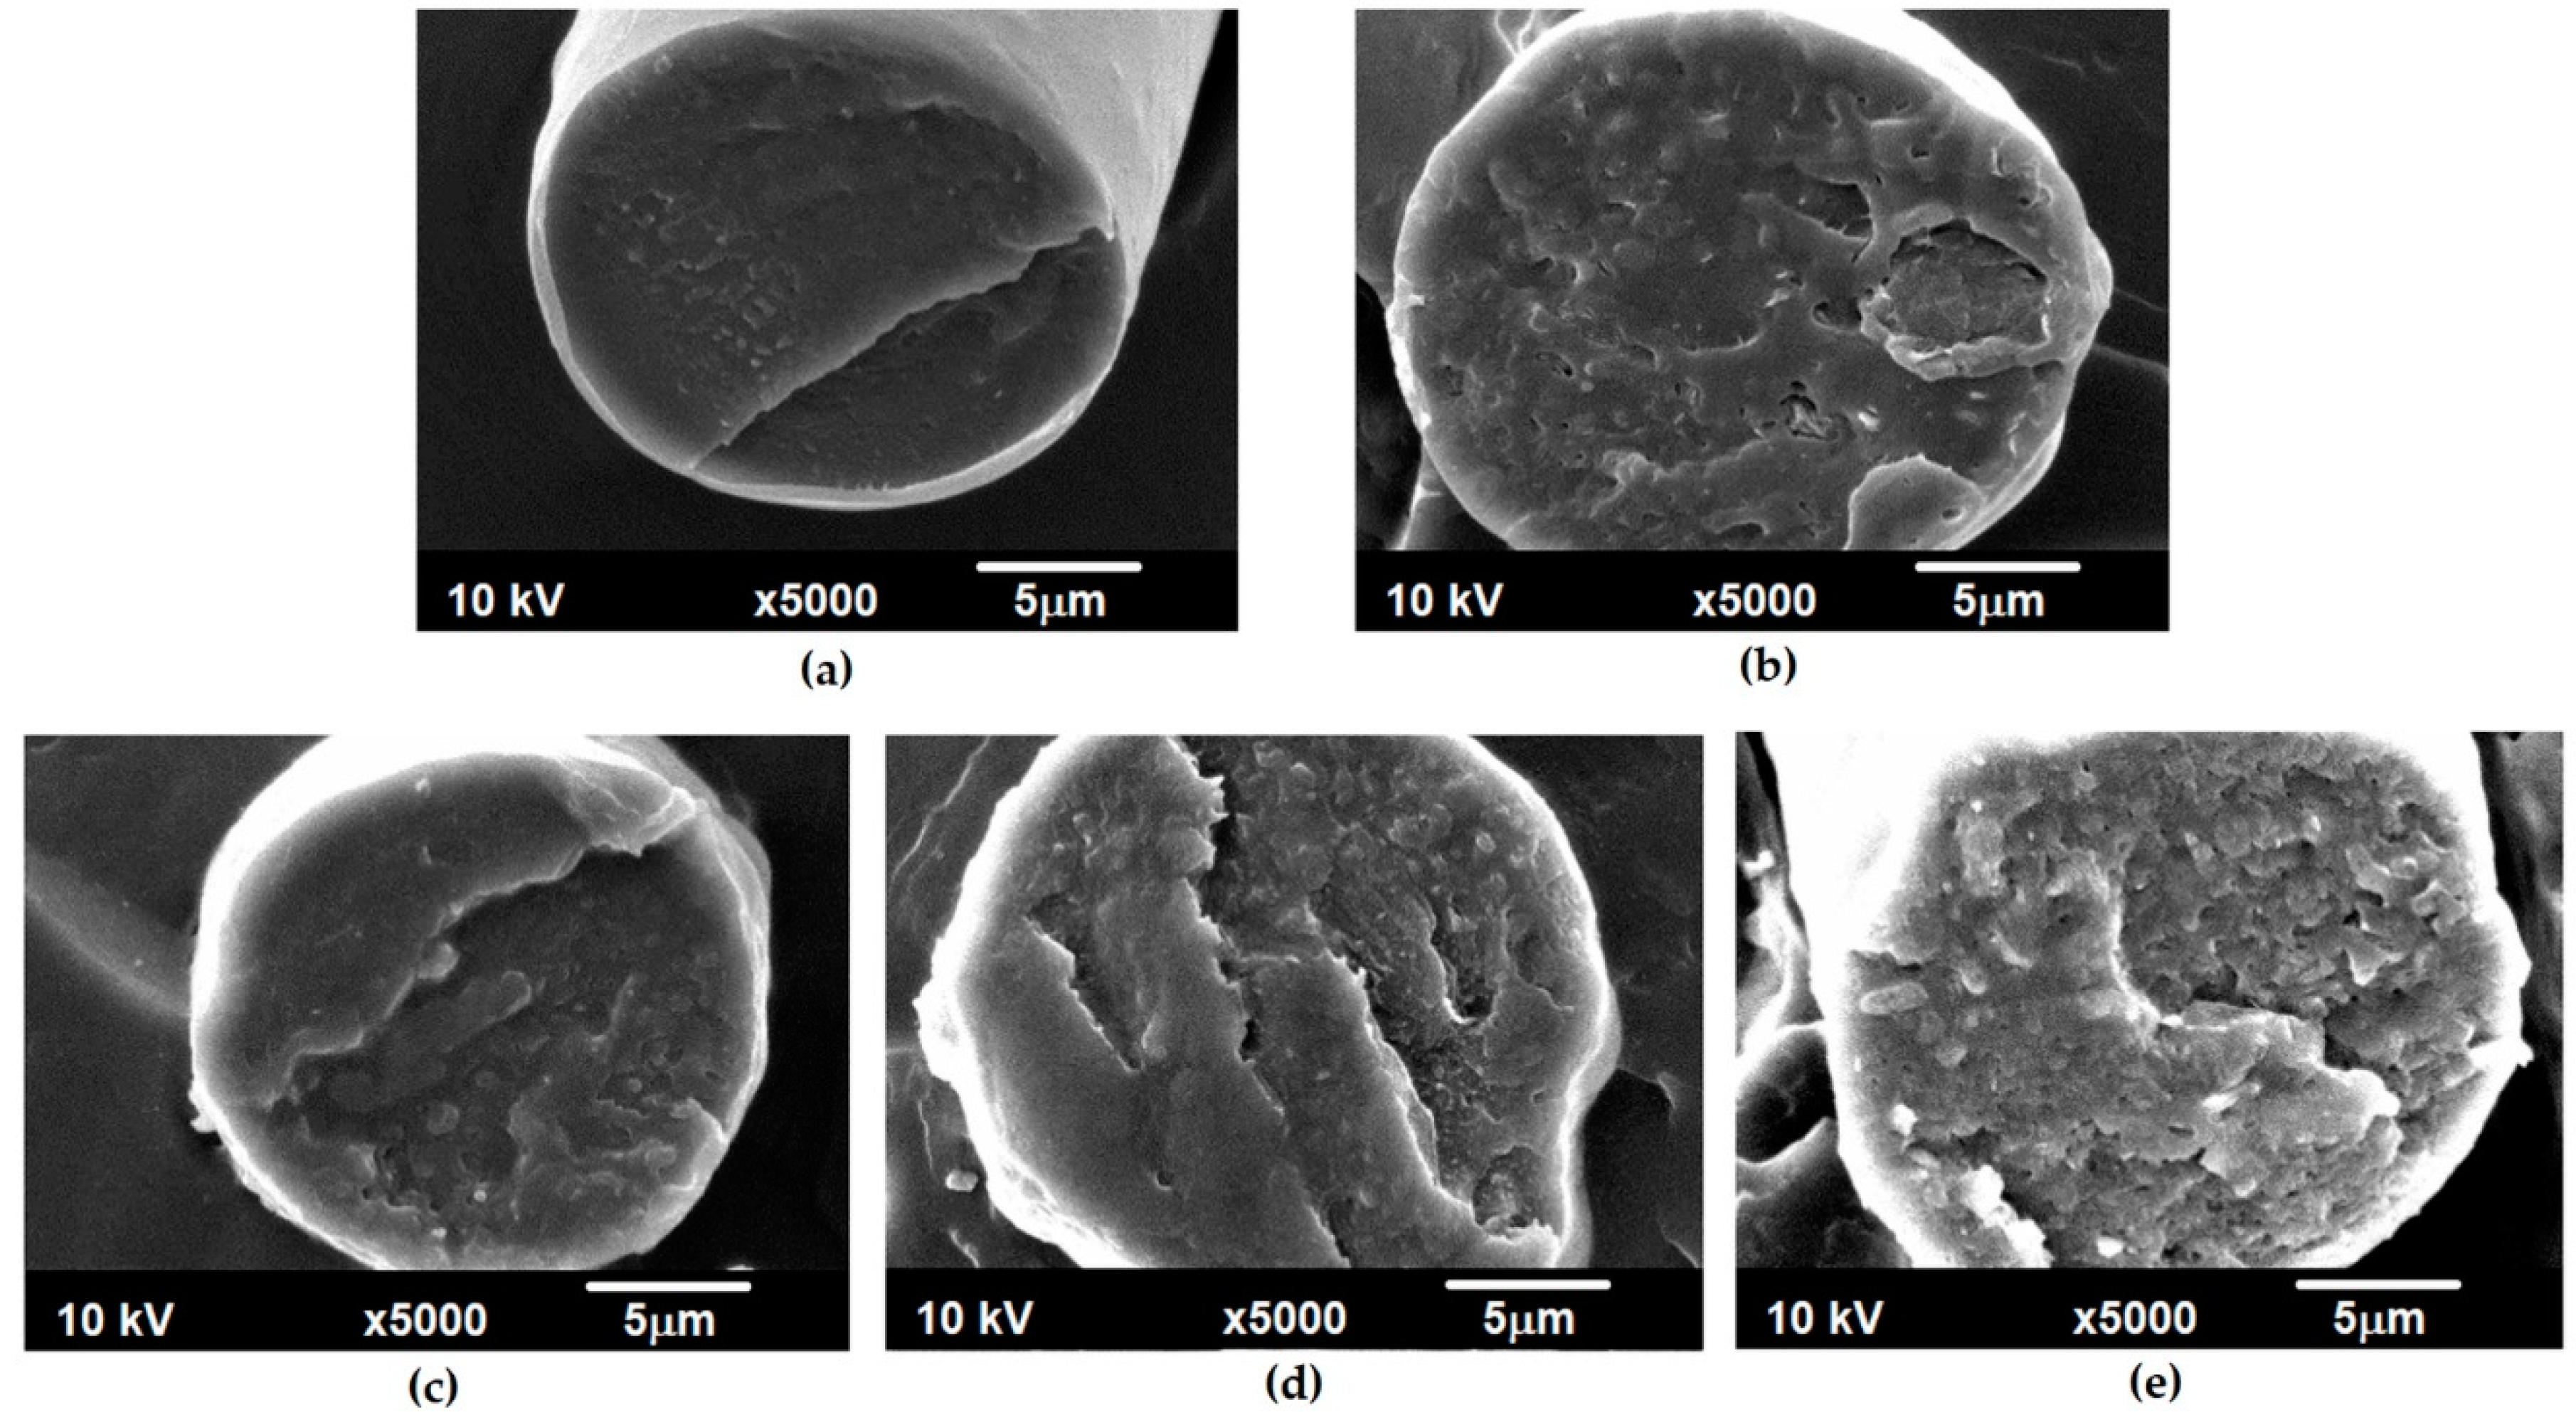
3.1. Morphological Analysis
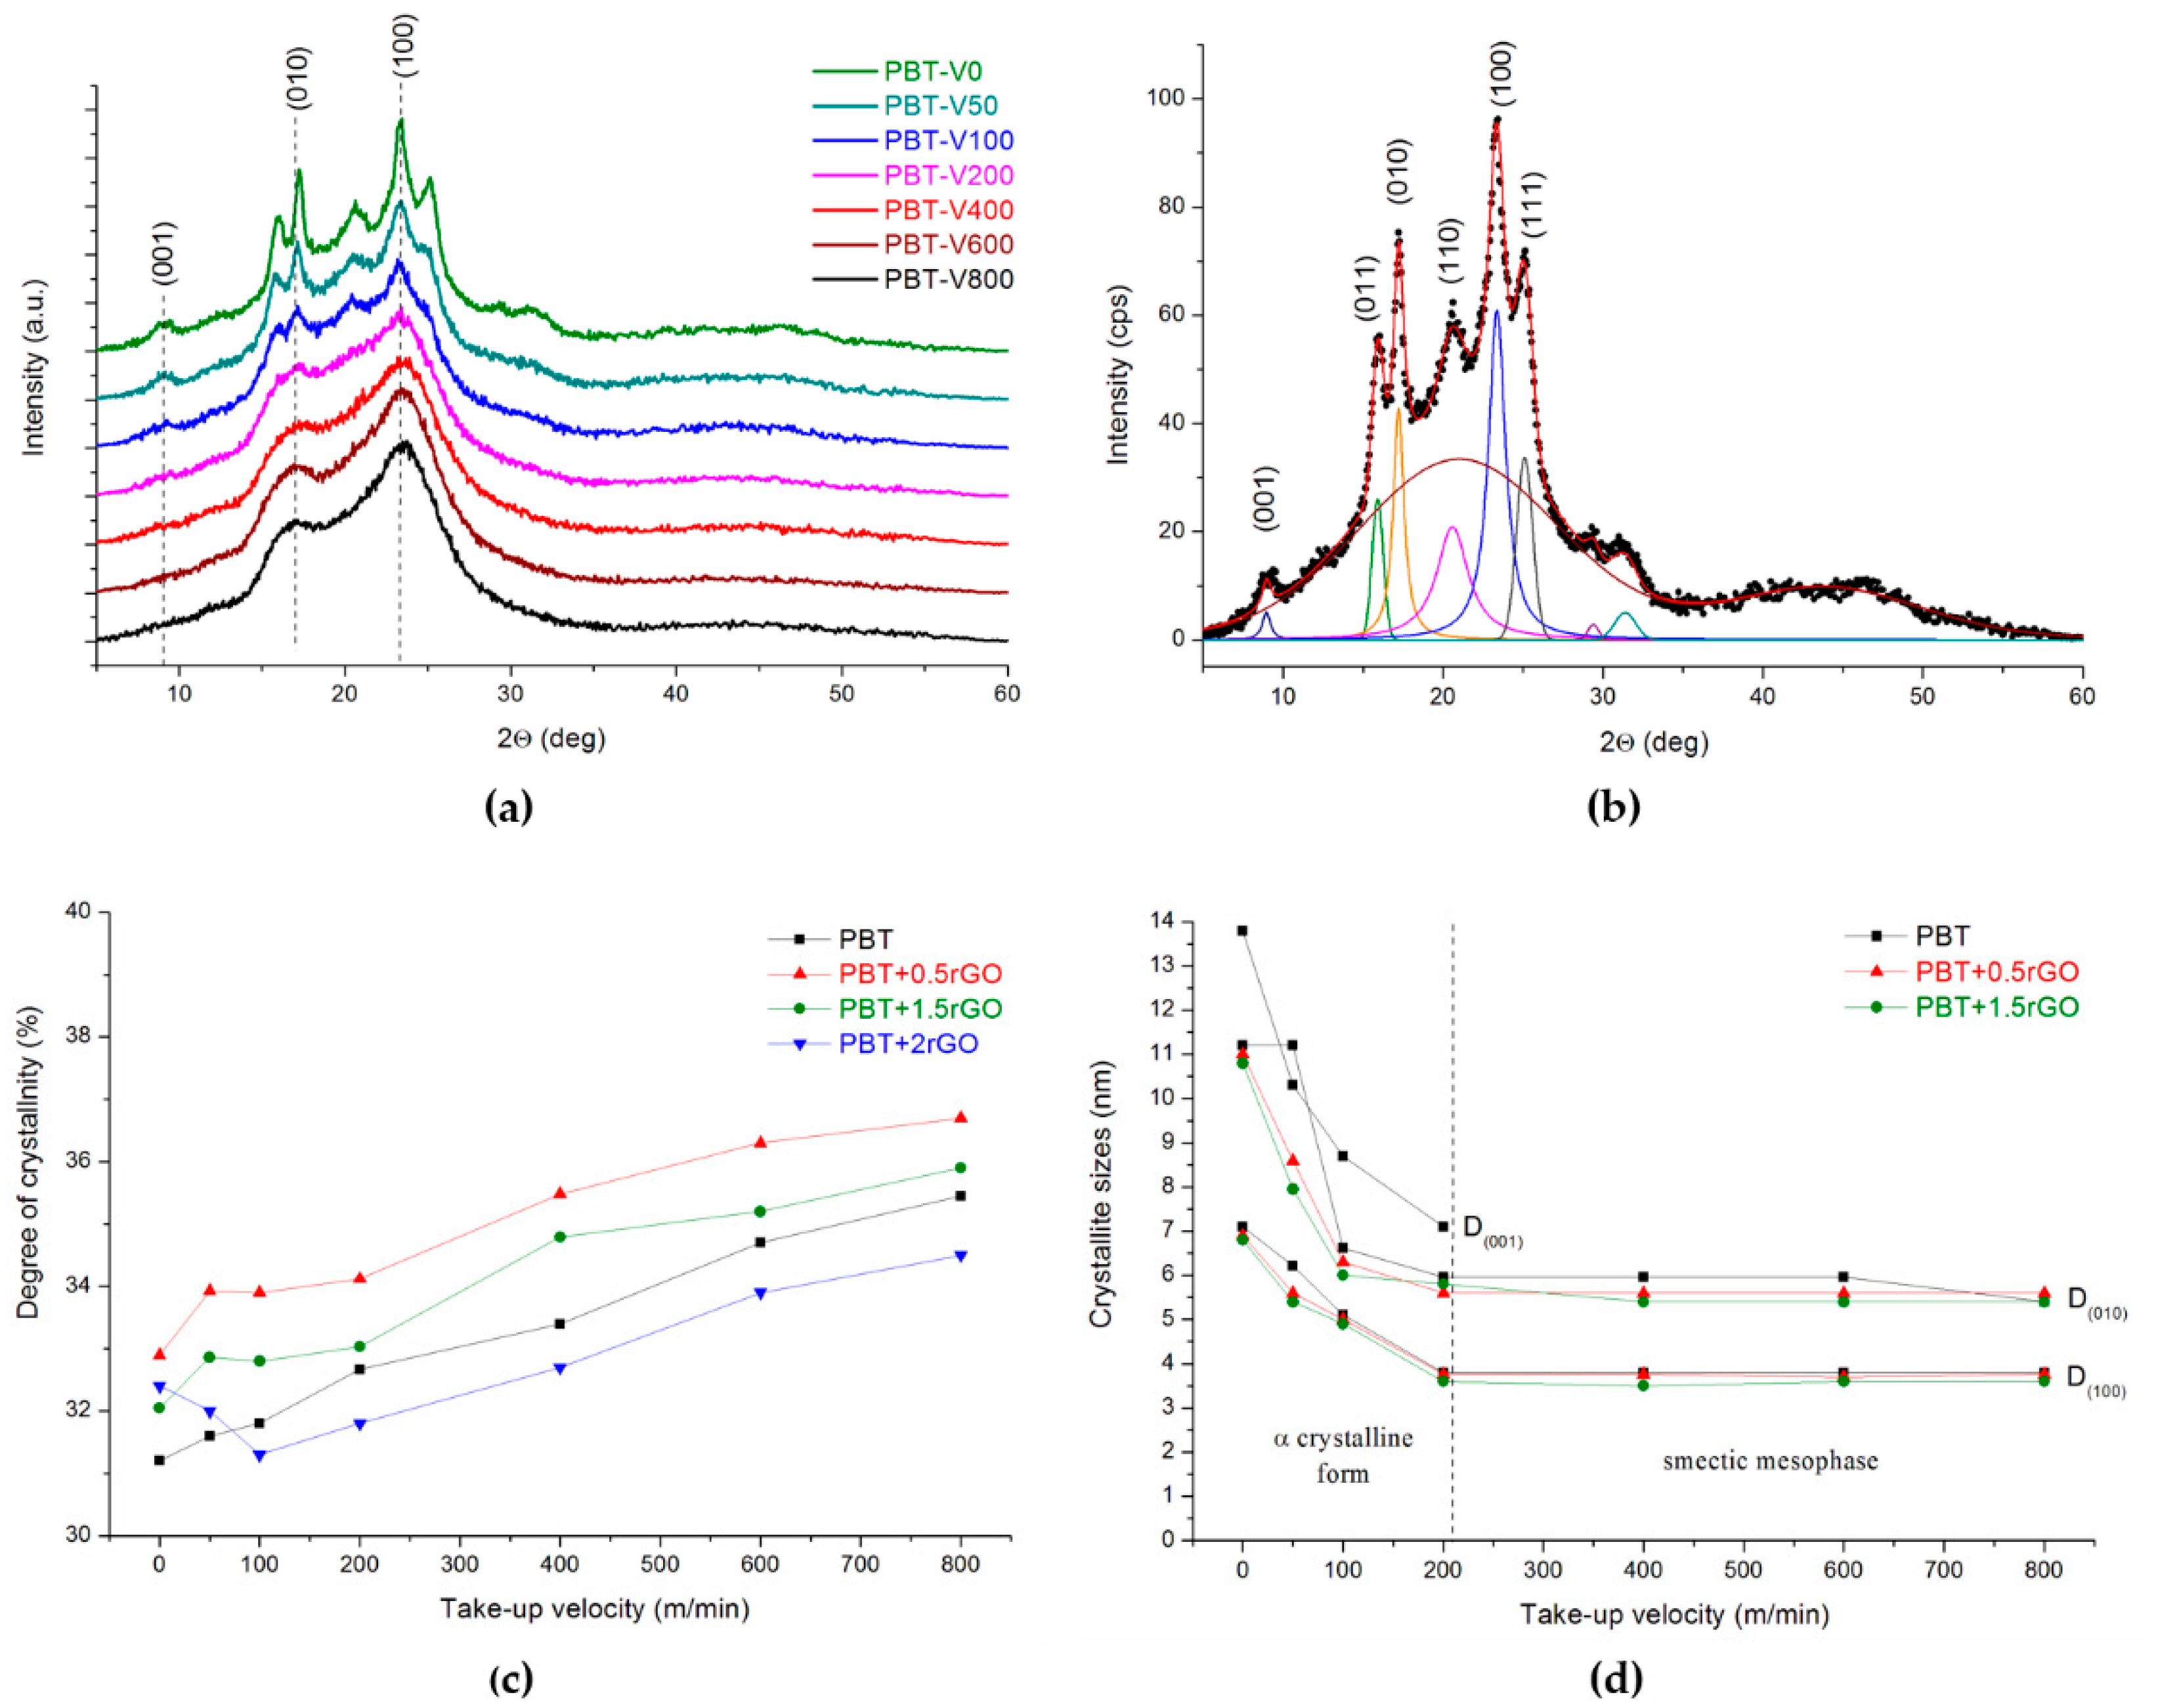
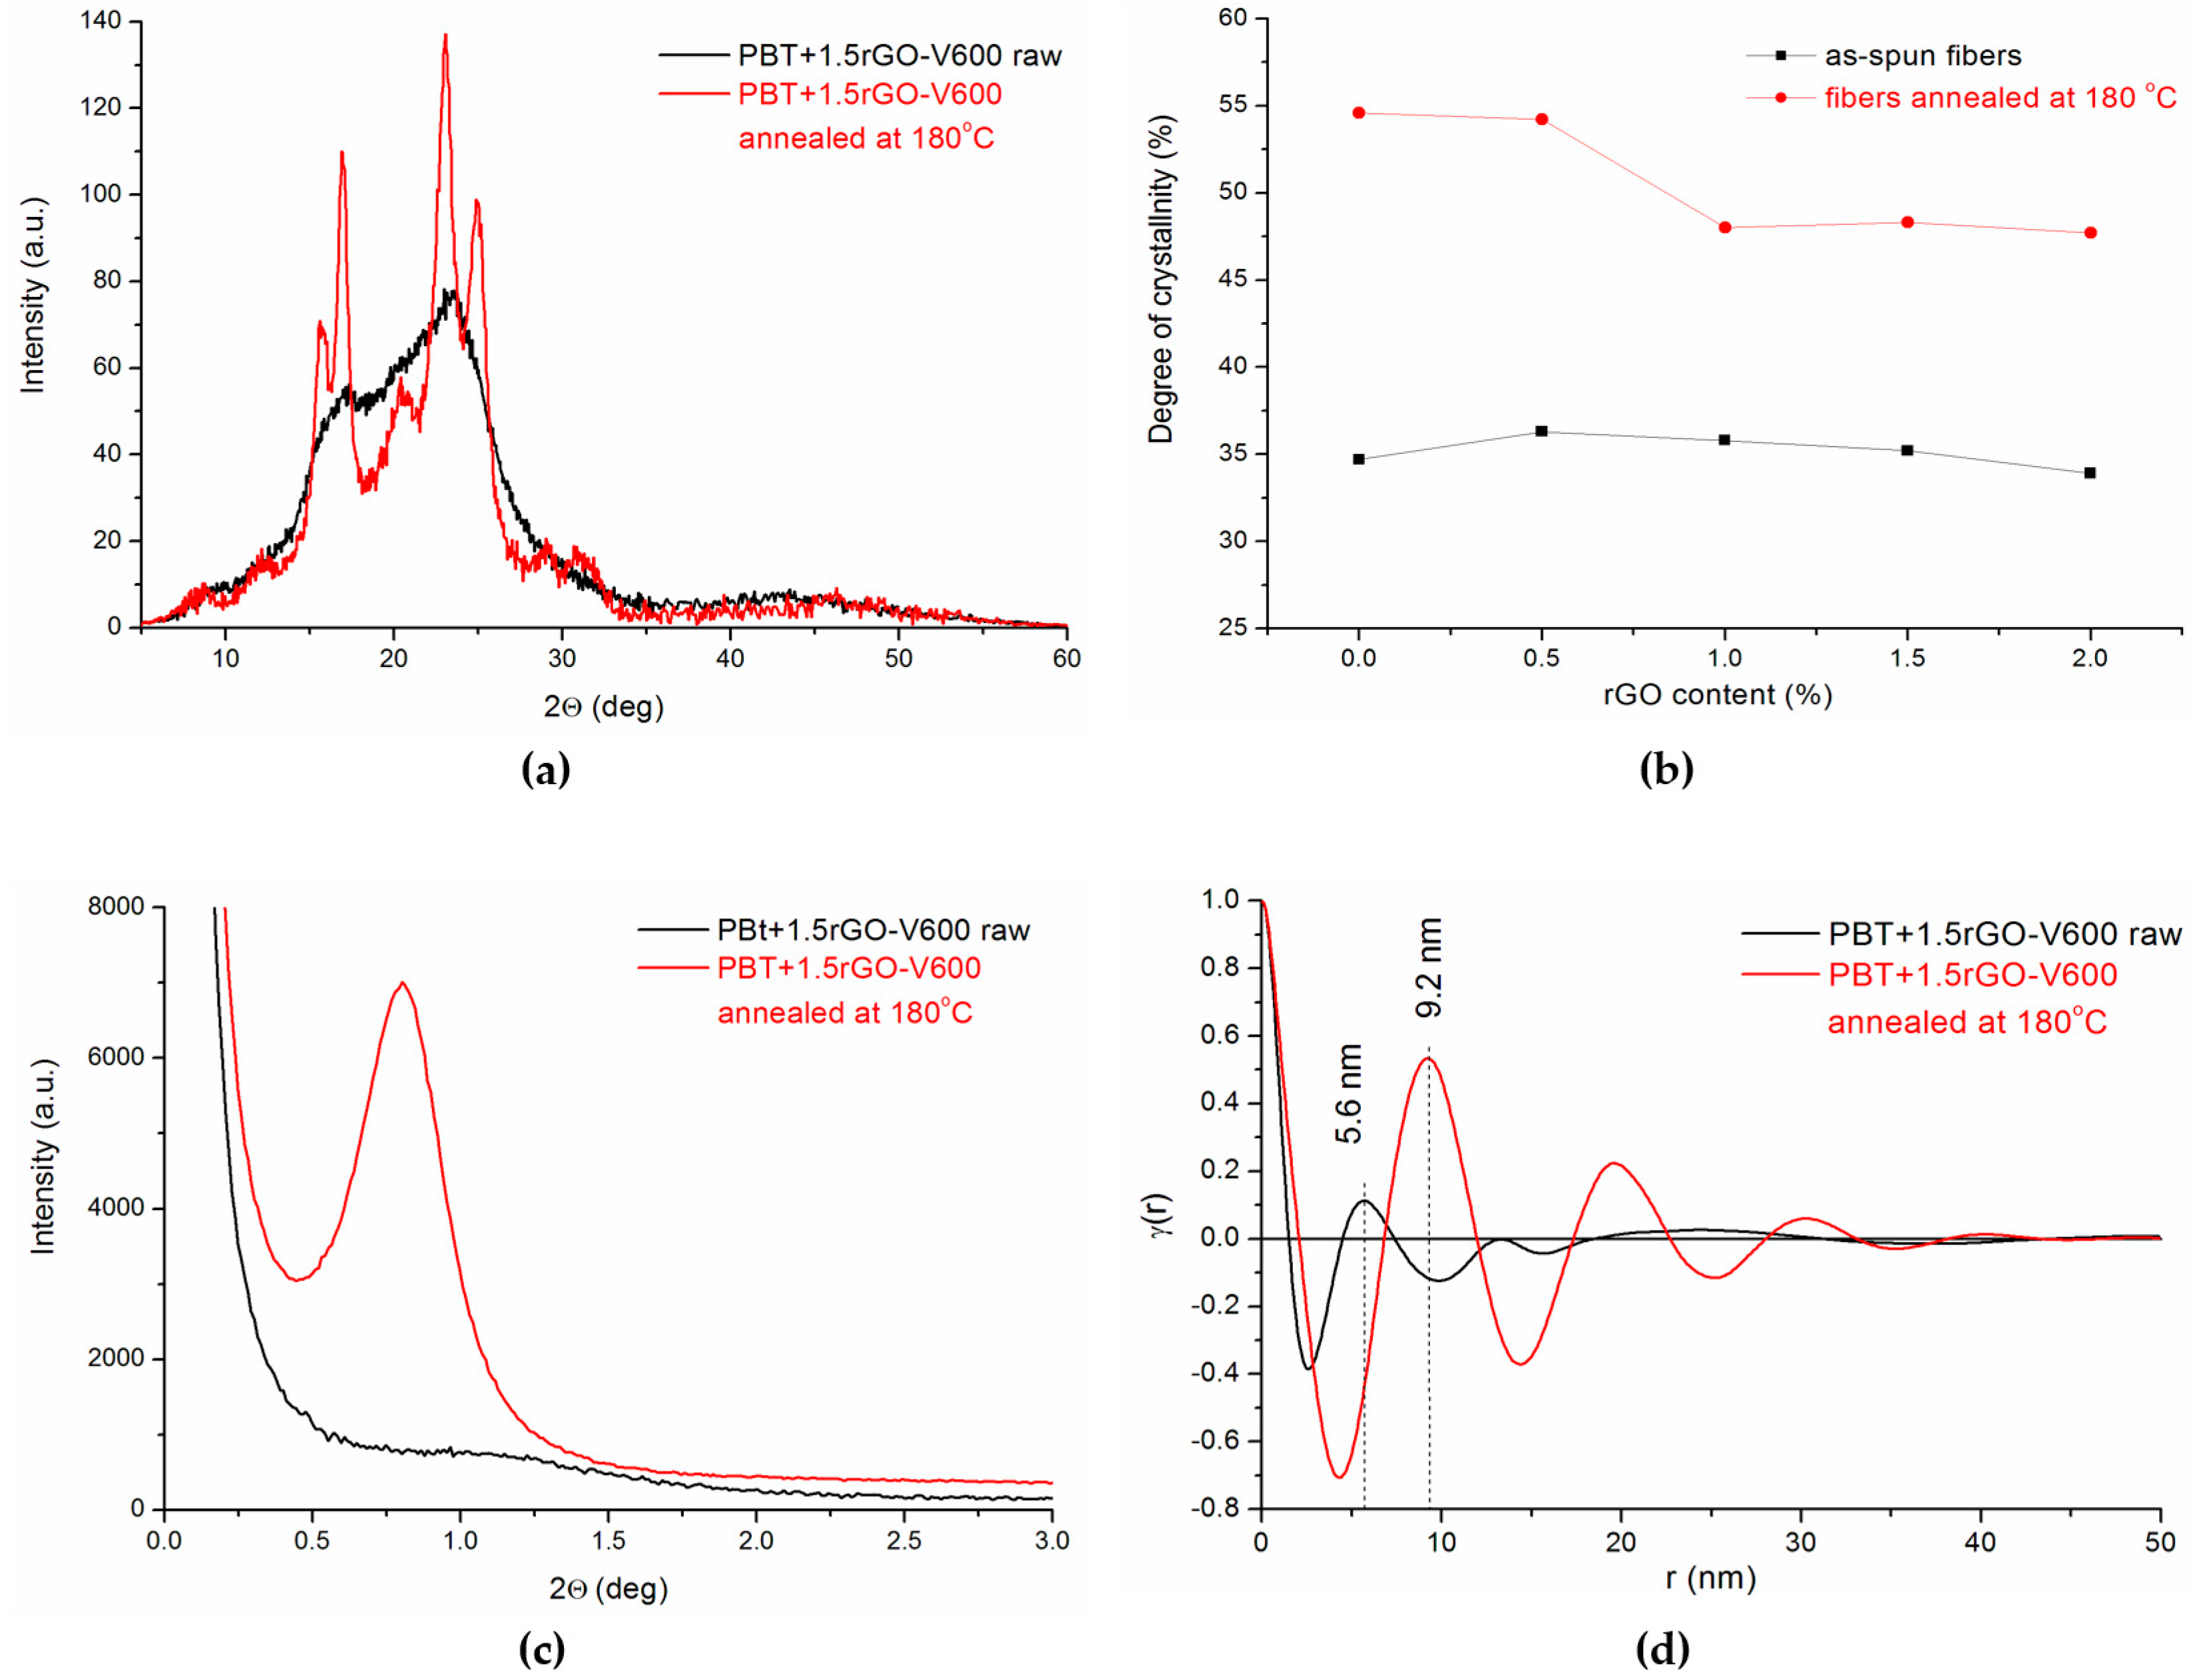
3.2. X-ray Studies
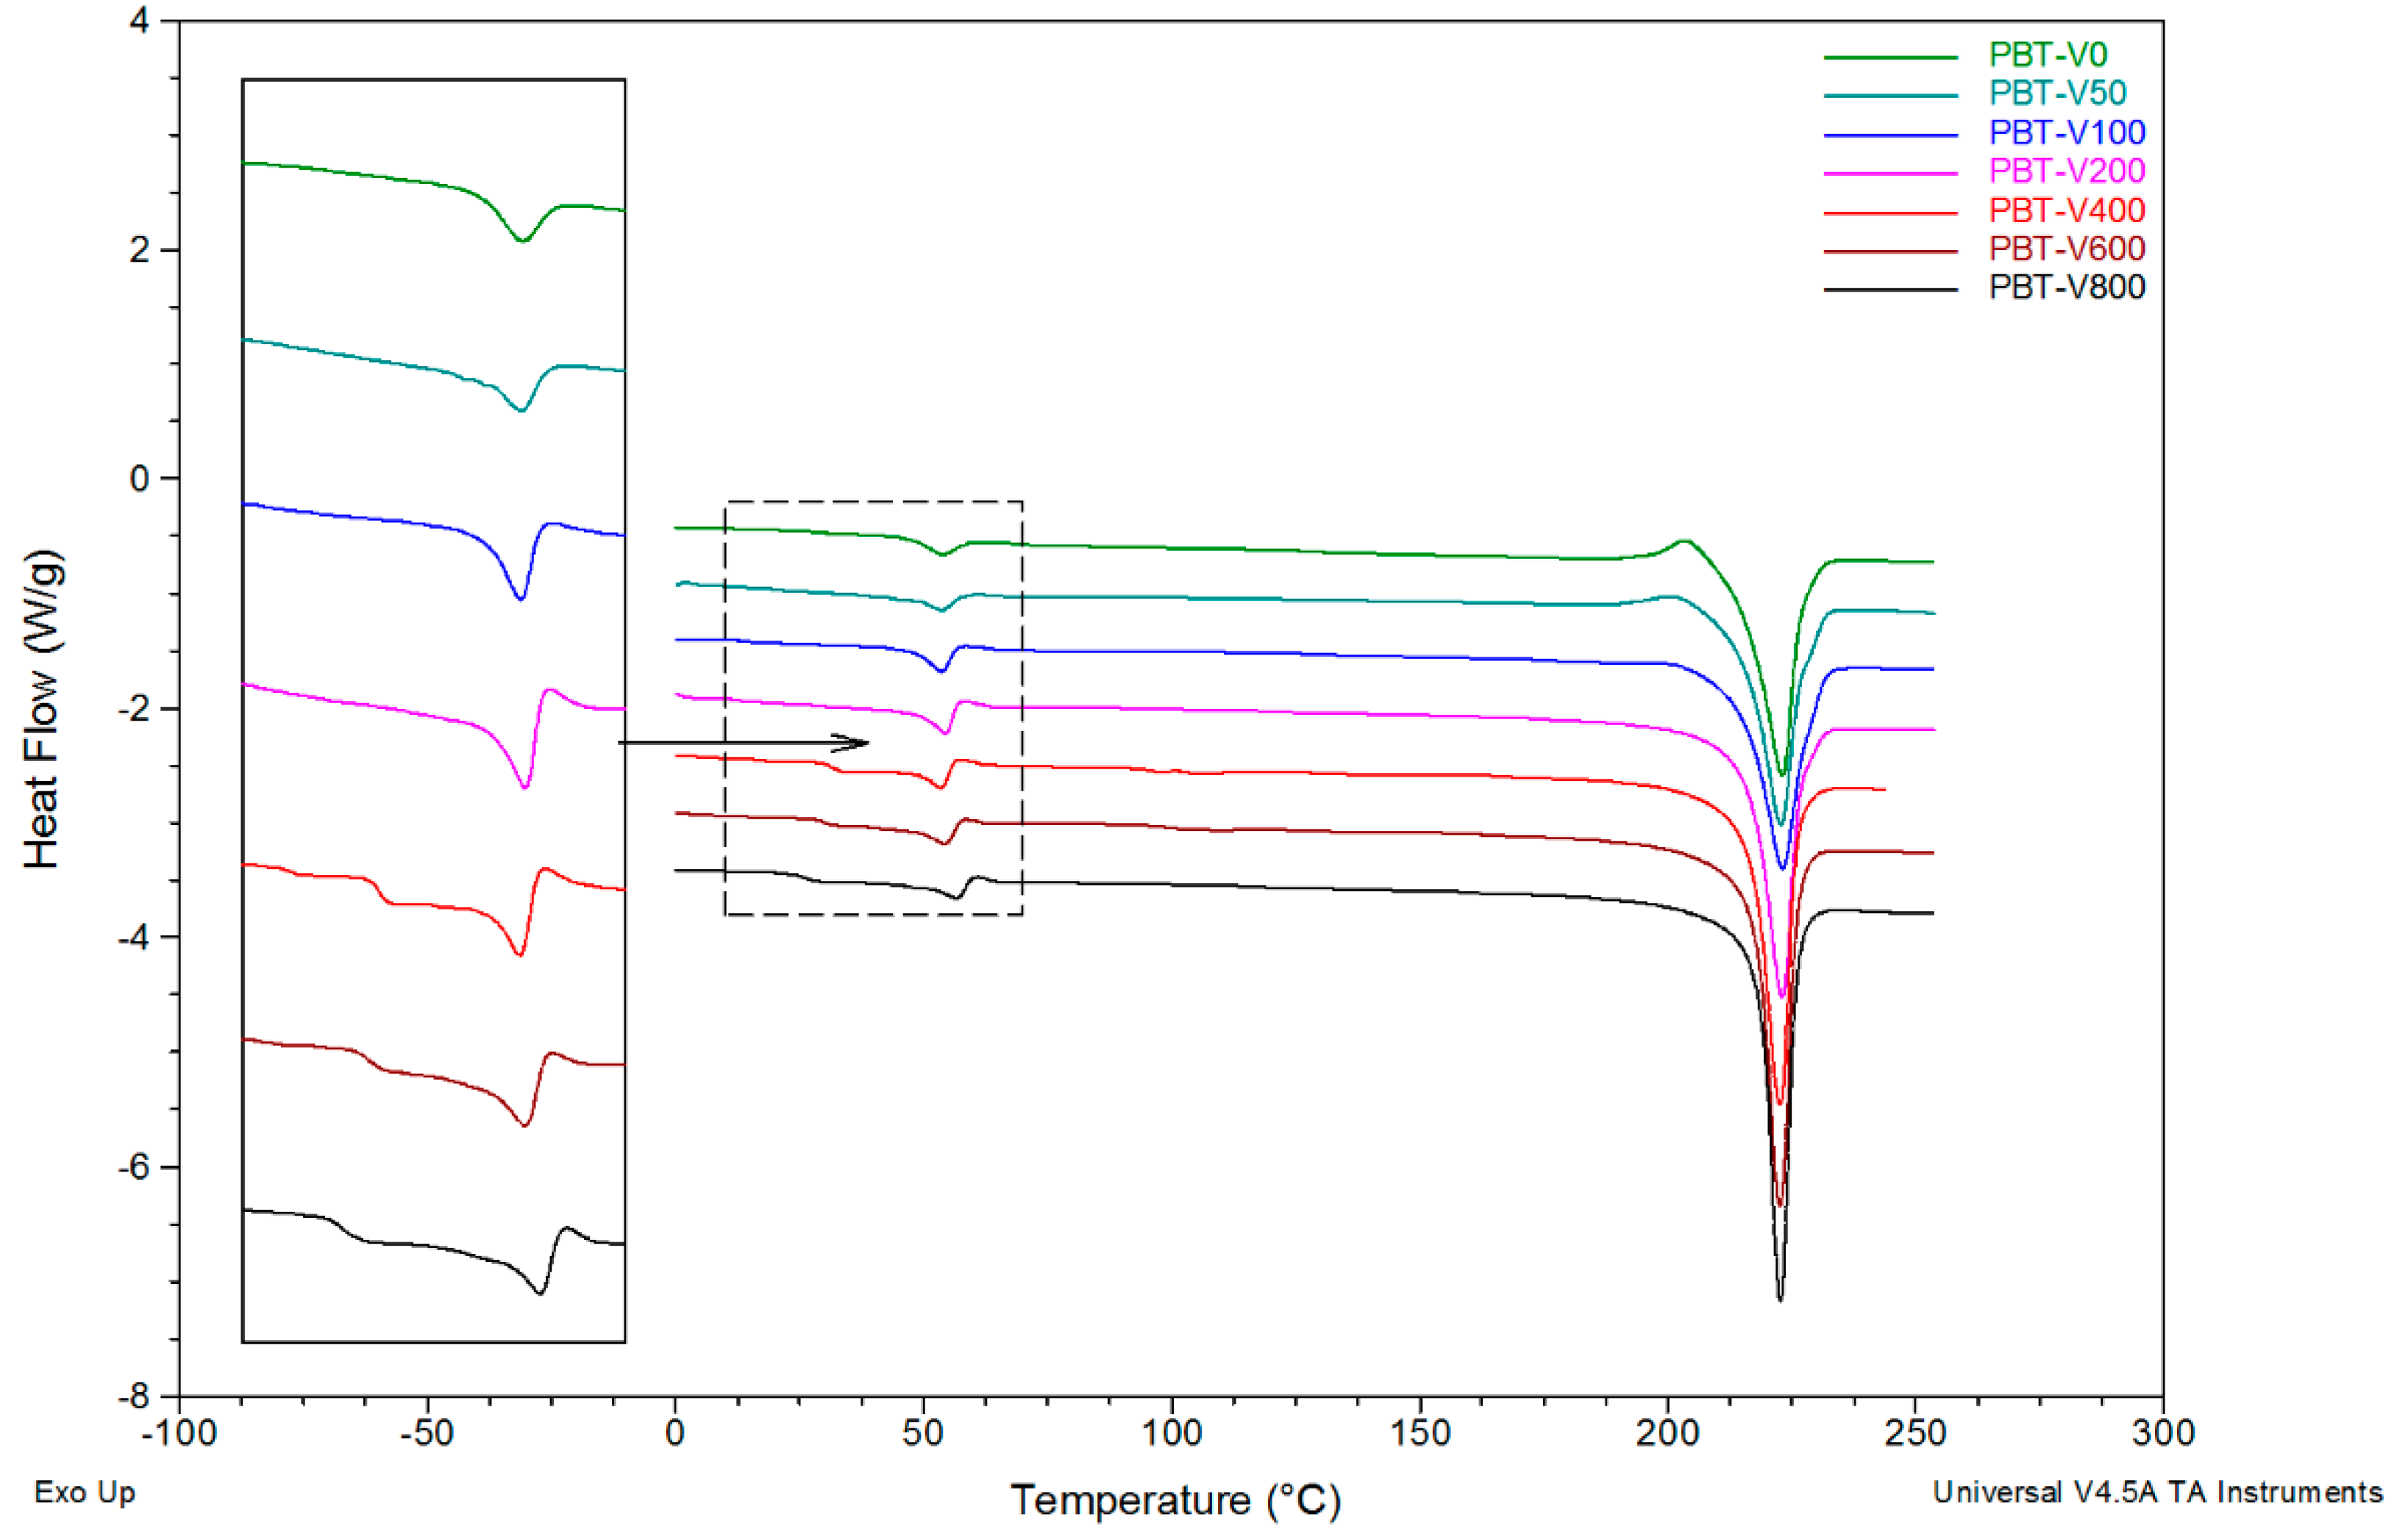
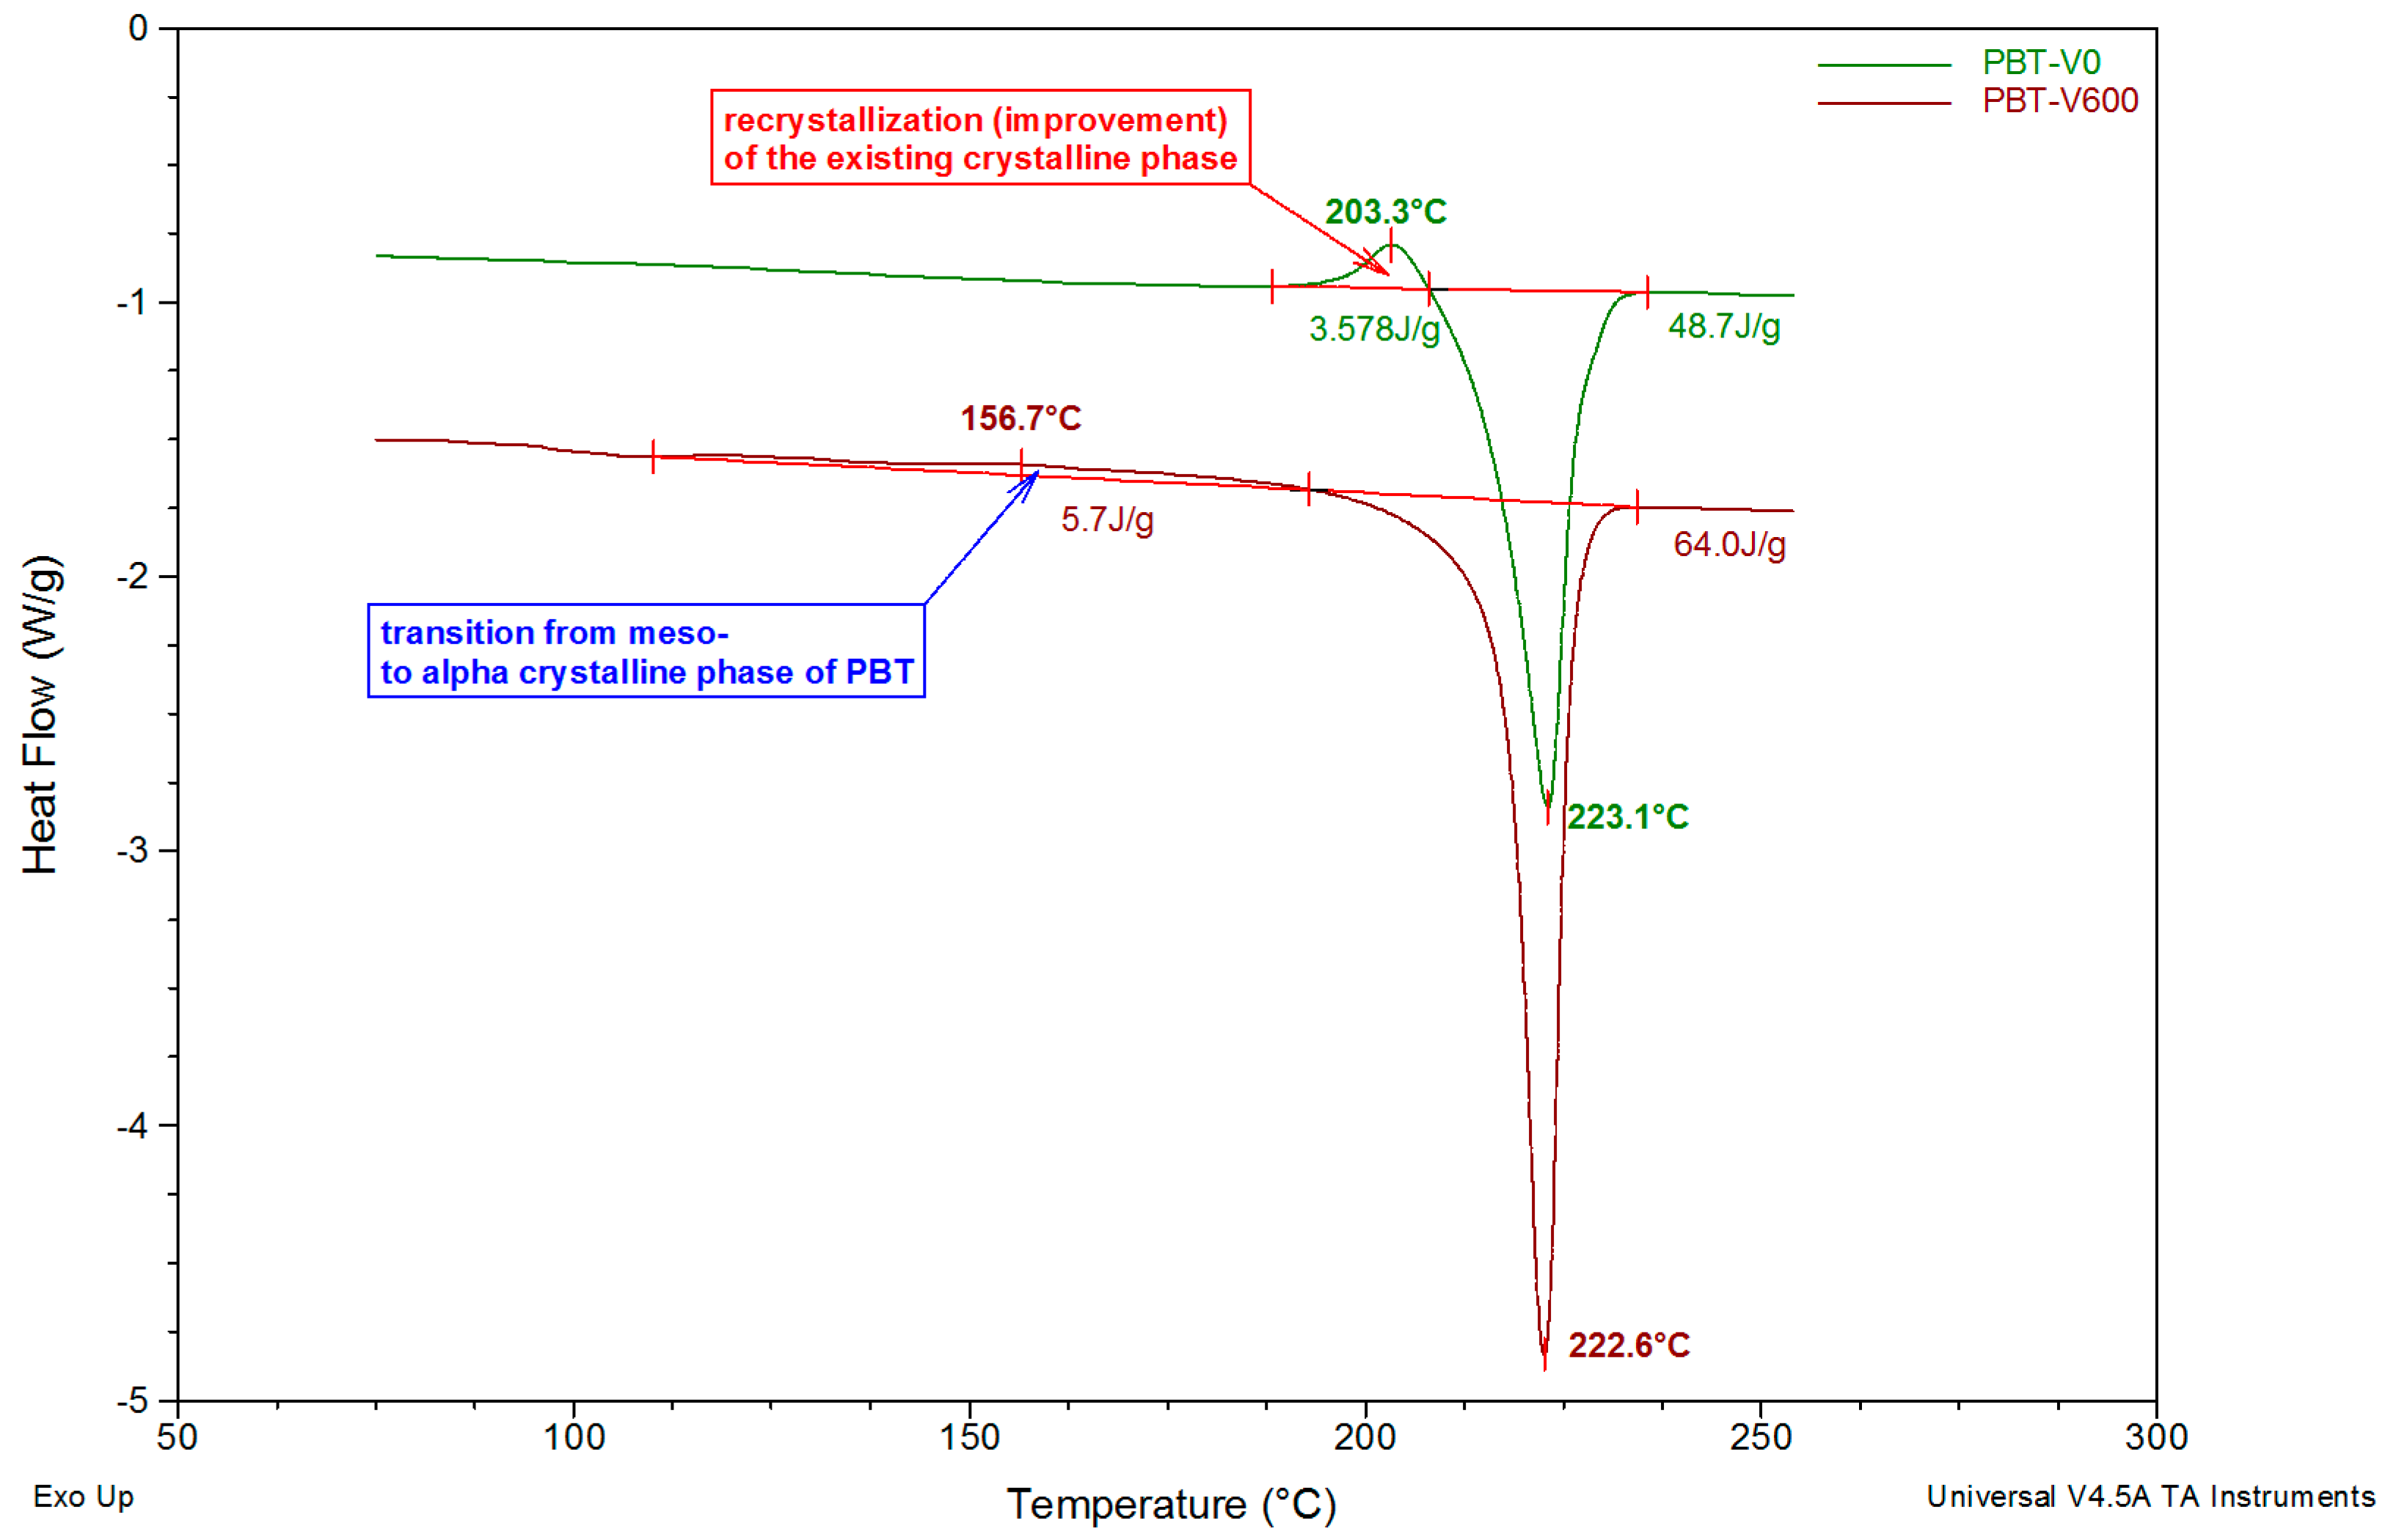
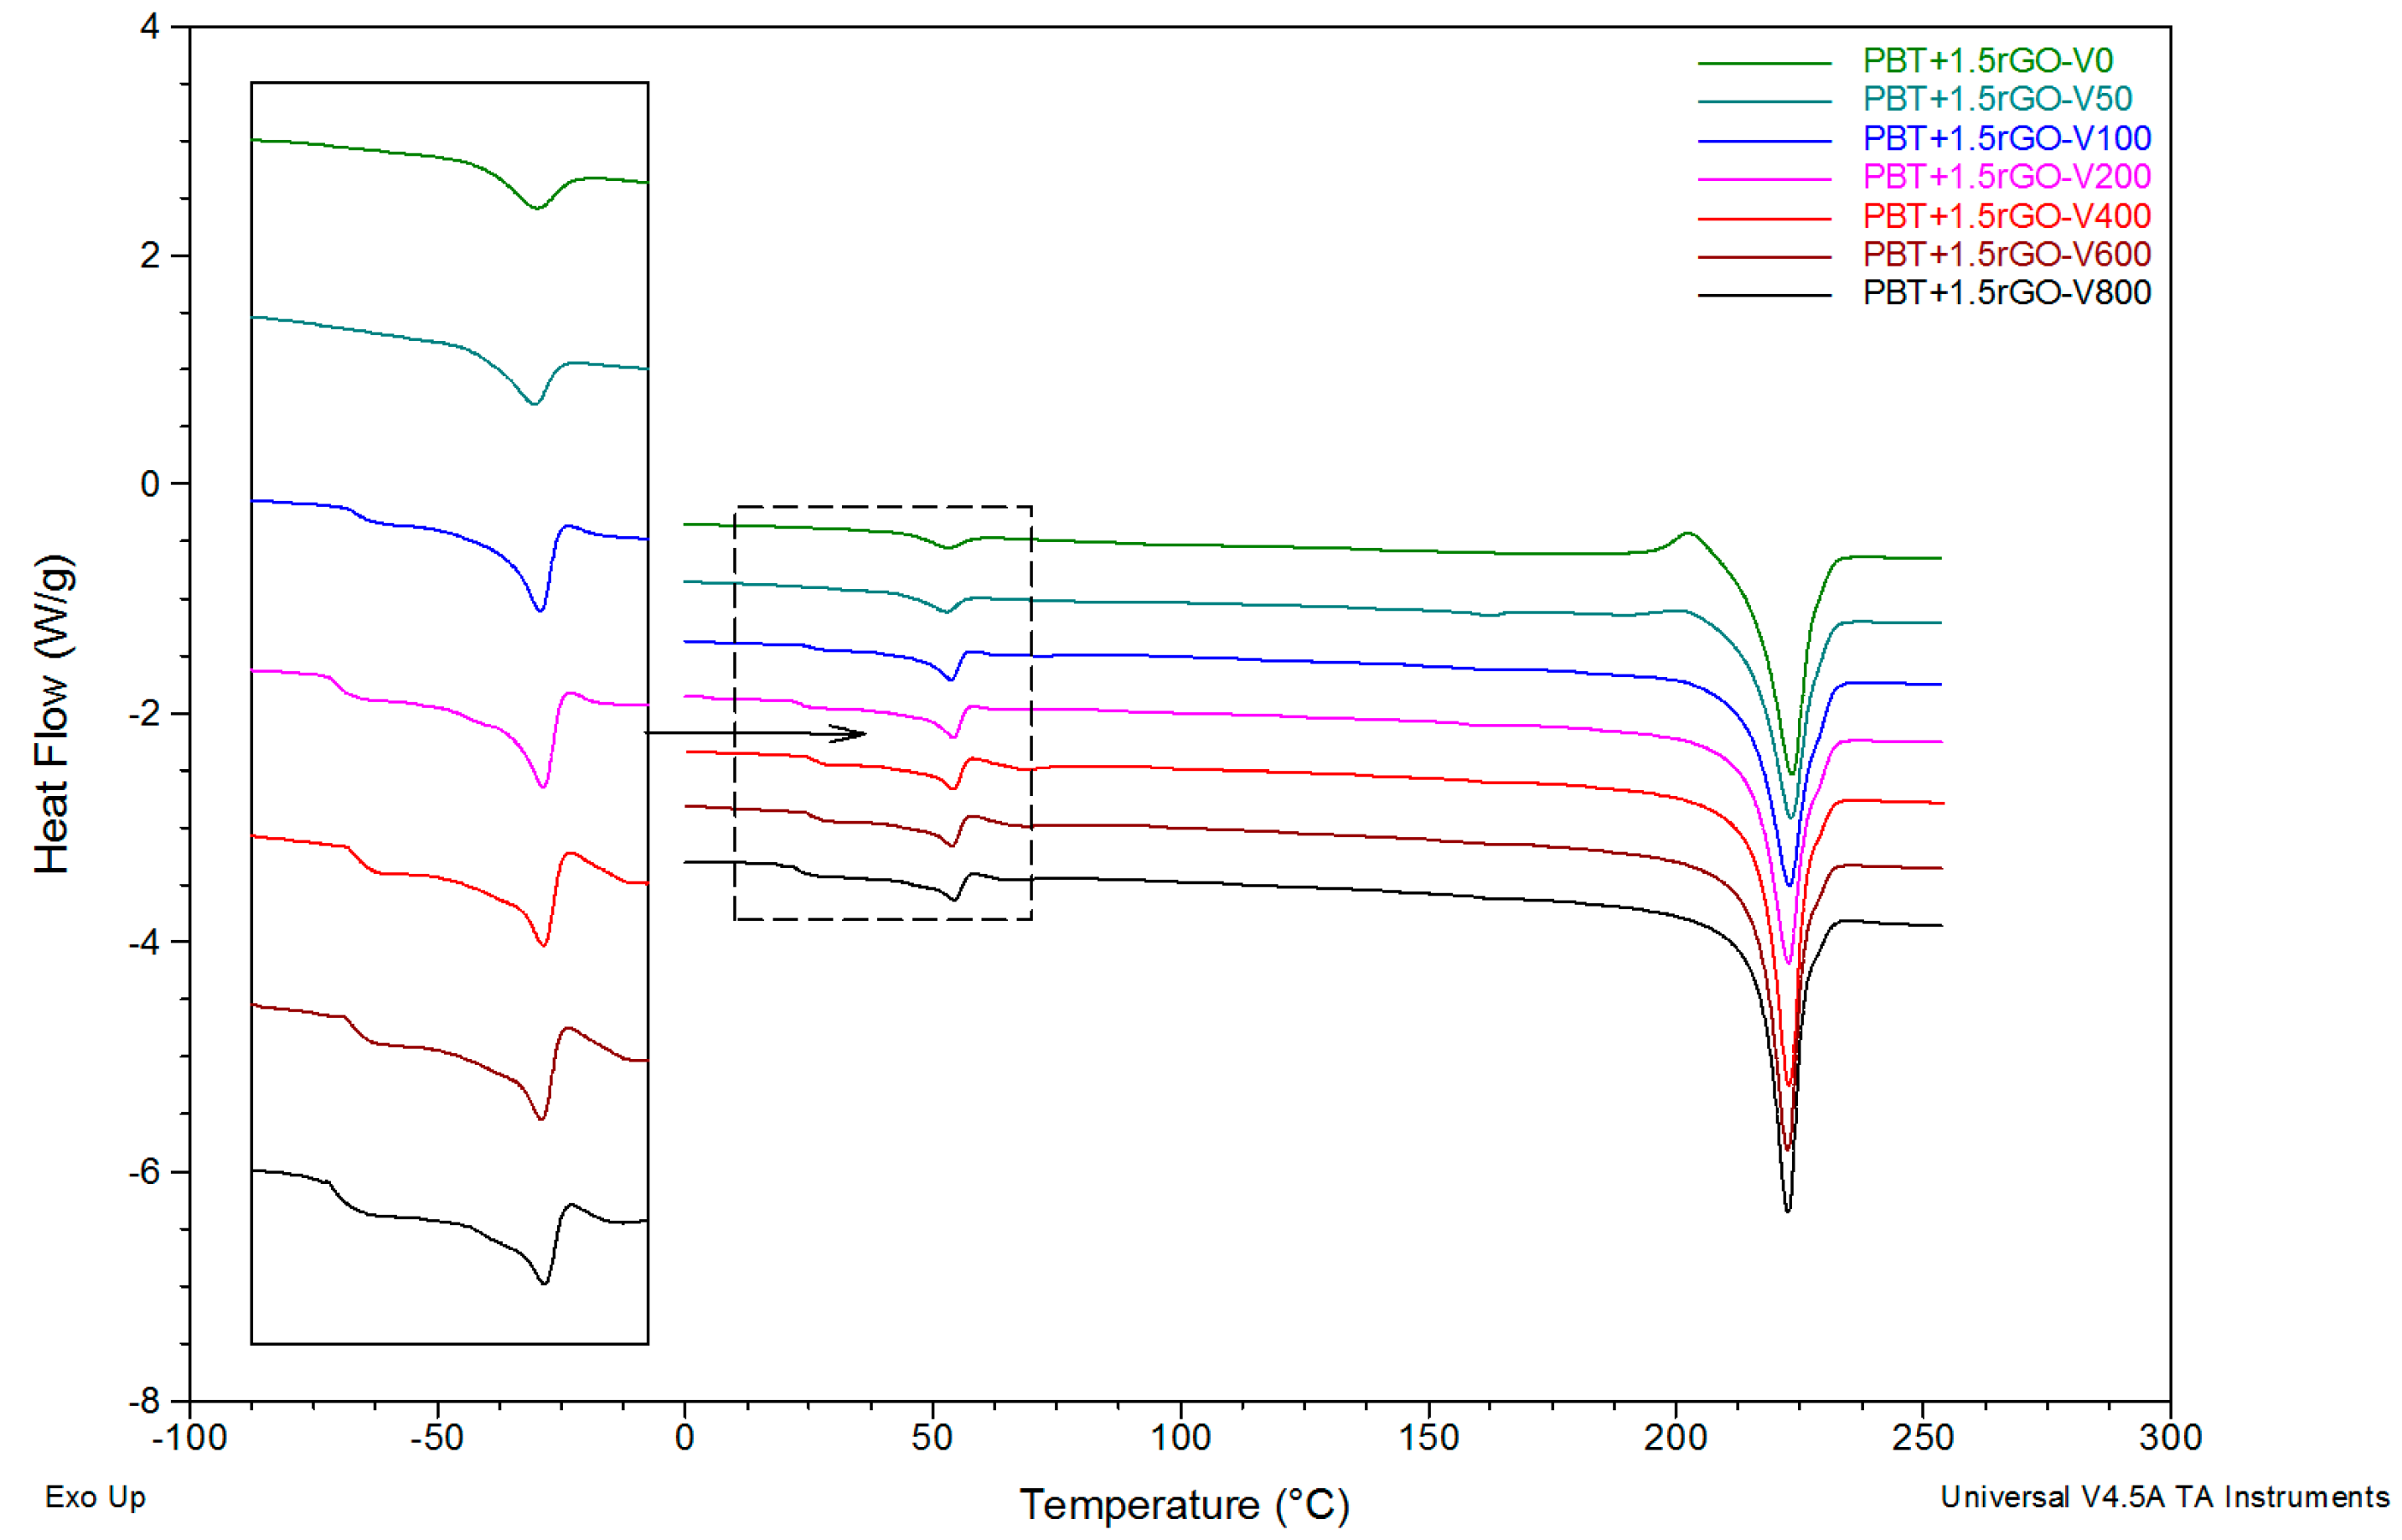
3.3. DSC Studies
3.4. Effect of Spinning Conditions and rGO Content on Fiber Structure Development
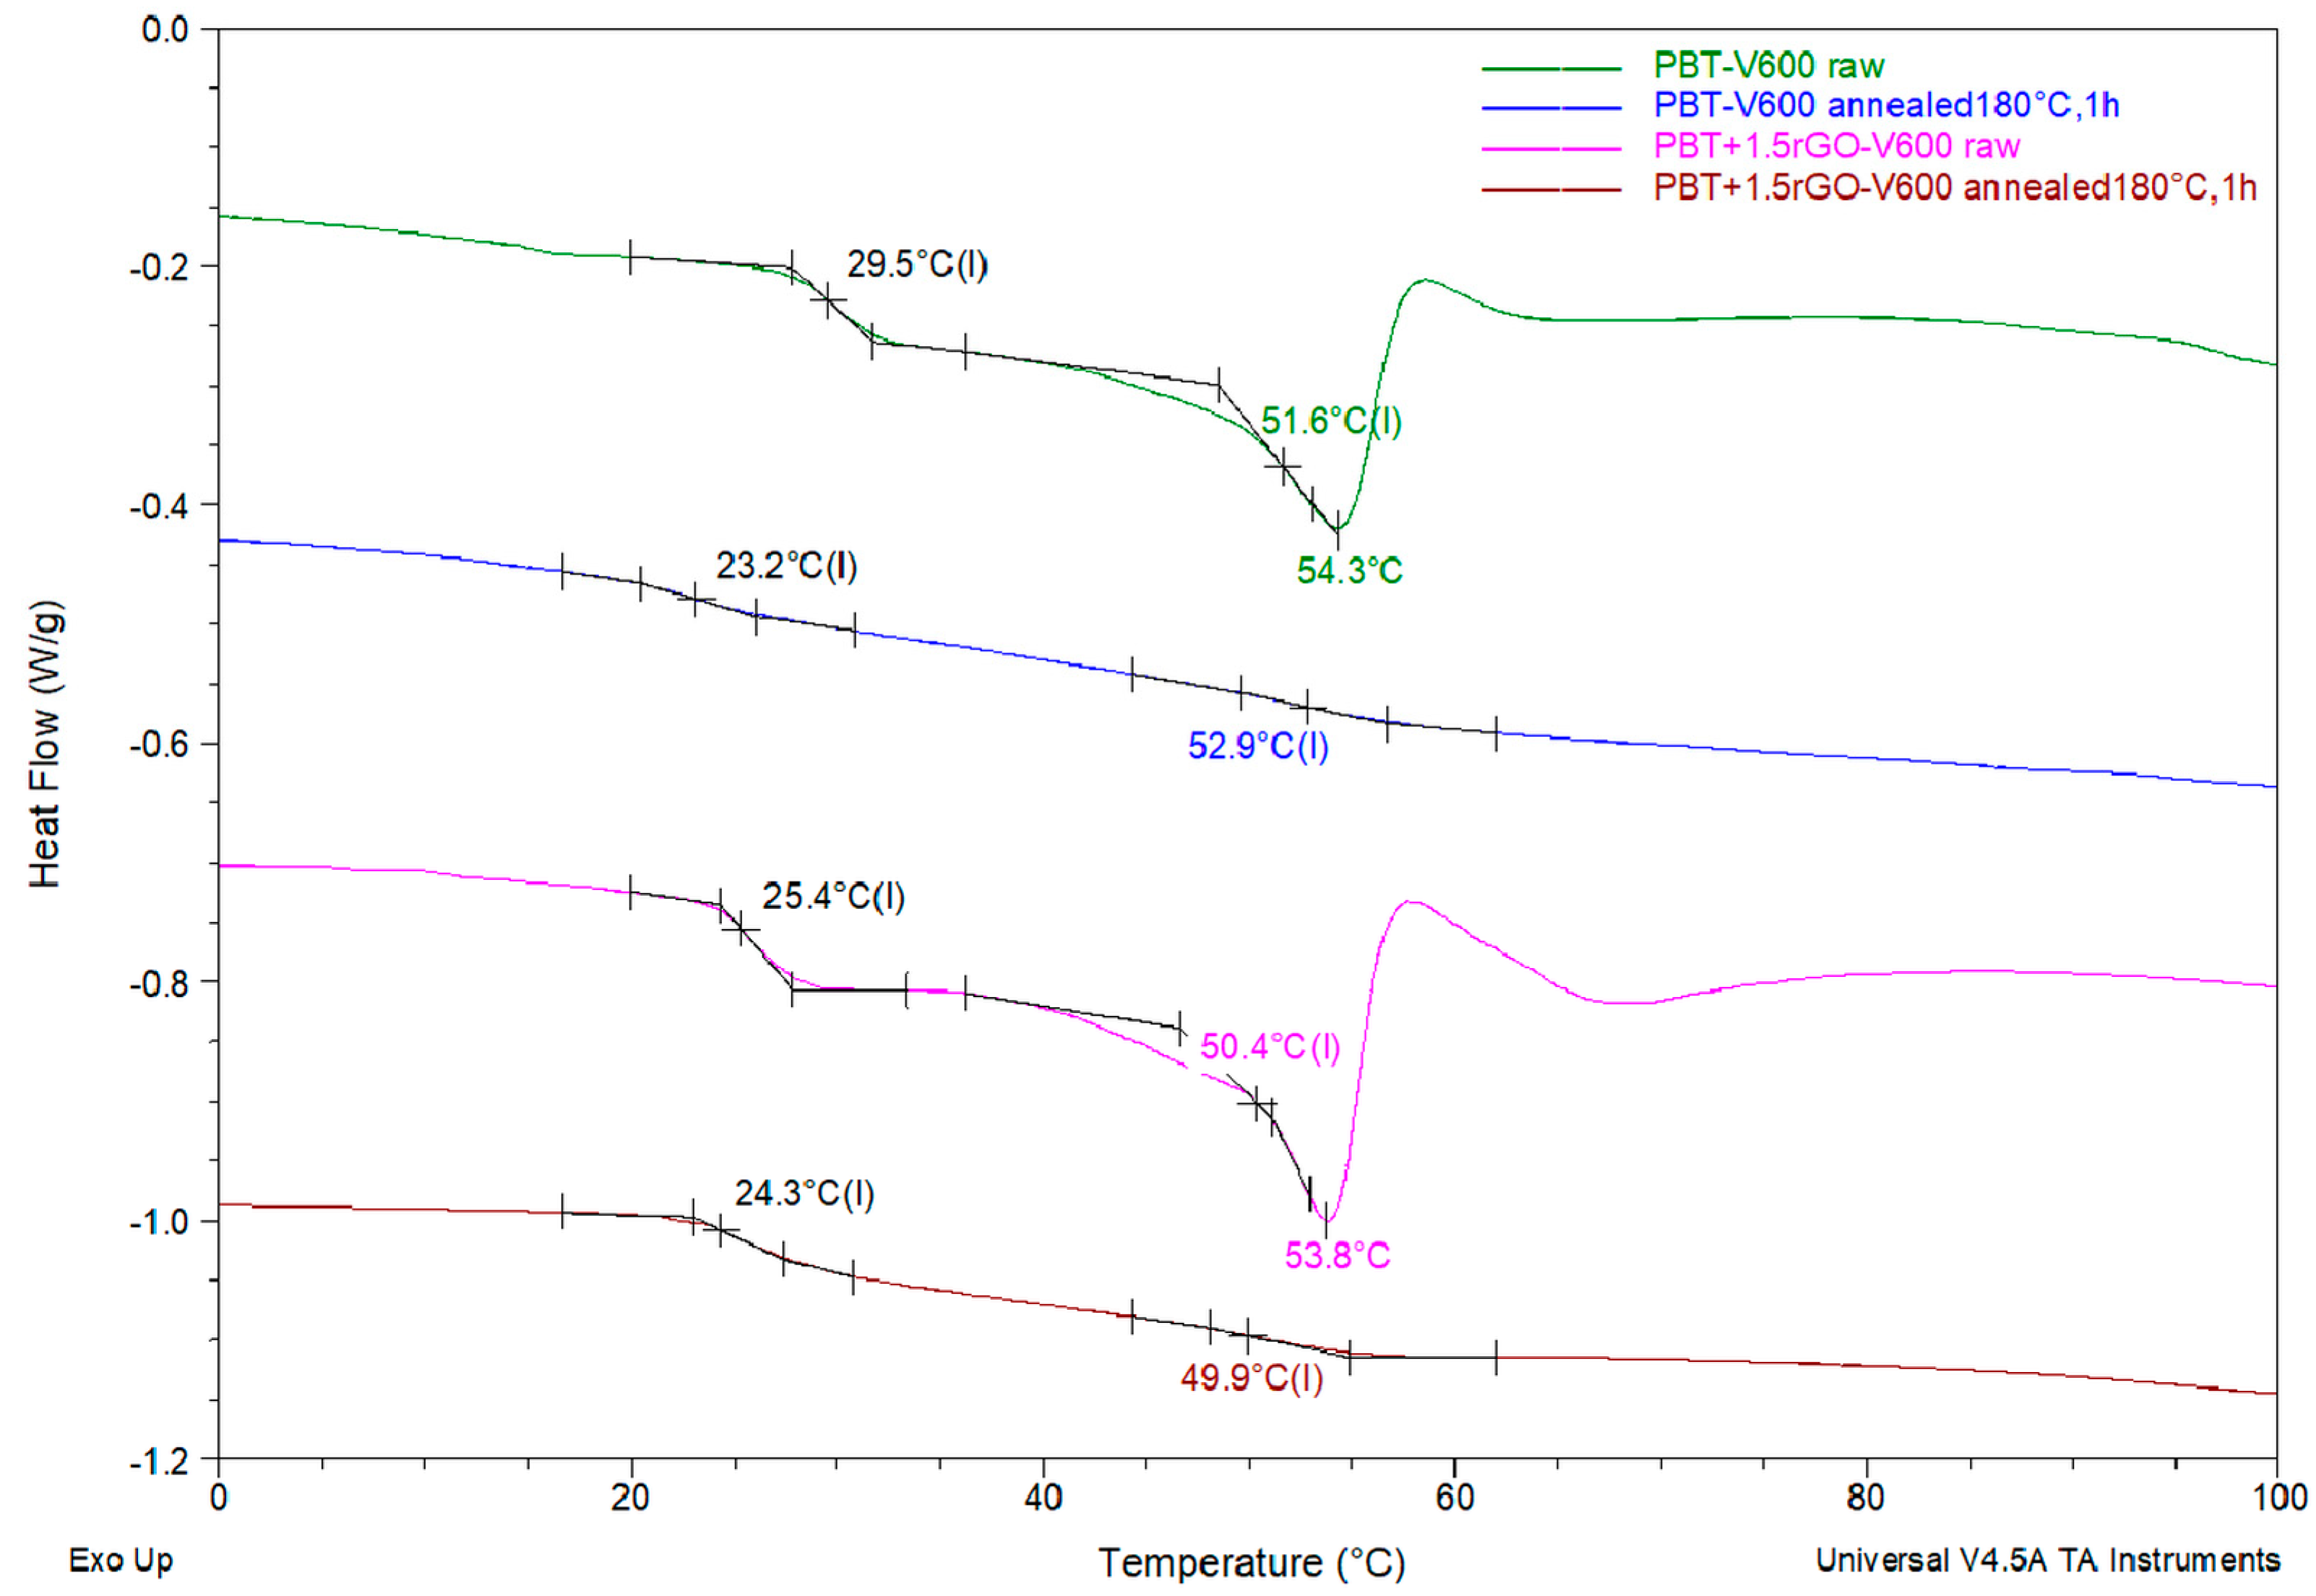
3.5. Structural Evolution during Annealing
4. Conclusions
Supplementary Materials
Author Contributions
Funding
Conflicts of Interest
References
- Cheremisinoff, N.P. Condensed Encyclopedia of Polymer Engineering Terms, 1st ed.; Butterworth–Heinemann: Oxford, UK, 2001; pp. 2002–2055. [Google Scholar]
- Zhang, W.; Li, J.; Shang, Y.; Li, H.; Jiang, S.; An, L. Temperature dependence of tensile behavior in poly(butylene terephthalate) with different crystallinity. Mater. Des. 2017, 129, 143–150. [Google Scholar] [CrossRef]
- Zheng, C.; Zhao, G.; Shen, Y.; Zhu, B.; He, Y. Effect of a polyetheramine additive on the melt-flowability of poly(butylene terephthalate). Polym. Test. 2017, 61, 191–196. [Google Scholar] [CrossRef]
- Gong, X.; Chen, X.; Zhou, Y. 4-Advanced weaving technologies for high-performance fabrics. In High-Performance Apparel Materials, Development, and Applications, 1st ed.; Woodhead Publishing Series in Textiles; Woodhead Publishing: Duxford, UK, 2018; pp. 75–112. [Google Scholar]
- Gamze Karsli, N.; Ozkan, C.; Aytac, A.; Deniz, V. Characterization of poly(butylene terephthalate) composites prepared by using various types of sized carbon fibers. Mater. Des. 2015, 87, 318–323. [Google Scholar] [CrossRef]
- Righetti, M.C.; Di Lorenzo, M.L.; Angiuli, M.; Tombari, E.; La Pietra, P. Poly(butylene terephthalate)/poly(ε-caprolactone) blends: Influence of PCL molecular mass on PBT melting and crystallization behavior. Eur. Polym. J. 2007, 43, 4726–4738. [Google Scholar] [CrossRef]
- Vásquez-Rendón, M.; Álvarez-Láinez, M.L. Tailoring the mechanical, thermal, and flammability properties of high-performance PEI/PBT blends exhibiting dual-phase continuity. Polymer 2018, 154, 241–252. [Google Scholar] [CrossRef]
- Xu, S.; Wu, F.; Li, Z.; Zhu, X.; Li, X.; Wang, L.; Li, Y.; Tu, Y. A green cascade polymerization method for the facile synthesis of sustainable poly(butylene-co-decylene terephthalate) copolymers. Polymer 2019, 178, 121591. [Google Scholar] [CrossRef]
- Chen, J.; Huang, W.; Xu, Q.; Tu, Y.; Zhu, X.; Chen, E. PBT-b-PEO-b-PBT triblock copolymers: Synthesis, characterization and double-crystalline properties. Polymer 2013, 54, 6725–6731. [Google Scholar] [CrossRef]
- Finelli, L.; Lotti, N.; Munari, A. Crystallization kinetics and melting behavior of poly(butylene isophthalate/terephthalate) random copolyesters. Eur. Polym. J. 2001, 37, 2039–2046. [Google Scholar] [CrossRef]
- Deshmukh, G.S.; Peshwe, D.R.; Pathak, S.U.; Ekhe, J.D. Nonisothermal crystallization kinetics and melting behavior of poly(butylene terephthalate) (PBT) composites based on different types of functional fillers. Thermochim. Acta 2014, 581, 41–53. [Google Scholar] [CrossRef]
- Colonna, S.; Bernal, M.M.; Gavoci, G.; Gomez, J.; Novara, C.; Saracco, G.; Fina, A. Effect of processing conditions on the thermal and electrical conductivity of poly (butylene terephthalate) nanocomposites prepared via ring-opening polymerization. Mater. Des. 2017, 119, 124–132. [Google Scholar] [CrossRef] [Green Version]
- Bian, J.; Lin, H.L.; He, F.X.; Wang, L.; Wei, X.W.; Chang, I.T.; Sancaktar, E. Processing and assessment of high-performance poly(butylene terephthalate) nanocomposites reinforced with microwave exfoliated graphite oxide nanosheets. Eur. Polym. J. 2013, 49, 1406–1423. [Google Scholar] [CrossRef]
- Deshmukh, G.S.; Pathak, S.U.; Peshwe, D.R.; Ekhe, J.D. Effect of uncoated calcium carbonate and stearic acid coated calcium carbonate on mechanical, thermal and structural properties of poly(butylene terephthalate) (PBT)/calcium carbonate composites. Bull. Mater. Sci. 2010, 33, 277–284. [Google Scholar] [CrossRef] [Green Version]
- Narkis, M.; Lidor, G.; Vaxman, A.; Zuri, L. New injection moldable electrostatic dissipative (ESD) composites based on very low carbon black loadings. J. Electrostat. 1999, 47, 201–214. [Google Scholar] [CrossRef]
- Mohd Ishak, Z.A.; Ariffin, A.; Senawi, R. Effects of hygrothermal aging and a silane coupling agent on the tensile properties of injection molded short glass fiber reinforced poly(butylene terephthalate) composites. Eur. Polym. J. 2001, 37, 1635–1647. [Google Scholar] [CrossRef]
- Hwang, S.S. Tensile, electrical conductivity and EMI shielding properties of solid and foamed PBT/carbon fiber composites. Compos. Part B Eng. 2016, 98, 1–8. [Google Scholar] [CrossRef]
- Kalkar, A.K.; Deshpande, V.D.; Purkar, B.R. Evaluation of thermal transitions in Poly(butylene terephthalate)/15A MMT nanocomposites: Nonisothermal experiments and modelling using isoconversional methods. Thermochim. Acta 2018, 660, 23–36. [Google Scholar] [CrossRef]
- Chopra, S.; Deshmukh, K.A.; Peshwe, D. Theoretical prediction of interfacial properties of PBT/CNT nanocomposites and its experimental evaluation. Mech. Mater. 2017, 109, 11–17. [Google Scholar] [CrossRef]
- Prado, L.A.S.; Kwiatkowska, M.; Funari, S.S.; Roslaniec, Z.; Broza, G.; Schulte, K. Studies on Morphology and Interphase of Poly(butylene terephthalate)/Carbon Nanotubes Nanocomposites. Polym. Eng. Sci. 2010, 50, 1571–1576. [Google Scholar] [CrossRef]
- Kim, J.Y.; Kang, S.W.; Kim, S.H. Thermotropic liquid crystal polymer reinforced poly(butylene terephthalate) composites to improve heat distortion temperature and mechanical properties. Fibers Polym. 2006, 7, 358–366. [Google Scholar] [CrossRef]
- Mittal, G.; Dhand, V.; Rhee, K.Y.; Park, S.J.; Lee, W.R. A review on carbon nanotubes and graphene as fillers in reinforced polymer nanocomposites. J. Ind. Eng. Chem. 2015, 21, 11–25. [Google Scholar] [CrossRef]
- Chen, W.; Weimin, H.; Li, D.; Chen, S.; Dai, Z. A critical review on the development and performance of polymer/graphene nanocomposites. Sci. Eng. Compos. Mater. 2018, 25, 1059–1073. [Google Scholar] [CrossRef]
- Sreenivasulu, B.; Ramji, B.R.; Nagaral, M. A Review on Graphene Reinforced Polymer Matrix Composites. Mater. Today Proc. 2018, 5, 2419–2428. [Google Scholar] [CrossRef]
- Galpaya, D.; Wang, M.; Liu, M.; Motta, N.; Waclawik, E.; Yan, C. Recent Advances in Fabrication and Characterization of Graphene-Polymer Nanocomposites. Graphene 2012, 1, 30–49. [Google Scholar] [CrossRef] [Green Version]
- Colonna, S.; Pérez-Camargo, R.A.; Chen, H.; Liu, G.; Wang, D.; Müller, A.J.; Saracco, G.; Fina, A. Supernucleation and Orientation of Poly(butylene terephthalate) Crystals in Nanocomposites Containing Highly Reduced Graphene Oxide. Macromolecules 2017, 50, 9380–9393. [Google Scholar] [CrossRef]
- Qian, P.; Zhang, Y.; Mao, H.; Wang, H.; Shi, H. Nucleation and mechanical enhancements in poly(butylene terephthalate) nanocomposites influenced by functionalized graphene oxide. SN Appl. Sci. 2019, 1, 443. [Google Scholar] [CrossRef] [Green Version]
- Gnanasekaran, K.; Heijmans, T.; Van Bennekom, S.; Woldhuis, H.; Wijnia, S.; De With, G.; Friedrich, H. 3D printing of CNT- and graphene-based conductive polymer nanocomposites by fused deposition modeling. Appl. Mater. Today 2017, 9, 21–28. [Google Scholar] [CrossRef]
- Cheng, Y.; Zhou, S.; Hu, P.; Zhao, G.; Li, Y.; Zhang, X.; Han, W. Enhanced mechanical, thermal, and electric properties of graphene aerogels via supercritical ethanol drying and high-Temperature thermal reduction. Sci. Rep. 2017, 7, 1–11. [Google Scholar] [CrossRef] [Green Version]
- Balandin, A.A.; Ghosh, S.; Bao, W.; Calizo, I.; Teweldebrhan, D.; Miao, F.; Lau, C.N. Superior Thermal Conductivity of Graphene. Nano Lett. 2008, 8, 902–907. [Google Scholar] [CrossRef]
- Lee, C.; Wei, X.; Kysar, J.W.; Hone, J. Measurement of the elastic properties and intrinsic strength of monolayer graphene. Science 2008, 321, 385–388. [Google Scholar] [CrossRef]
- Sheng, K.; Bai, H.; Sun, Y.; Li, C.; Shi, G. Layer-by-layer assembly of graphene/polyaniline multilayer films and their application for electrochromic devices. Polymer 2011, 52, 5567–5572. [Google Scholar] [CrossRef]
- Papageorgiou, D.G.; Kinloch, I.A.; Young, R.J. Mechanical properties of graphene and graphene-based nanocomposites. Prog. Mater. Sci. 2017, 90, 75–127. [Google Scholar] [CrossRef]
- Zhong, Y.; Zhen, Z.; Zhu, H. Graphene: Fundamental research and potential applications. FlatChem 2017, 4, 20–32. [Google Scholar] [CrossRef]
- Das, T.; Prusty, S. Graphene-Based Polymer Composites and Their Applications. Polym. Plast. Technol. Eng. 2013, 52, 319–331. [Google Scholar] [CrossRef]
- Paszkiewicz, S.; Szymczyk, A.; Pawlikowska, D.; Irska, I.; Piesowicz, E.; Jotko, M.; Lisiecki, S.; Bartkowiak, A.; Sieradzka, M.; Fryczkowski, R.; et al. Improvement of barrier properties of glycol modified poly(ethylene terephthalate) based nanocomposites containing graphene derivatives forms. Polimery 2017, 62, 868–874. [Google Scholar] [CrossRef]
- Wang, X.; Kalali, E.; Wan, J.; Wang, D. Carbon-family materials for flame retardant polymeric materials. Prog. Polym. Sci. 2017, 69, 22–46. [Google Scholar] [CrossRef]
- Phiri, J.; Gane, P.; Maloney, T.C. General overview of graphene: Production, properties and application in polymer composites. Mater. Sci. Eng. B Solid State Mater. Adv. Technol. 2017, 215, 9–28. [Google Scholar] [CrossRef] [Green Version]
- Šupová, M.; Martynková, G.S.; Barabaszová, K. Effect of nanofillers dispersion in polymer matrices: A review. Sci. Adv. Mater. 2011, 3, 1–25. [Google Scholar] [CrossRef]
- Verdejo, R.; Bernal, M.M.; Romasanta, L.J.; Lopez-Manchado, M.A. Graphene filled polymer nanocomposites. J. Mater. Chem. 2011, 21, 3301–3310. [Google Scholar] [CrossRef] [Green Version]
- Li, M.; Jeong, Y.G. Influences of exfoliated graphite on structures, thermal stability, mechanical modulus, and electrical resistivity of poly(butylene terephthalate). J. Appl. Polym. Sci. 2012, 125, E532–E540. [Google Scholar] [CrossRef]
- Fabbri, P.; Bassoli, E.; Bon, S.B.; Valentini, L. Preparation and characterization of poly(butylene terephthalate)/grapheme composites by in-situ polymerization of cyclic butylene terephthalate. Polymer 2012, 53, 897–902. [Google Scholar] [CrossRef]
- Wang, C.; Fang, C.Y.; Wang, C.Y. Electrospun poly(butylene terephthalate) fibers: Entanglement density effect on fiber diameter and fiber nucleating ability towards isotactic polypropylene. Polymer 2015, 72, 21–29. [Google Scholar] [CrossRef]
- Kim, K.H.; Kang, Y.A.; Yokoyama, A.; Ikaga, T.; Ohkoshi, Y.; Wataoka, I.; Urakawa, H. In situ study of fiber structure development of poly(butylene terephthalate) in a continuous laser-heated drawing process. Polym. J. 2012, 44, 1030–1035. [Google Scholar] [CrossRef] [Green Version]
- Konishi, T.; Miyamoto, Y. Smectic structure and glass transition in poly(butylene terephthalate). Polym. J. 2010, 42, 349–353. [Google Scholar] [CrossRef] [Green Version]
- Androsch, R.; Rhoades, A.M.; Stolte, I.; Schick, C. Density of heterogeneous and homogeneous crystal nuclei in poly(butylene terephthalate). Eur. Polym. J. 2015, 66, 180–189. [Google Scholar] [CrossRef]
- Furushima, Y.; Kumazawa, S.; Umetsu, H.; Toda, A.; Zhuravlev, E.; Schick, C. Melting and recrystallization kinetics of poly(butylene terephthalate). Polymer 2017, 109, 307–314. [Google Scholar] [CrossRef]
- Jariyavidyanont, K.; Androsch, R.; Schick, C. Crystal reorganization of poly(butylene terephthalate). Polymer 2017, 124, 274–283. [Google Scholar] [CrossRef]
- Konishi, T.; Sakatsuji, W.; Fukao, K.; Miyamoto, Y. Temperature Dependence of Lamellar Thickness in Isothermally Crystallized Poly(butylene terephthalate). Macromolecules 2016, 49, 2272–2280. [Google Scholar] [CrossRef]
- Sieradzka, M.; Ślusarczyk, C.; Fryczkowski, R.; Janicki, J. Insight into the effect of graphite grain sizes on the morphology, structure and electrical properties of reduced graphene oxide. J. Mater. Res. Technol. 2020, 9, 7059–7067. [Google Scholar] [CrossRef]
- Rabiej, M. Application of the particle swarm optimization method for the analysis of wide-angle X-ray diffraction curves of semicrystalline polymers. J. Appl. Crystallogr. 2017, 50, 221–230. [Google Scholar] [CrossRef]
- Klug, H.P.; Alexander, L.E. X-ray Diffraction Procedures: For Polycrystalline and Amorphous Materials, 2nd ed.; Wiley-Interscience: New York, NY, USA, 1974. [Google Scholar]
- Strobl, G.R.; Schneider, M. Direct evaluation of the electron density correlation function of partially crystalline polymers. J. Polym. Sci. Part A Polym. Phys. 1980, 18, 1343–1359. [Google Scholar] [CrossRef]
- Ślusarczyk, C. Time-resolved SAXS investigations of morphological changes in a blend of linear and branched polyethylenes during crystallization and subsequent melting. J. Alloys Compd. 2004, 382, 68–74. [Google Scholar] [CrossRef]
- Ślusarczyk, C. Structure development during isothermal crystallisation of high-density polyethylene: Synchrotron small-angle X-ray scattering study. Radiat. Phys. Chem. 2013, 93, 104–110. [Google Scholar] [CrossRef]
- Yokouchi, M.; Sakakibara, Y.; Chatani, Y.; Tadokoro, H.; Tanaka, T.; Yoda, K. Structures of two crystalline forms of poly(butylene terephthalate) and reversible transition between them by mechanical deformation. Macromolecules 1976, 9, 266–273. [Google Scholar] [CrossRef]
- Ran, S.; Burger, C.; Fang, D.; Zong, X.; Cruz, S.; Chu, B.; Hsiao, B.S.; Bubeck, R.A.; Yabuki, K.; Teramoto, Y.; et al. In-situ synchrotron WAXD/SAXS studies of structural development during PBO/PPA solution spinning. Macromolecules 2002, 35, 433–439. [Google Scholar] [CrossRef]
- Konishi, T.; Miyamoto, Y. Crystallization of Poly(butylene terephthalate) from the glass. Macromolecules 2010, 43, 375–383. [Google Scholar] [CrossRef]
- Tomisawa, R.; Ikaga, T.; Kim, K.H.; Ohkoshi, Y.; Okada, K.; Masunaga, H.; Kanaya, T.; Masuda, M.; Maeda, Y. Effect of melt spinning conditions on the fiber structure development of polyethylene terephthalate. Polymer 2017, 116, 367–377. [Google Scholar] [CrossRef]
- Montserrat, S.; Cortes, P. Physical ageing studies in semicrystalline poly(ethylene terephthalate). J. Mater. Sci. 1995, 30, 1790–1793. [Google Scholar] [CrossRef]
- Hodge, I.M. Enthalpy relaxation and recovery in amorphous materials. J. NonCryst. Solids 1994, 169, 211–266. [Google Scholar] [CrossRef]
- Kolb, R.; Seifert, S.; Stribeck, N.; Zachmann, H.G. Simultaneous measurements of small- and wide-angle X-ray scattering during low speed spinning of poly(propylene) using synchrotron radiation. Polymer 2000, 41, 1497–1505. [Google Scholar] [CrossRef]
- Trabelsi, S.; Albouy, P.A.; Rault, J. Effective Local Deformation in Stretched Filled Rubber. Macromolecules 2003, 36, 9093–9099. [Google Scholar] [CrossRef]
- Papananou, H.; Perivolari, E.; Chrissopoulou, K.; Anastasiadis, S.H. Tuning polymer crystallinity via the appropriate selection of inorganic nanoadditives. Polymer 2018, 157, 111–121. [Google Scholar] [CrossRef]


| Sample | Tg1 (°C) | Tg2 (°C) | Tre (°C) | Tr (°C) | ΔHr (J/g) | Tm (°C) | ΔHm (J/g) | XDSC (%) |
|---|---|---|---|---|---|---|---|---|
| PBT-V0 | – | 50.7 | 54.0 | 203.3 | 3.6 | 223.1 | 48.7 | 31.1 |
| PBT-V50 | – | 50.2 | 53.6 | 200.5 | 2.2 | 222.8 | 52.7 | 34.8 |
| PBT-V100 | – | 50.2 | 53.6 | – | – | 223.1 | 54.6 | 37.7 |
| PBT-V200 | – | 52.6 | 54.4 | – | – | 223.1 | 60.3 | 40.6 |
| PBT-V400 | 31.2 | 51.4 | 53.5 | 152.2 | 5.2 | 222.6 | 61.1 | 38.6 |
| PBT-V600 | 29.5 | 51.7 | 54.3 | 156.7 | 5.7 | 222.6 | 64.0 | 40.2 |
| PBT-V800 | 25.5 | 53.5 | 56.7 | 173.6 | 4.8 | 222.6 | 61.8 | 39.3 |
| Sample | Tg1 (°C) | Tg2 (°C) | Tre (°C) | Tr (°C) | ΔHr (J/g) | Tm (°C) | ΔHm (J/g) | XDSC (%) |
|---|---|---|---|---|---|---|---|---|
| PBT+1.5rGO-V0 | – | 50.0 | 53.1 | 202.5 | 4.5 | 223.4 | 52.4 | 33.5 |
| PBT+1.5rGO-V50 | – | 49.5 | 52.9 | 200.6 | 1.0 | 223.3 | 51.2 | 35.1 |
| PBT+1.5rGO-V100 | 25.6 | 50.6 | 53.7 | – | – | 223.0 | 56.5 | 39.6 |
| PBT+1.5rGO-V200 | 22.8 | 51.5 | 54.1 | 170.9 | 1.4 | 222.8 | 56.9 | 38.9 |
| PBT+1.5rGO-V400 | 25.4 | 51.5 | 53.3 | 166.6 | 2.4 | 222.1 | 59.5 | 40.0 |
| PBT+1.5rGO-V600 | 25.1 | 50.7 | 53.8 | 171.0 | 2.1 | 222.5 | 63.1 | 42.7 |
| PBT+1.5rGO-V800 | 22.2 | 51.1 | 54.2 | 173.2 | 3.4 | 222.6 | 60.6 | 40.0 |
© 2020 by the authors. Licensee MDPI, Basel, Switzerland. This article is an open access article distributed under the terms and conditions of the Creative Commons Attribution (CC BY) license (http://creativecommons.org/licenses/by/4.0/).
Share and Cite
Ślusarczyk, C.; Sieradzka, M.; Fabia, J.; Fryczkowski, R. Supermolecular Structure of Poly(Butylene Terephthalate) Fibers Formed with the Addition of Reduced Graphene Oxide. Polymers 2020, 12, 1456. https://doi.org/10.3390/polym12071456
Ślusarczyk C, Sieradzka M, Fabia J, Fryczkowski R. Supermolecular Structure of Poly(Butylene Terephthalate) Fibers Formed with the Addition of Reduced Graphene Oxide. Polymers. 2020; 12(7):1456. https://doi.org/10.3390/polym12071456
Chicago/Turabian StyleŚlusarczyk, Czesław, Marta Sieradzka, Janusz Fabia, and Ryszard Fryczkowski. 2020. "Supermolecular Structure of Poly(Butylene Terephthalate) Fibers Formed with the Addition of Reduced Graphene Oxide" Polymers 12, no. 7: 1456. https://doi.org/10.3390/polym12071456