Prediction of Moisture and Aging Conditions of Oil-Immersed Cellulose Insulation Based on Fingerprints Database of Dielectric Modulus


Abstract
1. Introduction
2. The Definition of the Frequency Dielectric Modulus
3. The Frequency Dielectric Response Test and Analysis
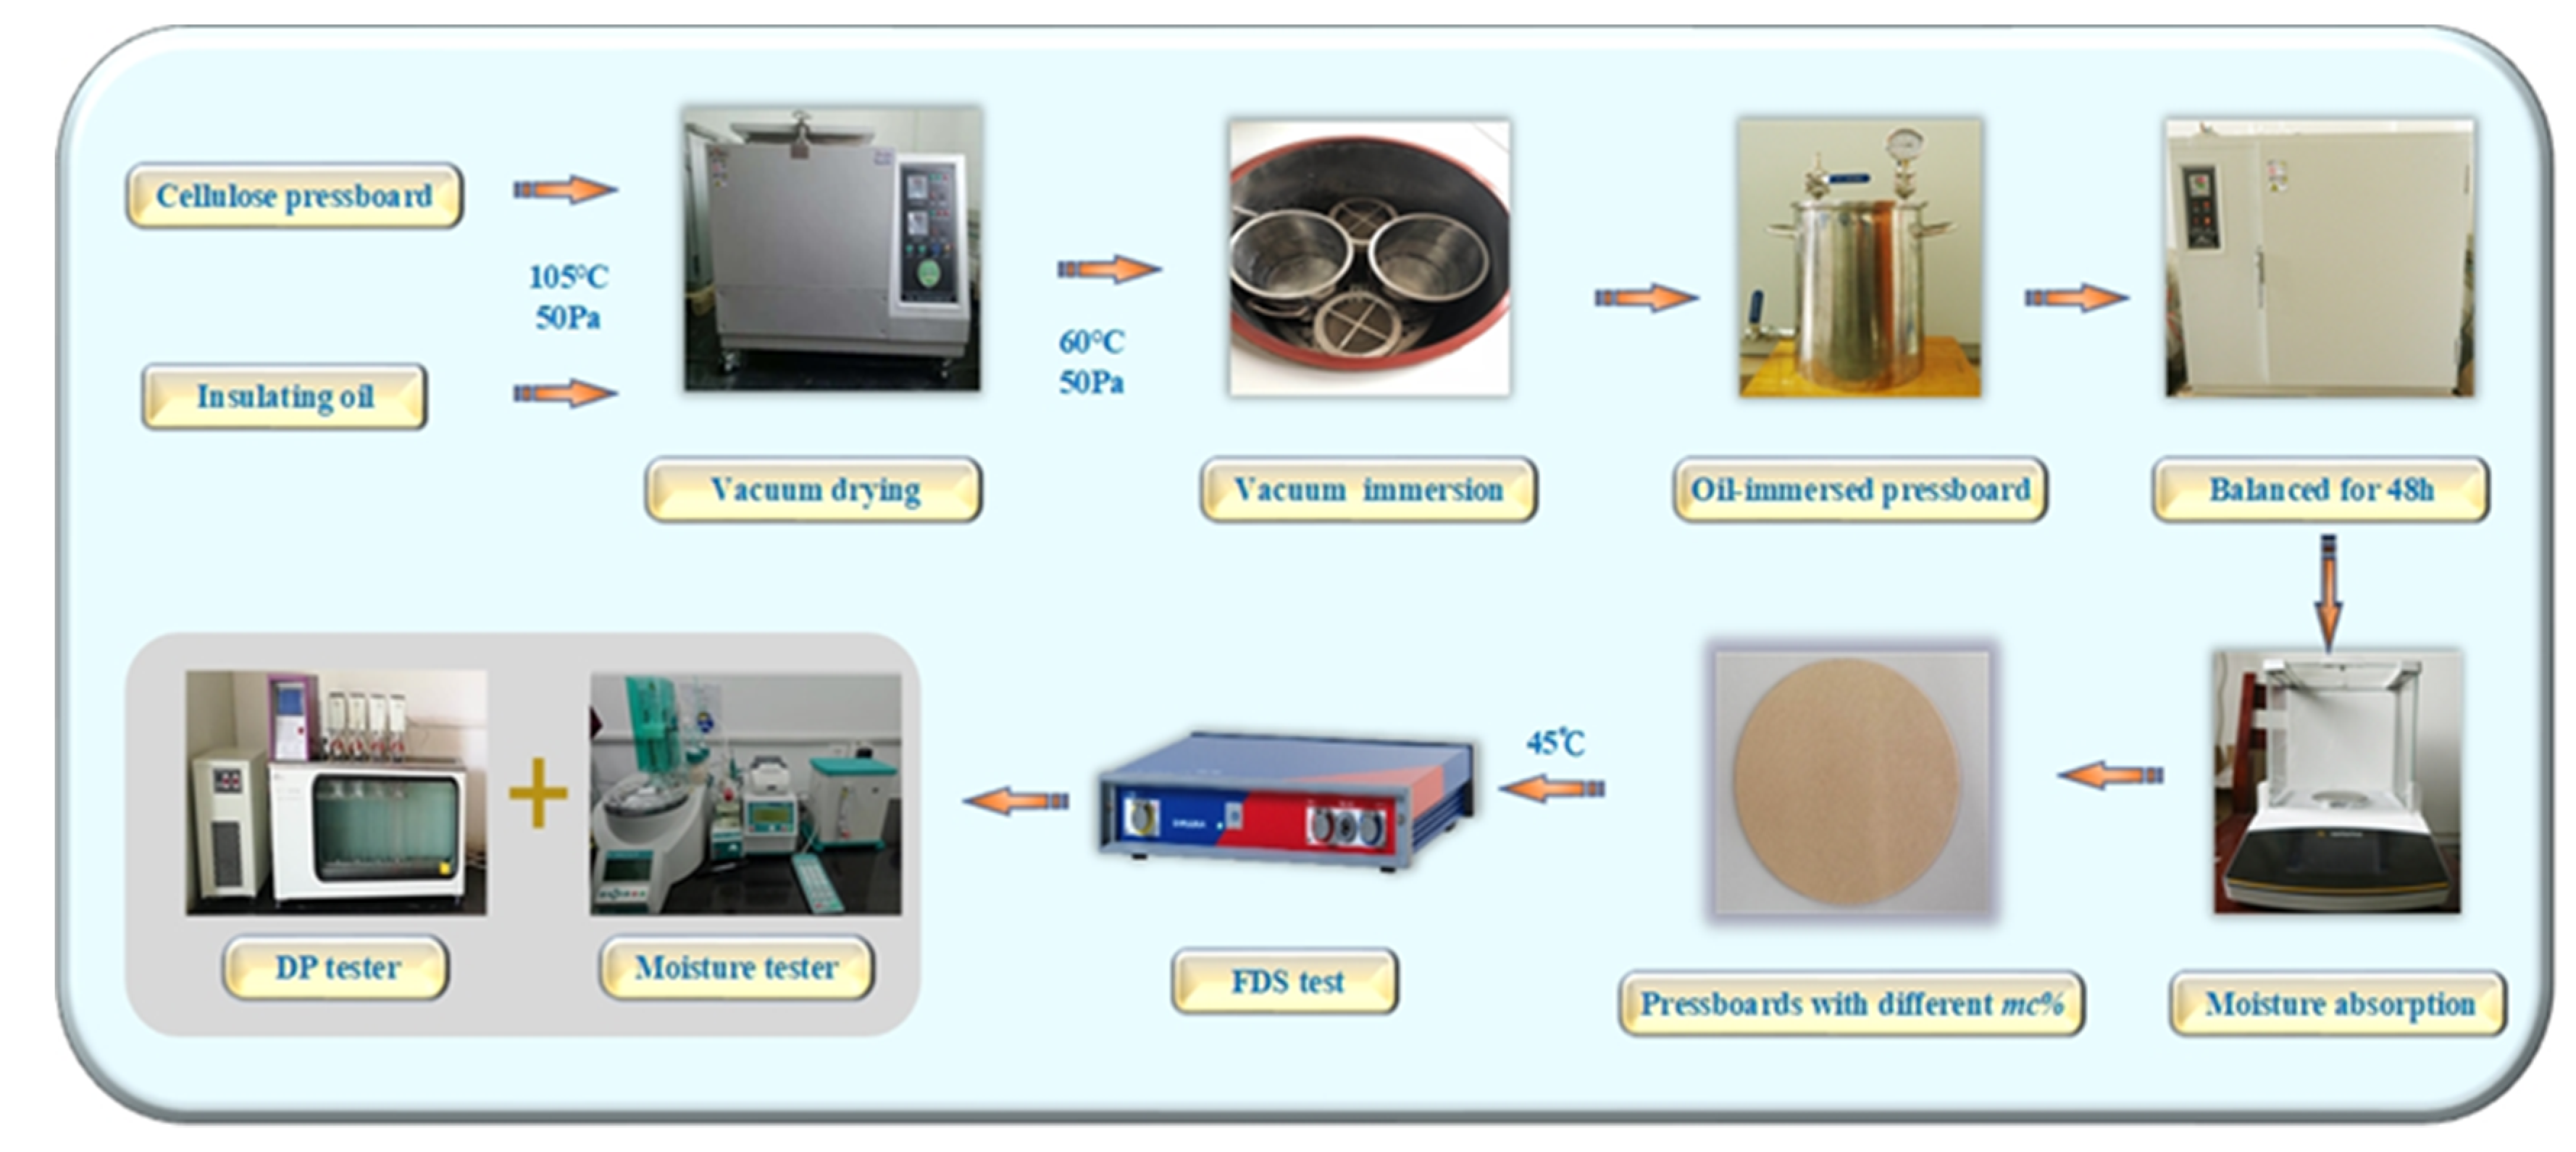
3.1. The Frequency Dielectric Response Test
3.2. The Complex Permittivity Curves Analysis
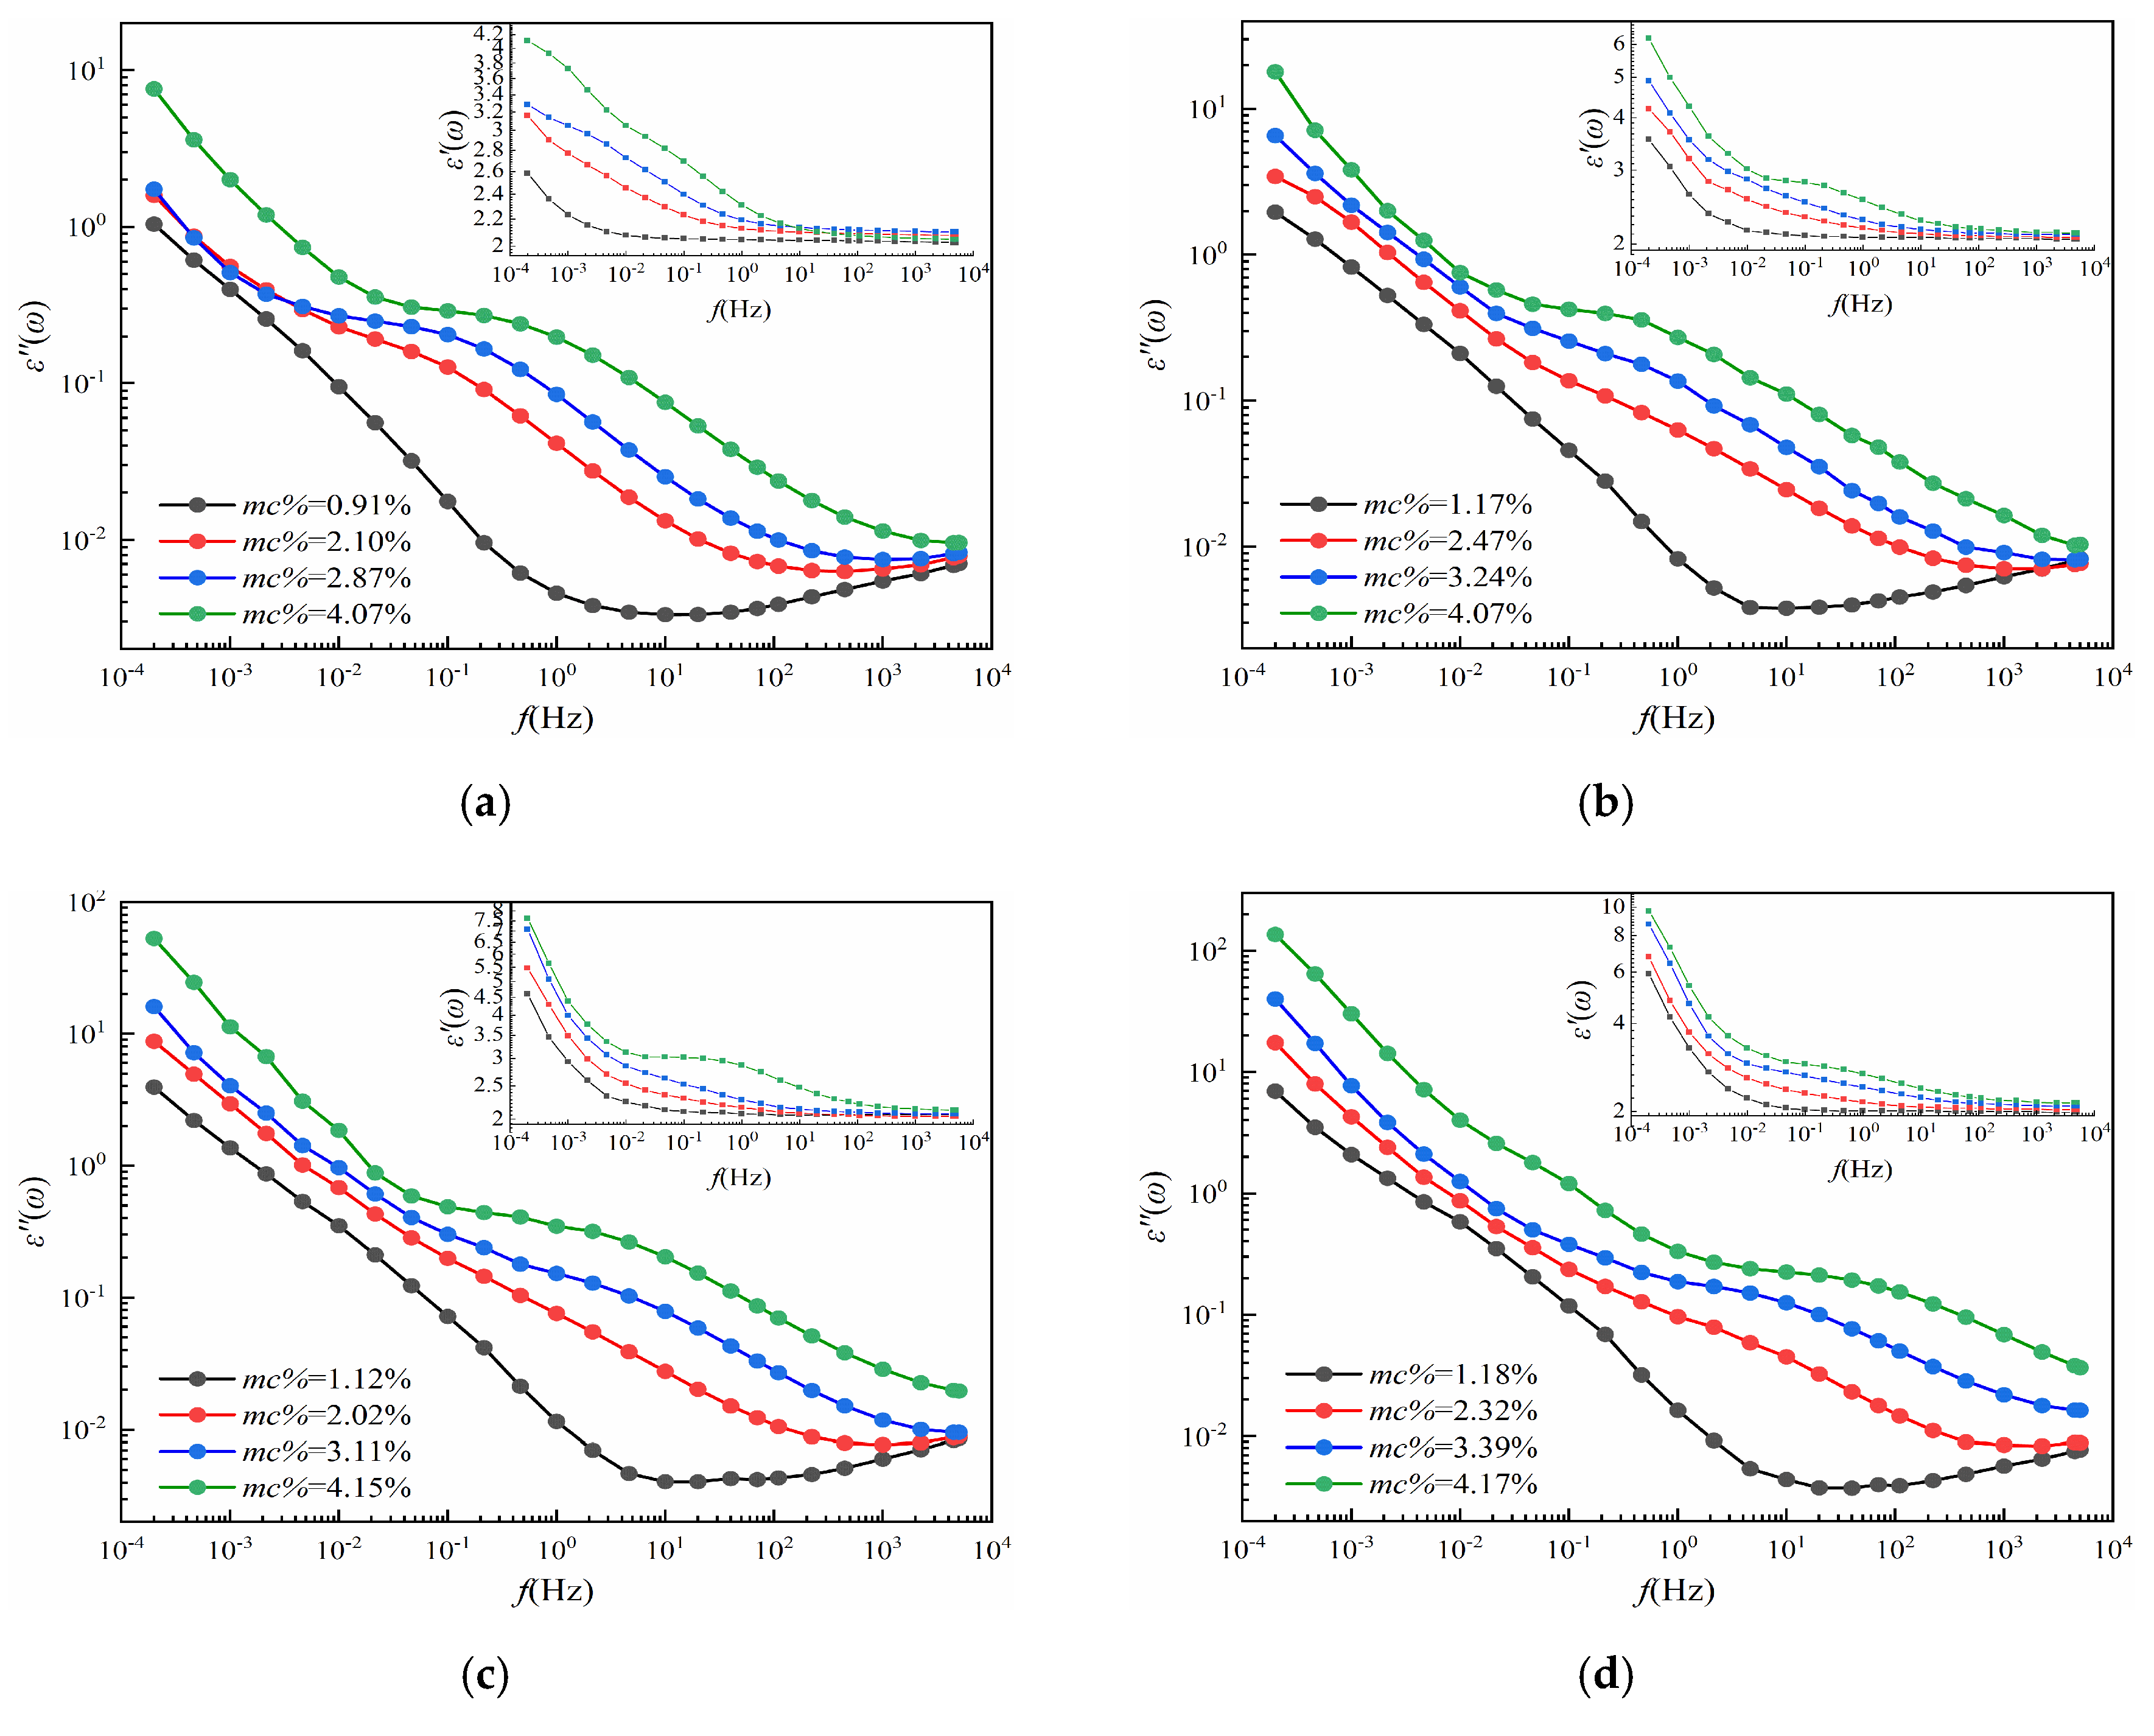
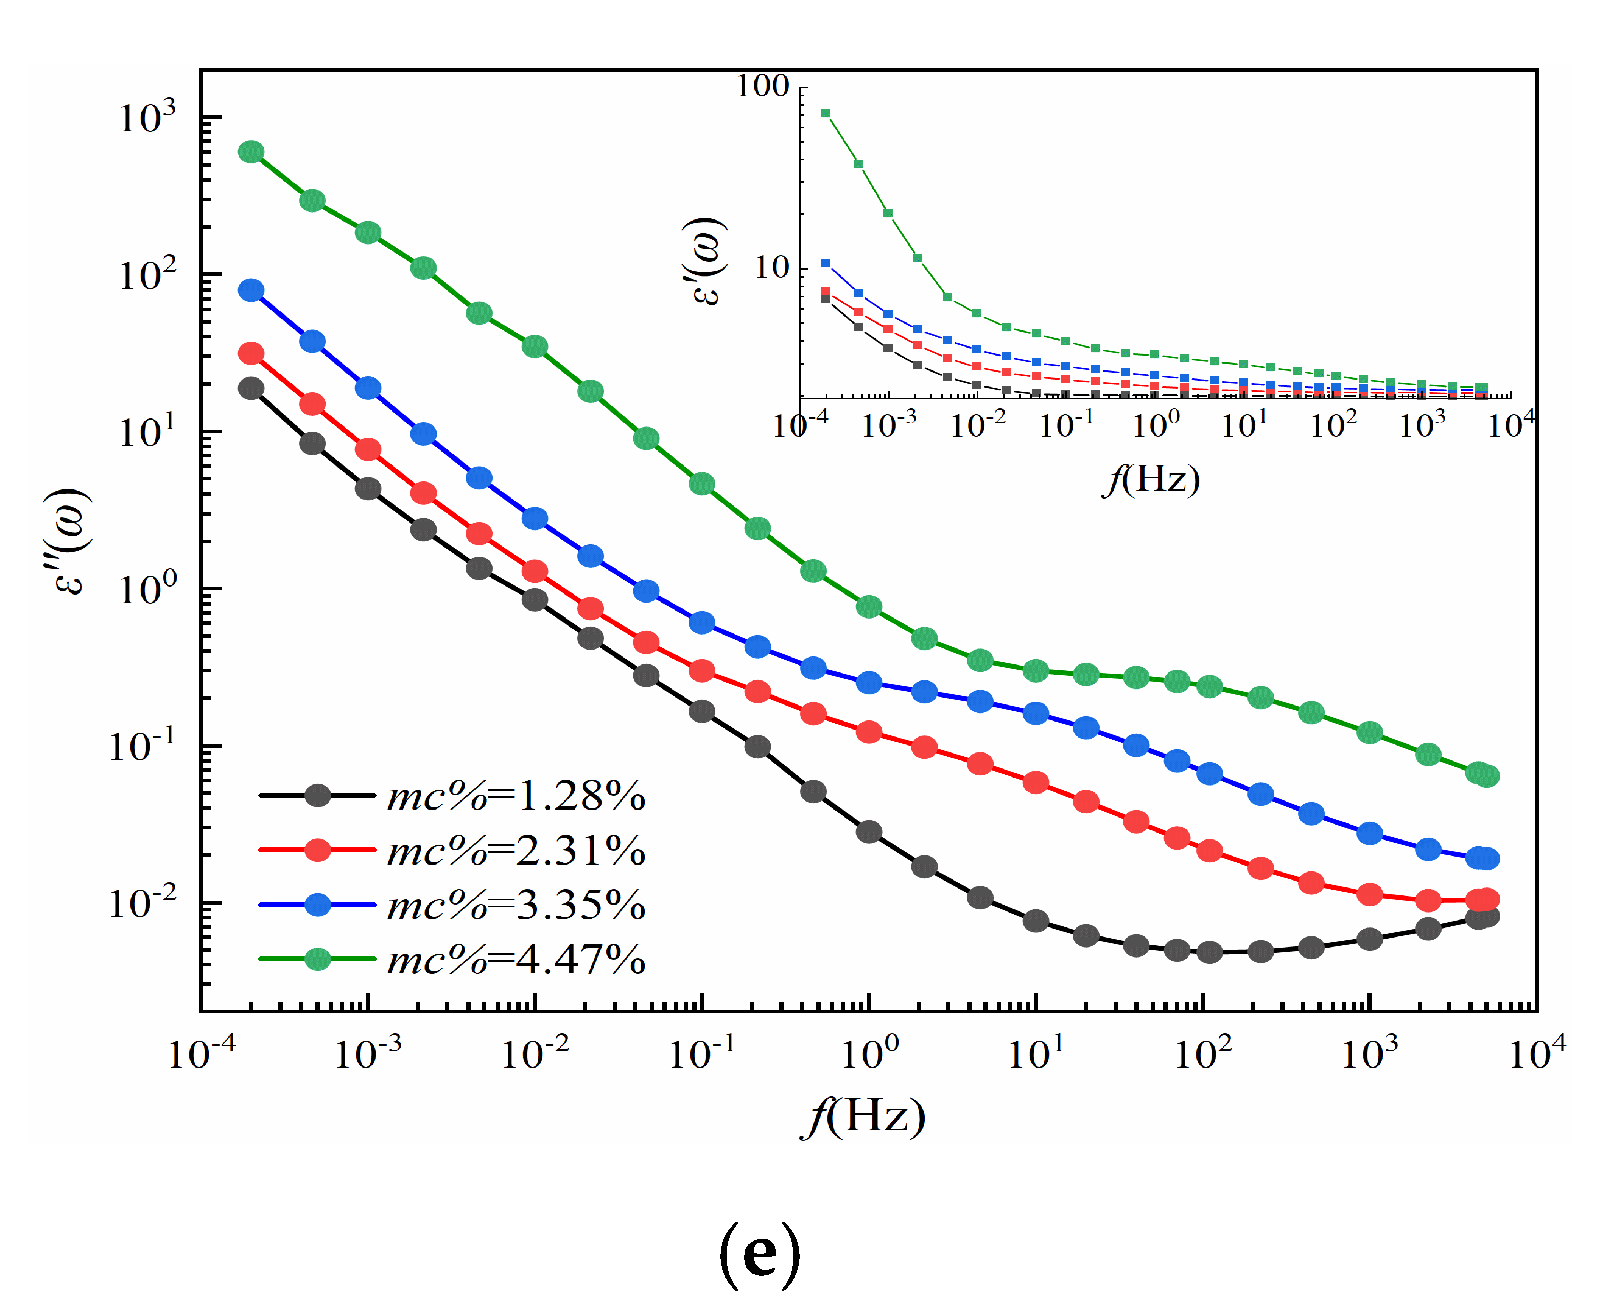
3.2.1. Moisture Effects
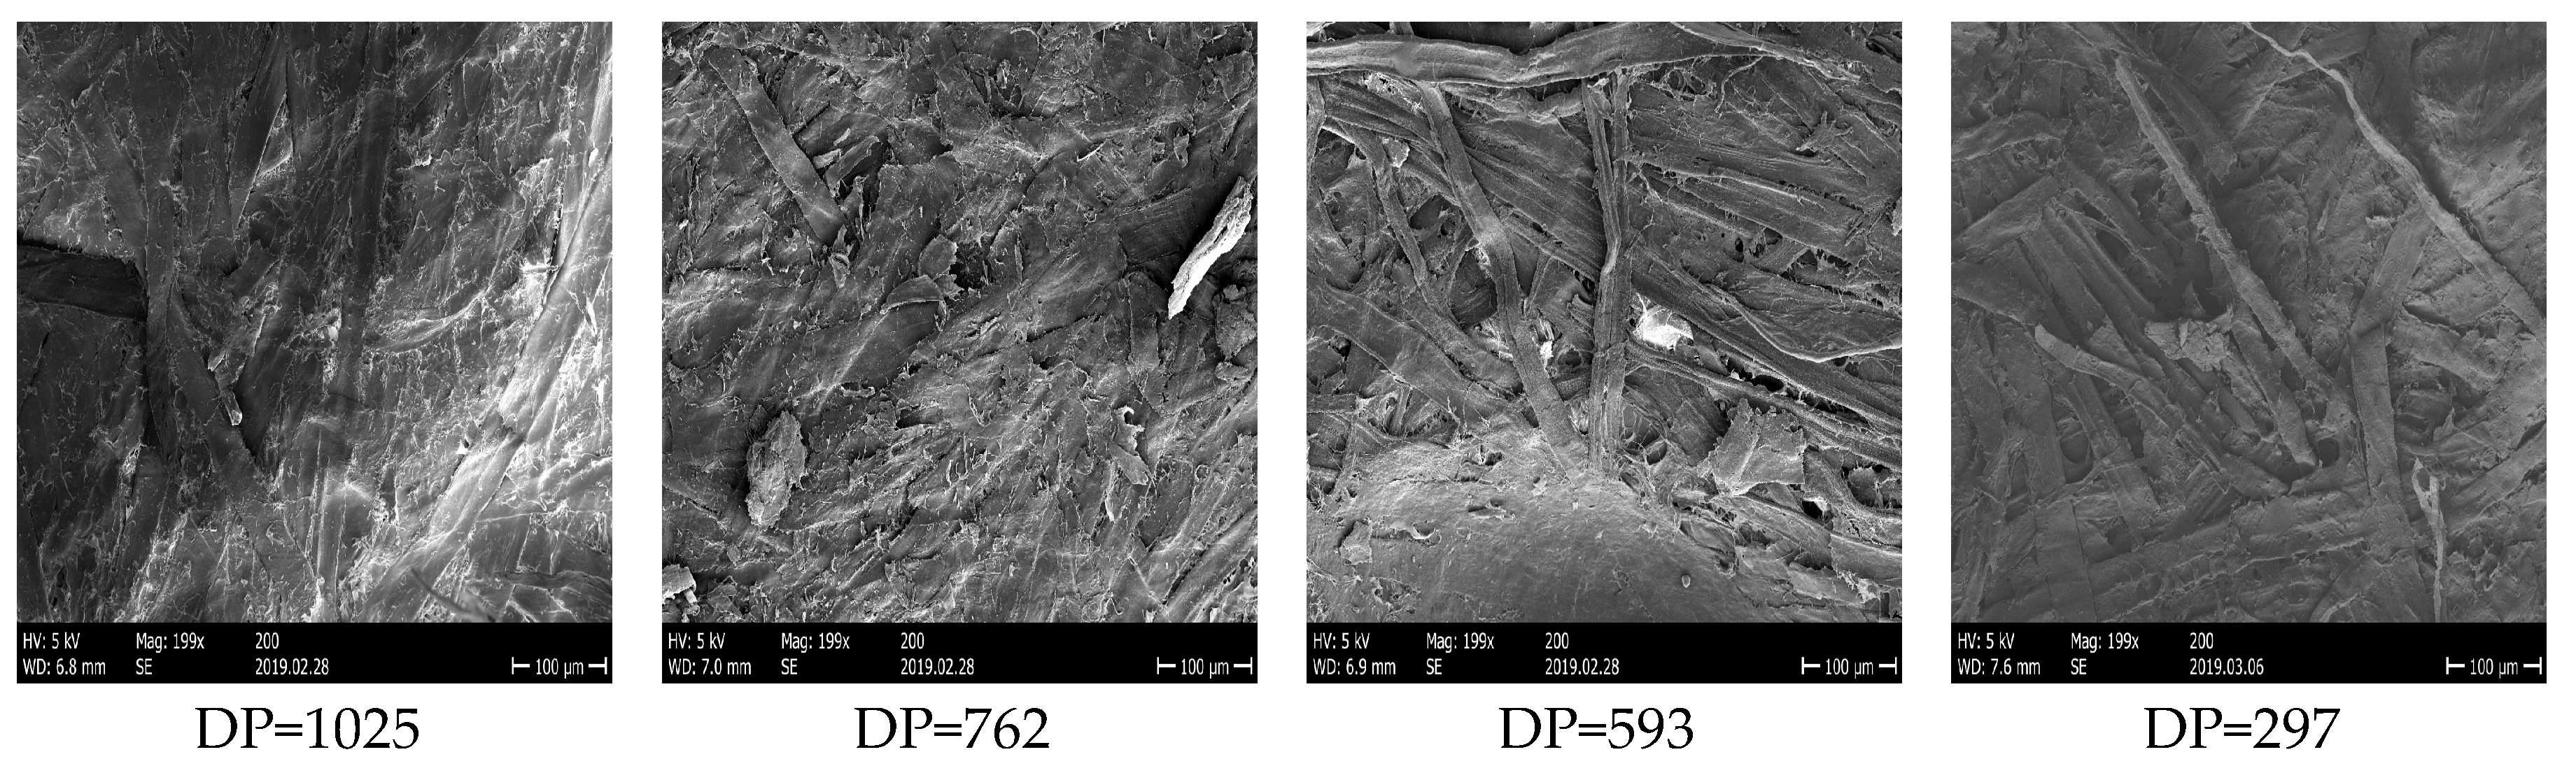
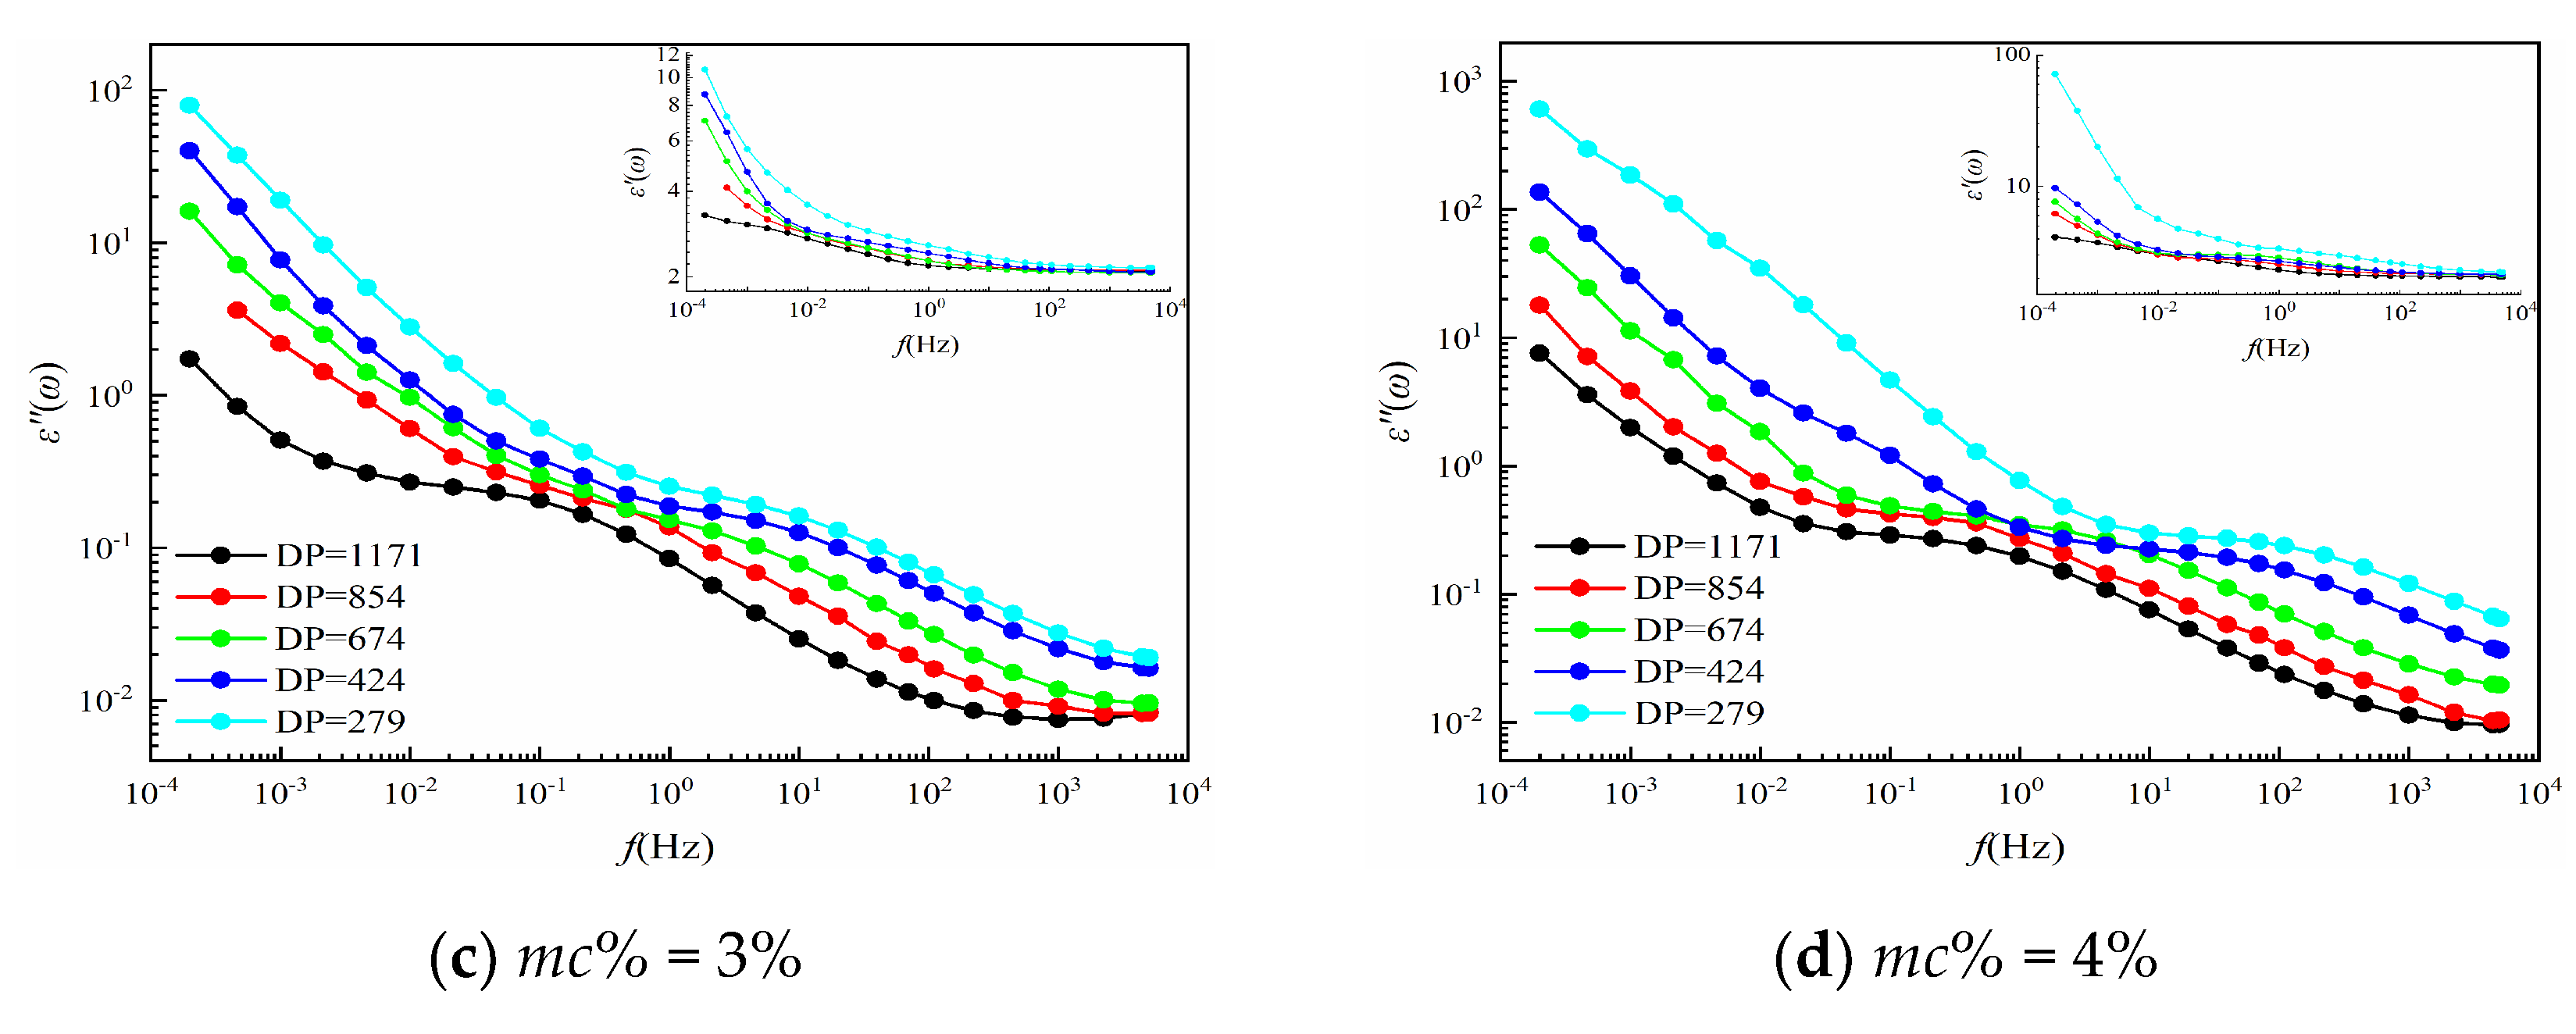
3.2.2. Aging Effects
3.2.3. Summaries
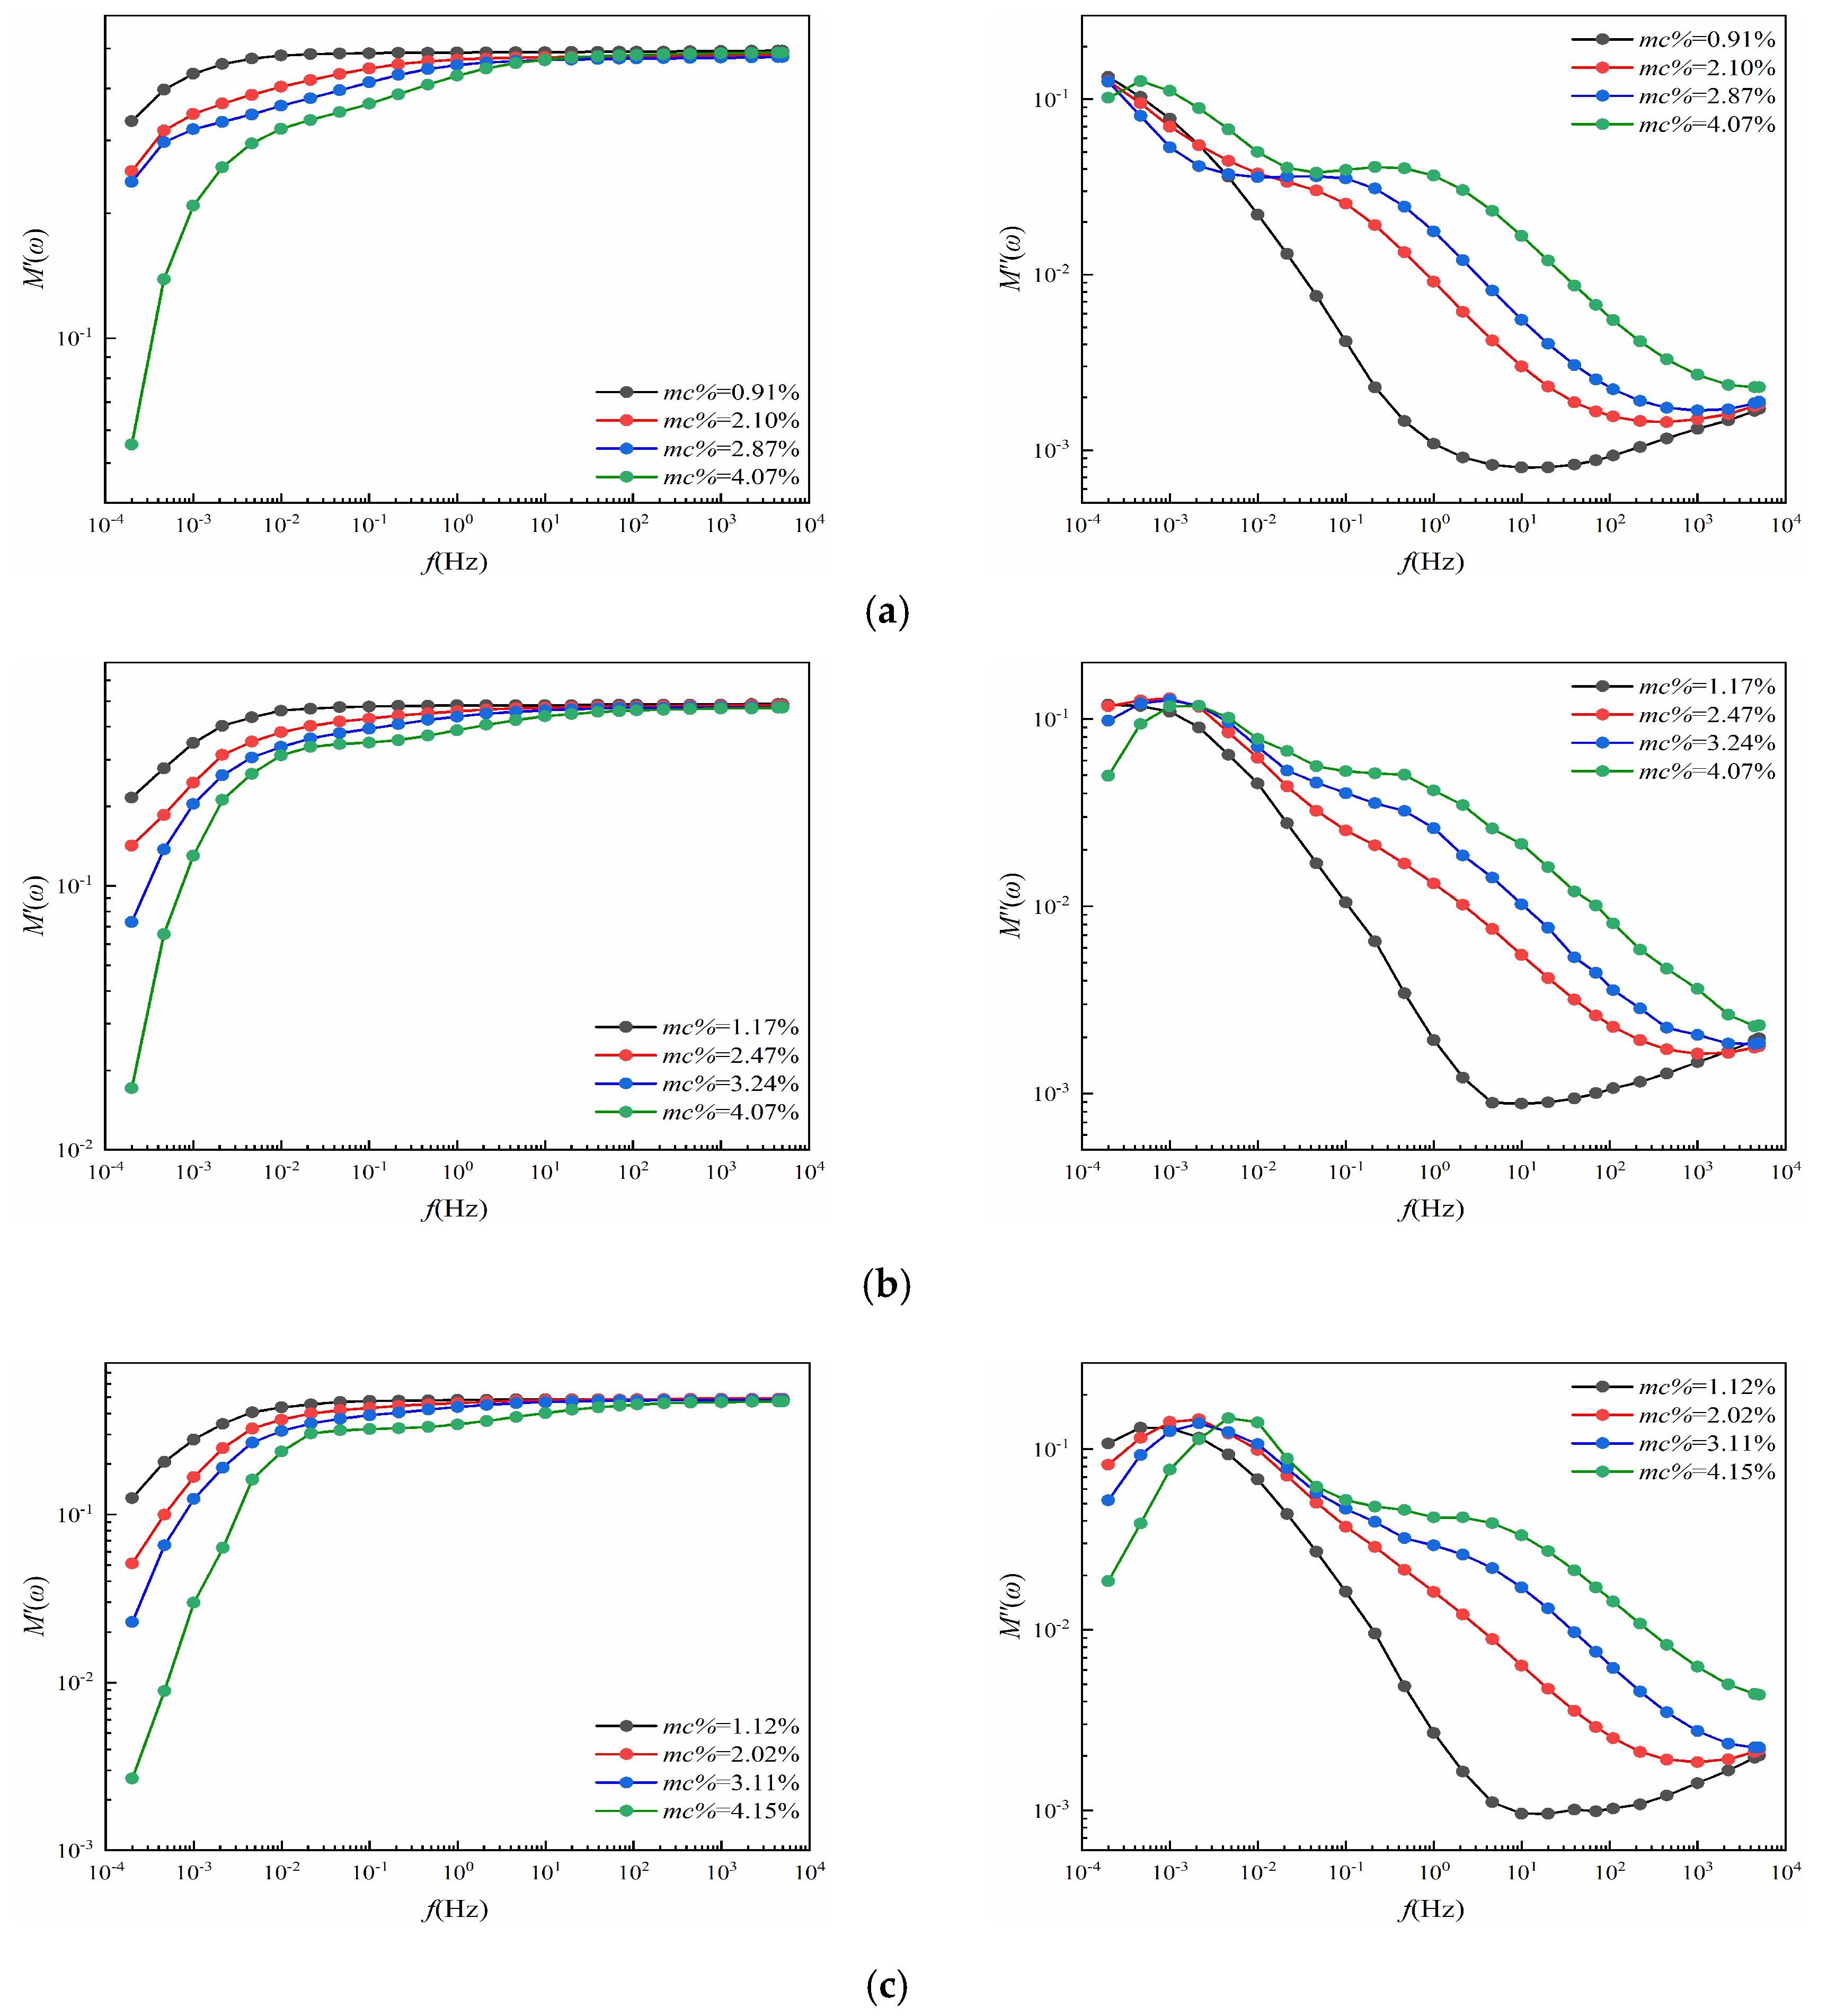
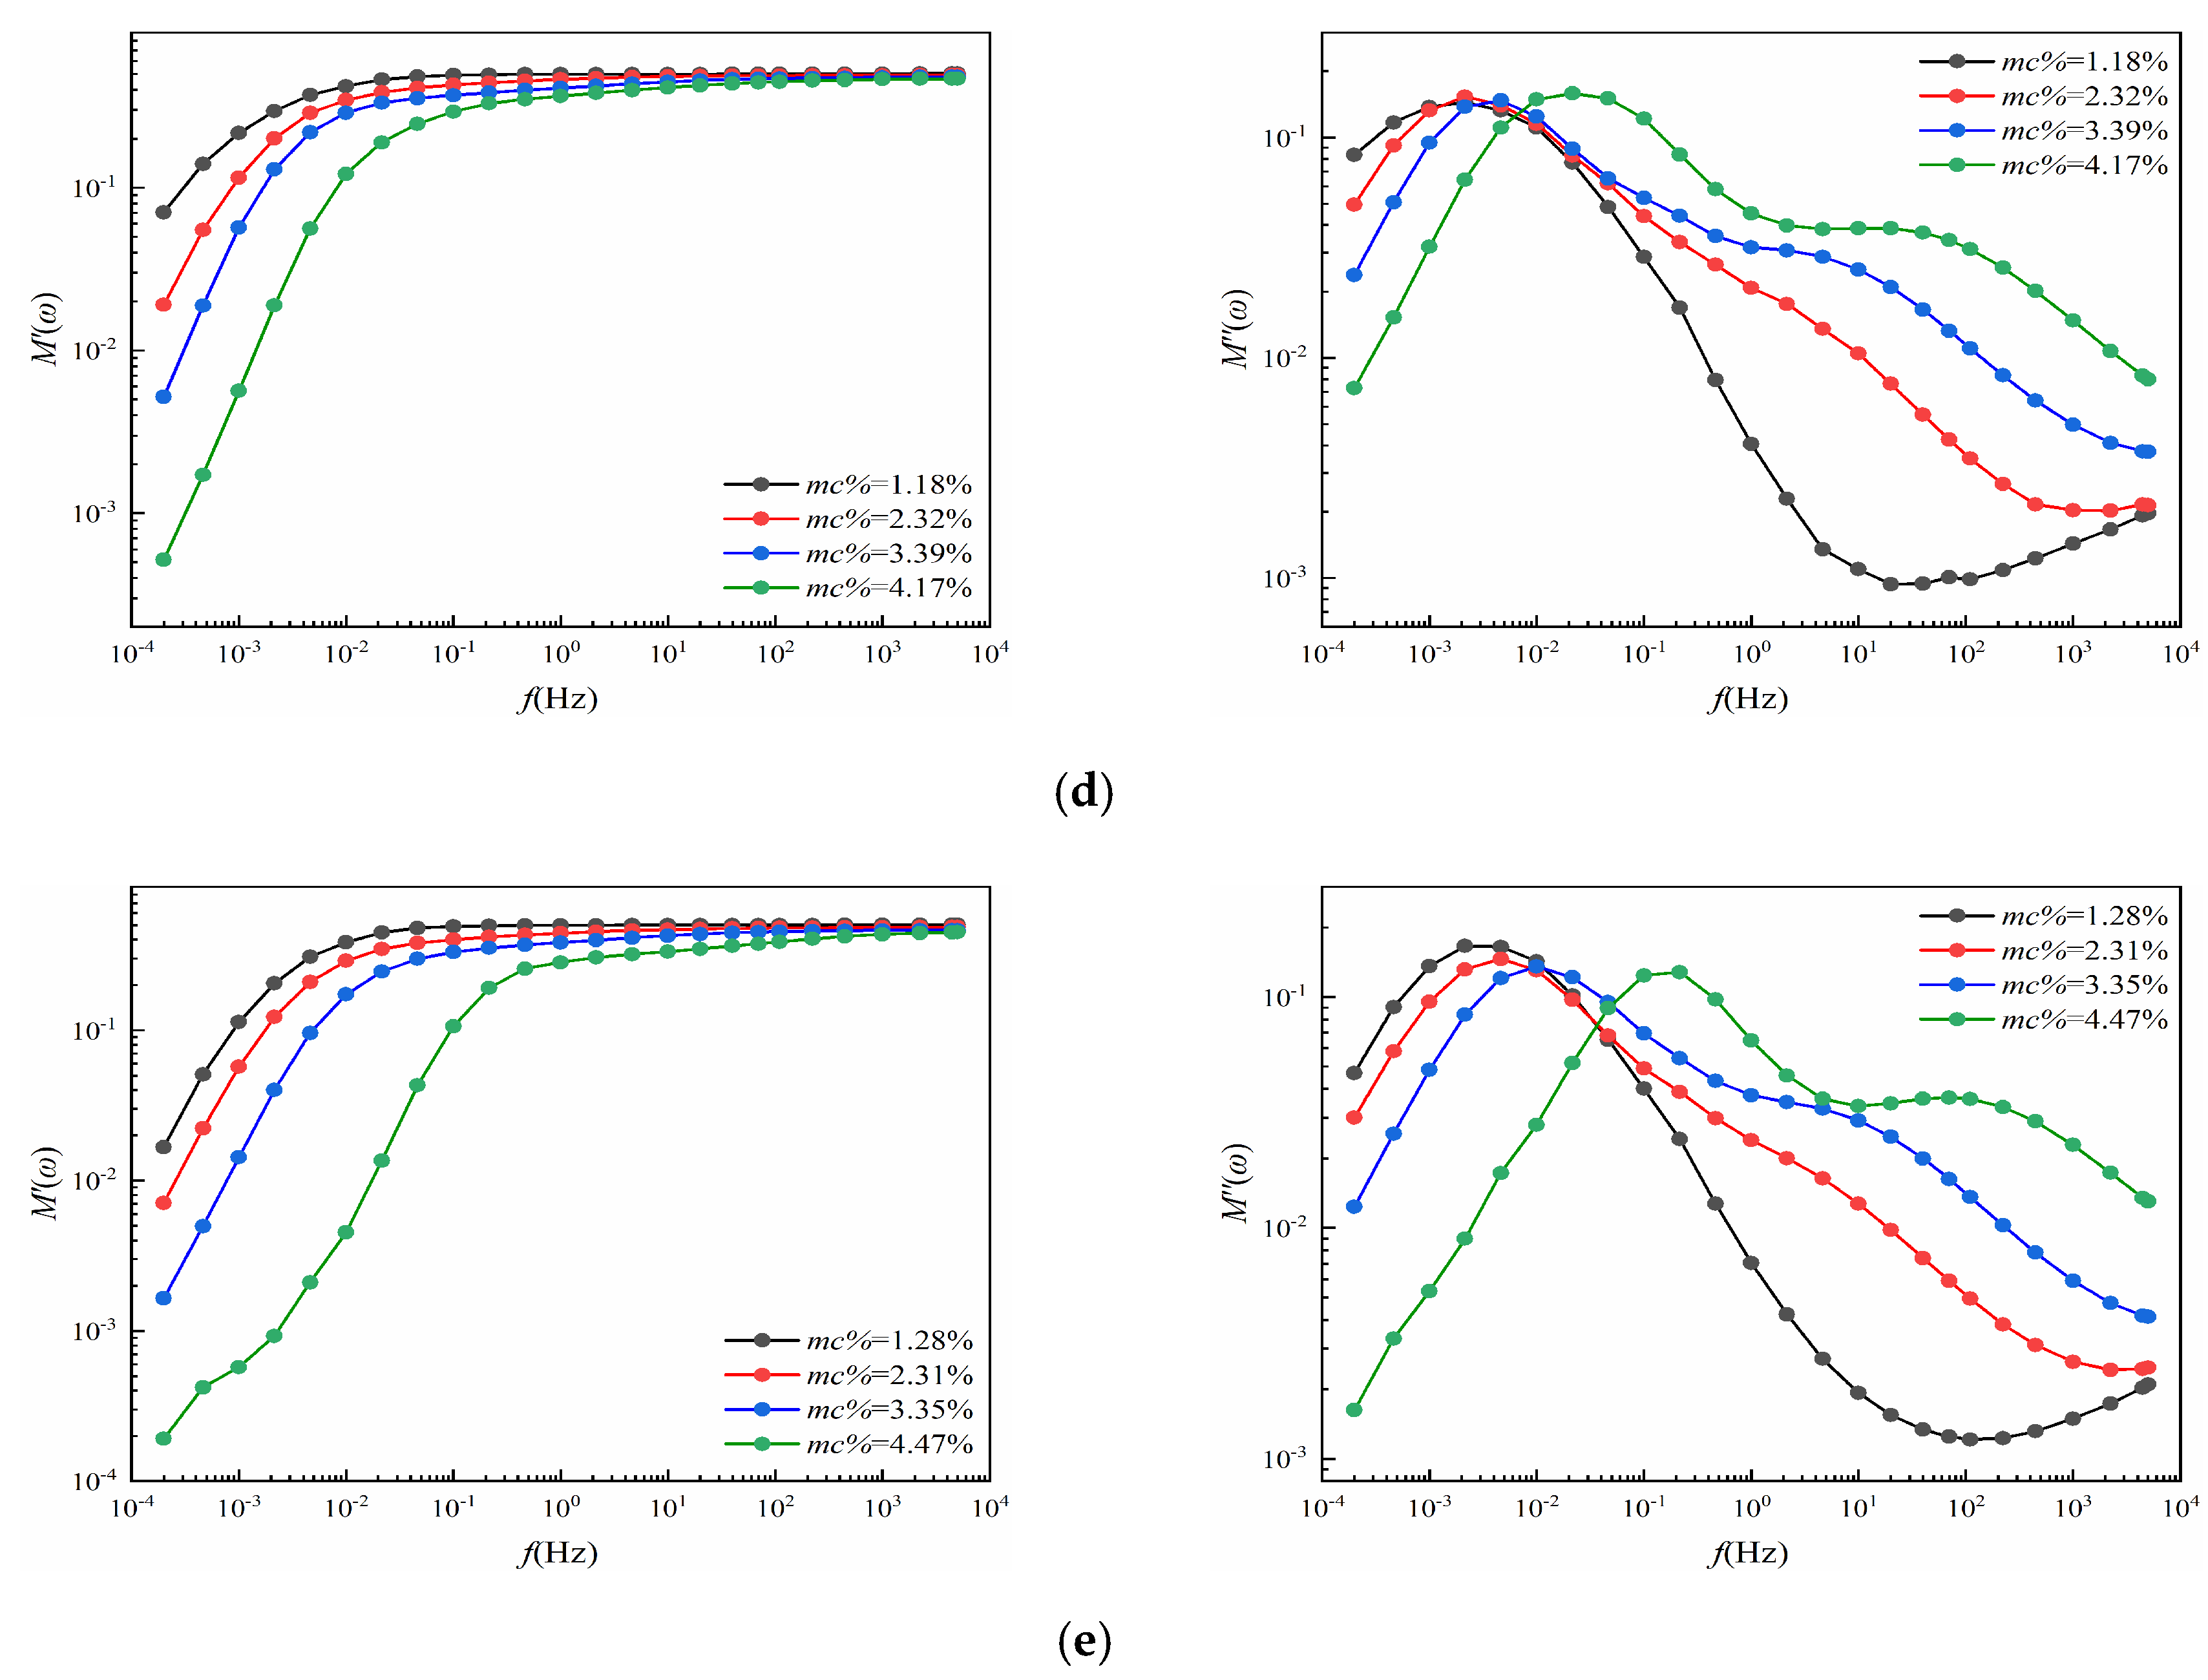
3.3. The Complex Dielectric Modulus Curves Analysis
3.3.1. Moisture Effects
3.3.2. DP Effects
3.3.3. Summaries
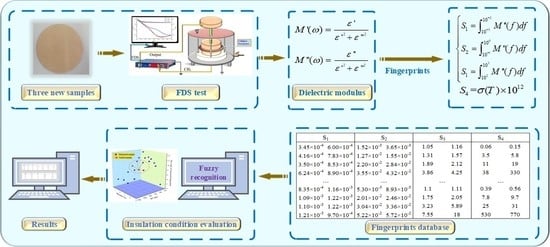
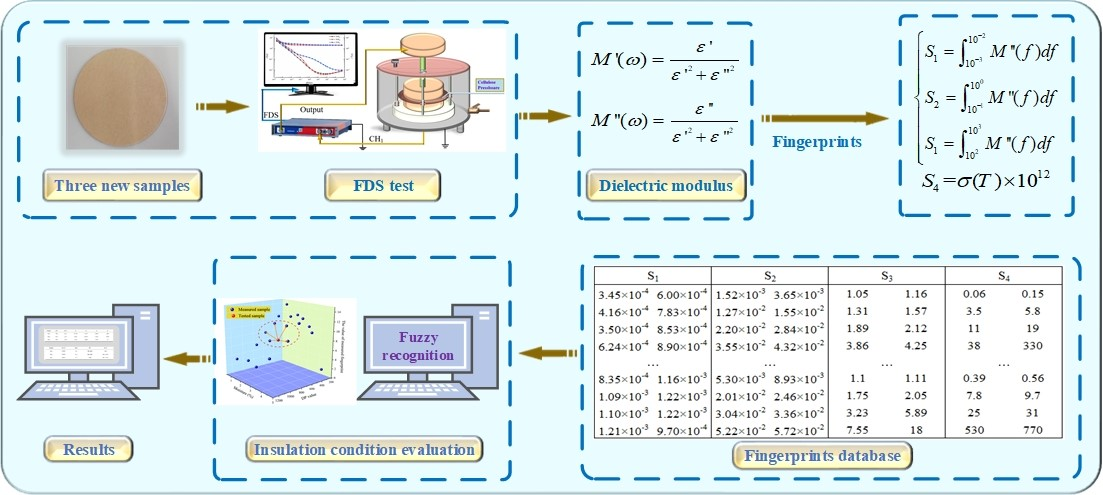
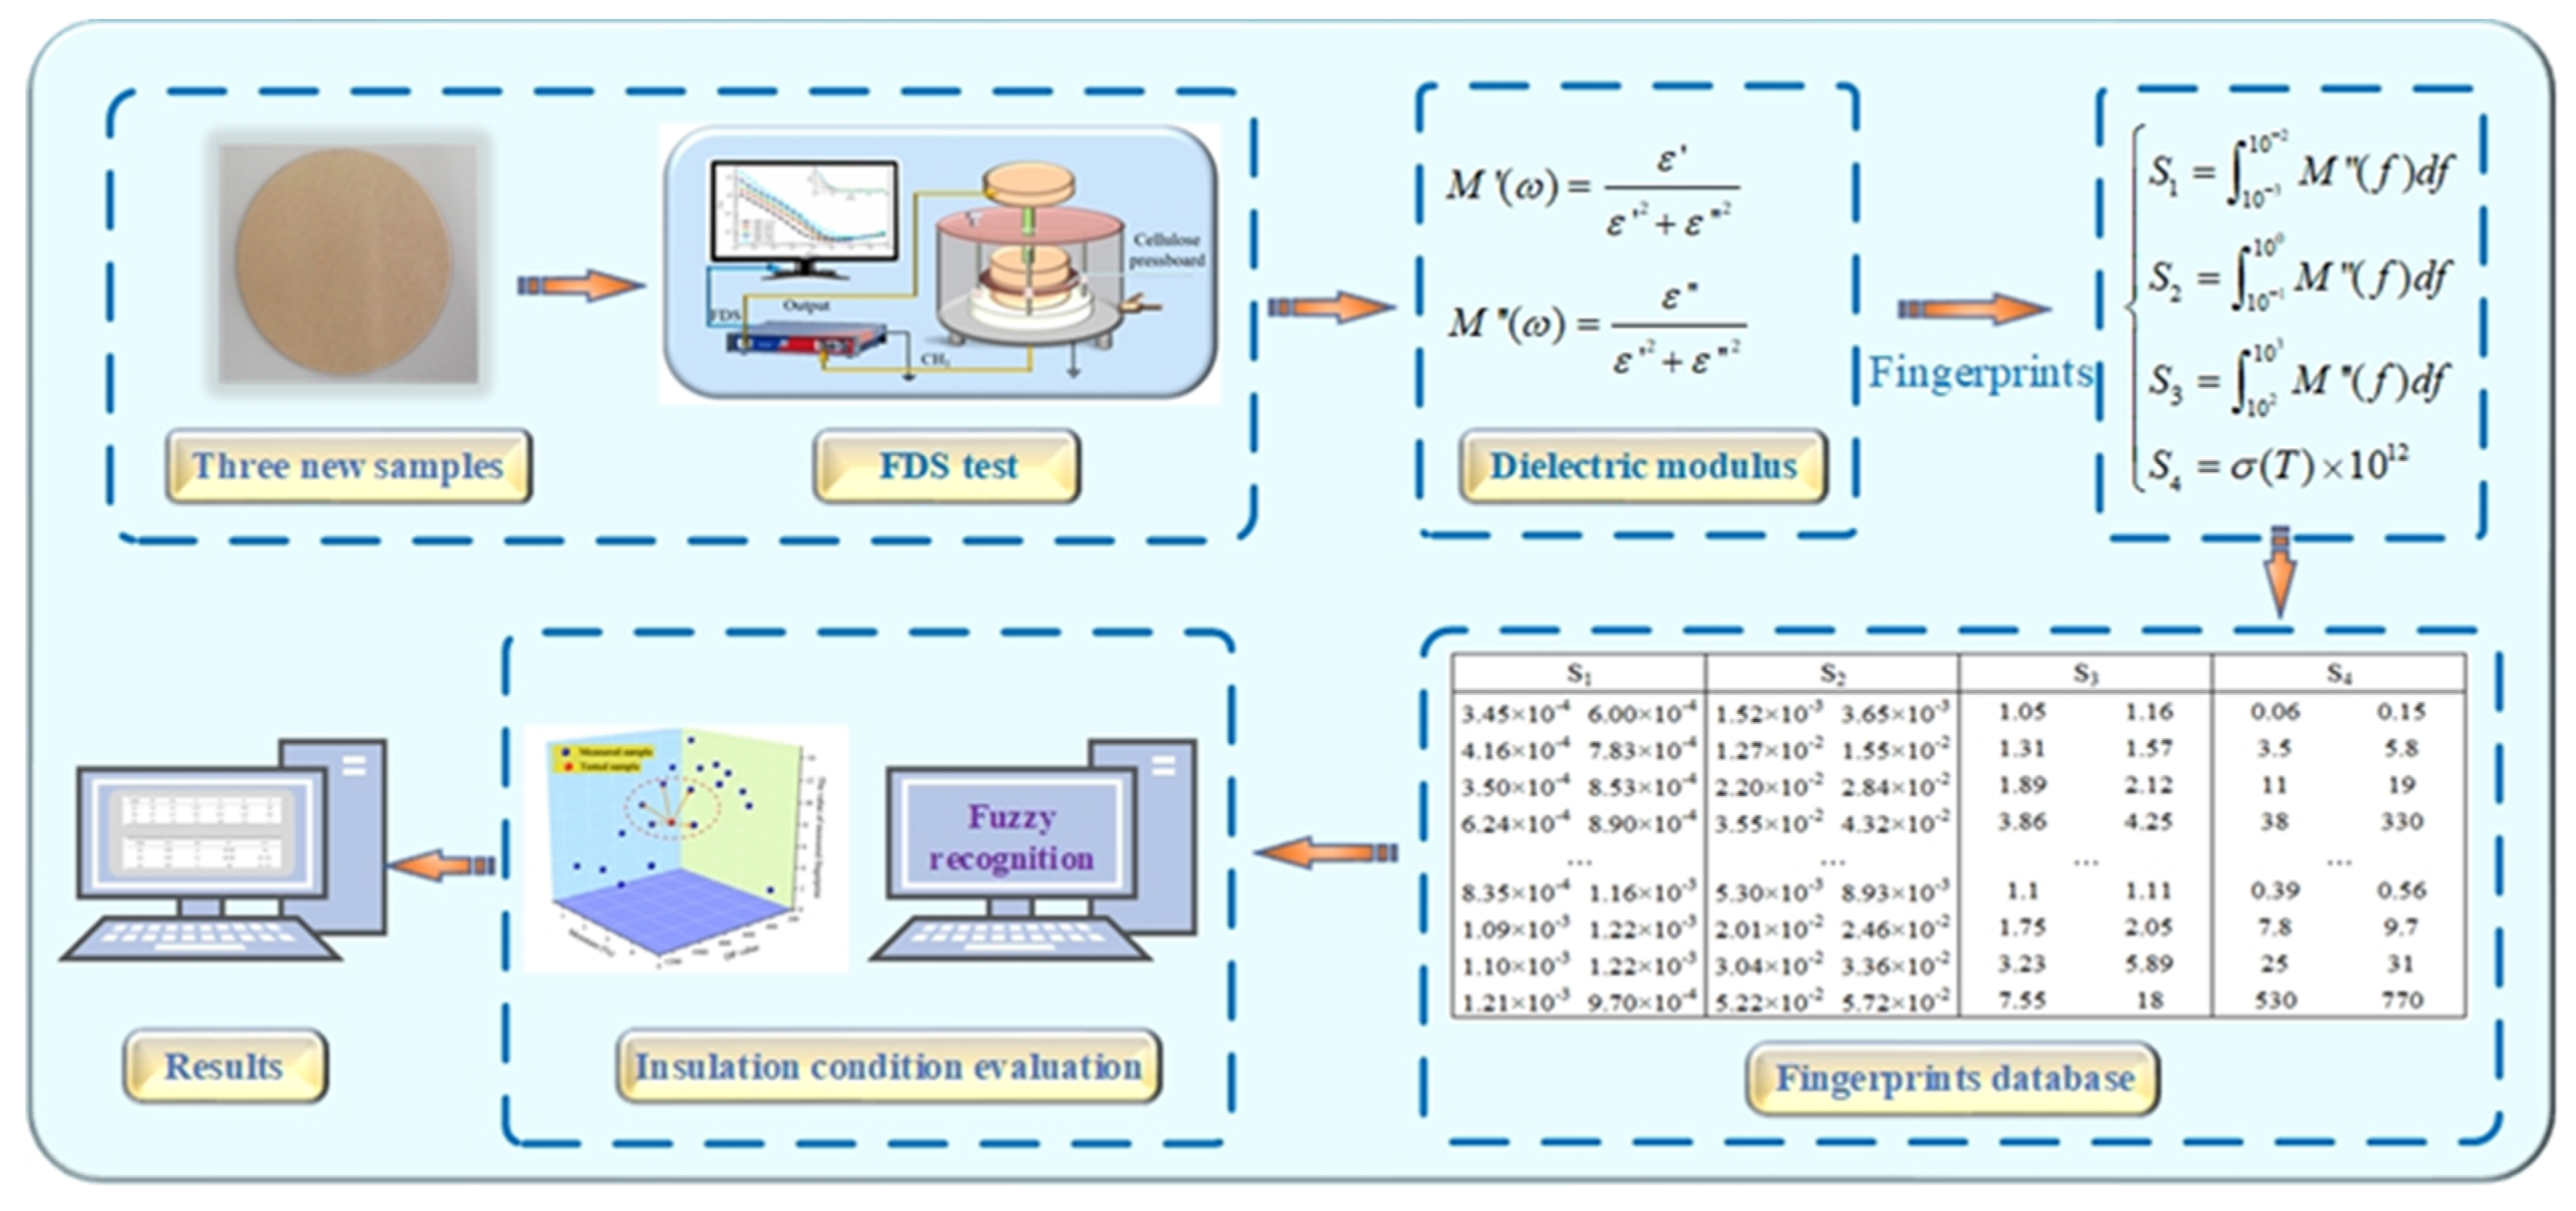
4. The Extraction of Fingerprint Parameters from the Dielectric Modulus
4.1. The Extraction of Fingerprints of S1, S2, and S3
4.2. The Extraction of S4
5. Feasibility Verification of the Fingerprint Database
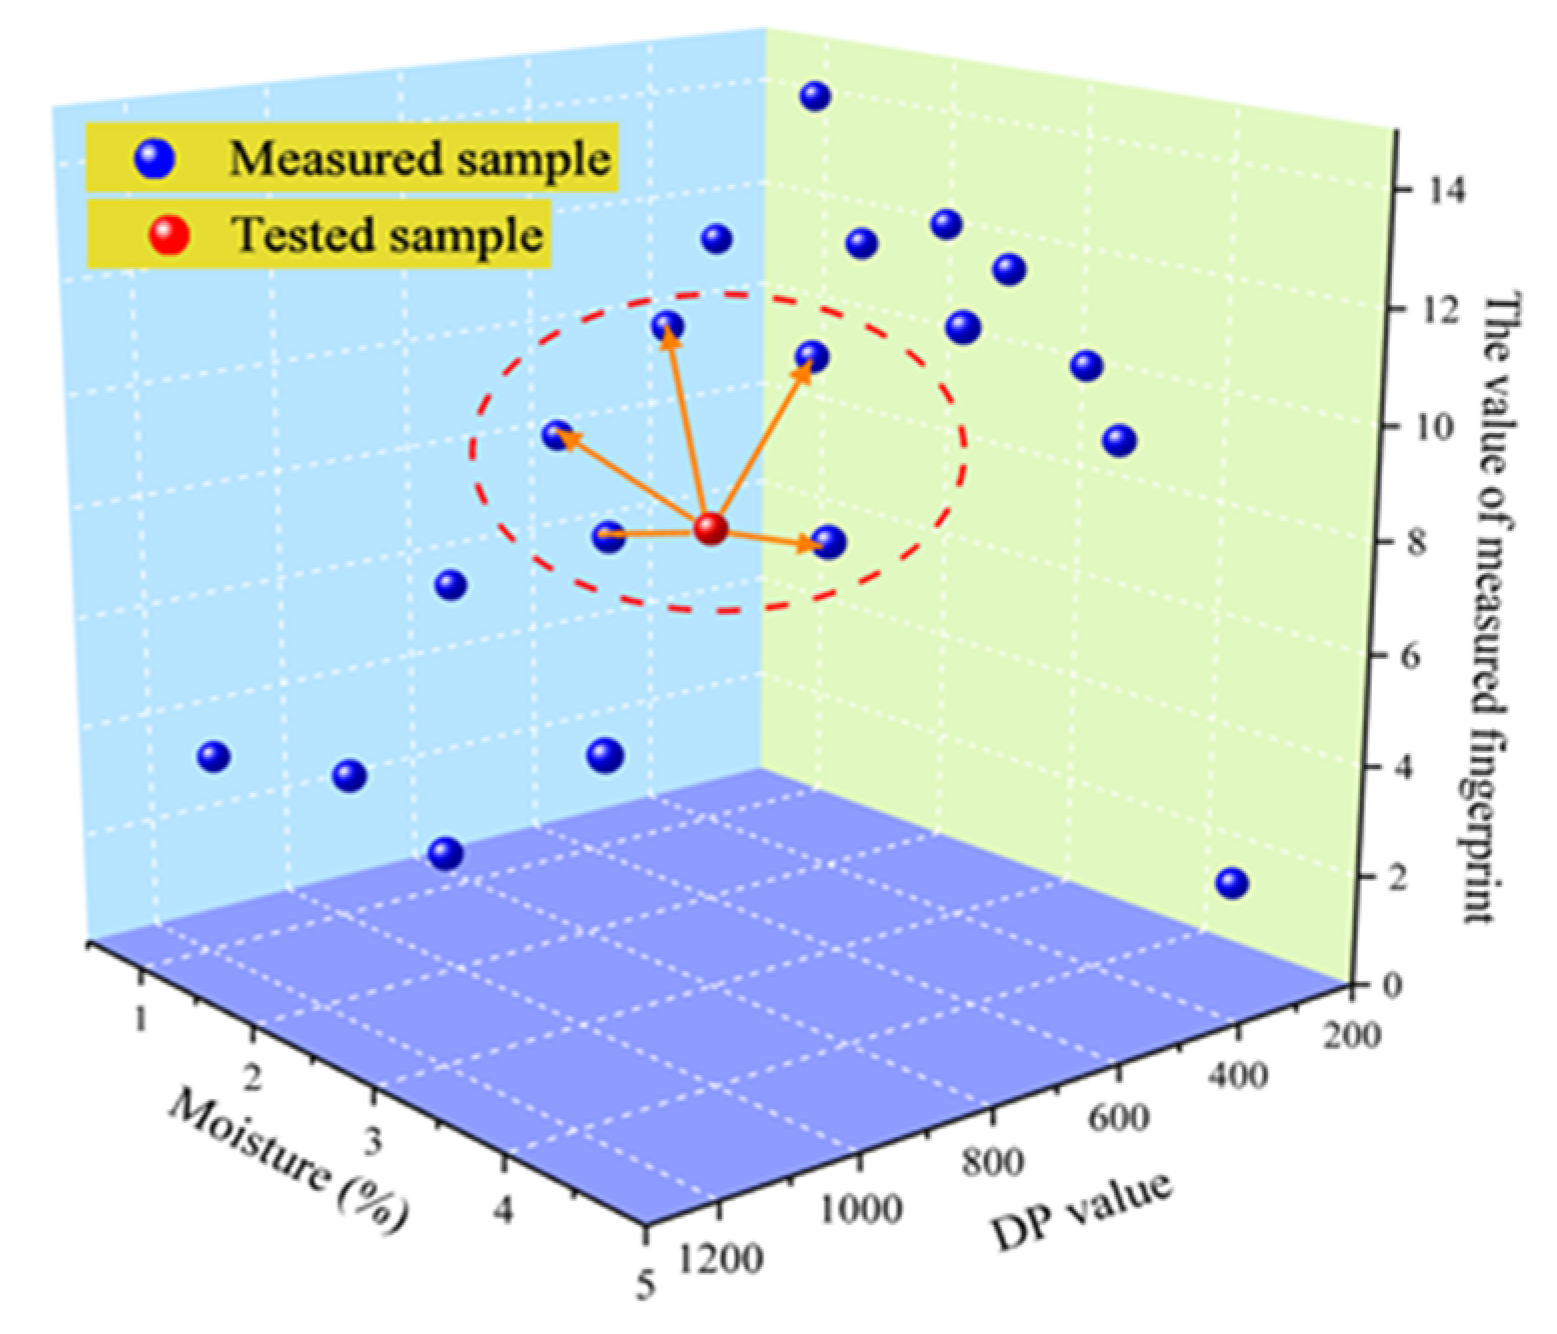
5.1. The Introduction of Fuzzy Pattern Recognition
5.2. Identification of New Samples
5.3. Comparison with Grey Relational Analysis
6. Conclusions
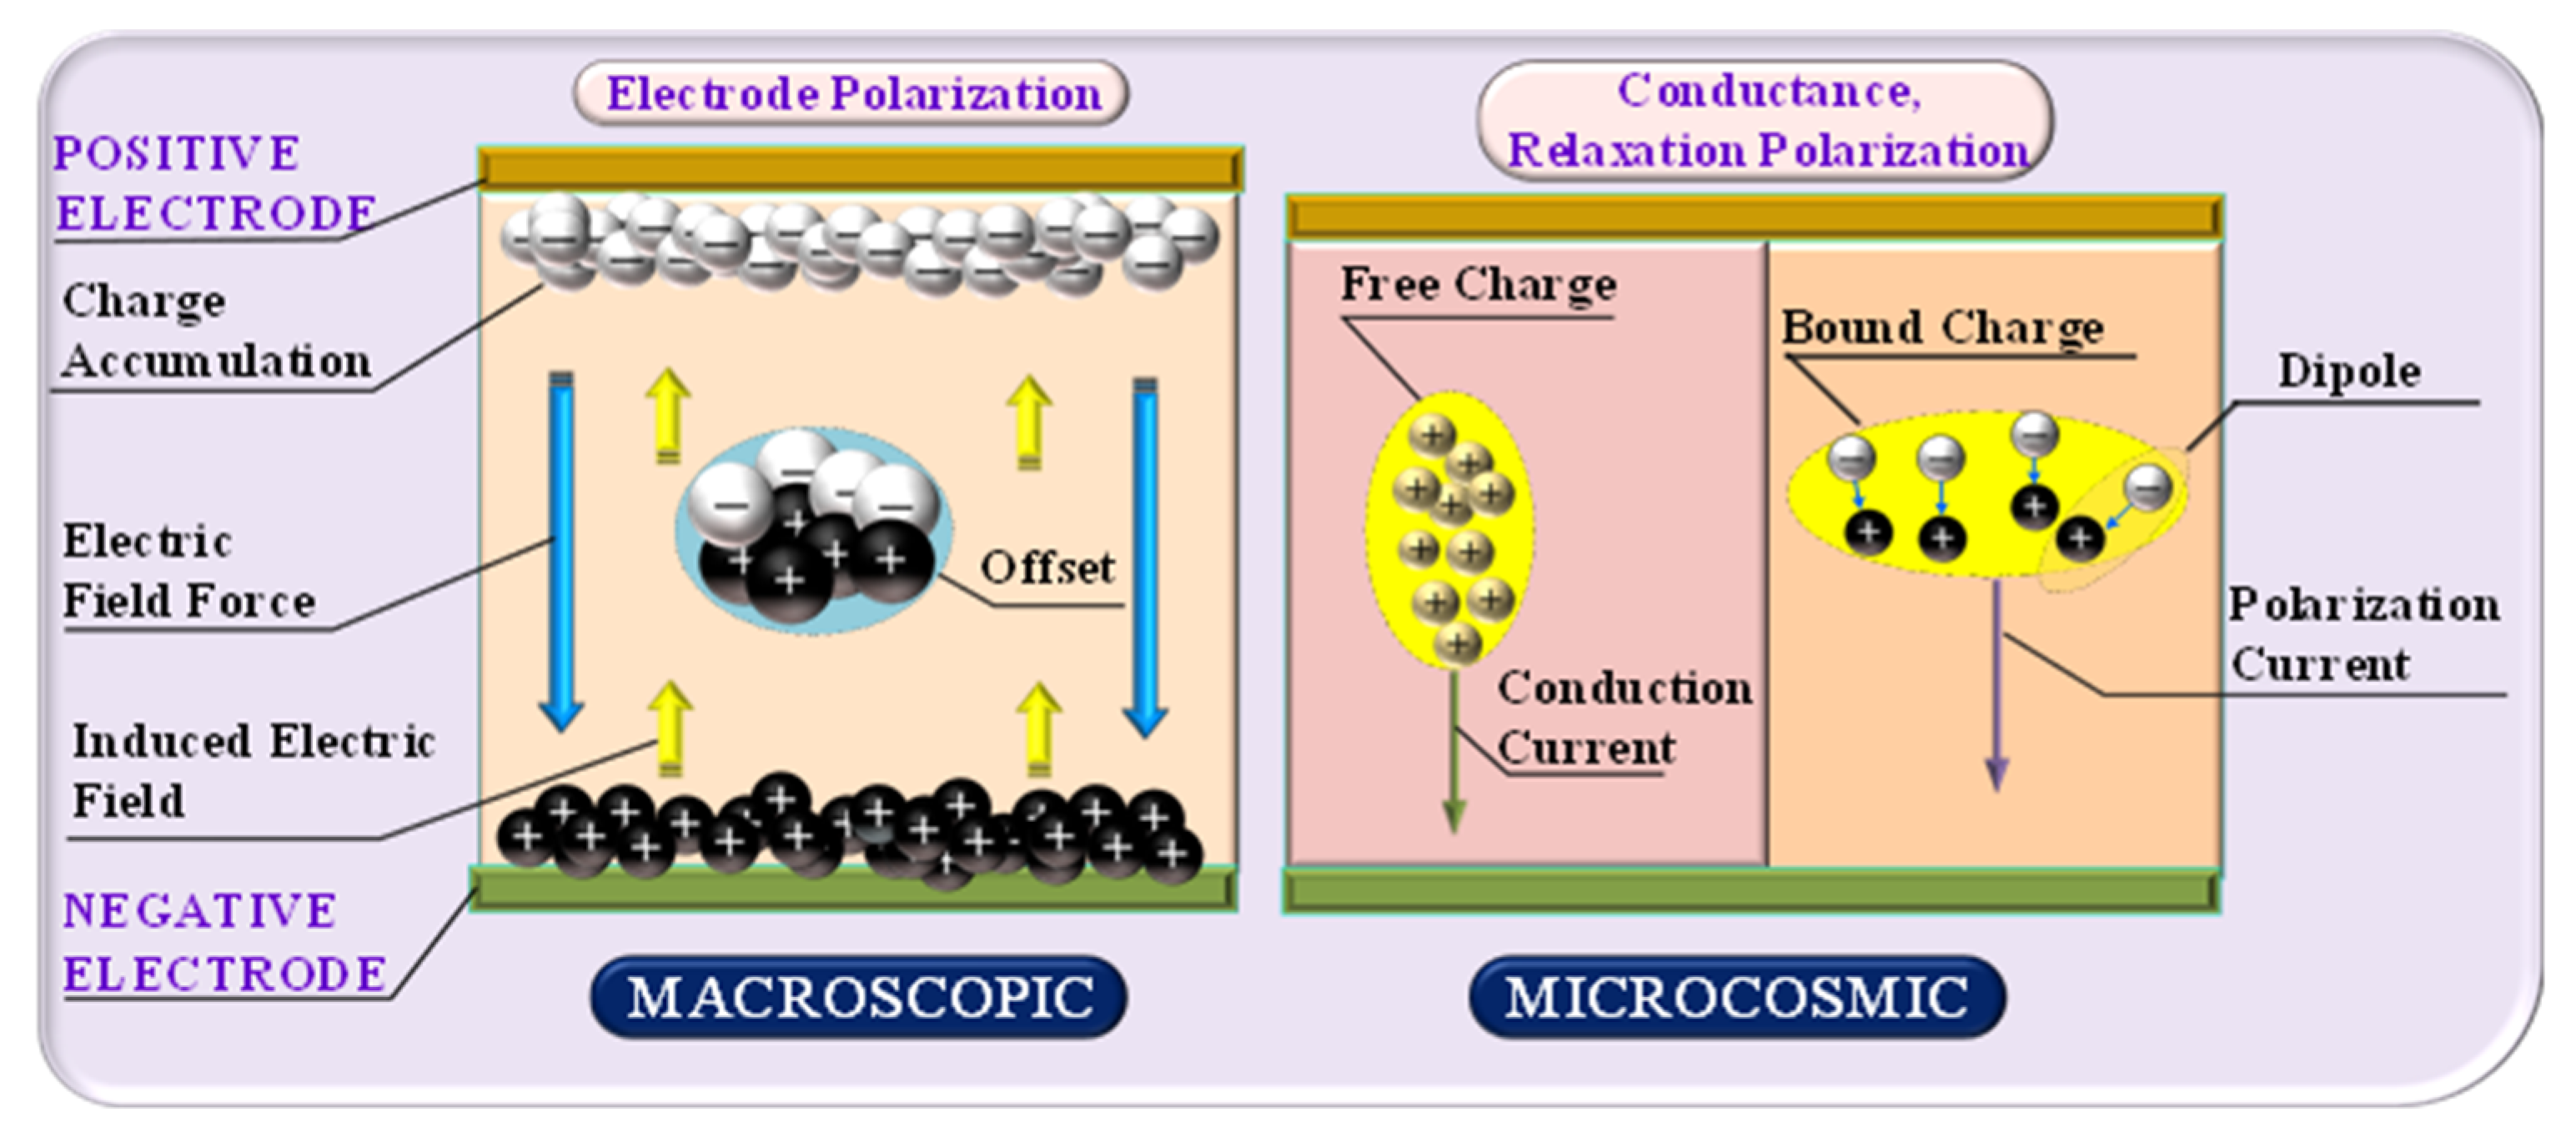
- As a frequency-response characteristic parameter, M*(ω) is certificated to be able to present the relaxation polarization information of the transformer cellulose insulation in the course of the FDS test.
- It is found that the imaginary part of the dielectric modulus could form an obvious relaxation peak in the low-frequency regions, which could be utilized to extract the feature fingerprints to characterize the aging and moisture of cellulose insulation by using integral operation.
- The synergistic effect generated by moisture and aging can be separated or distinguished by using DC conductivity. The novelty of this work is in an exploration of the dielectric modulus as a useful tool to extract the parameters to build a database for the comprehensive prediction of aging and moisture.
- It is proved that the reported feature fingerprint database could serve as a potential tool for the comprehensive prediction of transformer cellulose insulation.
Author Contributions
Funding
Conflicts of Interest
References
- Thakur, S.; Sarathi, R.; Gautam, R.; Vinu, R. Thermal aging of cellulosic pressboard material and its surface discharge and chemical characterization. Cellulose 2017, 24, 5197–5210. [Google Scholar] [CrossRef]
- Emsley, A.M.; Heywood, R.J.; Ali, M.; Eley, C.M. On the kinetics of degradation of cellulose. Cellulose 1997, 4, 1–5. [Google Scholar] [CrossRef]
- Ding, H.Z.; Wang, Z.D. On the degradation evolution equations of cellulose. Cellulose 2008, 15, 205–224. [Google Scholar] [CrossRef]
- Lundgaard, L.E.; Hansen, W.; Linhjell, D.; Painter, T.J. Aging of oil-impregnated paper in power transformers. IEEE Trans. Power Deliv. 2004, 19, 230–239. [Google Scholar] [CrossRef]
- Liu, J.; Fan, X.; Zhang, Y. Frequency Domain Spectroscopy Prediction of Transformer Oil-Immersed Cellulose Insulation under Diverse Temperature and Moisture. IEEE Trans. Dielectr. Electr. Insul. 2020. [Google Scholar] [CrossRef]
- Darveniza, M.; Saha, T.K.; Hill, D.J.T. Investigations into effective methods for assessing the condition of insulation in aged power transformers. IEEE Trans. Power Deliv. 1998, 13, 1214–1223. [Google Scholar] [CrossRef]
- Liu, J.; Yang, S.; Zhang, Y.; Zheng, H.; Shi, Z.; Zhang, C. A modified X-model of the oil-impregnated bushing including non-uniform thermal aging of cellulose insulation. Cellulose 2020, 27, 4525–4538. [Google Scholar] [CrossRef]
- Linhjell, D.; Lundgaard, L.; Gafvert, U. Dielectric response of mineral oil impregnated cellulose and the impact of aging. IEEE Trans. Dielectr. Electr. Insul. 2007, 14, 156–169. [Google Scholar] [CrossRef]
- Mandlik, M.; Ramu, T.S. Moisture Aided Degradation of Oil Impregnated Paper Insulation in Power Transformers. IEEE Trans. Dielectr. Electr. Insul. 2014, 21, 186–193. [Google Scholar] [CrossRef]
- Wolny, S. Analysis of Recovery Voltage Parameters of Paper-Oil Insulation Obtained from Simulation Investigations Using the Cole-Cole Model. IEEE Trans. Dielectr. Electr. Insul. 2016, 16, 1676–1680. [Google Scholar] [CrossRef]
- Scheirs, J.; Camino, C.; Avidano, M.; Tumiatti, W. Origin of furanic compounds in thermal degradation of cellulosic insulating paper. J. Appl. Polym. Sci. 1998, 69, 2541–2547. [Google Scholar] [CrossRef]
- Liu, J.F.; Fan, X.H.; Zhang, Y.Y.; Zhang, C.H.; Wang, Z.X. Aging evaluation and moisture prediction of oil-immersed cellulose insulation in field transformer using frequency domain spectroscopy and aging kinetics model. Cellulose 2020. [Google Scholar] [CrossRef]
- Wang, S.Q.; Zhang, G.J.; Wei, J.L.; Yang, S.S.; Dong, M.; Huang, X.B. Investigation on Dielectric Response Characteristics of Thermally Aged Insulating Pressboard in Vacuum and Oil-impregnated Ambient. IEEE Trans. Dielectr. Electr. Insul. 2010, 17, 1853–1862. [Google Scholar] [CrossRef]
- Xia, G.Q.; Wu, G.N.; Gao, B.; Yin, H.J.; Yang, F.B. A New Method for Evaluating Moisture Content and Aging Degree of Transformer Oil-Paper Insulation Based on Frequency Domain Spectroscopy. Energies 2017, 10, 1195. [Google Scholar] [CrossRef]
- Gao, J.; Yang, L.J.; Wang, Y.Y.; Liu, X.; Lv, Y.D.; Zheng, H.B. Condition Diagnosis of Transformer Oil-paper Insulation Using Dielectric Response Fingerprint Characteristics. IEEE Trans. Dielectr. Electr. Insul. 2016, 23, 1207–1218. [Google Scholar] [CrossRef]
- Baral, A.; Chakravorti, S. Prediction of Moisture Present in Cellulosic Part of Power Transformer Insulation using Transfer Function of Modified Debye Model. IEEE Trans. Dielectr. Electr. Insul. 2014, 21, 1368–1375. [Google Scholar] [CrossRef]
- Zhang, D.N.; Yun, H.; Zhan, J.Y.; Sun, X.; He, W.L.; Niu, C.B.; Mu, H.B.; Zhang, G.J. Insulation Condition Diagnosis of Oil-Immersed Paper Insulation Based on Non-linear Frequency-Domain Dielectric Response. IEEE Trans. Dielectr. Electr. Insul. 2018, 25, 1980–1988. [Google Scholar] [CrossRef]
- Liu, J.F.; Fan, X.H.; Zhang, Y.Y.; Zheng, H.B.; Jiao, J. Temperature correction to dielectric modulus and activation energy prediction of oil-immersed cellulose insulation. IEEE Trans. Dielectr. Electr. Insul. 2020, 27, 956–963. [Google Scholar] [CrossRef]
- Shroff, D.H.; Stannett, A.W. A review of paper aging in power transformers. IEE Proc. Gener. Transm. Distrib. 1985, 132, 312–319. [Google Scholar] [CrossRef]
- Liu, J.F.; Fan, X.H.; Zhang, Y.Y.; Zheng, H.B.; Zhu, M.Z. Quantitative evaluation for moisture content of cellulose insulation material in paper/oil system based on frequency dielectric modulus technique. Cellulose 2020, 27, 2343–2356. [Google Scholar] [CrossRef]
- Saha, T.K.; Purkait, P. Investigations of temperature effects on the dielectric response measurements of transformer oil-paper insulation system. IEEE Trans. Power Deliv. 2008, 23, 252–260. [Google Scholar] [CrossRef]
- Baral, A.; Chakravorti, S. Compensating the Effect of Temperature Variation on Dielectric Response of Oil-paper Insulation used in Power Transformers. IEEE Trans. Dielectr. Electr. Insul. 2016, 23, 2462–2474. [Google Scholar] [CrossRef]
- Tian, F.Q.; Ohki, Y. Electric Modulus Powerful Tool for Analyzing Dielectric Behavior. IEEE Trans. Dielectr. Electr. Insul. 2014, 21, 929–931. [Google Scholar] [CrossRef]
- Alsuhaibani, S.; Khan, Y.; Beroual, A.; Malik, N.H. A Review of Frequency Response Analysis Methods for Power Transformer Diagnostics. Energies 2016, 9, 879. [Google Scholar] [CrossRef]
- Jonscher, A.K. Dielectric relaxation in solids. J. Phys. D Appl. Phys. 1999, 32, R57–R70. [Google Scholar] [CrossRef]
- Saha, T.K.; Purkait, P. Understanding the impacts of moisture and thermal ageing on transformer’s insulation by dielectric response and molecular weight measurements. IEEE Trans. Dielectr. Electr. Insul. 2008, 15, 568–582. [Google Scholar] [CrossRef]
- Lundgaard, L.E.; Linhjell, D.; Hestad, O.L.; Borlaug, J.T. High frequency dielectric response of paper/oil insulation. In Proceedings of the IEEE International Conference on Dielectric Liquids, Futuroscope-Chasseneuil, France, 30 June–3 July 2008. [Google Scholar]
- Liao, R.J.; Liu, J.F.; Yang, L.J.; Wang, K.; Hao, J.; Ma, Z.Q.; Gao, J.; Lv, Y.D. Quantitative Analysis of Insulation Condition of Oil-paper Insulation Based on Frequency Domain Spectroscopy. IEEE Trans. Dielectr. Electr. Insul. 2015, 22, 322–334. [Google Scholar] [CrossRef]
- Krause, C.; Dreier, L.; Fehlmann, A.; Cross, J. The degree of polymerization of cellulosic insulation: Review of measuring technologies and its significance on equipment. In Proceedings of the 2014 IEEE Electrical Insulation Conference (EIC), Philadelphia, PA, USA, 8–11 June 2014. [Google Scholar]
- Emsley, A.M.; Stevens, G.C. Review of chemical indicators of degradation of cellulosic electrical paper insulation in oil-filled transformers. IEE Proc. Sci. Meas. Technol. 1994, 141, 324–334. [Google Scholar] [CrossRef]
- Flora, S.D.; Divekar, M.S.; Rajan, J.S. Factors affecting polarization and depolarization current measurements on insulation of transformers. IEEE Trans. Dielectr. Electr. Insul. 2017, 24, 619–629. [Google Scholar] [CrossRef]


| Cellulose Pressboard | Insulating Oil | ||
|---|---|---|---|
| Brand | T4 pressboard | Brand | Karamay No.25 naphthenic mineral oil |
| Manufacturer | Taizhou Weidmann High Voltage Insulation Co. Ltd, Taizhou, China | Manufacturer | Chongqing Chuanrun Petroleum Chemical Co. Ltd., Chonngqing, China |
| Thickness | 0.5 mm | tanδ | 4 × 10⁻⁴ |
| Tensile Strength | MD: 98 MPa, CMD: 47 MPa | Pour point | ≤−45 °C |
| Density | 0.96 g/cm3 | Flash point | 135 °C |
| DP = 1171 | Group Number | 1 | ||||
| Aging 0 Day | Moisture content (mc%) | 0.91 | 2.10 | 2.87 | 4.07 | |
| Label | P11 | P12 | P13 | P14 | ||
| DP = 854 | Group Number | 2 | ||||
| Aging 1 day | Moisture content (mc%) | 1.17 | 2.47 | 3.24 | 4.07 | |
| Label | P21 | P22 | P23 | P24 | ||
| DP = 674 | Group Number | 3 | ||||
| Aging 3 days | Moisture content (mc%) | 1.12 | 2.02 | 3.11 | 4.15 | |
| Label | P31 | P32 | P33 | P34 | ||
| DP = 424 | Group Number | 4 | ||||
| Aging 7 days | Moisture content (mc%) | 1.18 | 2.32 | 3.39 | 4.17 | |
| Label | P41 | P41 | P43 | P44 | ||
| DP = 279 | Group Number | 5 | ||||
| Aging 15 days | Moisture content (mc%) | 1.28 | 2.31 | 3.35 | 4.47 | |
| Label | P51 | P52 | P53 | P54 | ||
| DP = 1171 | mc% | |||
| 0.91 | 2.1 | 2.87 | 4.07 | |
| S1 | 3.45 × 10⁻⁴ | 4.16 × 10⁻⁴ | 3.50 × 10⁻⁴ | 6.24 × 10⁻⁴ |
| S2 | 1.52 × 10⁻³ | 1.27 × 10⁻² | 2.20 × 10⁻² | 3.55 × 10⁻² |
| S3 | 1.05 | 1.31 | 1.89 | 3.86 |
| DP = 854 | mc% | |||
| 1.17 | 2.47 | 3.24 | 4.07 | |
| S1 | 6.00 × 10⁻⁴ | 7.83 × 10⁻⁴ | 8.53 × 10⁻⁴ | 8.90 × 10⁻⁴ |
| S2 | 3.65 × 10⁻³ | 1.55 × 10⁻² | 2.84 × 10⁻² | 4.32 × 10⁻² |
| S3 | 1.16 | 1.57 | 2.12 | 4.25 |
| DP = 674 | mc% | |||
| 1.12 | 2.02 | 3.11 | 4.15 | |
| S1 | 8.35 × 10⁻⁴ | 1.09 × 10⁻³ | 1.10 × 10⁻³ | 1.21 × 10⁻³ |
| S2 | 5.30 × 10⁻³ | 2.01 × 10⁻² | 3.04 × 10⁻² | 5.22 × 10⁻² |
| S3 | 1.10 | 1.75 | 3.23 | 7.55 |
| DP = 424 | mc% | |||
| 1.18 | 2.32 | 3.39 | 4.17 | |
| S1 | 1.16 × 10⁻³ | 1.22 × 10⁻³ | 1.22 × 10⁻³ | 9.70 × 10⁻⁴ |
| S2 | 8.93 × 10⁻³ | 2.46 × 10⁻² | 3.36 × 10⁻² | 5.72 × 10⁻² |
| S3 | 1.11 | 2.05 | 5.89 | 18.00 |
| DP = 279 | mc% | |||
| 1.28 | 2.31 | 3.35 | 4.47 | |
| S1 | 1.41 × 10⁻³ | 1.22 × 10⁻³ | 1.02 × 10⁻³ | 1.62 × 10⁻⁴ |
| S2 | 1.36 × 10⁻² | 2.80 × 10⁻² | 4.09 × 10⁻² | 8.61 × 10⁻² |
| S3 | 1.20 | 2.86 | 7.17 | 25.23 |
| No | 1 | 2 | 3 | 4 | 5 | 6 | 7 | 8 | 9 | 10 |
| DP | 1171 | 1171 | 1171 | 1171 | 854 | 854 | 854 | 854 | 674 | 674 |
| mc% | 0.91 | 2.10 | 2.87 | 4.07 | 1.17 | 2.47 | 3.24 | 4.07 | 1.12 | 2.02 |
| S4 | 0.06 | 3.50 | 11.00 | 38.00 | 0.15 | 5.80 | 19.00 | 330.00 | 0.39 | 7.80 |
| No | 11 | 12 | 13 | 14 | 15 | 16 | 17 | 18 | 19 | 20 |
| DP | 674 | 674 | 424 | 424 | 424 | 424 | 279 | 279 | 279 | 279 |
| mc% | 3.11 | 4.15 | 1.18 | 2.32 | 3.39 | 4.17 | 1.28 | 2.31 | 3.35 | 4.47 |
| S4 | 25.00 | 530.00 | 0.56 | 9.70 | 31.00 | 770.00 | 0.72 | 17.00 | 56.00 | 1200 |
| Aging Day(s) | DP | mc% | S1 | S2 | S3 | S4 | Target State |
|---|---|---|---|---|---|---|---|
| 0 | 1171 | 0.91 | 3.45 × 10⁻⁴ | 1.52 × 10⁻³ | 1.05 | 0.06 | 1 |
| 2.1 | 4.16 × 10⁻⁴ | 1.27 × 10⁻² | 1.31 | 3.5 | 2 | ||
| 2.87 | 3.50 × 10⁻⁴ | 2.20 × 10⁻² | 1.89 | 11 | 3 | ||
| 4.07 | 6.24 × 10⁻⁴ | 3.55 × 10⁻² | 3.86 | 38 | 4 | ||
| 1 | 854 | 1.17 | 6.00 × 10⁻⁴ | 3.65 × 10⁻³ | 1.16 | 0.15 | 5 |
| 2.47 | 7.83 × 10⁻⁴ | 1.55 × 10⁻² | 1.57 | 5.8 | 6 | ||
| 3.24 | 8.53 × 10⁻⁴ | 2.84 × 10⁻² | 2.12 | 19 | 7 | ||
| 4.07 | 8.90 × 10⁻⁴ | 4.32 × 10⁻² | 4.25 | 330 | 8 | ||
| 3 | 674 | 1.12 | 8.35 × 10⁻⁴ | 5.30 × 10⁻³ | 1.10 | 0.39 | 9 |
| 2.02 | 1.09 × 10⁻³ | 2.01 × 10⁻² | 1.75 | 7.8 | 10 | ||
| 3.11 | 1.10 × 10⁻³ | 3.04 × 10⁻² | 3.23 | 25 | 11 | ||
| 4.15 | 1.21 × 10⁻³ | 5.22 × 10⁻² | 7.55 | 530 | 12 | ||
| 7 | 424 | 1.18 | 1.16 × 10⁻³ | 8.93 × 10⁻³ | 1.11 | 0.56 | 13 |
| 2.32 | 1.22 × 10⁻³ | 2.46 × 10⁻² | 2.05 | 9.7 | 14 | ||
| 3.39 | 1.22 × 10⁻³ | 3.36 × 10⁻² | 5.89 | 31 | 15 | ||
| 4.17 | 9.70 × 10⁻⁴ | 5.72 × 10⁻² | 18.00 | 770 | 16 | ||
| 15 | 279 | 1.28 | 1.41 × 10⁻³ | 1.36 × 10⁻² | 1.20 | 0.72 | 17 |
| 2.31 | 1.22 × 10⁻³ | 2.80 × 10⁻² | 2.86 | 17 | 18 | ||
| 3.35 | 1.02 × 10⁻³ | 4.09 × 10⁻² | 7.17 | 56 | 19 | ||
| 4.47 | 1.62 × 10⁻⁴ | 8.61 × 10⁻² | 25.23 | 1200 | 20 |
| Aging Condition | Damp Condition | Conditions Number |
|---|---|---|
| DP = 900−1400 | mc% = 0%−1.5%, Dry | T1 |
| mc% = 1.5%−3%, Slight damp | T2 | |
| mc% = 3%−4%, Damp | T3 | |
| mc% > 4%, Serious damp | T4 | |
| DP = 700−900 | mc% = 0%−1.5%, Dry | T5 |
| mc% = 1.5%−3%, Slight damp | T6 | |
| mc% = 3%−4%, Damp | T7 | |
| mc% > 4%, Serious damp | T8 | |
| DP = 500−700 | mc% = 0%−1.5%, Dry | T9 |
| mc% = 1.5%−3%, Slight damp | T10 | |
| mc% = 3%−4%, Damp | T11 | |
| mc% > 4%, Serious damp | T12 | |
| DP = 300−500 | mc% = 0%−1.5%, Dry | T13 |
| mc% = 1.5%−3%, Slight damp | T14 | |
| mc% = 3%−4%, Damp | T15 | |
| mc% > 4%, Serious damp | T16 | |
| DP < 300 | mc% = 0%−1.5%, Dry | T17 |
| mc% = 1.5%−3%, Slight damp | T18 | |
| mc% = 3%−4%, Damp | T19 | |
| mc% > 4%, Serious damp | T20 |
| Sample | DP | mc% | S1 | S2 | S3 | S4 |
|---|---|---|---|---|---|---|
| NS1 | 726 | 2.41 | 9.38 × 10⁻⁴ | 3.52 × 10⁻² | 3.89 | 160 |
| NS2 | 313 | 1.21 | 1.06 × 10⁻³ | 6.7 × 10⁻³ | 1.16 | 0.46 |
| NS3 | 293 | 1.28 | 1.26 × 10⁻³ | 1.00 × 10⁻² | 1.11 | 1.10 |
| Sample | Predictive Results (Conditions Number) | Predictive DP | Practical DP | Predictive mc% | Practical mc% |
|---|---|---|---|---|---|
| NS1 | T8 | 700−900 | 726 | >4% | 2.41 |
| NS2 | T13 | 300−500 | 313 | 0%−1.5% | 1.21 |
| NS3 | T17 | <300 | 293 | 0%−1.5% | 1.28 |
| Sample | Predictive Results (Conditions Number) | Predictive DP | Practical DP | Predictive mc% | Practical mc% |
|---|---|---|---|---|---|
| NS1 | T4 | 900−1400 | 726 | >4% | 2.41 |
| NS2 | T17 | <300 | 313 | 0%−1.5% | 1.21 |
| NS3 | T13 | 300−500 | 293 | 0%−1.5% | 1.28 |
© 2020 by the authors. Licensee MDPI, Basel, Switzerland. This article is an open access article distributed under the terms and conditions of the Creative Commons Attribution (CC BY) license (http://creativecommons.org/licenses/by/4.0/).
Share and Cite
Zhang, Y.; Li, S.; Fan, X.; Liu, J.; Li, J. Prediction of Moisture and Aging Conditions of Oil-Immersed Cellulose Insulation Based on Fingerprints Database of Dielectric Modulus. Polymers 2020, 12, 1722. https://doi.org/10.3390/polym12081722
Zhang Y, Li S, Fan X, Liu J, Li J. Prediction of Moisture and Aging Conditions of Oil-Immersed Cellulose Insulation Based on Fingerprints Database of Dielectric Modulus. Polymers. 2020; 12(8):1722. https://doi.org/10.3390/polym12081722
Chicago/Turabian StyleZhang, Yiyi, Sheng Li, Xianhao Fan, Jiefeng Liu, and Jiaxi Li. 2020. "Prediction of Moisture and Aging Conditions of Oil-Immersed Cellulose Insulation Based on Fingerprints Database of Dielectric Modulus" Polymers 12, no. 8: 1722. https://doi.org/10.3390/polym12081722
APA StyleZhang, Y., Li, S., Fan, X., Liu, J., & Li, J. (2020). Prediction of Moisture and Aging Conditions of Oil-Immersed Cellulose Insulation Based on Fingerprints Database of Dielectric Modulus. Polymers, 12(8), 1722. https://doi.org/10.3390/polym12081722