Materials
Banana peel
Musa paradisiaca was provided by local fruit market in Bogotá, Colombia. Chitosan (Ch) with low molecular weight (
Mw = 5 kDa) and degree of deacetylation (DD) of 76 % was used. This polymer was obtained by oxidative degradation with sodium nitrite from chitosan with
Mw = 150 kDa (Supplied by PolyScience Inc., 400 Valley Road Warrington, PA, USA), and it was characterized according with our previous work [
19]. This molecular weight was selected due to the chemical modification with OA is favored by the carbodiimide chemistry route, and it work can complement another study where hyaluronic acid was used as polyanion to interact with AmCh nanoparticles [
20]. Sodium nitrite, Nile Red (NR) and 1-ethyl-3-(3-dimethylaminopropyl) carbodiimide (EDC) were purchased from Sigma Aldrich, 3050 Spruce Street, St. Louis, MO 63103 USA. Acetic acid, hydrochloric acid 37%, citric acid, acetone, sodium hydroxide, acetonitrile, ethanol, and sodium acetate were supplied by Merck KGaA, 64271 Darmstadt, Germany. Commercial oleic acid (OA) and sodium hypochlorite (NaOCl, 0.01%) were used.
- 1.
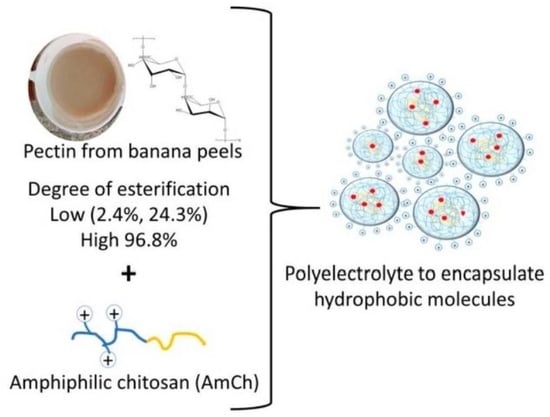
Pectin extraction from banana peel Musa paradisiaca
The banana peels
Musa paradisiaca were washed with sodium hypochlorite 0.01% and water to eliminate any impurities or microorganisms. These were then cut into small squares and 300 g of peel were pretreated in 1 L of distilled water at 90 °C for 10 min in order to deactivate the pectic enzymes which are responsible of the hydrolysis of methyl ester groups in pectin [
21]. After that, the banana peels were filtered with canvas cloth and dried at 50 °C until constant weight of raw material (134 g). The dried banana peels were pulverized and stored in a desiccator for an approximate period of eight months.
- 2.
Effect of acid type and pH on the pectin properties
The pectin extraction was carried out by acid hydrolysis of the raw material. The experimental design considered two variables: pH at two levels (1.0, 2.0) and two acid types: inorganic hydrochloric acid, HCl and organic citric acid, CA. The conditions were selected in accordance with studies which have shown higher extraction yields with organic acids such as CA and higher DE with HCl [
4,
22]. Low pH ranges allow greater cell wall breakdown [
22]. The samples were named Pec
HClpH1, Pec
HClpH2, Pec
CApH1, and Pec
CApH2. Briefly, 50 g of the pulverized material were treated with 1L of acid solution (HCl), and (CA), both with concentration 0.1 M. The mixture was heated at 85 °C for 1 h [
23,
24]. After this time, it was filtered with canvas cloth. The filtrate was cooled in an ice bath for 15 min and then it was centrifuged for 10 min at 3000 rpm. The pectin was precipitated from supernatant with 95% ethanol, in a volume ratio 1:2 (supernatant: ethanol). The precipitate remained for 4 h in an ice bath and then the pectin was filtered with canvas cloth. Pectin gel was washed with ethanol 70% until pH 6–7. Finally, the pectin gel was dried at 50 °C until constant weight and stored in a desiccator. Pectin was characterized by FTIR (Fourier transform infrared), thermogravimetric analysis (TGA), the percentage of the degree of esterification (%DE) was calculated by band deconvolution from FTIR and the extraction yield was calculated according to Equation (1) [
25], where
W is the weight of the extracted pectin after drying and
W0 is the weight of the pulverized material (50 g).
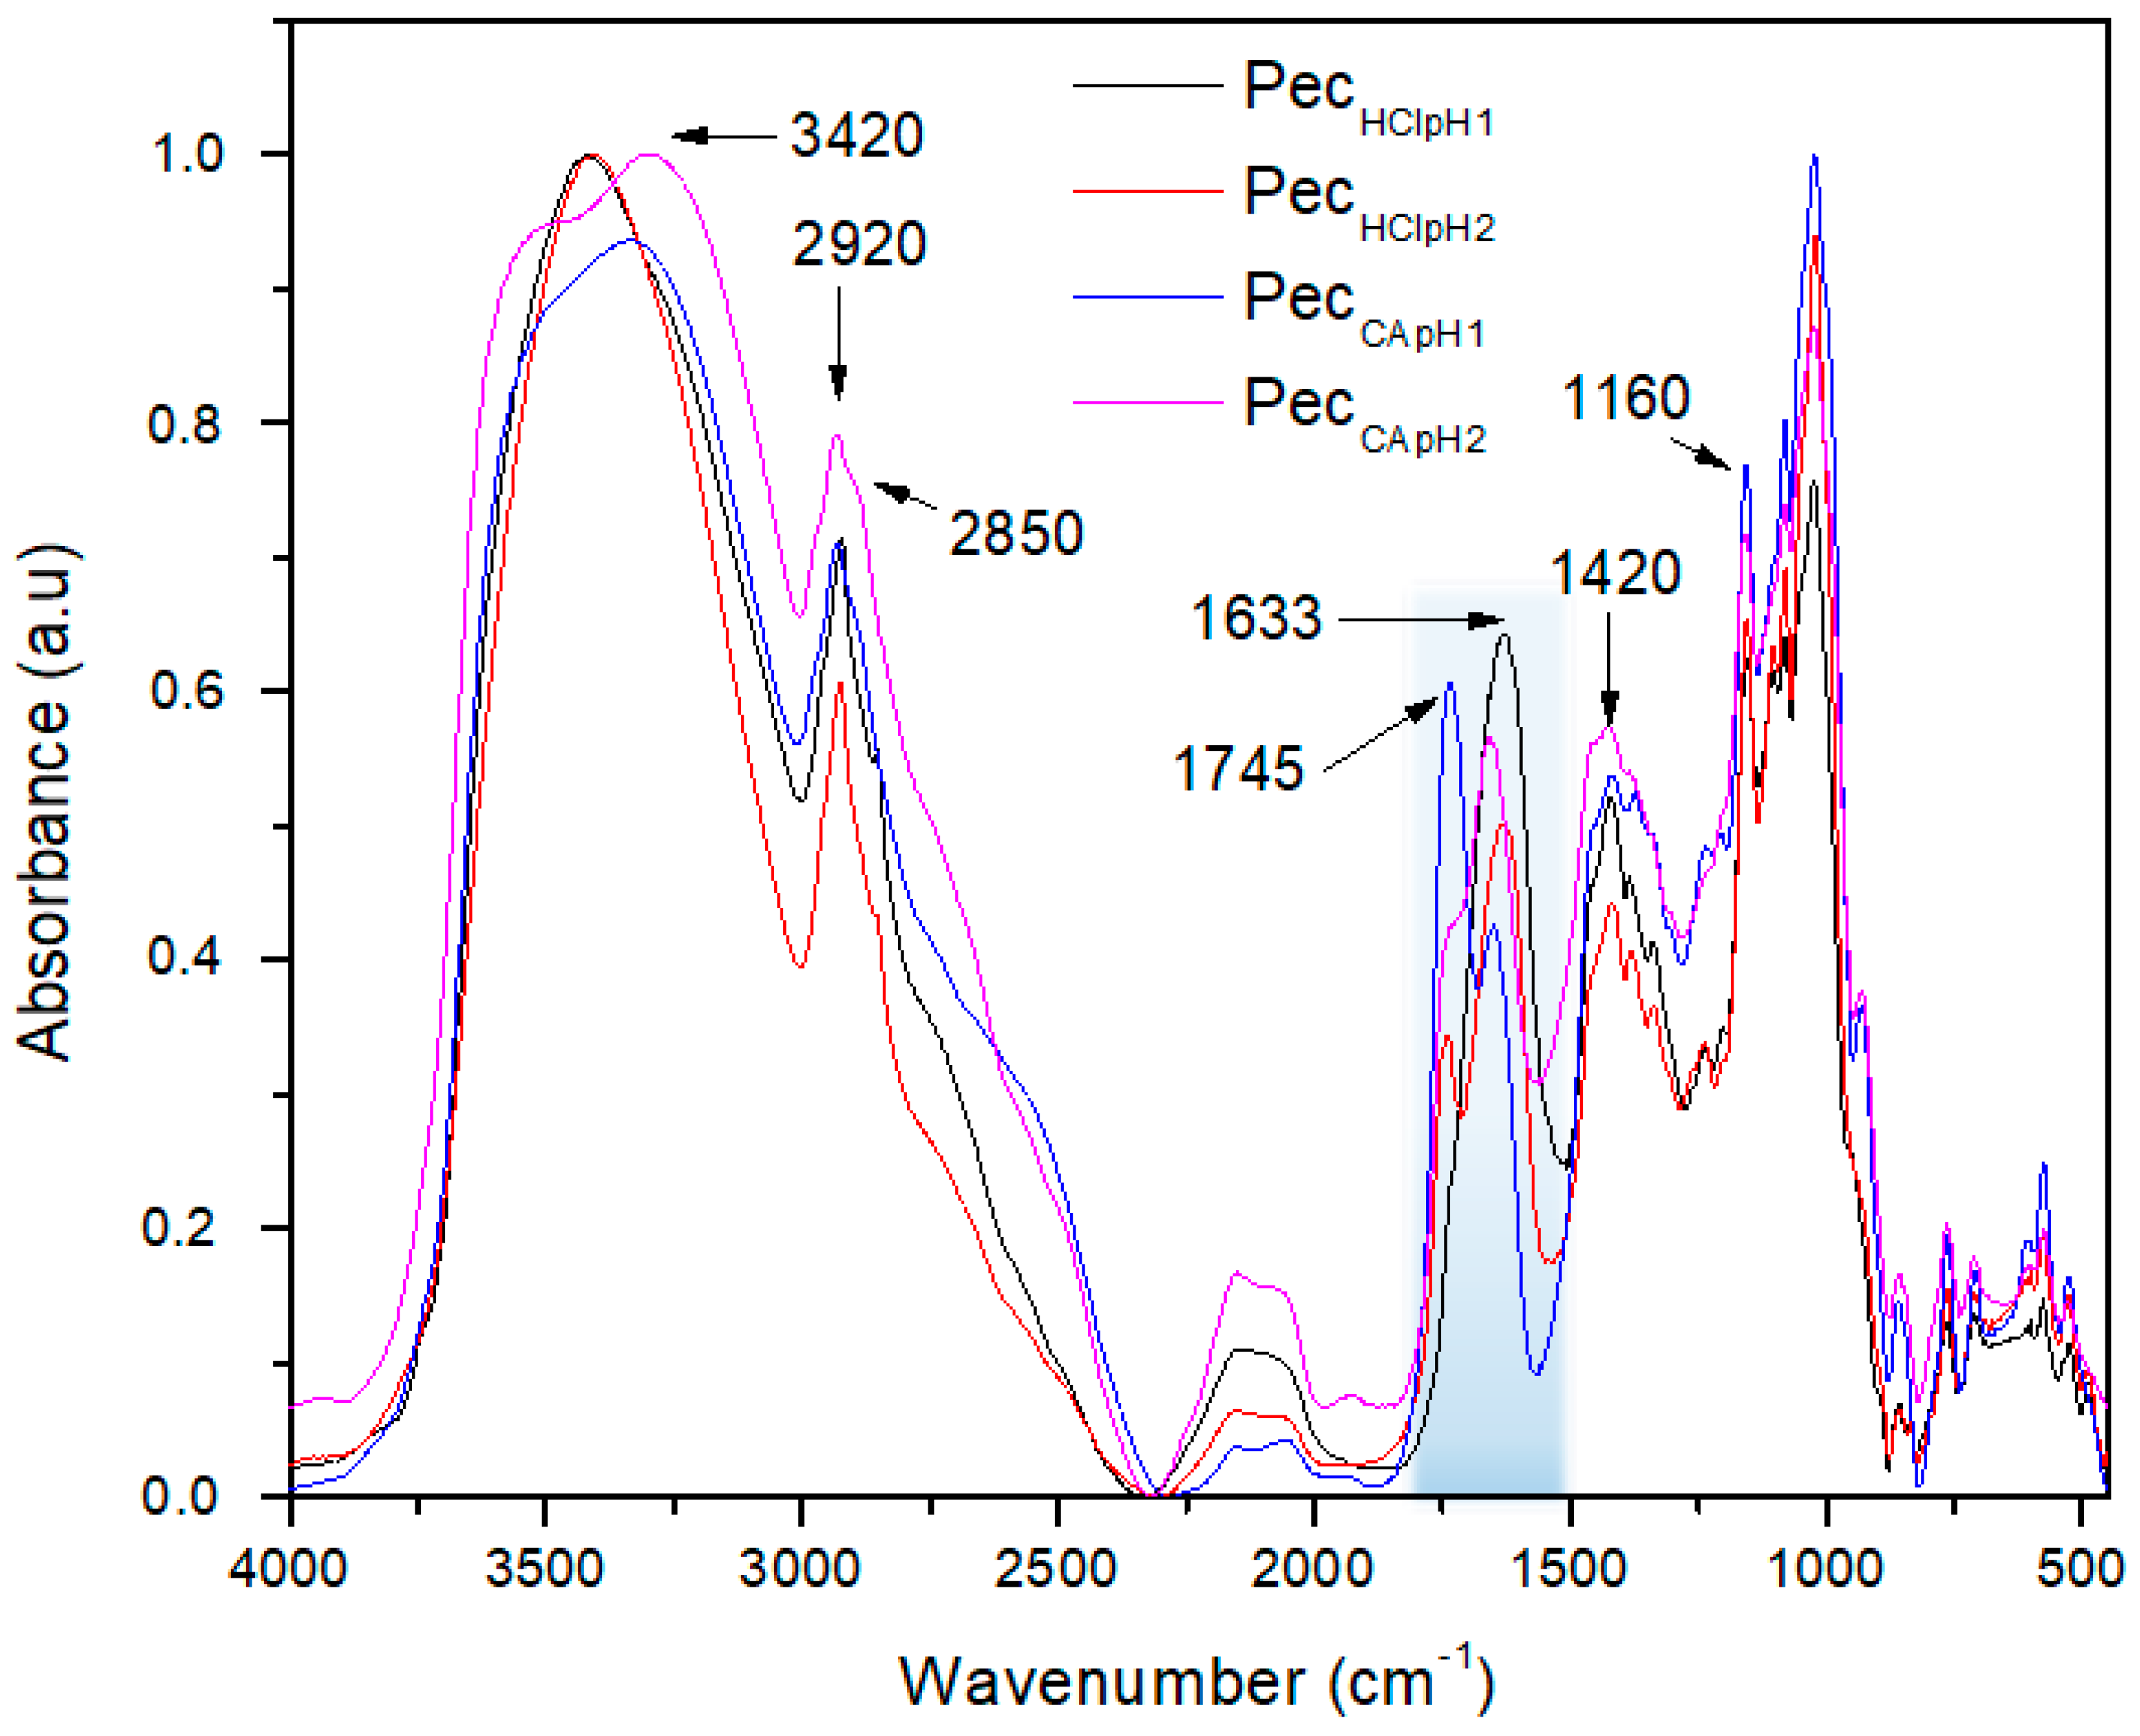
The pectin FTIR spectra were obtained in the range 4000–450 cm
−1. The samples were dispersed in KBr and the transmittance recorded over 12 scans in a FTIR Perkin Elmer spectrum one (instrument distributed by PerkinElmer, USA). The degree of esterification (DE) was determined by the area’s relation of the absorption bands at 1745 cm
−1 (methyl esterified carboxylic group) and 1633 cm
−1 (carboxylic ion) according to previous method [
1]. This IR analysis was done using the same concentration and thickness in each sample.
Thermogravimetric analysis (TGA) was performed in a thermogravimetric analyzer Q-500 TA instruments (instrument distributed by Lanzetta Rengifo & CIA Ltd., Bogotá, Colombia), using approximately 7 mg of polymer pectin to stabilize the thermal properties. The thermograms were recorded from 30 to 750 °C at a scanning rate of 10 °C/min under a nitrogen gas atmosphere.
- 3.
Preparation and characterization of polyelectrolyte nanoparticles based on AmCh:Pec
AmCh polymer was prepared from low molecular weight chitosan modified with oleic acid (12%) through the formation of amide linkages by the carbodiimide chemistry route [
19]. The polyelectrolyte nanoparticles were prepared using AmCh polymer and the pectin isolated from banana (
Musa paradisiaca) peels through sonication as a homogenization method using a probe-type sonicator (SONICS, VCX130 vibra-cell) at 130 W and 20 kHz in an ice bath where an acetate buffer 0.2 M with pH 4.6 and 7% (
v/
v) ethanol, due to the solubility of the AmCh polymer, was used. The sonication used a pulse function (amplitude 90%; pulse on 20 s; pulse off 20 s) during 2 mins.
The particle size was characterized by dynamic light scattering (DLS) (HORIBA LB-550, 1-7-8 Higashi-Kanda Chiyoda-ku, Tokyo, Japan) in a HORIBA LB-550 (instrument distributed by S&S Ingeniería, Bogotá, Colombia) and the surface charge was obtained by zeta potential in a Malvern, Zetasizer Nano Z (instrument distributed by Cecoltec, Medellín, Colombia). The polydispersity index (PdI) was measured by dynamic light scattering (DLS). The measurements were determined in triplicate using freshly prepared samples dispersed in MilliQ-water.
In order to establish the conditions to form polyelectrolyte complex nanoparticles AmCh:Pec, the effect of mass ratio and concentrations of AmCh and Pectin, pH and temperature were evaluated.
- 4.
Effect of mass ratio of AmCh:Pec
AmCh polymer and pectin were added to acetate buffer 0.2 M with pH 4.6 with 7% (v/v) of ethanol, in different mass ratio (AmCh:Pec 1:1, 1:2, 1:3, 1:6, 2:1, 3:1, 6:1, 50:1, 100:1). The polymer solutions were mixed and sonicated under the same conditions described previously.
- 5.
Effect of the AmCh and pectin concentration
According with the results of the effect of the mass ratio, the system with smaller particle size and homogeneous size distribution was selected. To evaluate the effect of two polymer concentrations, the experimental design was considered: AmCh and pectin concentrations at three levels, 1.0, 1.5, and 2.0 mg/mL, and 1.0, 0.5, and 0.2 mg/mL, respectively. The polymer solutions were mixed and sonicated under the same conditions described previously.
- 6.
Effect of the pH and temperature
To evaluate the effect of pH and temperature on the formation of the systems, the polyelectrolyte AmCh:Pec nanoparticles were prepared under the same conditions described previously. The changes in the particle size and polydispersity index of the AmCh:Pec nanoparticles were measured by DLS for the systems that were kept at different temperatures: 25, 30, 35, 37, and 40 °C and at different pH values (2.0–7.5).
- 7.
Morphology of the polyelectrolyte nanoparticles
The morphology of the optimized nanoparticles was determined by scanning electron microscopy (SEM, DENTON VACUUM Desk IV). The sample was prepared by adding a drop on the carbon tape, and then it was dried under vacuum for 24 h. The sample was covered with gold and then analyzed with the software ImageJ.
- 8.
Encapsulation of Nile Red (NR) in polyelectrolyte nanoparticles based on AmCh:Pec
To study the encapsulation behavior, a proof molecule was used. Nile red was encapsulated in polyelectrolyte nanoparticles using three different mass ratios with respect to the total weight of the polymers (2.0%, 1.0%, 0.5%). Briefly, AmCh was added in an acetate buffer 0.2 M at pH 4.6, with a final concentration of 1 mg/mL; and pectin with final concentration of 1 mg/ml. NR was dissolved in 1 mL of ethanol and it was added in the polymer’s mixture. The nanoparticles were prepared using the same conditions described previously by sonication. The nanoparticles were purified by ultrafiltration using a regenerated cellulose membrane of 1 kDa and a Stirred Ultrafiltration Cell, Merck Millipore Ref. 5122 equipment. Nanoparticles solution was washed with ethanol 7% (v/v) to eliminate unencapsulated NR. Finally, nanoparticle solutions were recovered in MilliQ water.
To quantify the NR encapsulated, the washes were analyzed through the calibration curve and compared with the amount of NR encapsulated in the nanoparticles. For the last one process, the dispersions of the nanoparticles were lyophilized for one day. The solid obtained was dissolved in a known volume of acetonitrile and an aliquot of this solution was taken to be analyzed by UV-vis at 537 nm and compared with the NR reference curve [
26]. NR encapsulation efficiency was determined in triplicate and the values were reported as mean ± standard deviation (SD). The encapsulation efficiency (EE) and loading capacity (LC) were calculated using the Equations (2) and (3), respectively. In addition, AmCh:Pec nanoparticle sizes were analyzed by DLS technique after the encapsulation process.
All data are presented as mean ± standard deviation (± SD) from at least three measurements. Means are compared between groups by one-way analysis of variance (ANOVA) and two groups by Student’s t test. A p < 0.05 are considered statistically significant. Calculations were done using the software Statgraphics Centurion XVI.I


