1. Introduction
Fiber reinforced polymer (FRP) reinforcement was investigated as a substitute to the conventional steel reinforcement. FRP reinforcement combats a few of the shortcomings of steel reinforcement. Particularly, FRP reinforcements are known for their high corrosion resistance due to their non-metallic nature [
1]. In addition, FRP composites provide higher tensile strength than steel products do [
1,
2]. Depending on the type of fiber used, FRP composites are categorized as carbon FRP (CFRP), glass FRP (GFRP), basalt FRP (BFRP), and aramid FRP (AFRP) [
1,
2,
3,
4]. The aforementioned FRP products differ in properties due to the difference in fiber type, fiber volume, fiber orientation, resin type, chemical composition, and quality control during the development process [
1]. The chemical composition of FRP makes them anisotropic, i.e., they show linear elastic behavior until rupture [
1,
2]. Due to the difference in behavior between steel and FRP composites, the conventional design philosophies, followed in ACI 318, had to be tailored to the new development. The advancement in the realm of FRP led to the birth of a new manual for FRP reinforced concrete design (ACI 440). The manual is still a work in progress, especially in areas such as bond dependent coefficient, BFRP reinforcement, and exposure. This paper attempts to fill in some of the gaps in knowledge by investigating bond dependent coefficient of concrete beams reinforced with BFRP bars exposed to harsh conditions.
Few studies investigated the mechanical behavior [
5], compression behavior [
6], shear behavior [
7,
8,
9,
10], and flexural behavior [
11,
12,
13,
14,
15] of BFRP reinforcement. Elgabbas et al. [
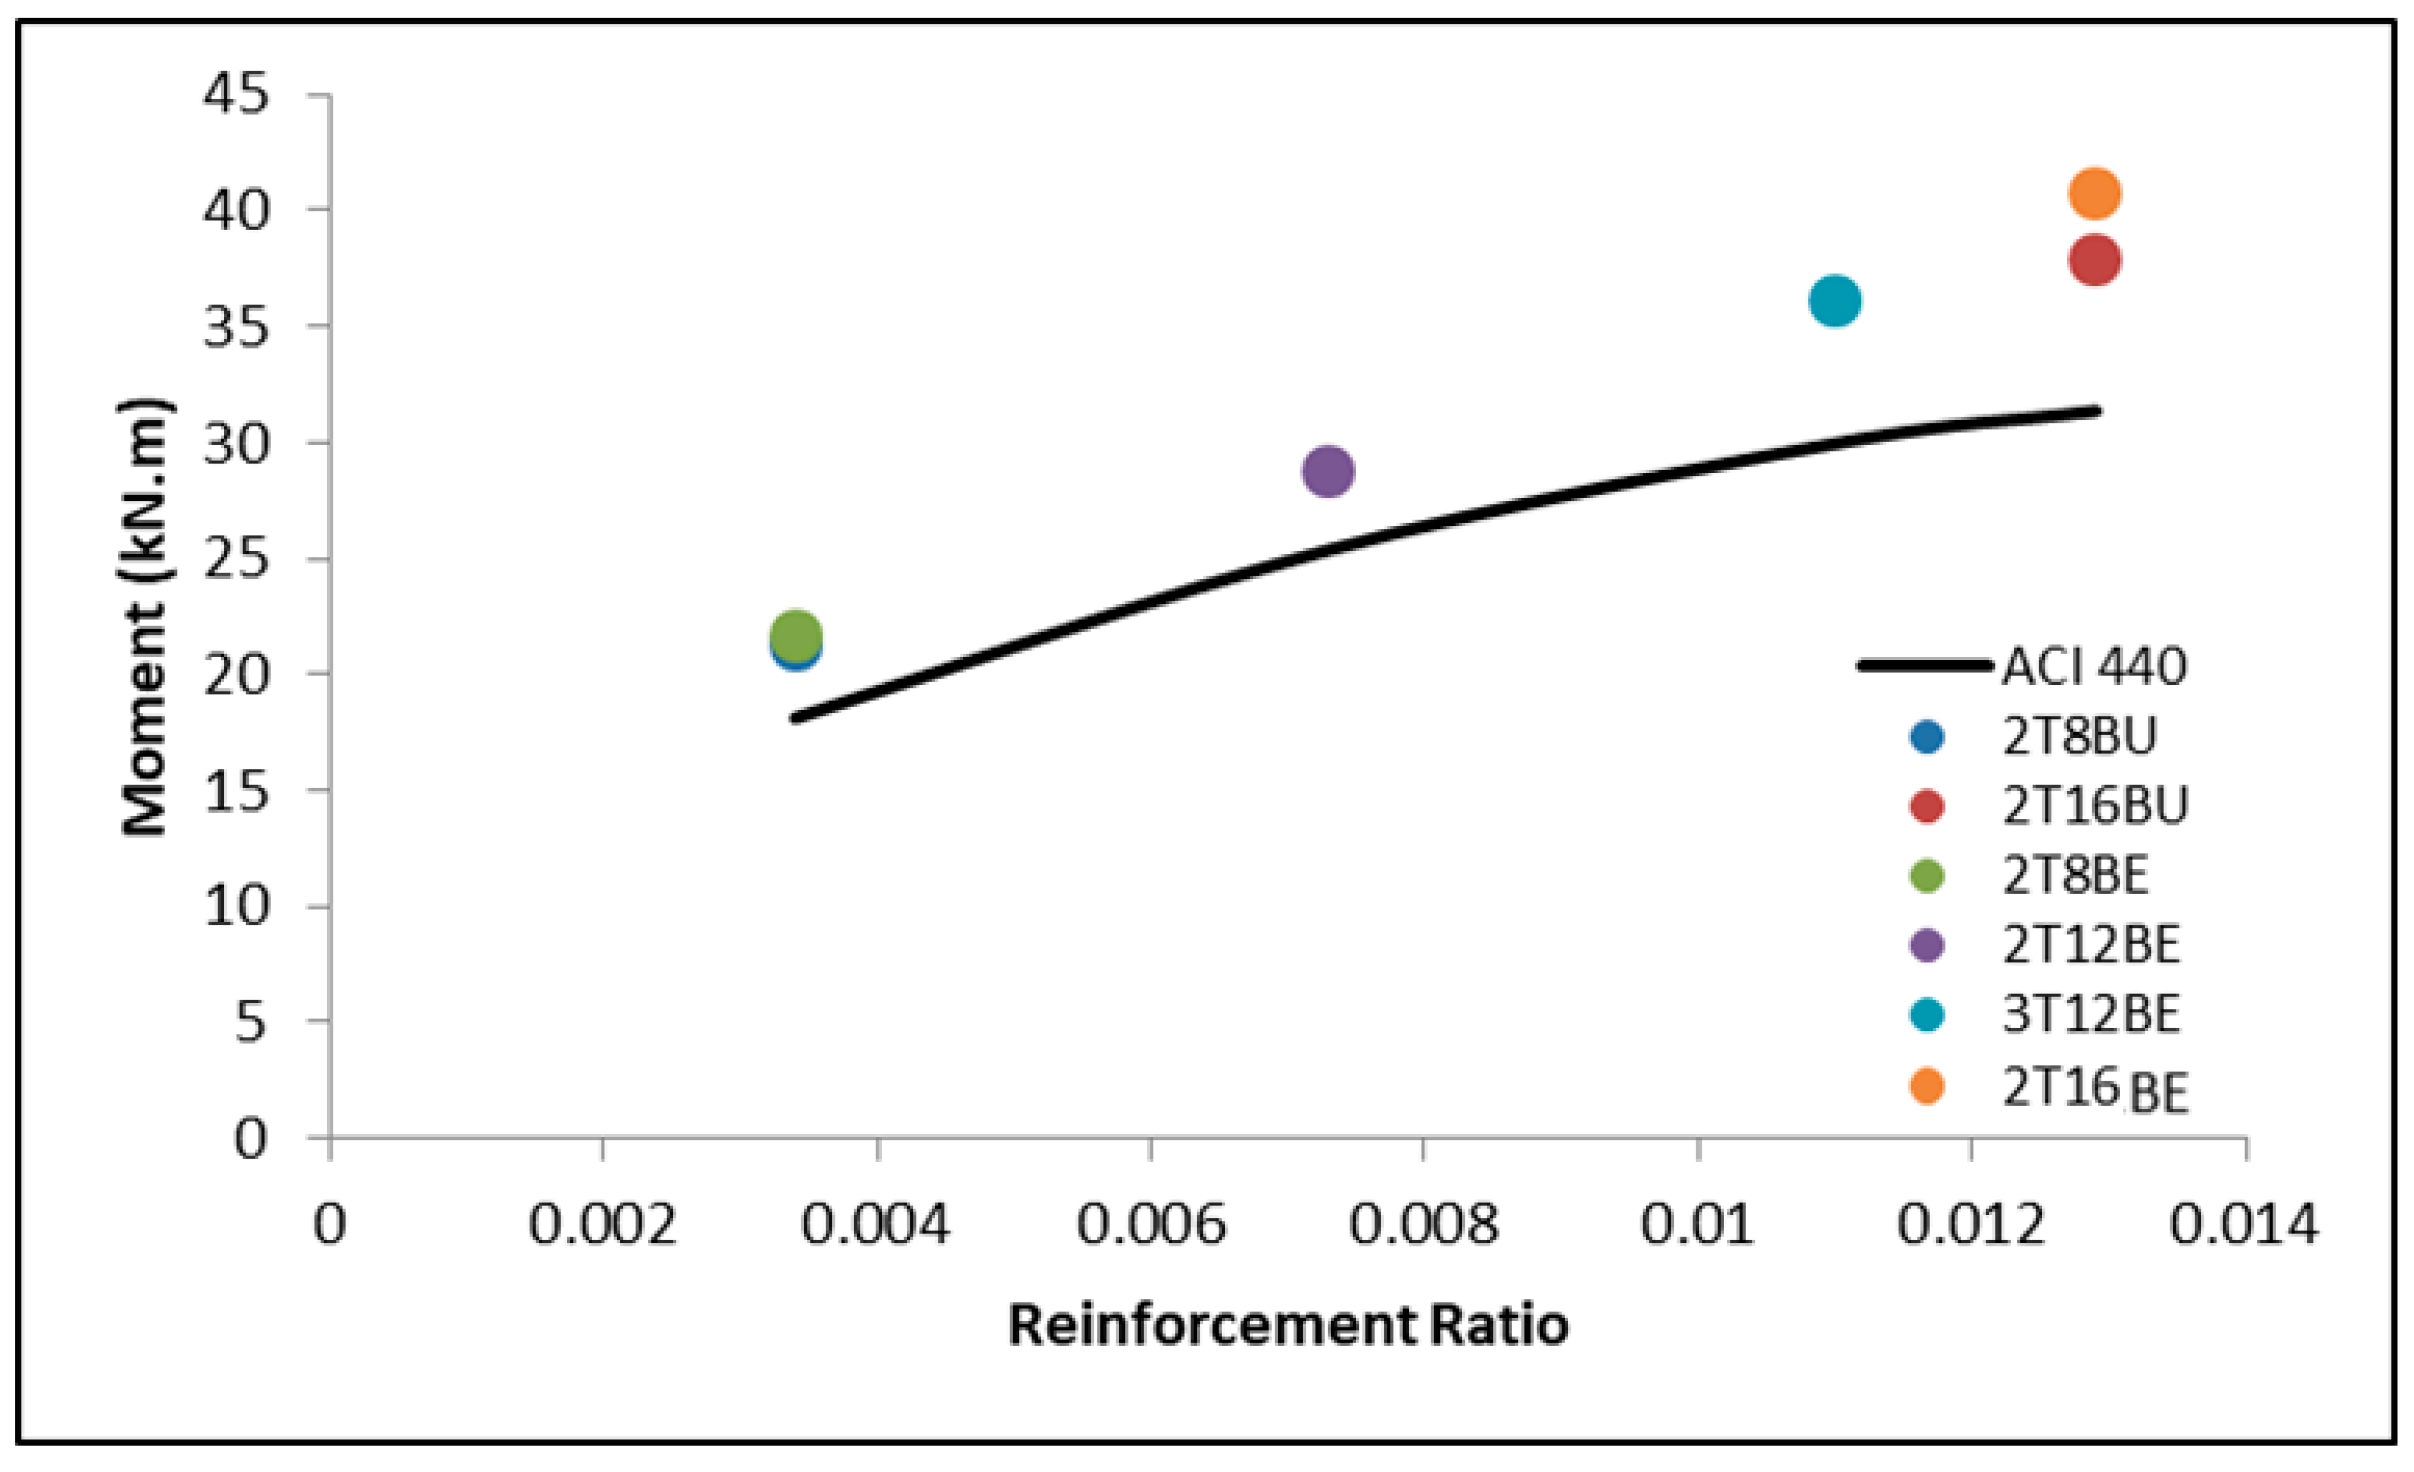
11] studied the behavior of FRP reinforced concrete beams subjected static loading. The study indicated that an increase in reinforcement ratio led to a nonlinear increase in the flexural capacity of FRP reinforced concrete beams. Another study that attempted to investigate the effect of reinforcement ratio on the behavior of FRP reinforced concrete beams was conducted by Fam and Tomlinson [
12]. In the study, nine FRP reinforced beams (reinforcement ratio ranging from 0.28 to 1.60) were tested. The results indicate that ultimate and service loads were proportionally affected by the reinforcement ratio.
Although BFRP research in itself is scarce, research on the effect of exposure on BFRP bars is more infrequent. Only few researchers investigated the effects of exposure on the flexural behavior of BFRP reinforced concrete (RC) beams and on the bond behavior between BFRP bars and surrounding concrete. The studies had different areas of focus; while some examined the mechanical behavior of exposed FRP bars, others investigated the effects of exposure on FRP RC beams [
16]. The type of exposure tested also varied; alkaline solutions exposure [
17,
18,
19,
20], temperature exposure [
21,
22,
23,
24,
25], and saline solutions exposure [
26] were all investigated.
Wu et al. [
17] studied the effects of alkaline solution, acid solution, and salt solution on the tensile strength of BFRP bars. The degradation of BFRP bars due to such exposure was monitored using scanning electronic microscopy (SEM). The results show that the acid solution and the salt solution had lesser impact on the durability of BFRP bars than the alkaline solution [
17]. Another study that examined the impact of alkali solution, combined with high temperatures, on the durability of FRP bars was conducted by Sim et al. [
18]. The results of the study indicate that, after seven-day exposure, BFRP and GFRP bars lost 50% of their volume and strength. CFRP, however, lost only 13% of its strength and volume during the same exposure period. The study also showed that the fiber and resin type played a big role in resisting degradation. Wang et al. [
19] also investigated the impact of alkali solution on the durability of BFRP [
19]. They found that, after three months of exposure to alkali solution, the strength BFRP decreased by 40% while the modulus of elasticity remained unaffected. The results also indicate that BFRP bars had lower degradation than the basalt fiber with no resin protection [
19].
One of the studies that focused on the impact exposure on the bond behavior rather than on the mechanical properties was conducted by Altalmas et al. [
26]. They investigated the impact of accelerated aging conditions on the bond degradation of BFRP bars compared with GFRP bars. The bars were exposed to harsh environments such as alkaline, acid, and saline solutions. The results show that, for all exposure types, sand coated BFRP bars possessed higher bond strengths than the ribbed GFRP did. Slippage resistance and bond strength were controlled by surface texture. The study concluded that, generally, sand coated bars showed more resistance than ribbed FRP bars [
26].
In general, there are considerable gaps in knowledge regarding topics related to BFRP, especially the impact of exposure on BFRP bars. This study aimed to add to the body of knowledge in the area of exposure impact on the bond strength and flexural behavior of BFRP reinforced concrete beams. The uniqueness of this study is attributed to the uniqueness of the exposure and tests used to measure such exposure. The study enveloped three unique parameters; BFRP behavior is, in itself, the frontier of FRP research, the exposure to duplicate practical site-like exposure, and the effect of exposure, in general, on the serviceability and flexural behavior of BFRP reinforced concrete beams has never been investigated before. The BFRP RC beams were studied as a whole system to see the impact of the exposure on the serviceability of the beams including cracks width and propagation and the bond response.
The parameters of the study were reinforcement ratio, exposure, and beam detailing. The studied properties were flexural capacity, deflection and cracking behavior, bond behavior, and strain of reinforcement and concrete. Experimental results of moments and bond dependent coefficient (
kb) were utilized to assess the design equations of the ACI 440.1R code. To test the impact of exposure on under-reinforced BFRP RC beams, parametric study was conducted using Finite Element Modeling (FEM) software (ABAQUS) [
27]. Other research has investigated the behavior of FRP reinforced concrete using FEM [
28,
29,
30,
31] but little research has been dedicated to investigating the effects of exposure on under-reinforced BFRP RC beams. Some of the results of this study are briefly analyzed and reported in [
32]. The reported results, however, are limited to four beams and the analysis is limited to the flexural behavior.
4. Finite Element Modeling (FEM)
Since the impact of exposure on over-reinforced BFRP RC beams was investigated experimentally in this paper, the main goal of the FE study was to investigate the effect of exposure on the strength and ductility of under-reinforced BFRP RC beams. As a result, a parametric study was conducted to investigate the effect of reduction in tensile strength of BFRP for under-reinforced beams (2T6B). The simulation was performed using commercial finite element software ABAQUS (Dassault Systèmes, RI, USA). To validate the model, four beams (2T8BU, 2T16BU, 2T12BE, and 3T12BE) were simulated and then validated with the experimental results. The mixture of unexposed and exposed beams simulation was done for control purposes. The geometric and materials nonlinearities were captured by incorporating the nonlinear geometry (*NLGEOM) formulation in the general static step in ABAQUS. In addition, analysis of all full three-dimensional beams was carried out under displacement-controlled loading mode. Post-processing included graphing moment–displacement responses; displacement values were obtained from maximum displacement at mid-span of the beams and load values were obtained from the summation of the reaction forces of the two supports.
4.1. Material Properties
The inelastic response of concrete was simulated using Concrete Damaged Plasticity (CDP) model incorporated in the software that applies the yielding equation proposed by Lubliner et al. [
35] and later revised by Lee and Fenves [
36]. Details of the parameters incorporated in the CDP model are shown in
Table 6 as provided in ABAQUS user’s manual [
37].
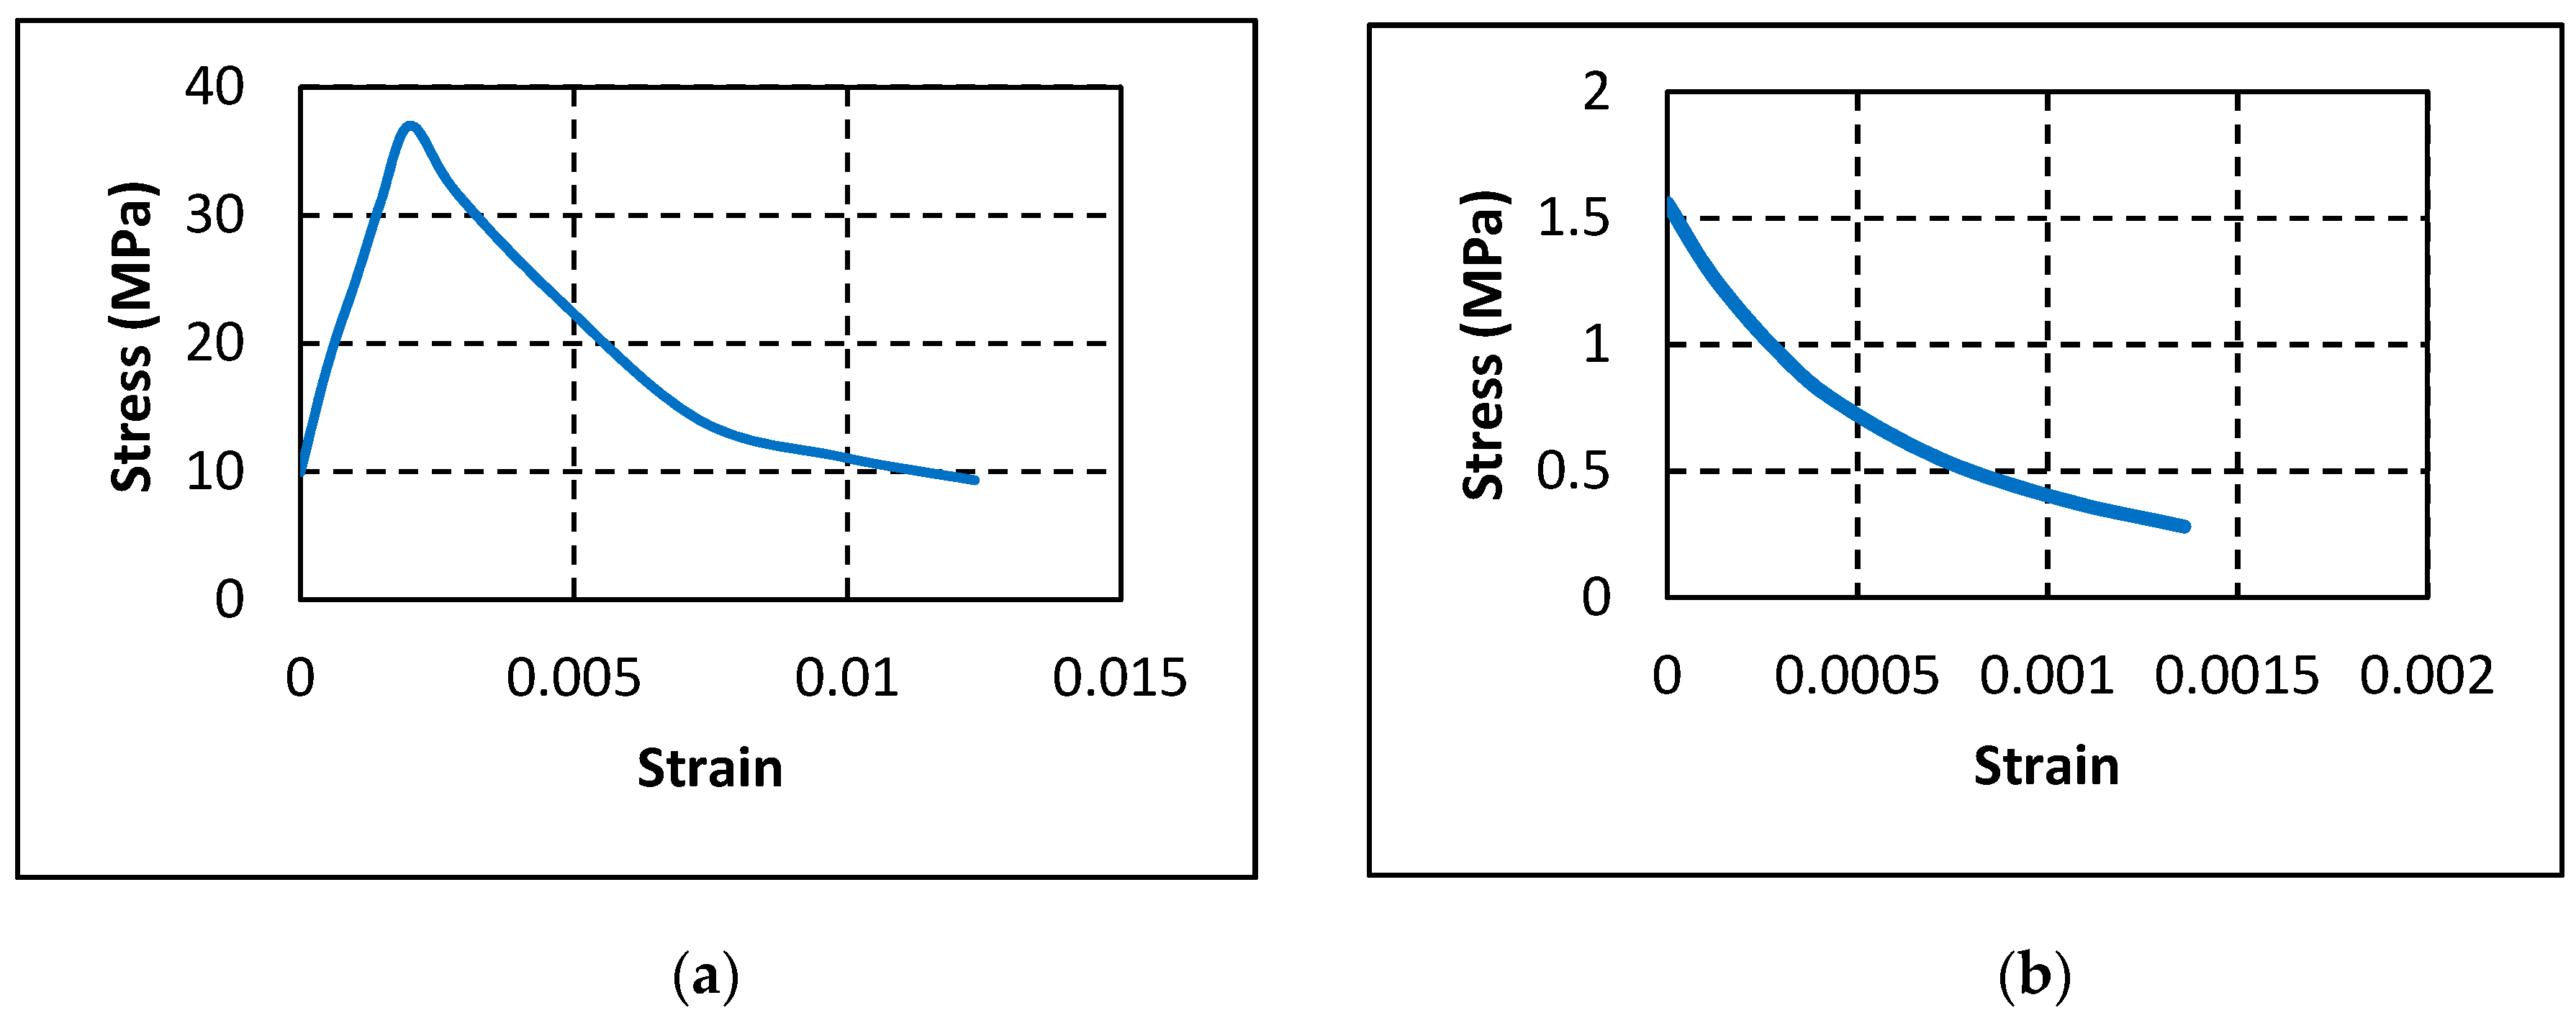
Figure 14a,b show the compressive and tensile stress–strain relationships of concrete as obtained from the experimental test results, respectively.
Steel used in top reinforcement and stirrups was defined to have an elastic modulus of 200 GPa and Poisson’s ratio of 0.3. The yield stress was defined to be 460 MPa. Unlike the ductile behavior of steel, BFRP bars have linear stress–strain behavior until rupture. To simulate this behavior in ABAQUS, the elastic modulus and Poisson’s ratio were defined as 49 GPa and 0.2, respectively.
4.2. Beam Geometry and Mesh Sensitivity
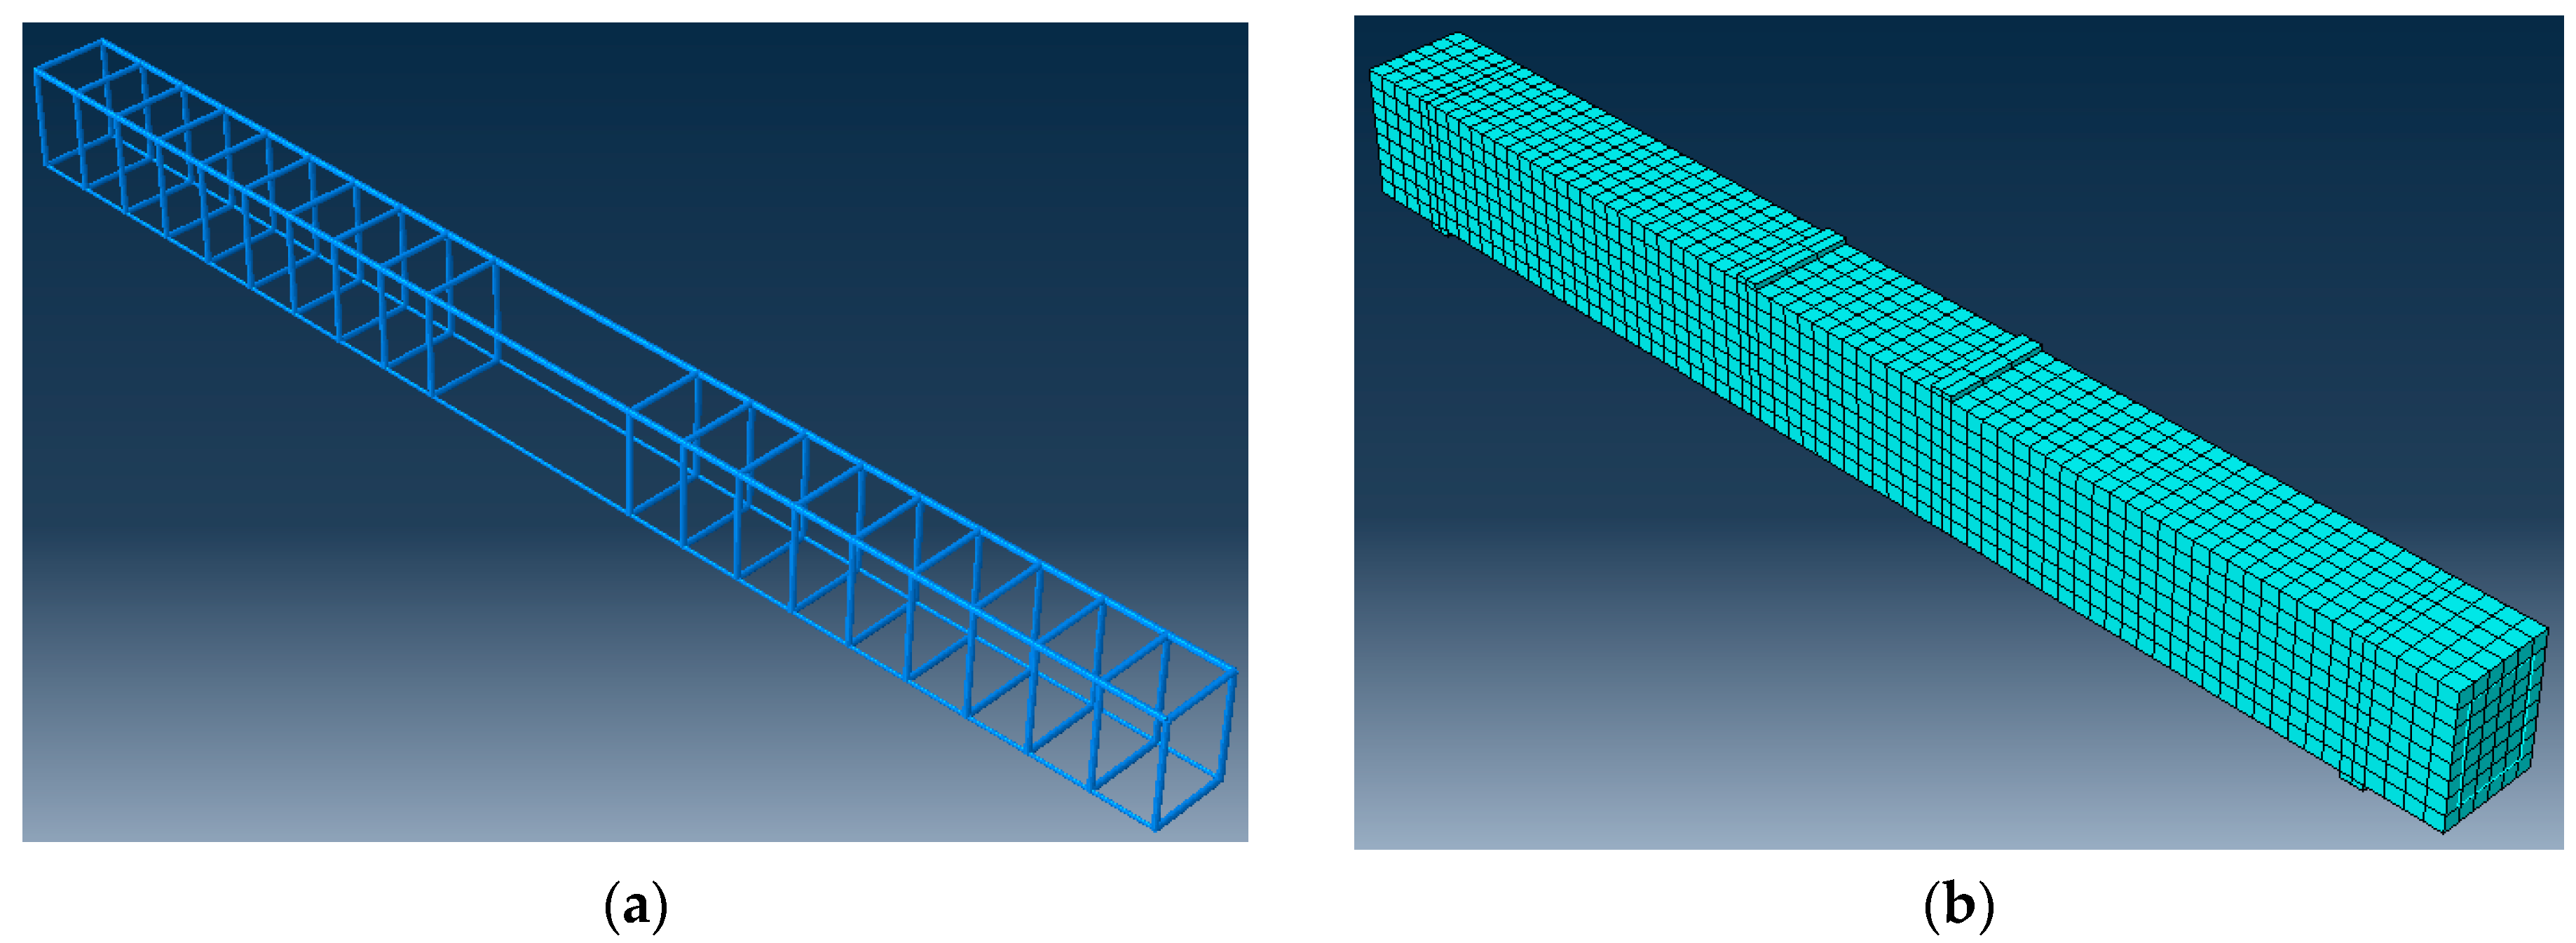
Concrete was modeled as eight-node linear 3D solid element with reduced integration (C3D8R). Steel and BFRP were modeled as two-node linear 3D truss elements (T3D2) that are embedded in the concrete by introducing an embedded constraint and defining steel and BFRP bars as embedded region and concrete part as host region. A mesh size of 30 mm was chosen based on a mesh sensitivity study performed to select the optimum mesh size that simulates the experimental results with minimum computational time.
Figure 15a,b shows the reinforcement cage for a beam with 2 BFRP bars and mesh configuration, respectively.
4.3. Model Verification
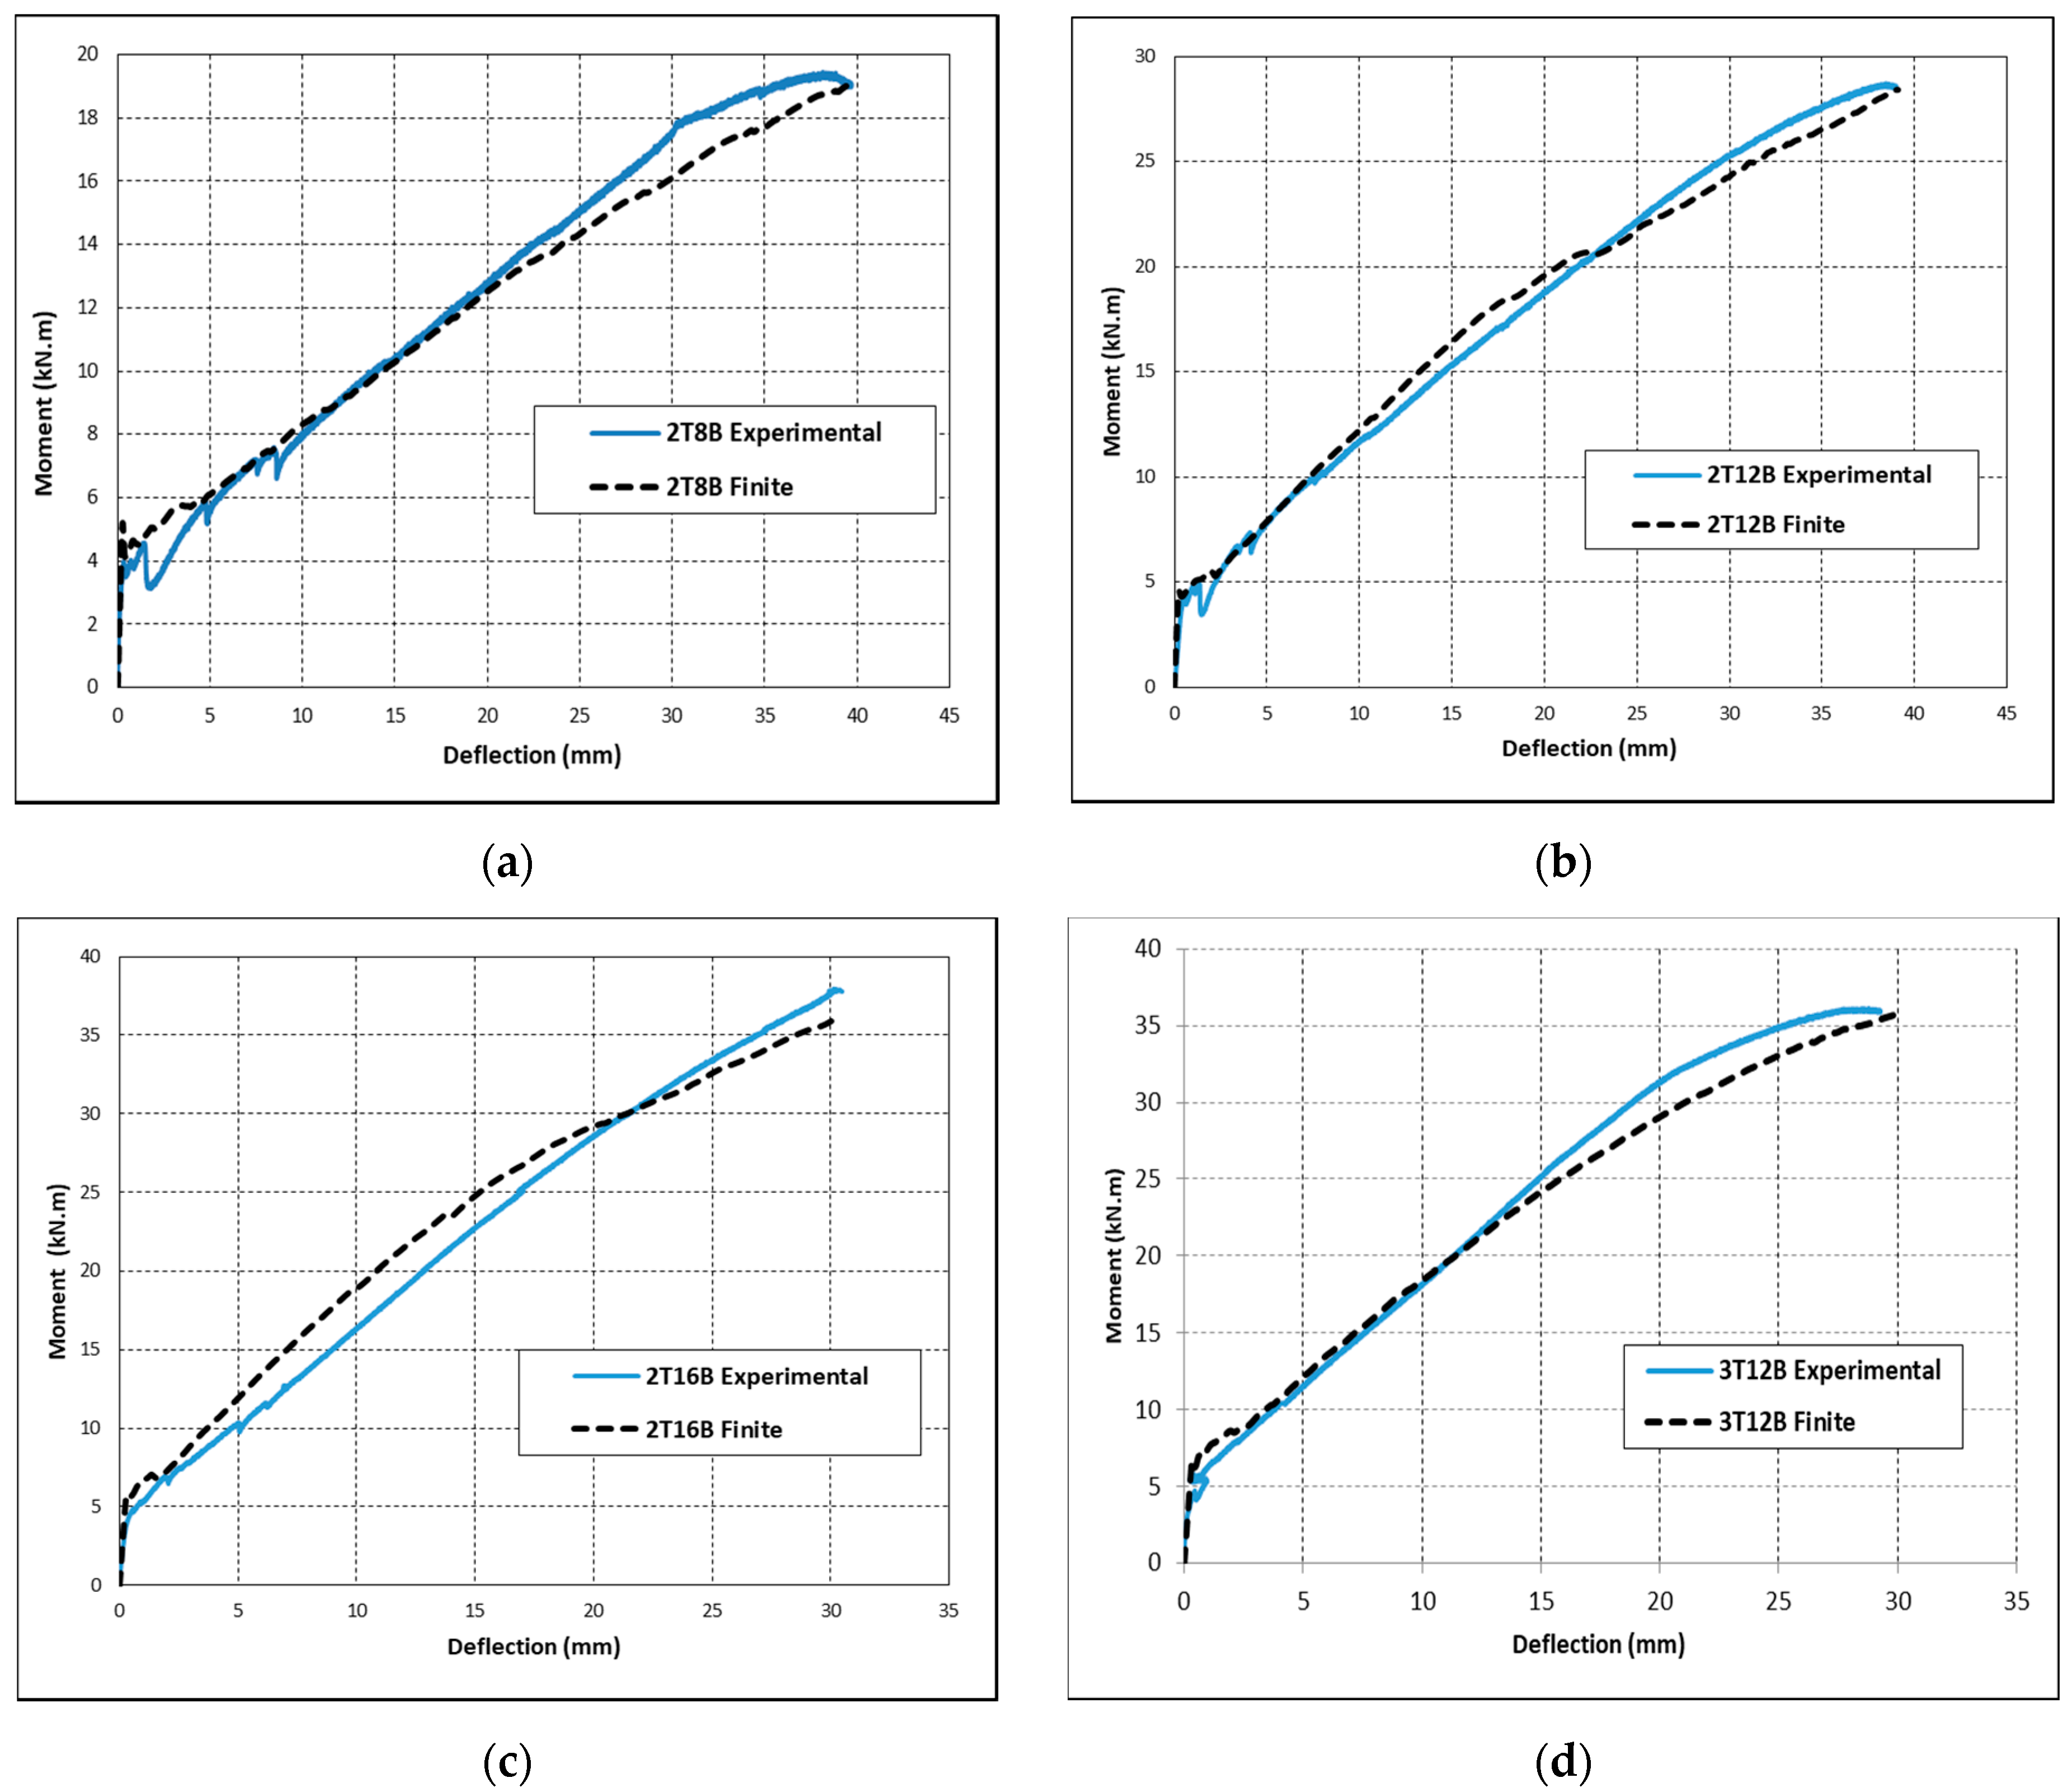
Validation of the simulated FE models was conducted by comparing moment vs. mid-span deflection responses of the FE generated curves with the experimental results.
Figure 16 shows the tested and simulated moment–displacement curves for beams 2T8B, 2T12B, 2T16B, and 3T12B.
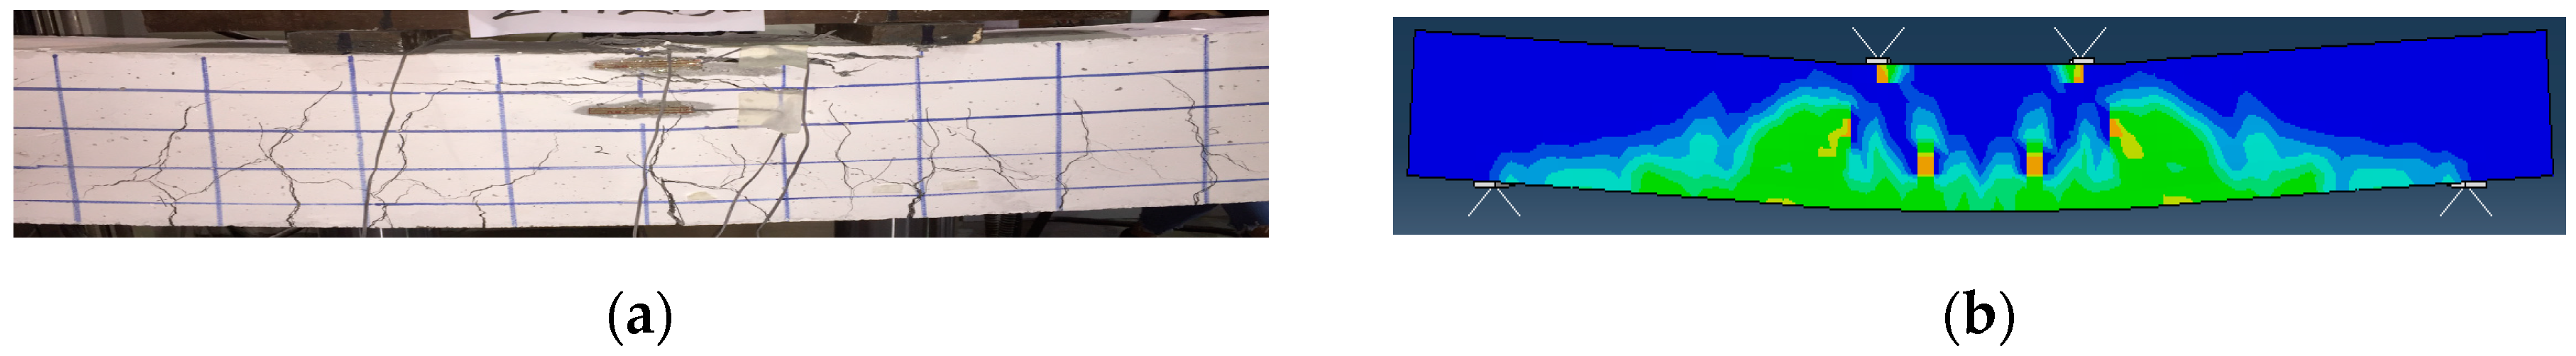
Figure 16 shows that all simulated results are in good agreement with the experimental results at all stages of loading until failure. Mainly, the moment at first crack, initial stiffness, and ultimate capacity of the beams of the FE models aligns with the experimental curves. In addition,
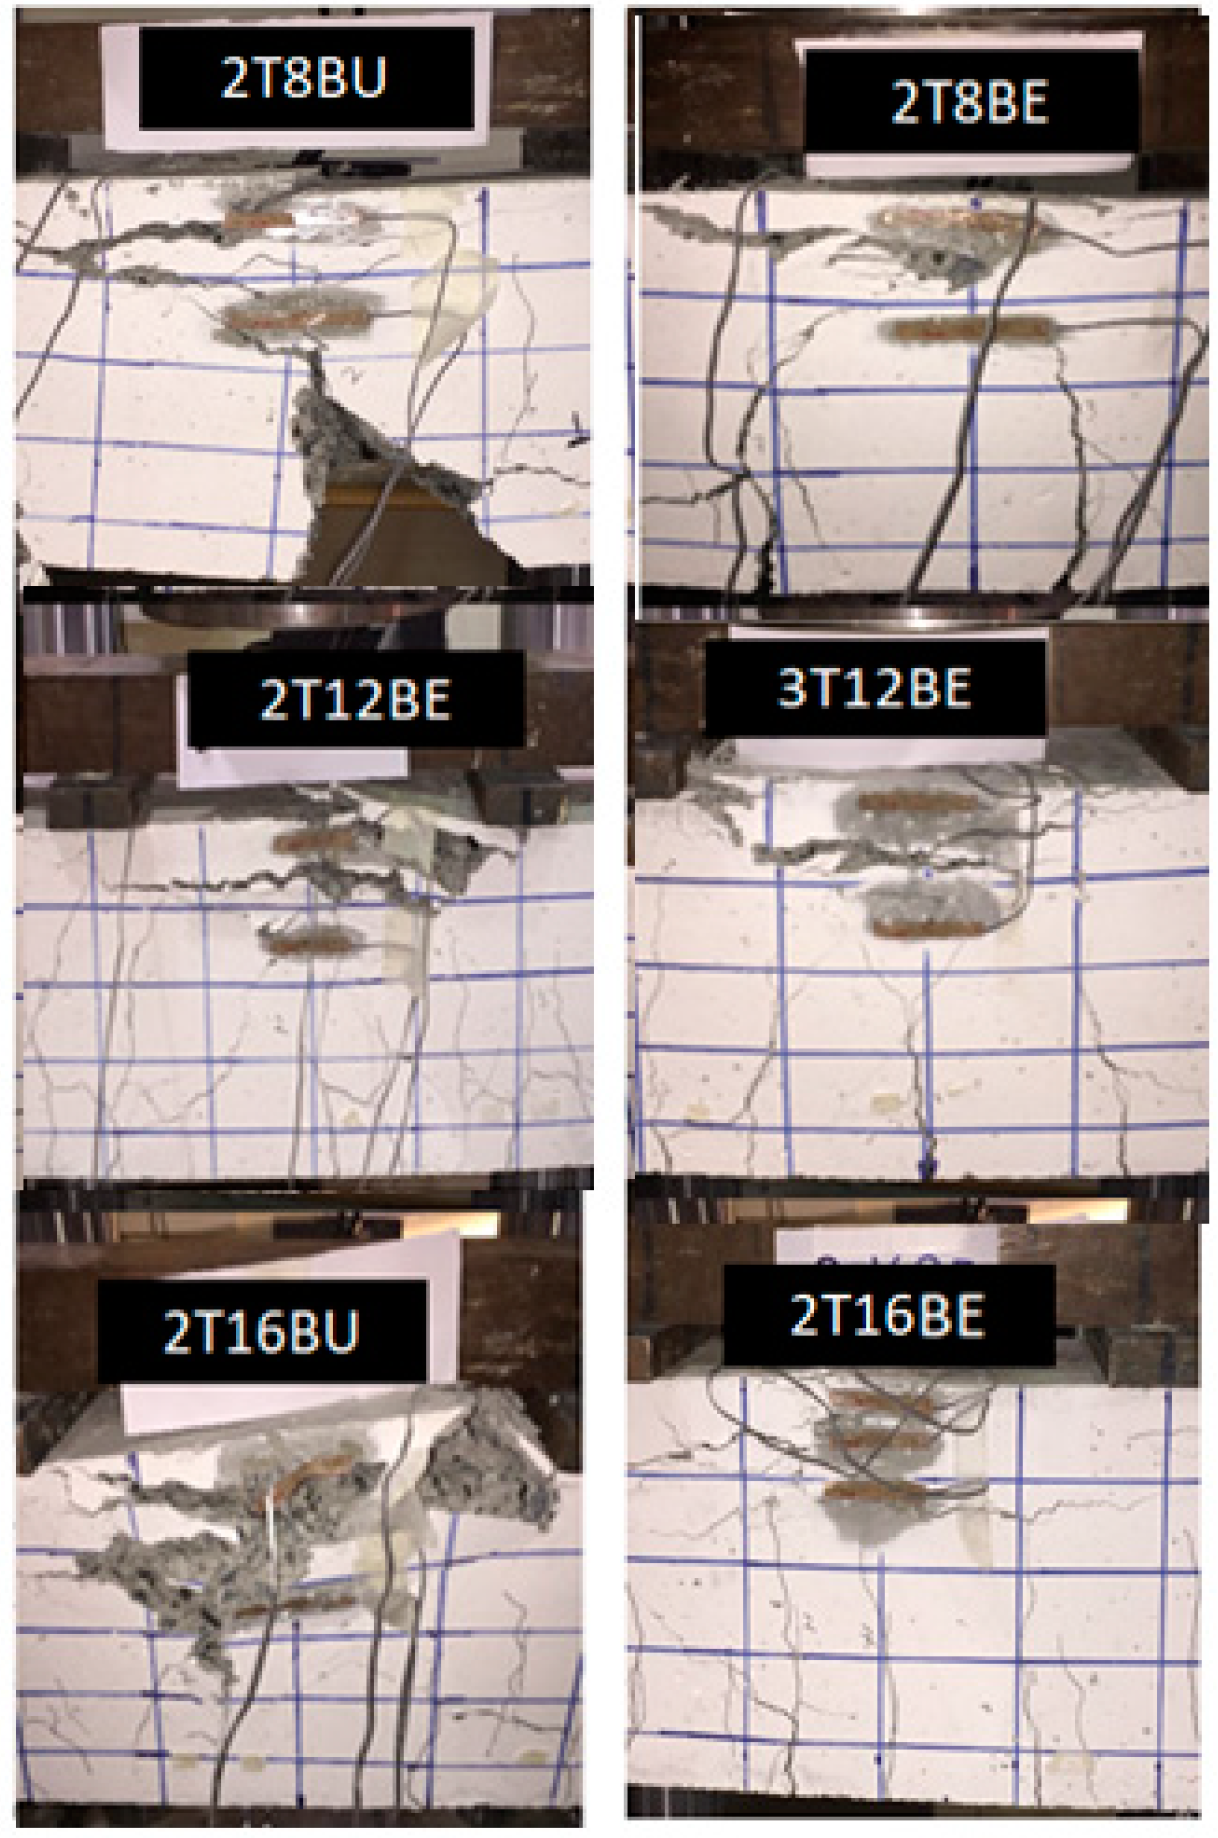
Figure 17 shows the crack pattern observed experimentally as opposed to the crack pattern shown in ABAQUS for beam 2T12B. It can be noticed in
Figure 17 that crack distribution along the beam length was accurately captured by the FE model.
The accuracy of the FE models was also validated by comparing the flexural capacity and maximum mid-span deflection of the numerical results with the experimental results.
Table 7 shows the results in terms of the experimental ultimate moment (
MEXP), numerical ultimate moment (
MFE), experimental-to-predicted ratio of ultimate moment (
MEXP/MFE), experimental maximum mid-span deflection (Δ
EXP), numerical mid-span deflection (Δ
FE), and experimental-to-predicted mid-span deflection (Δ
EXP/Δ
FE). It is clear in
Table 7 that the results of the simulated models agree with the experimental values. In particular, the average
MEXP/MFE is 1.02 with a standard deviation of 0.03 and the average Δ
EXP/Δ
FE is 1.00 with standard deviation of 0.02.
4.4. Parametric Study
The verified models were utilized to carry out the parametric studies for the reduction of tensile strength in on 2T6B beam. The objective of the parametric study was to simulate the effect of exposure of BFRP bars on the capacity and ductility of under-reinforced BFRP RC beams. The impact of exposure on over-reinforced beams does not affect the flexural behavior of beams; it only affects the serviceability behavior of said beams. However, in under-reinforced beams, the impact of exposure (reduction in tensile strength) does affect the flexural behavior of the beam. Therefore, the tensile strength of the under-reinforced beam 2T6B was reduced by 10%, 20%, and 30% to show the impact of potential exposure of these beams.
Table 8 shows the values of the ultimate moment (
M) and maximum mid-span deflection (Δ) obtained from the numerical models for all reduction groups.
Effect of Reduction in the Tensile Strength
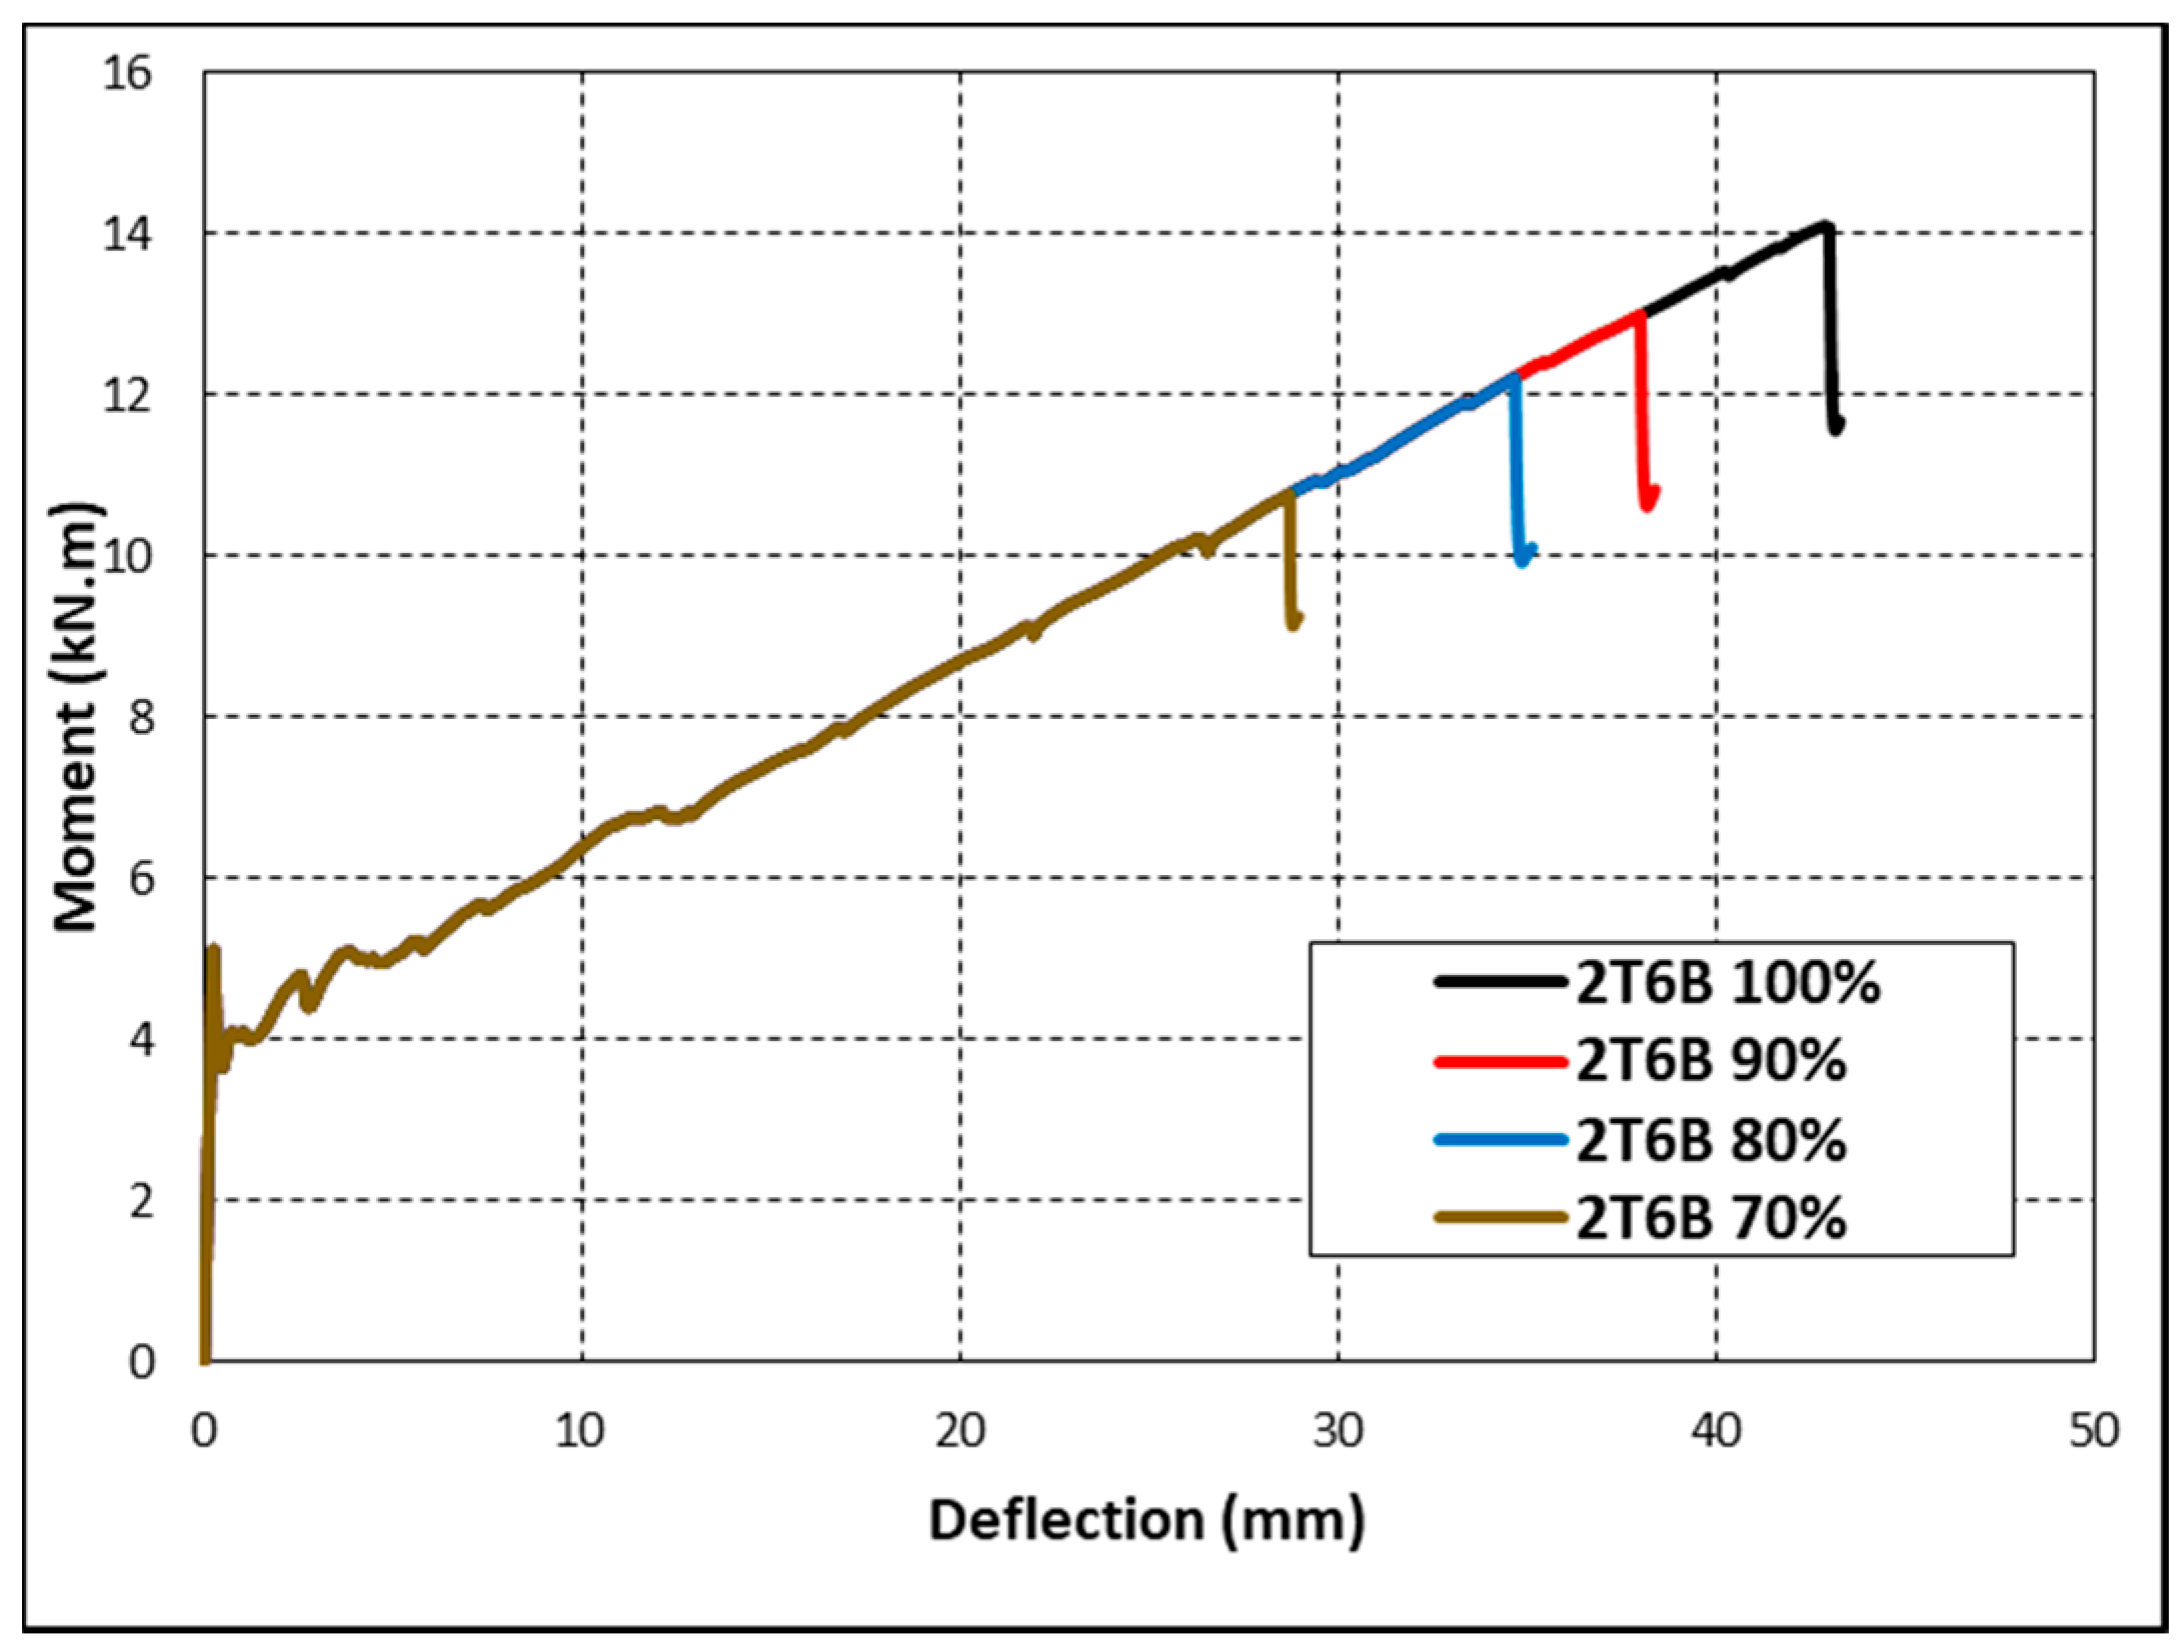
Figure 18 presents the moment versus mid-span deflection behavior of the FE models examining the effect of reduction of the tensile strength of BFRP on the flexural behavior of 2T6B (under- reinforced) beam.
Figure 18 and
Table 8 show that the reduction in tensile strength caused a disproportional decrease in the flexural capacity of the beam. A reduction of 10% reduced the beam’s capacity by 7.8%, while a reduction of 30% reduced the beam’s capacity by 23.5%. However, a clear direct proportional trend was observed between the maximum deflection and tensile strength. For example, reducing the tensile strength by 10% decreased the deflection by 11.52%. Likewise, a decrease in tensile strength by 20% and 30% decreased the deflection by 19.38% and 33.07%, respectively. The same reduction in over-reinforced beams (tested experimentally) would not have yielded similar results. In fact, it is possible that the reduction in tensile strength presented in this section would not affect the behavior of the beams studied in the previous sections at all, that is unless the over-reinforced beams become under-reinforced beams due to the tensile reduction.


