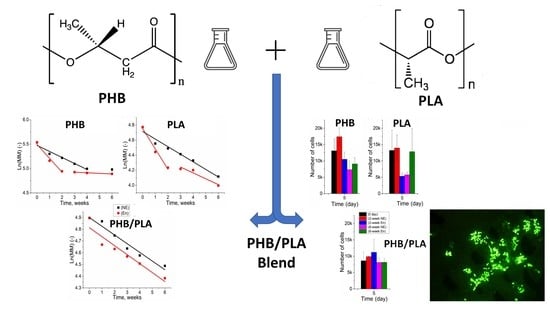
The Growth of 3T3 Fibroblasts on PHB, PLA and PHB/PLA Blend Films at Different Stages of Their Biodegradation In Vitro

 , , , ,
  ,
, 
Abstract
1. Introduction
2. Materials and Methods
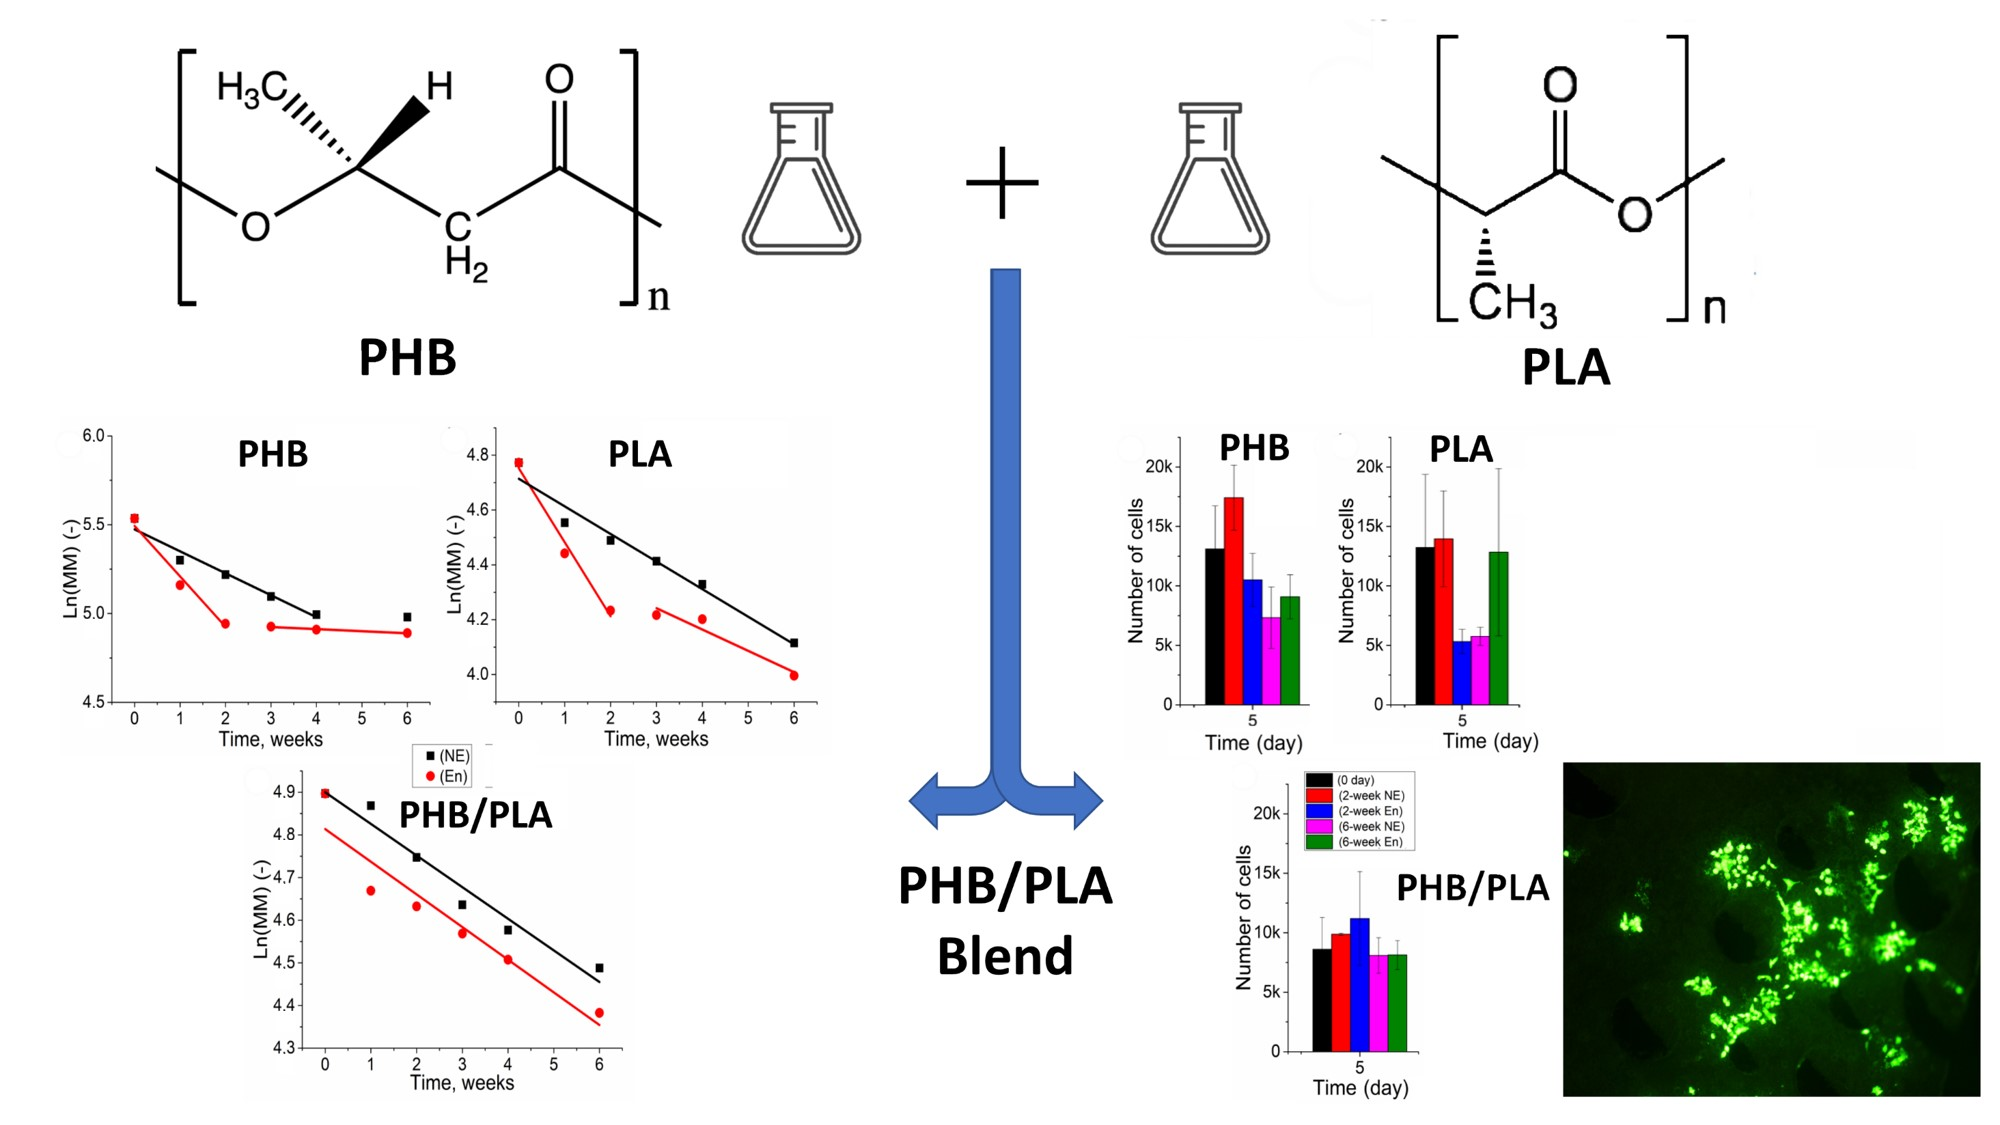
2.1. Materials
2.2. Fabrication of Polymer Films
2.3. Enzymatic and Non-Enzymatic Hydrolytic Degradation
2.4. T3 Cell Seeding Experiments
2.5. Weight Loss Analysis of Polymer Films
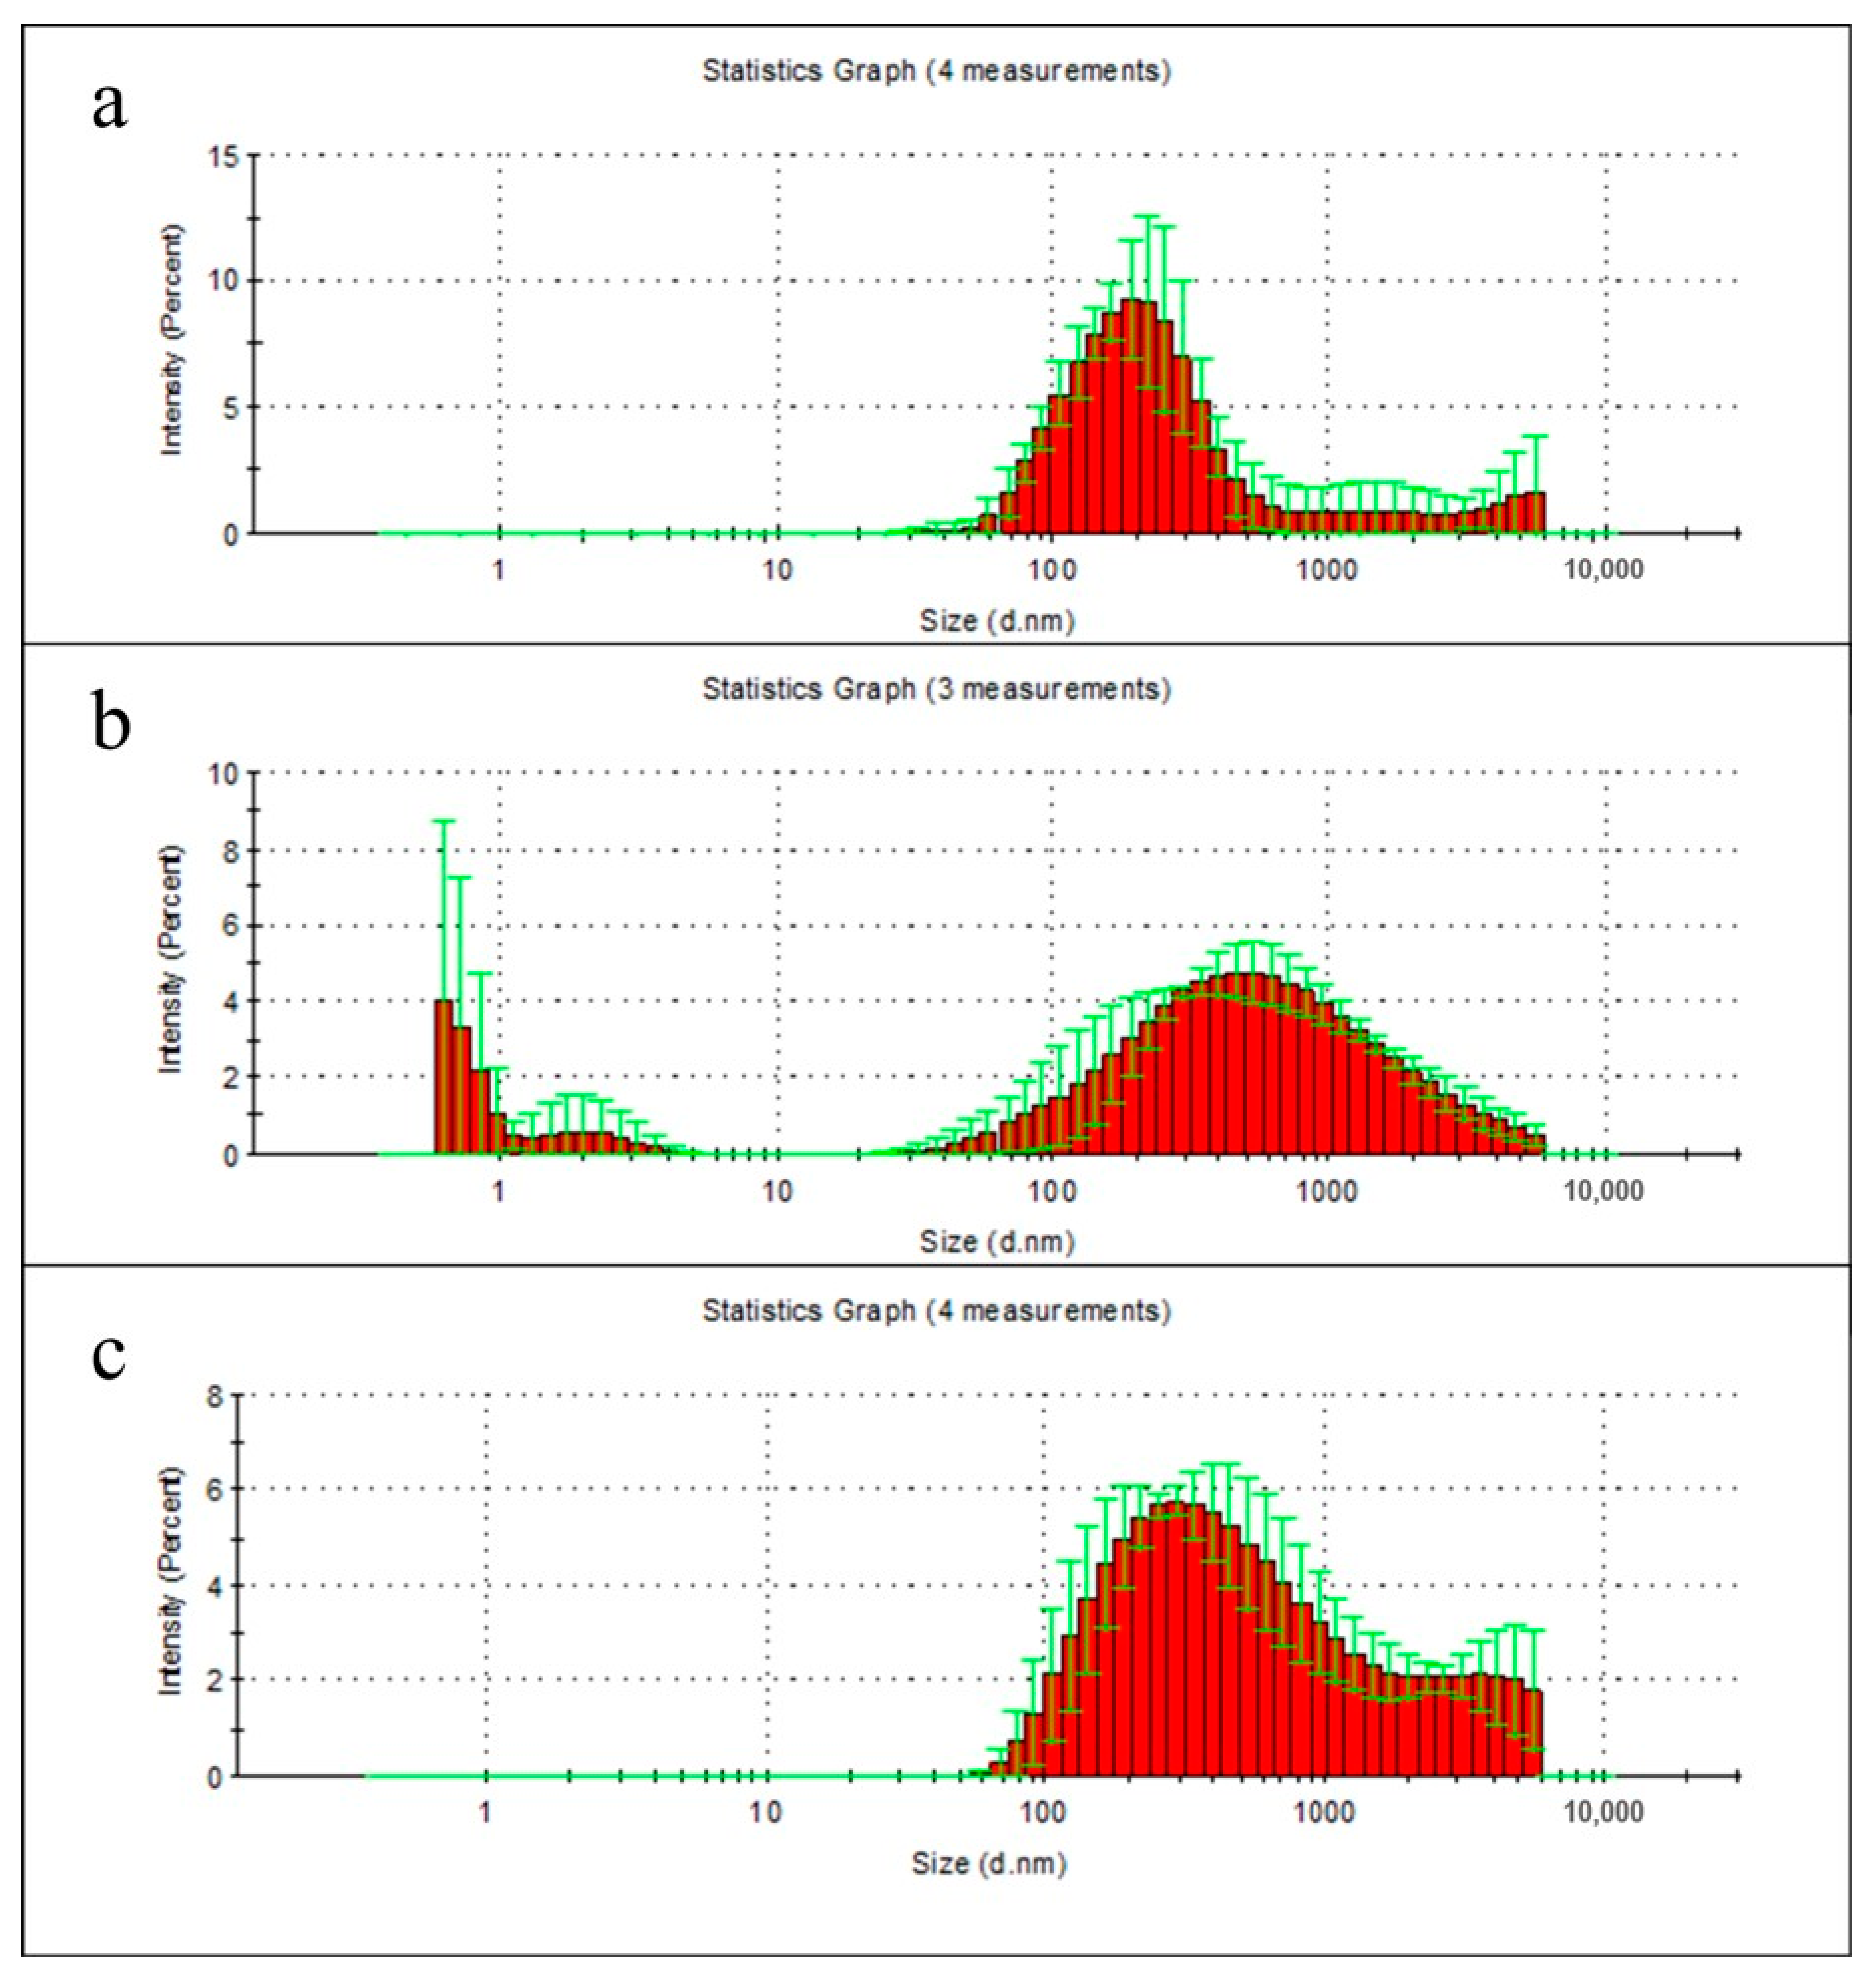
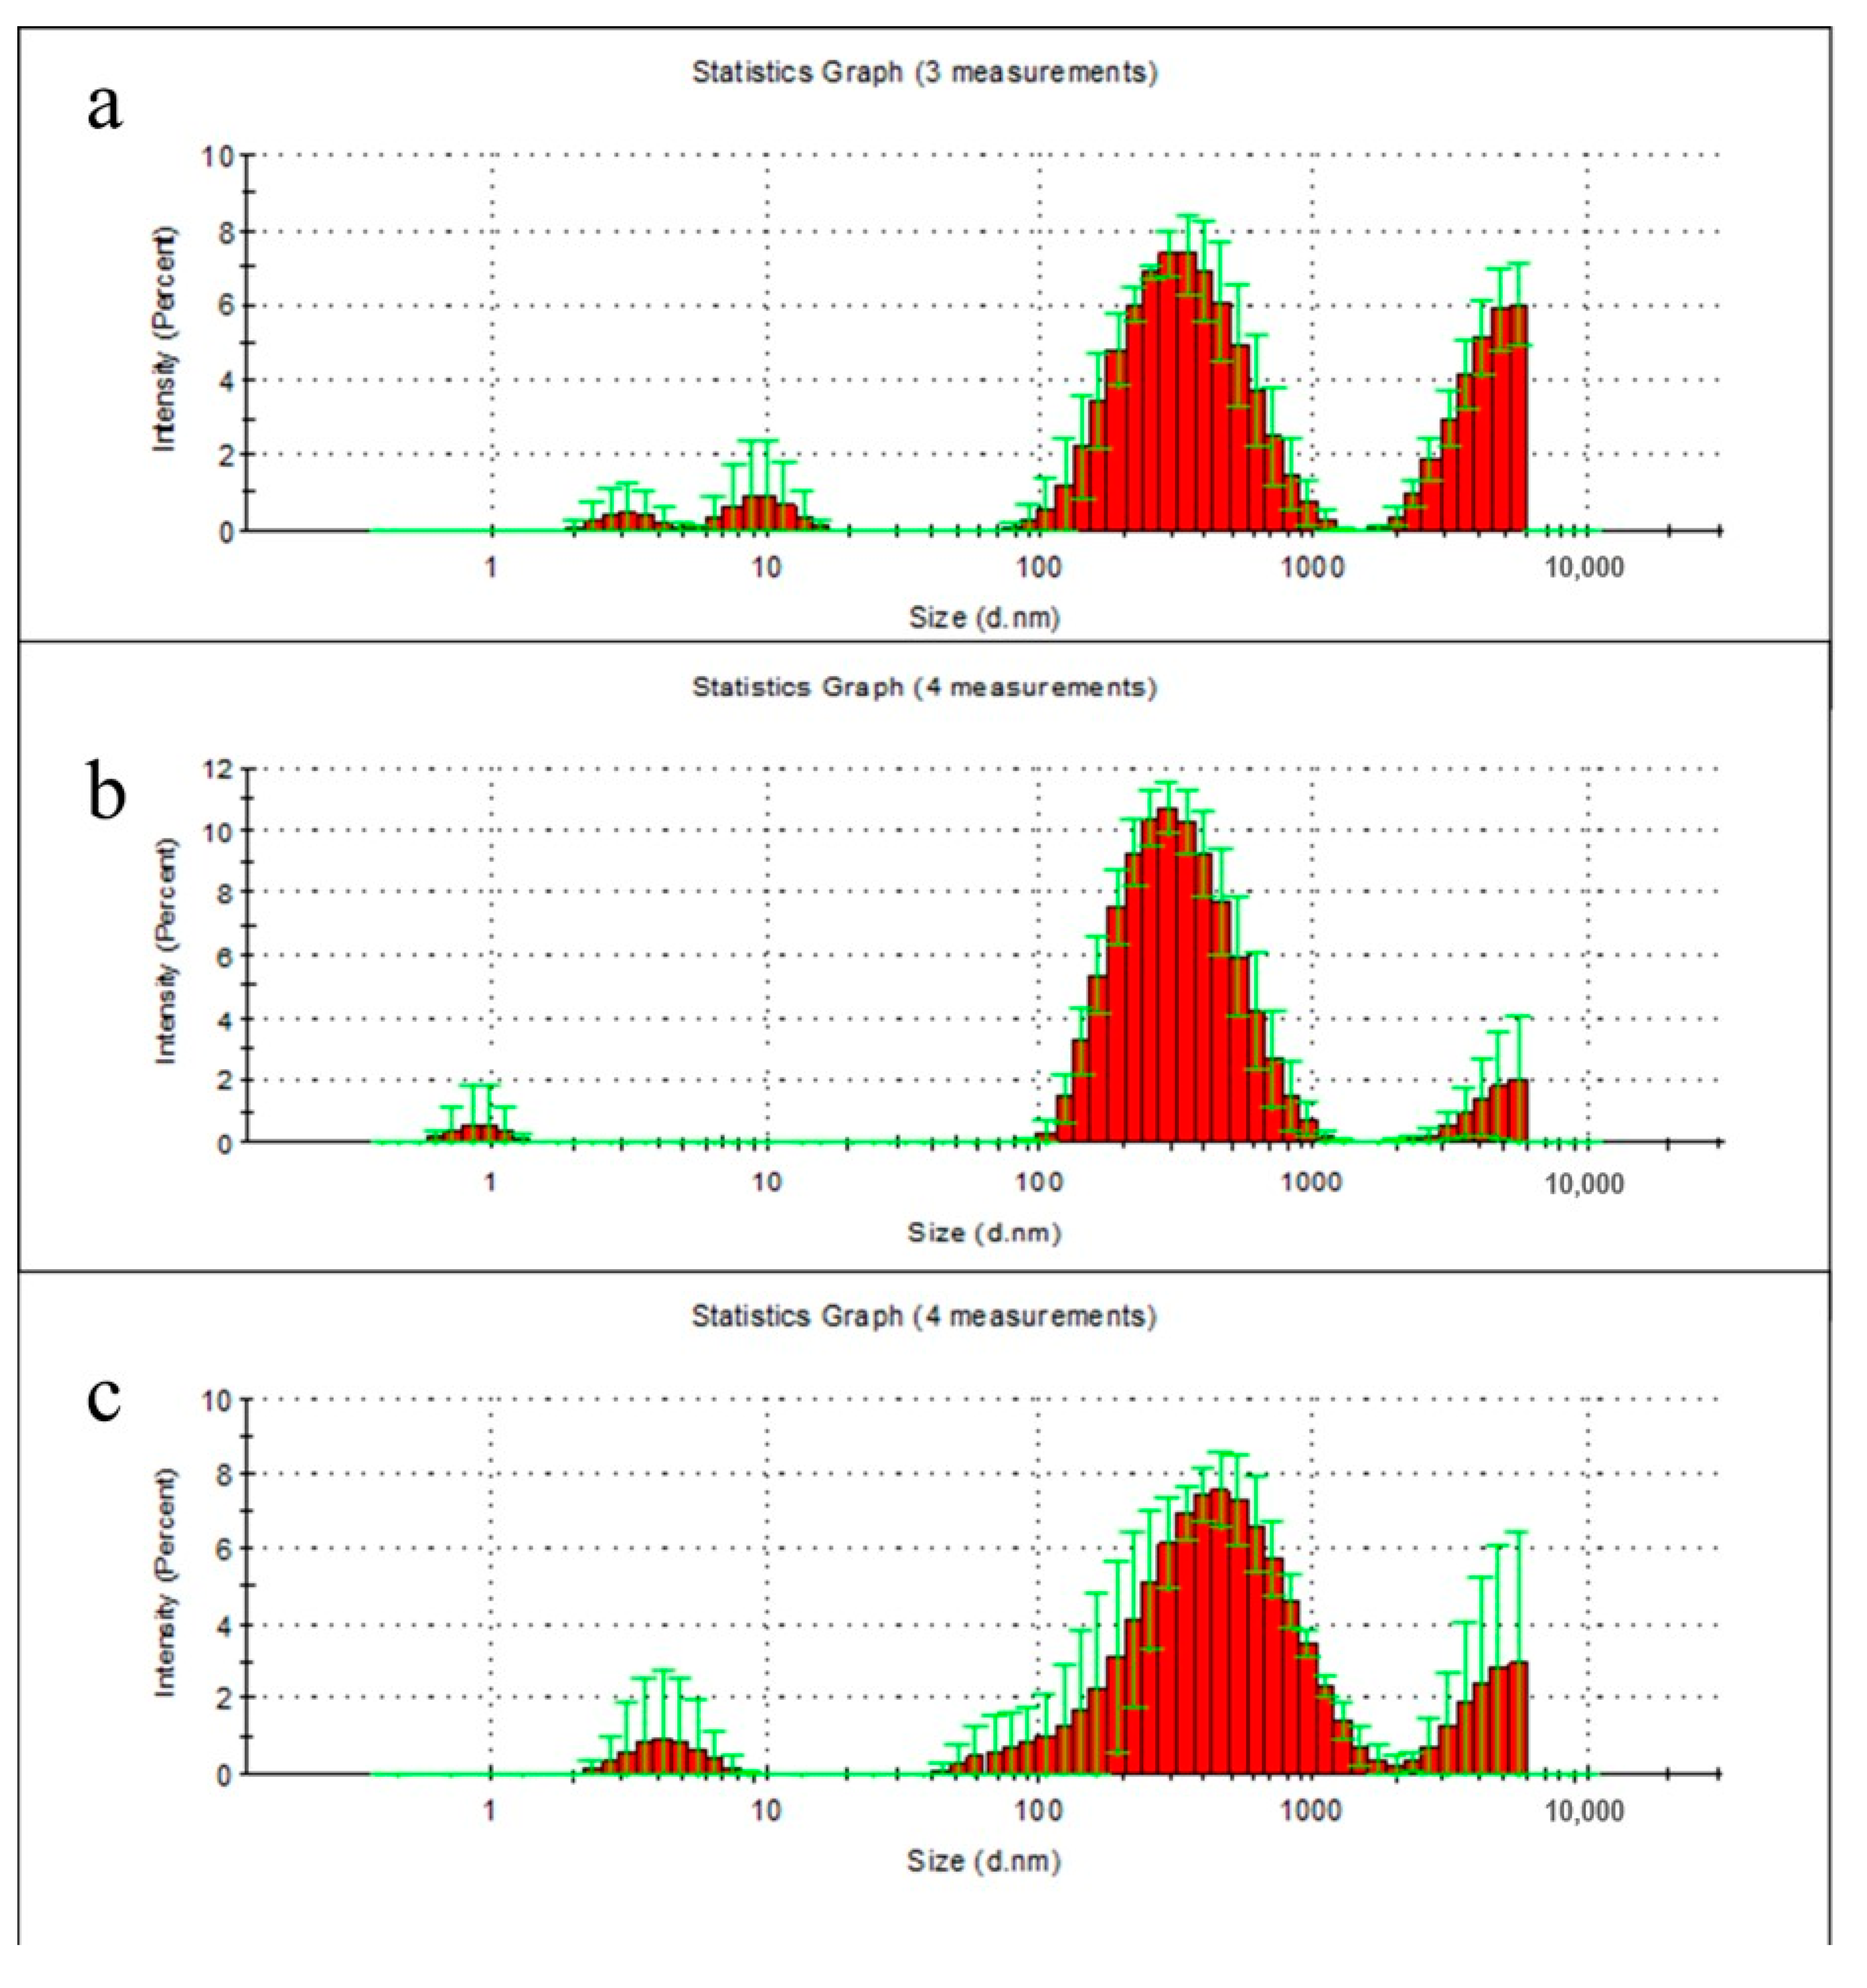
2.6. Particle Distribution Analysis of Film Degradation Products
2.7. Molecular Weight (Mw) Analysis
2.8. Differential Scanning Calorimetry (DSC)
2.9. Scanning Electron Microscopy
2.10. Cell Proliferation Assay XTT Test
2.11. Statistical Analysis
3. Results
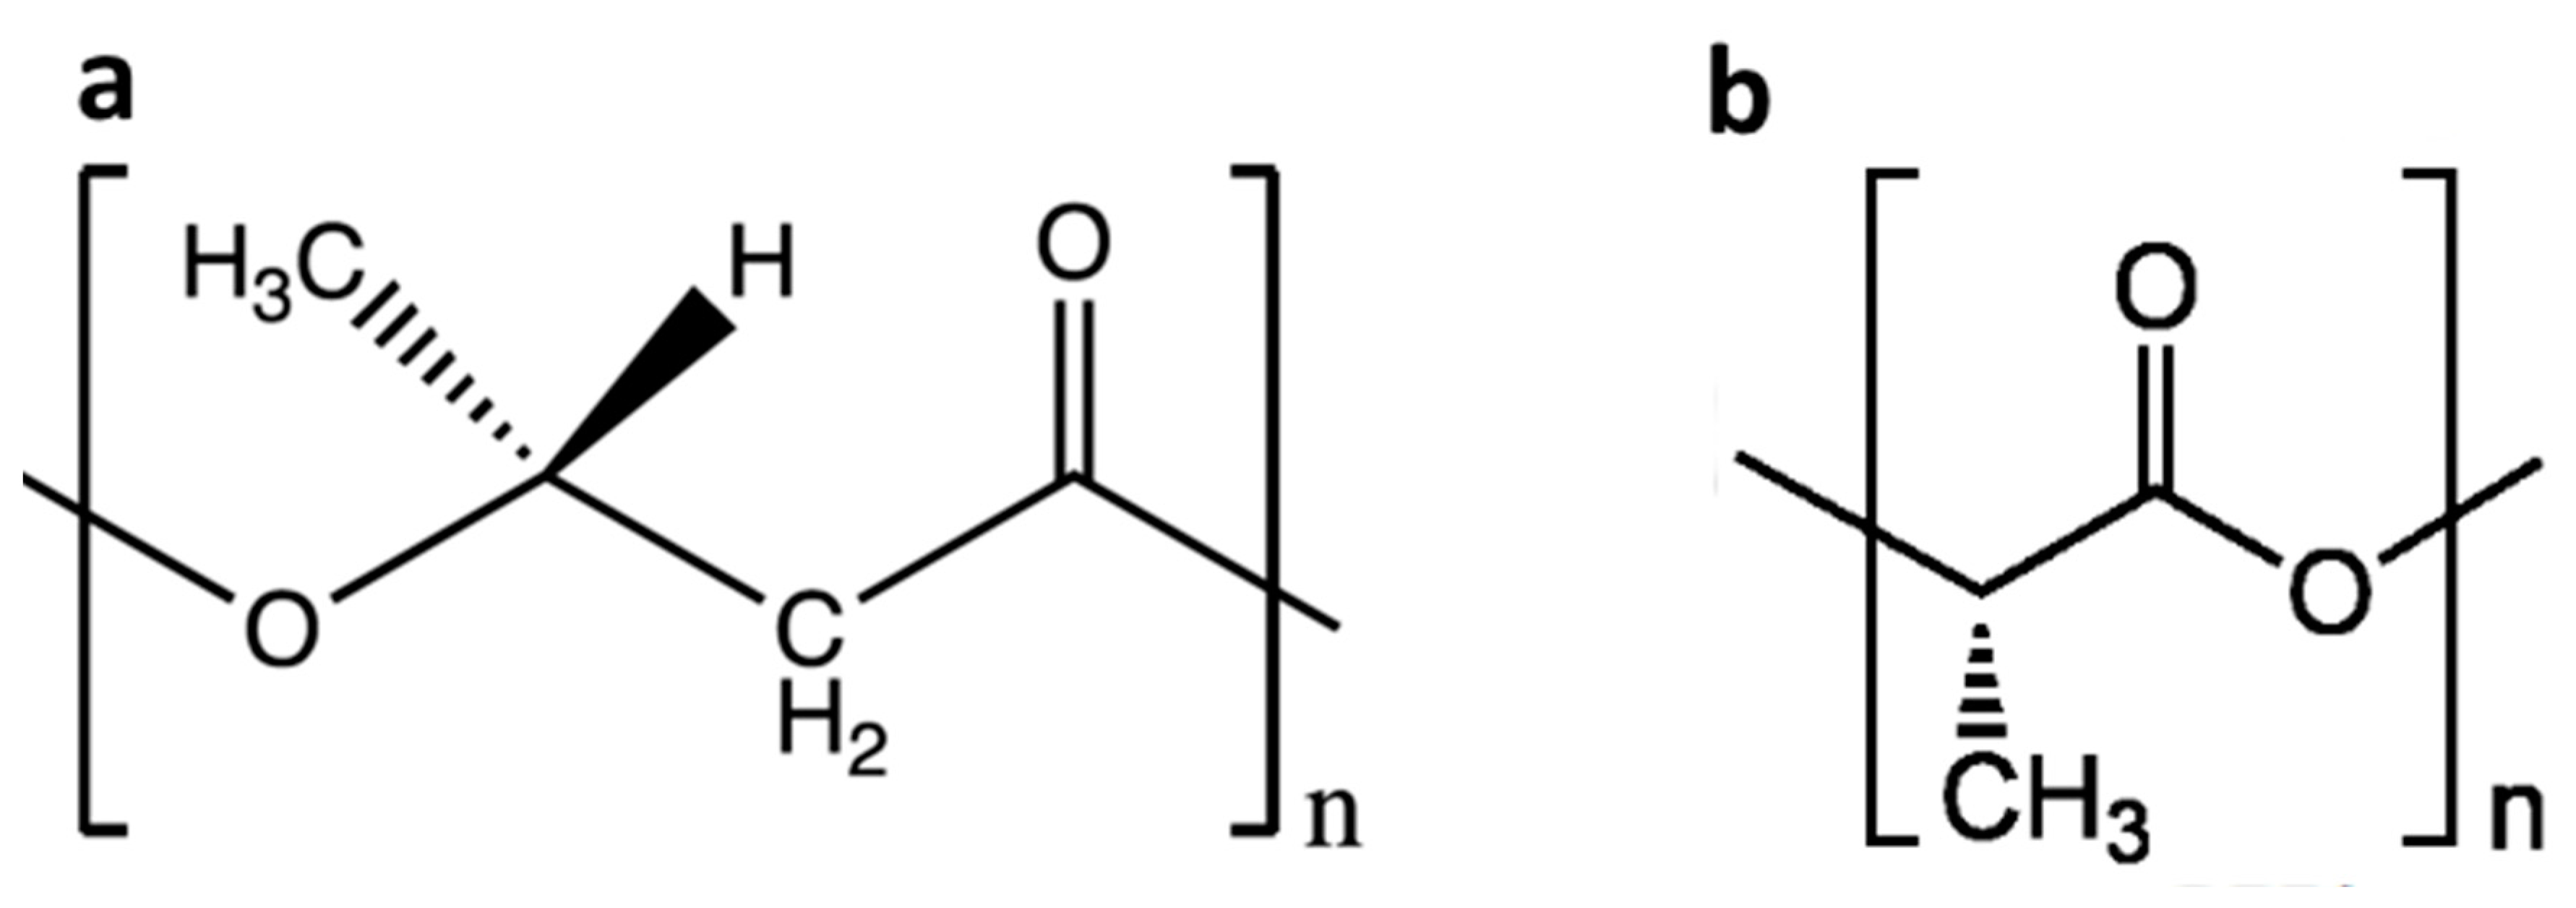
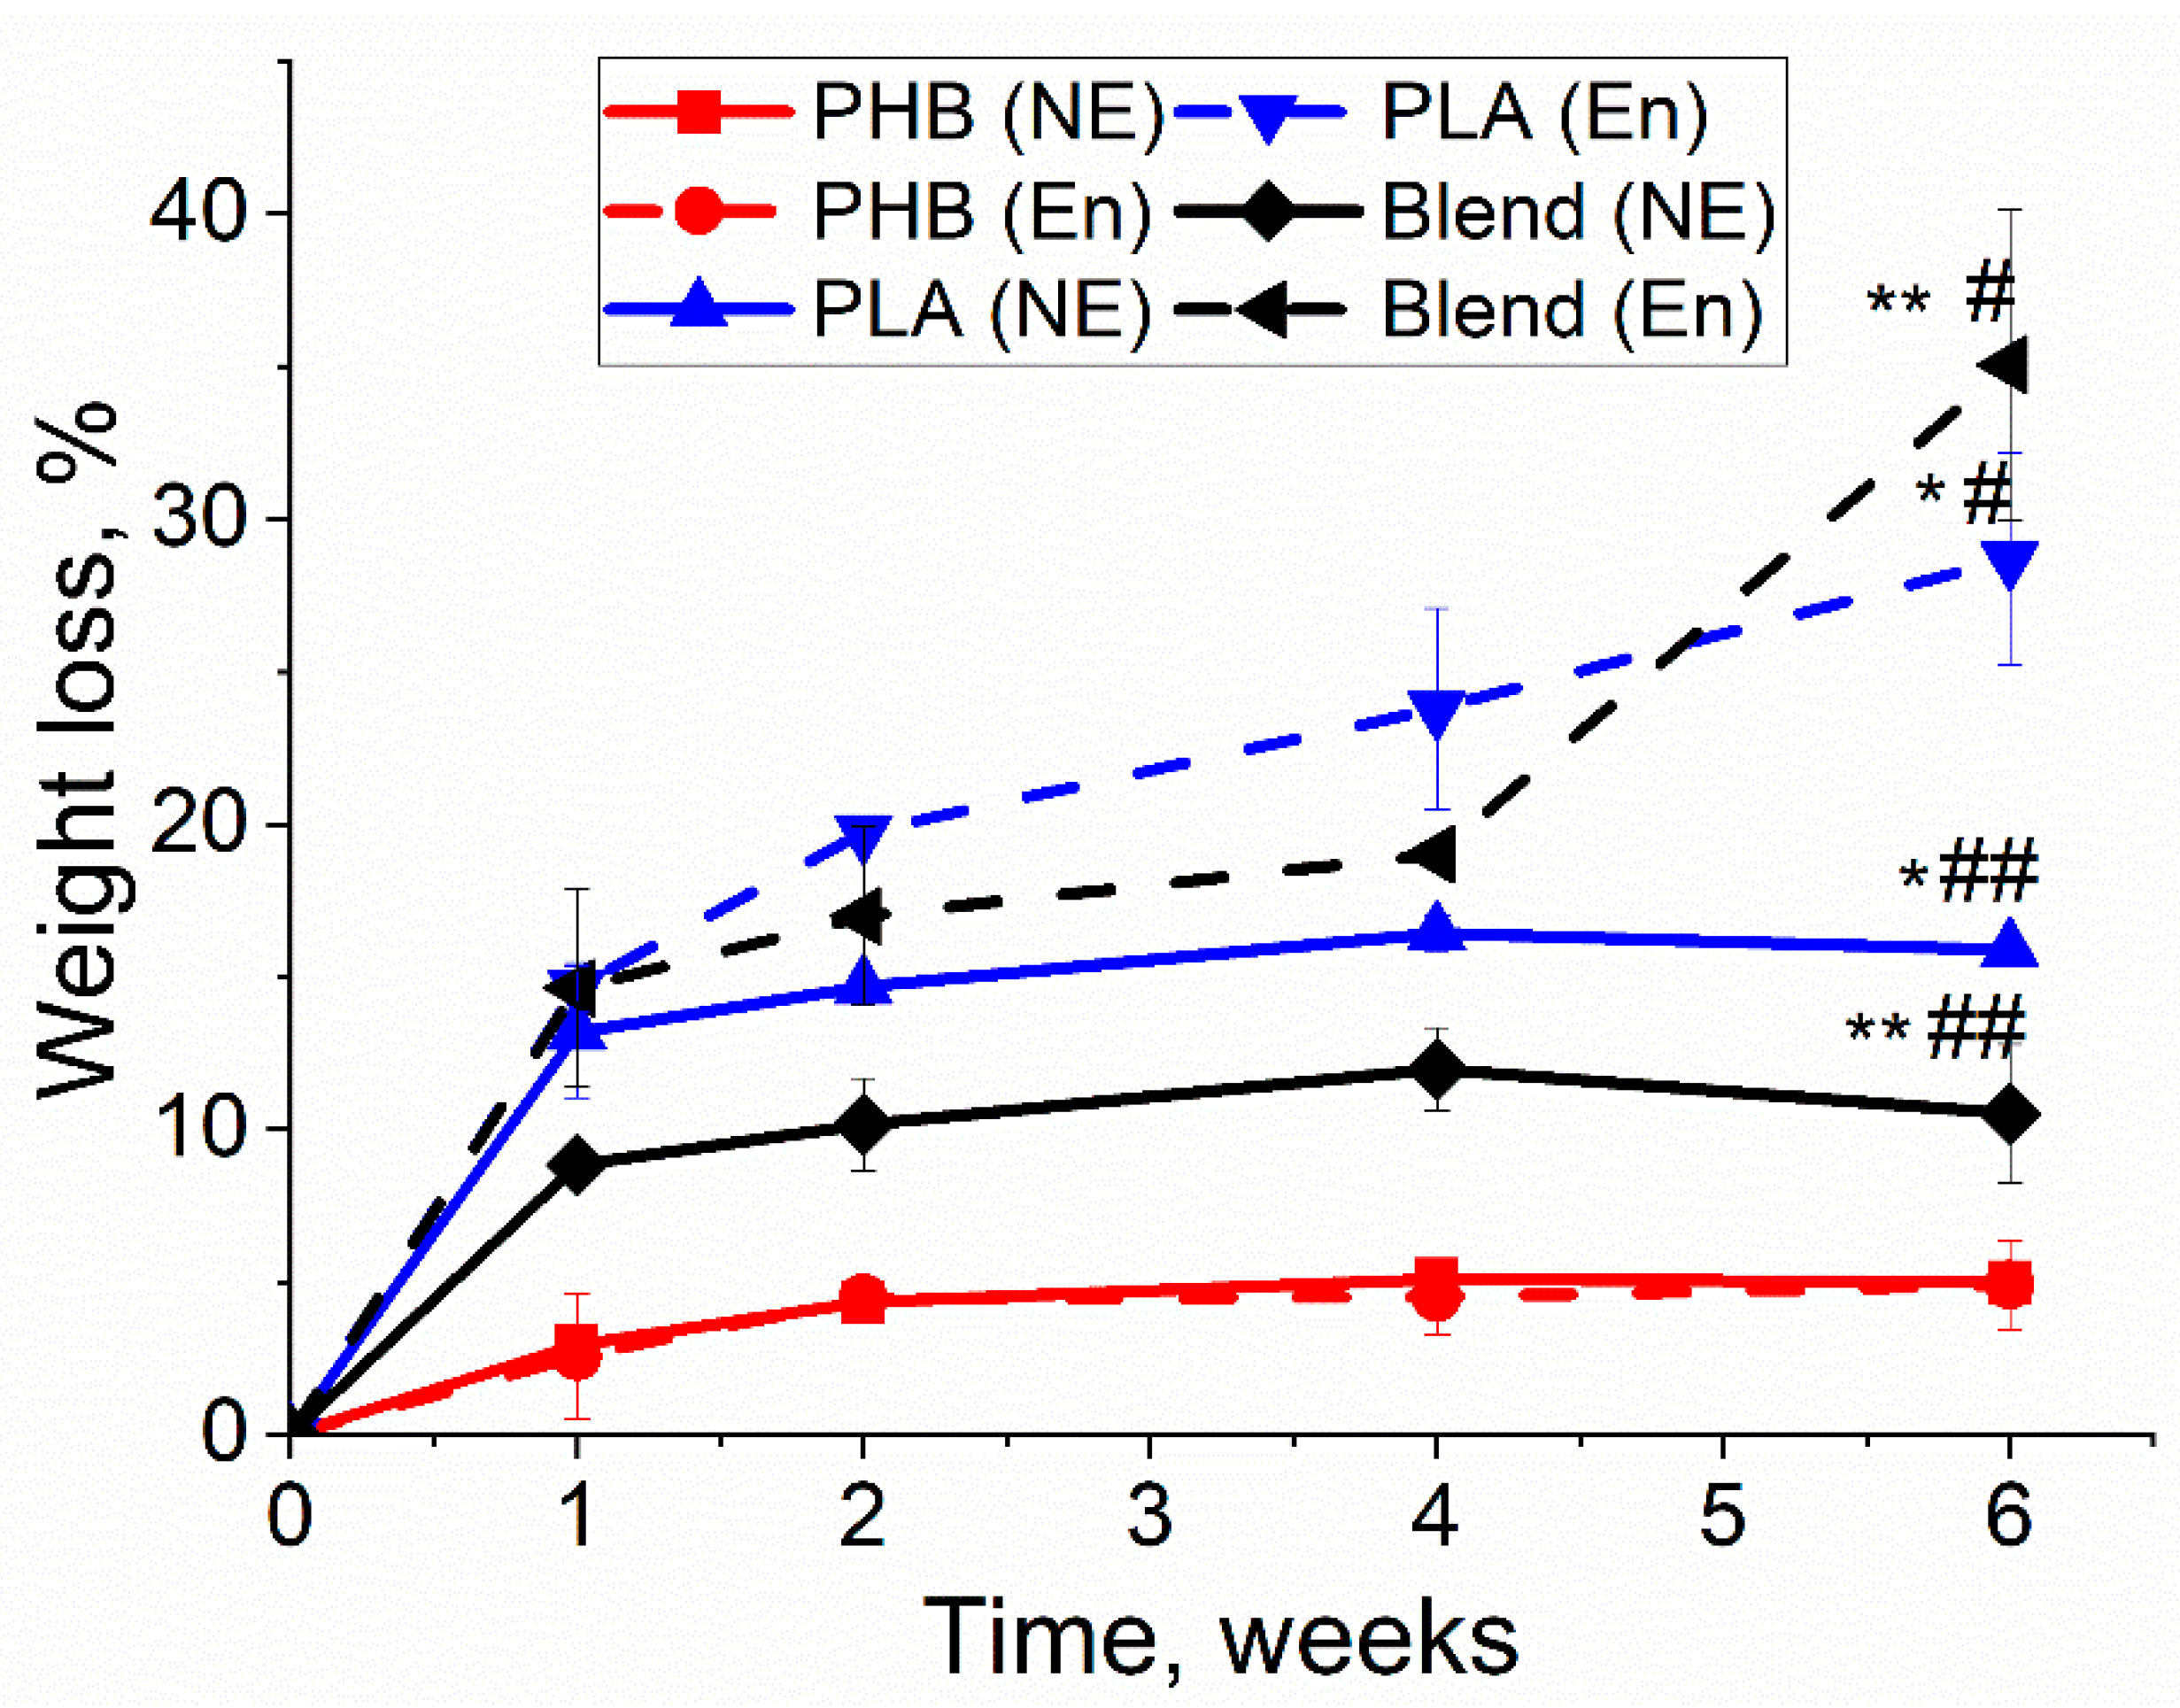
3.1. Weight Loss of Biopolymer Films
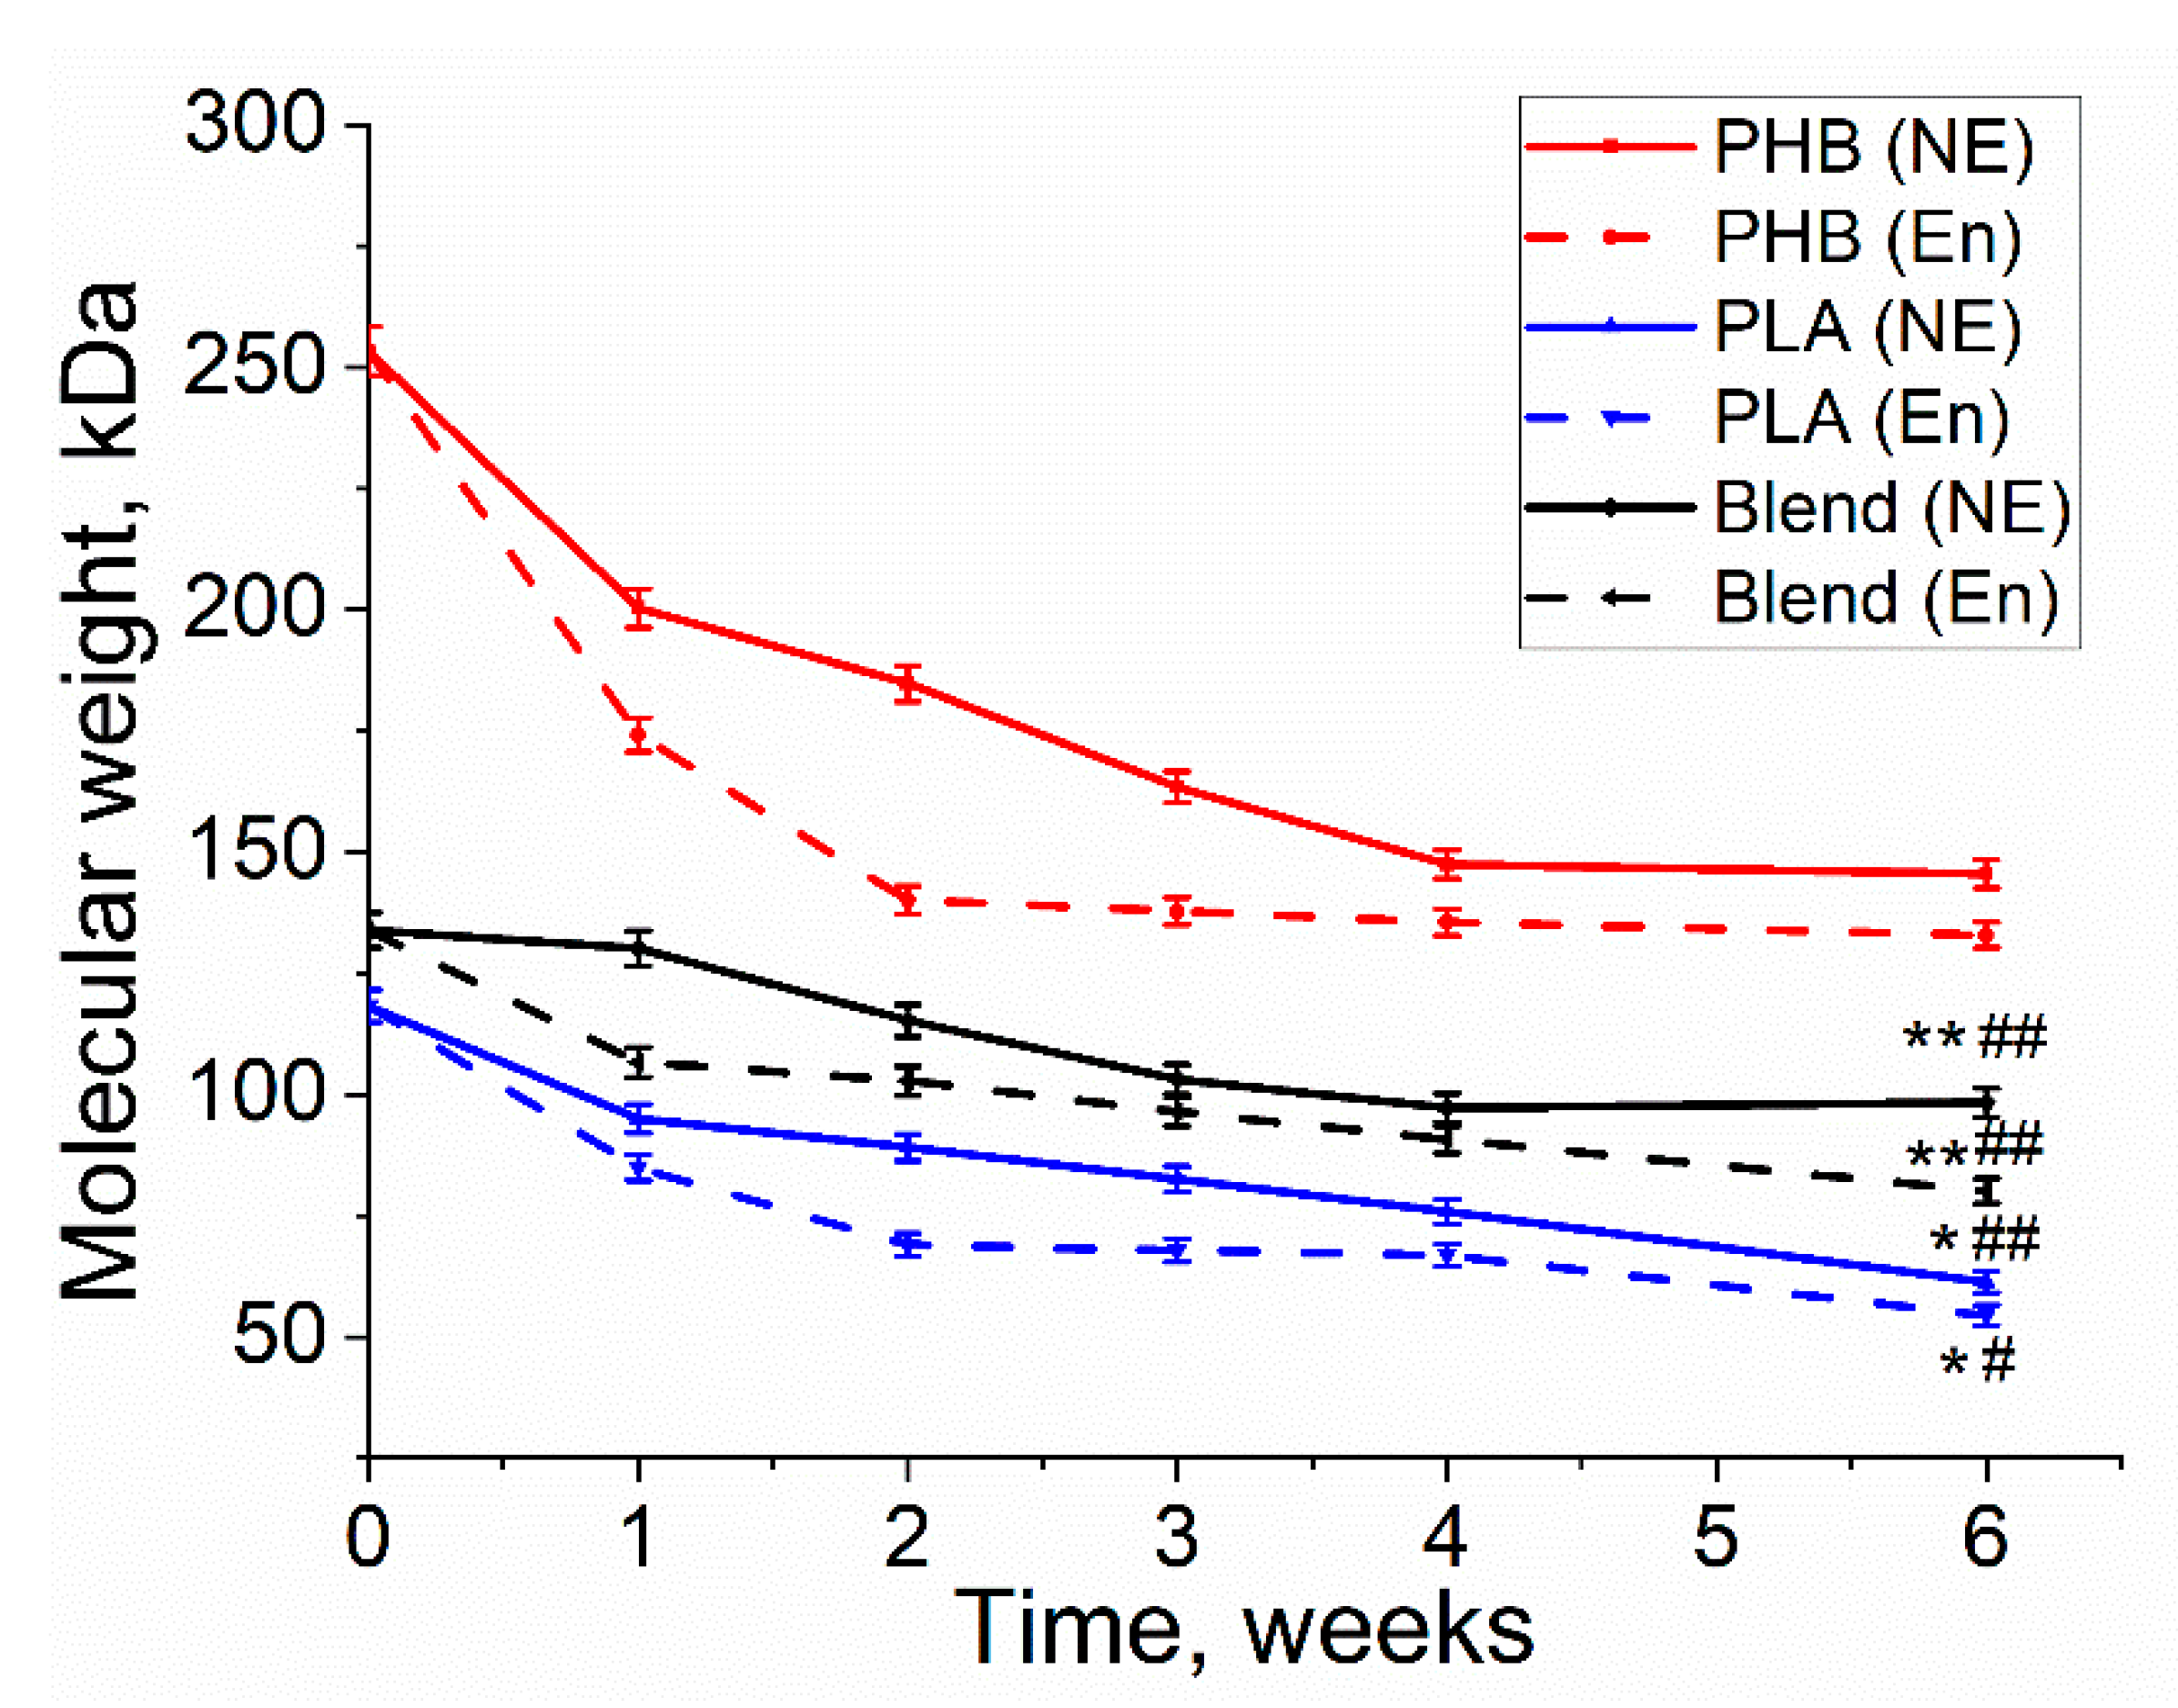
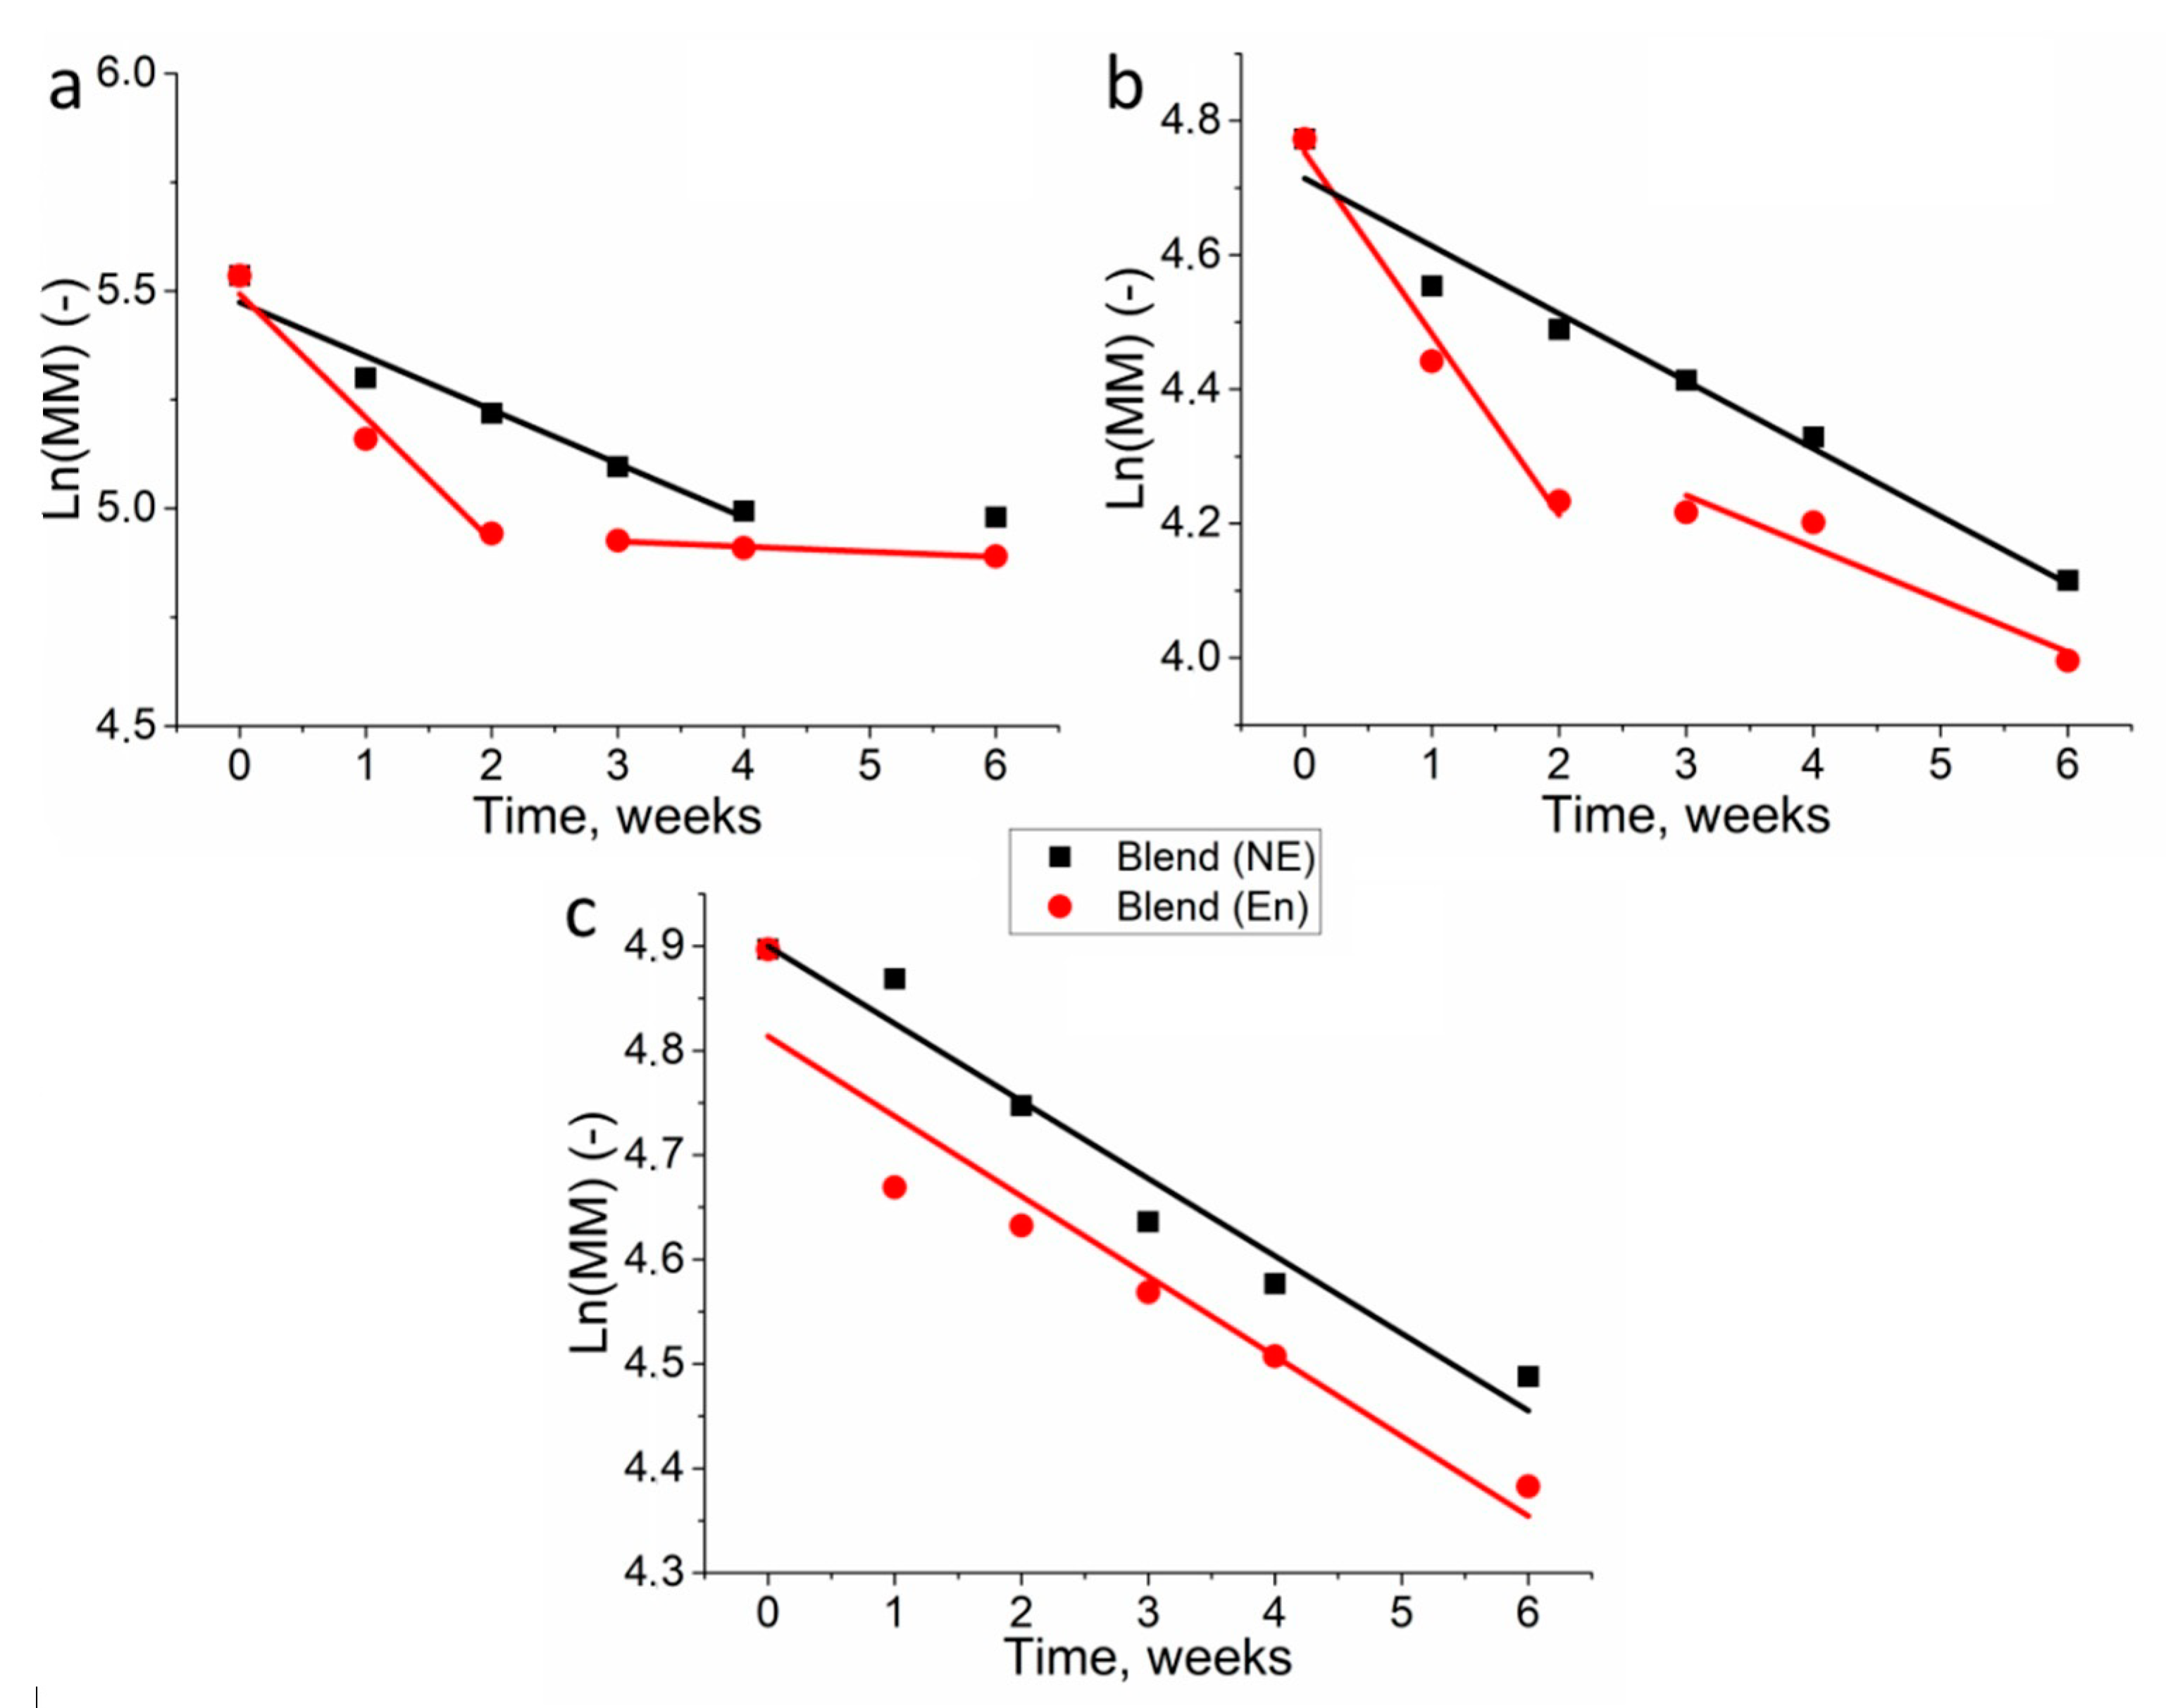
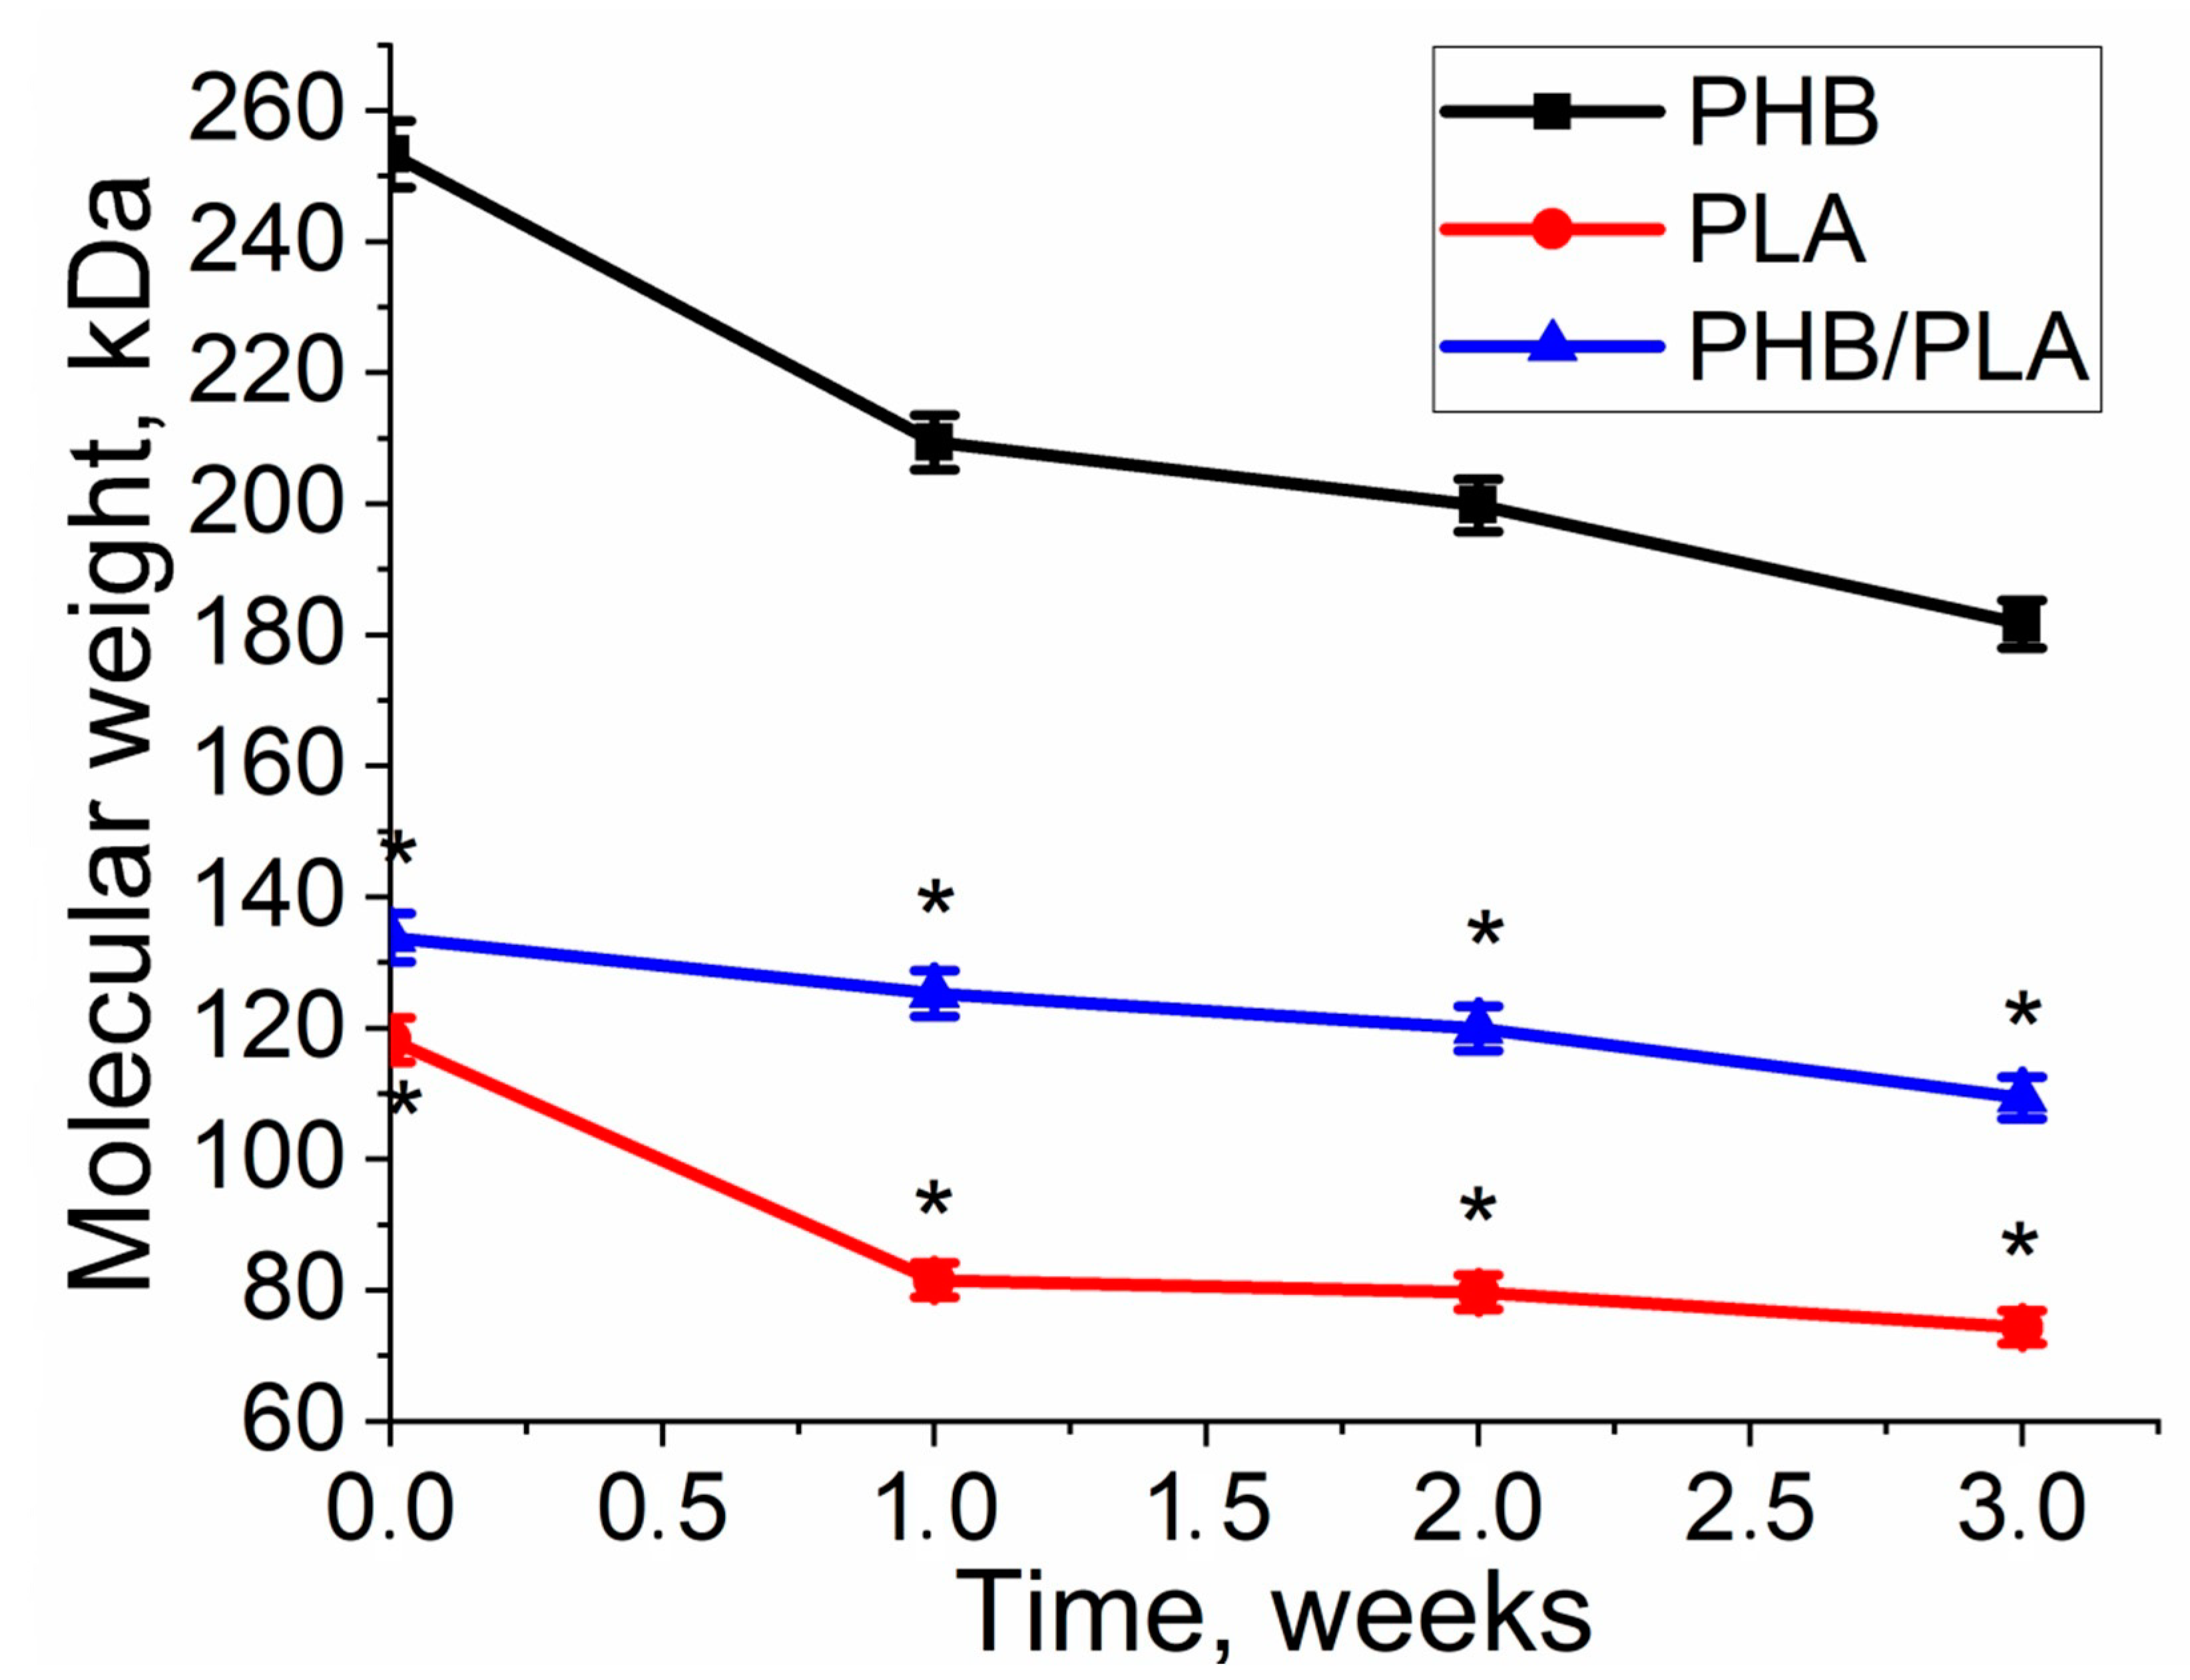
3.2. Molecular Weight Loss of Biopolymer Films
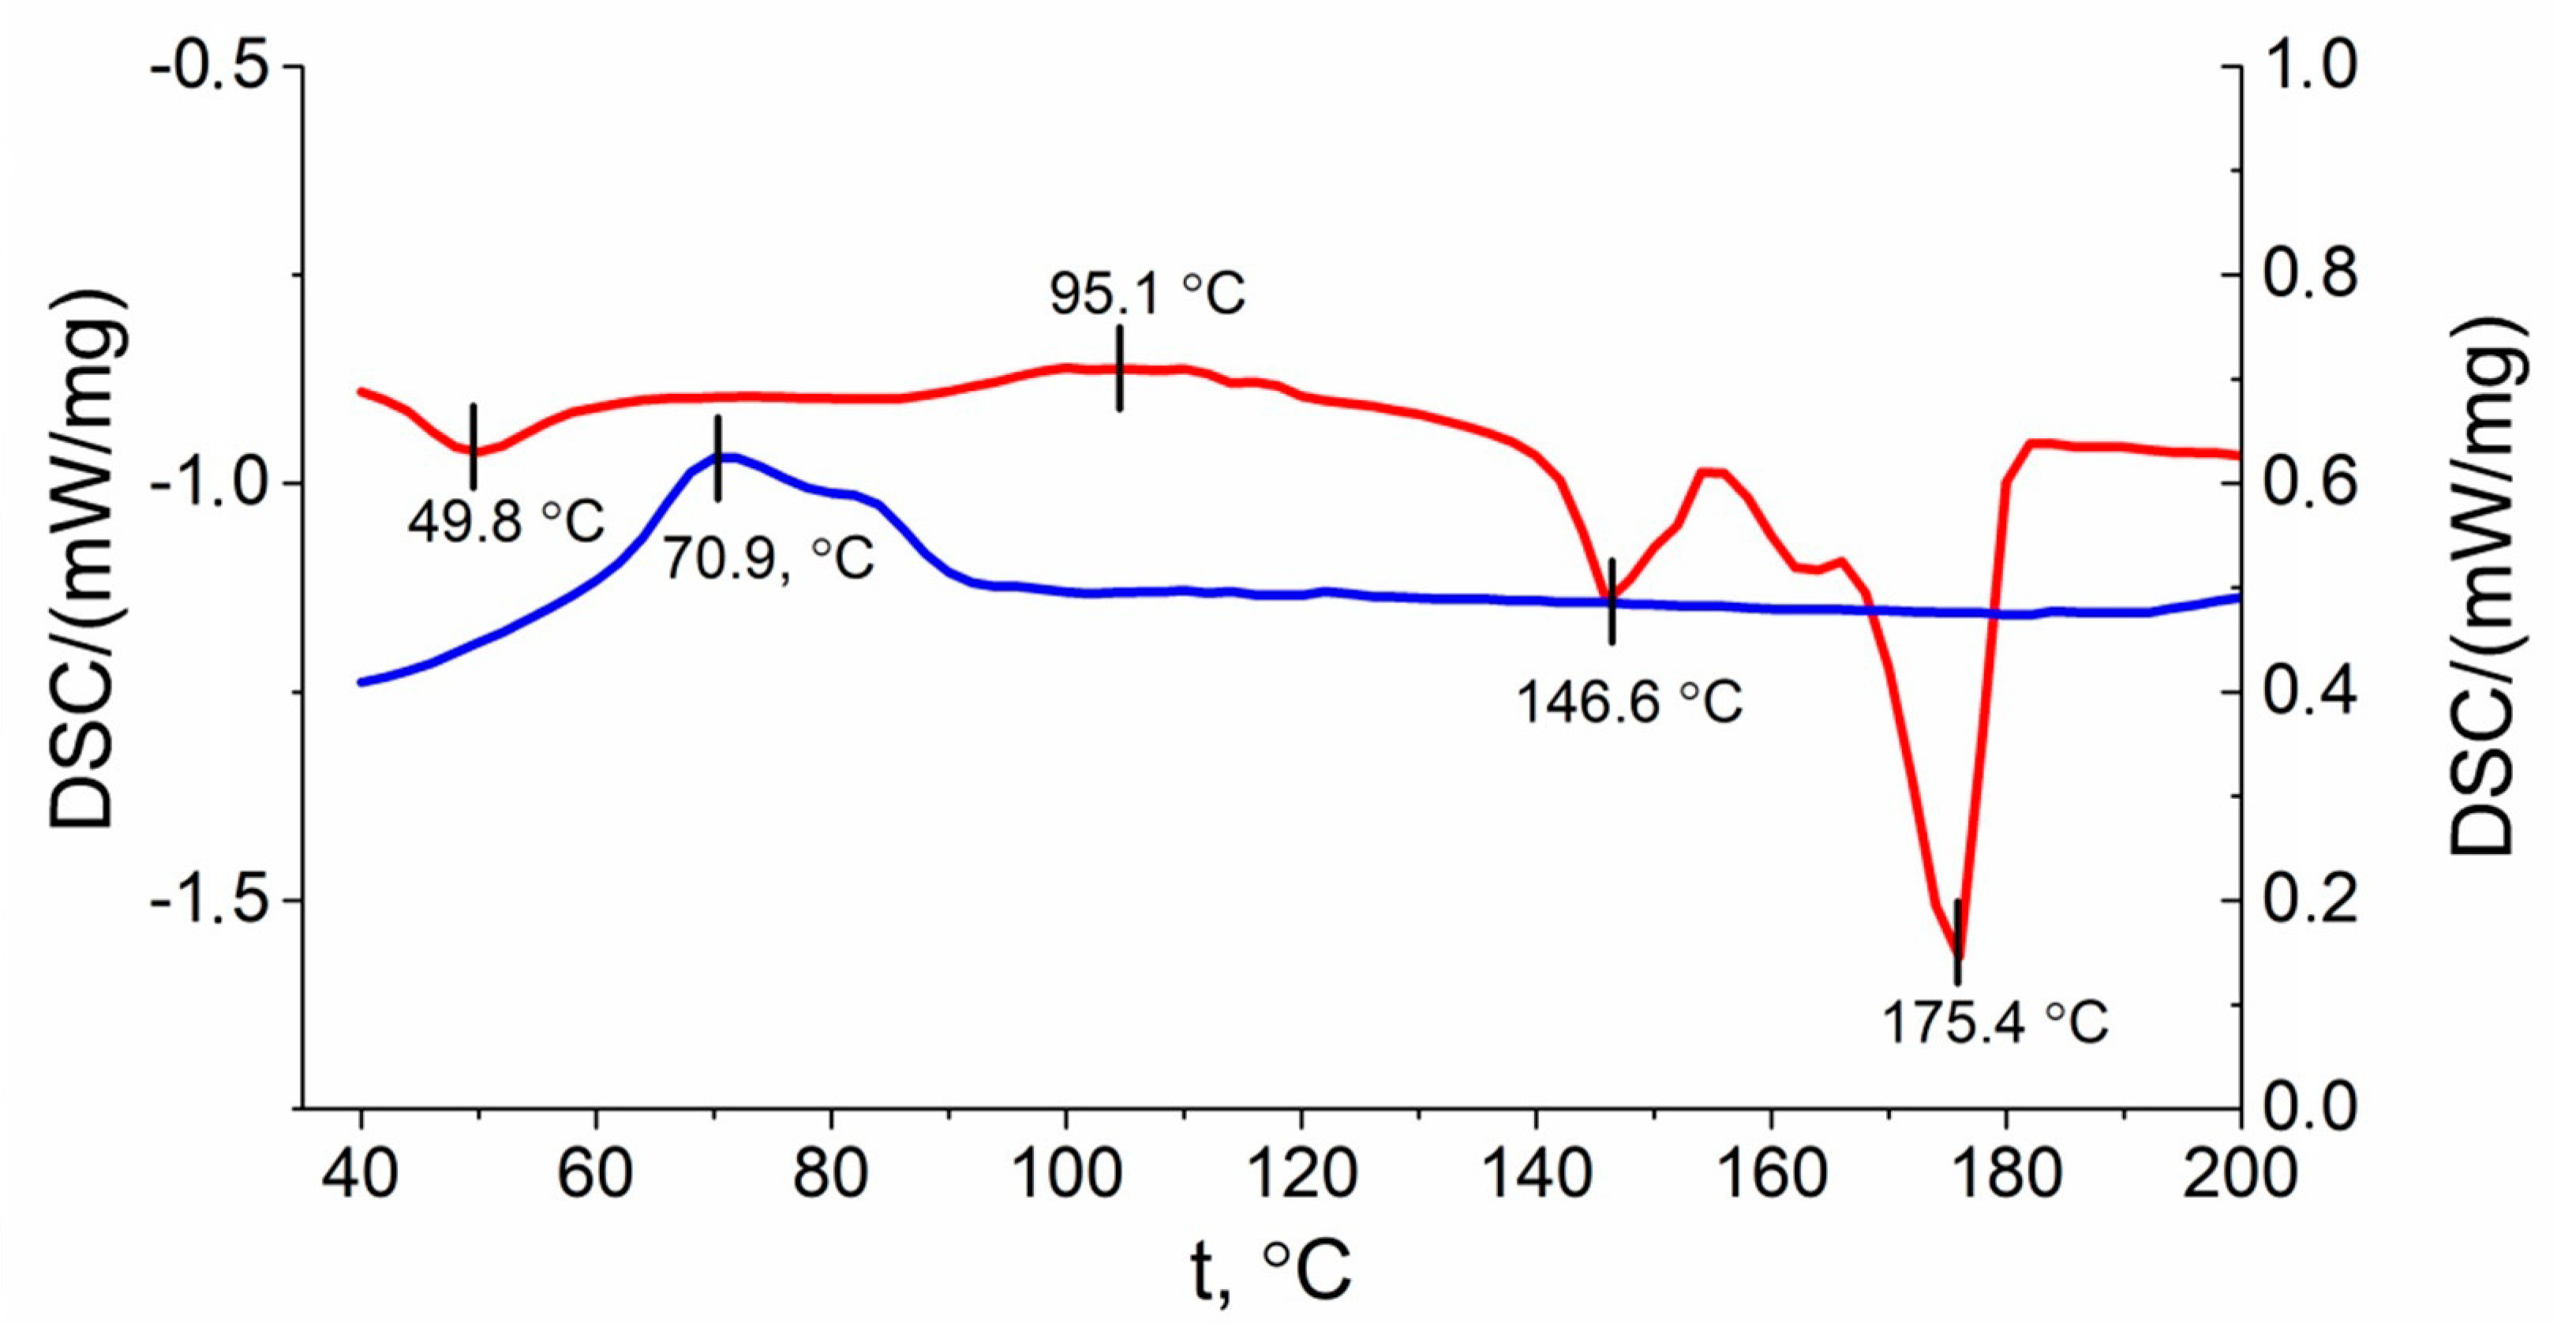
3.3. Crystallinity Analysis
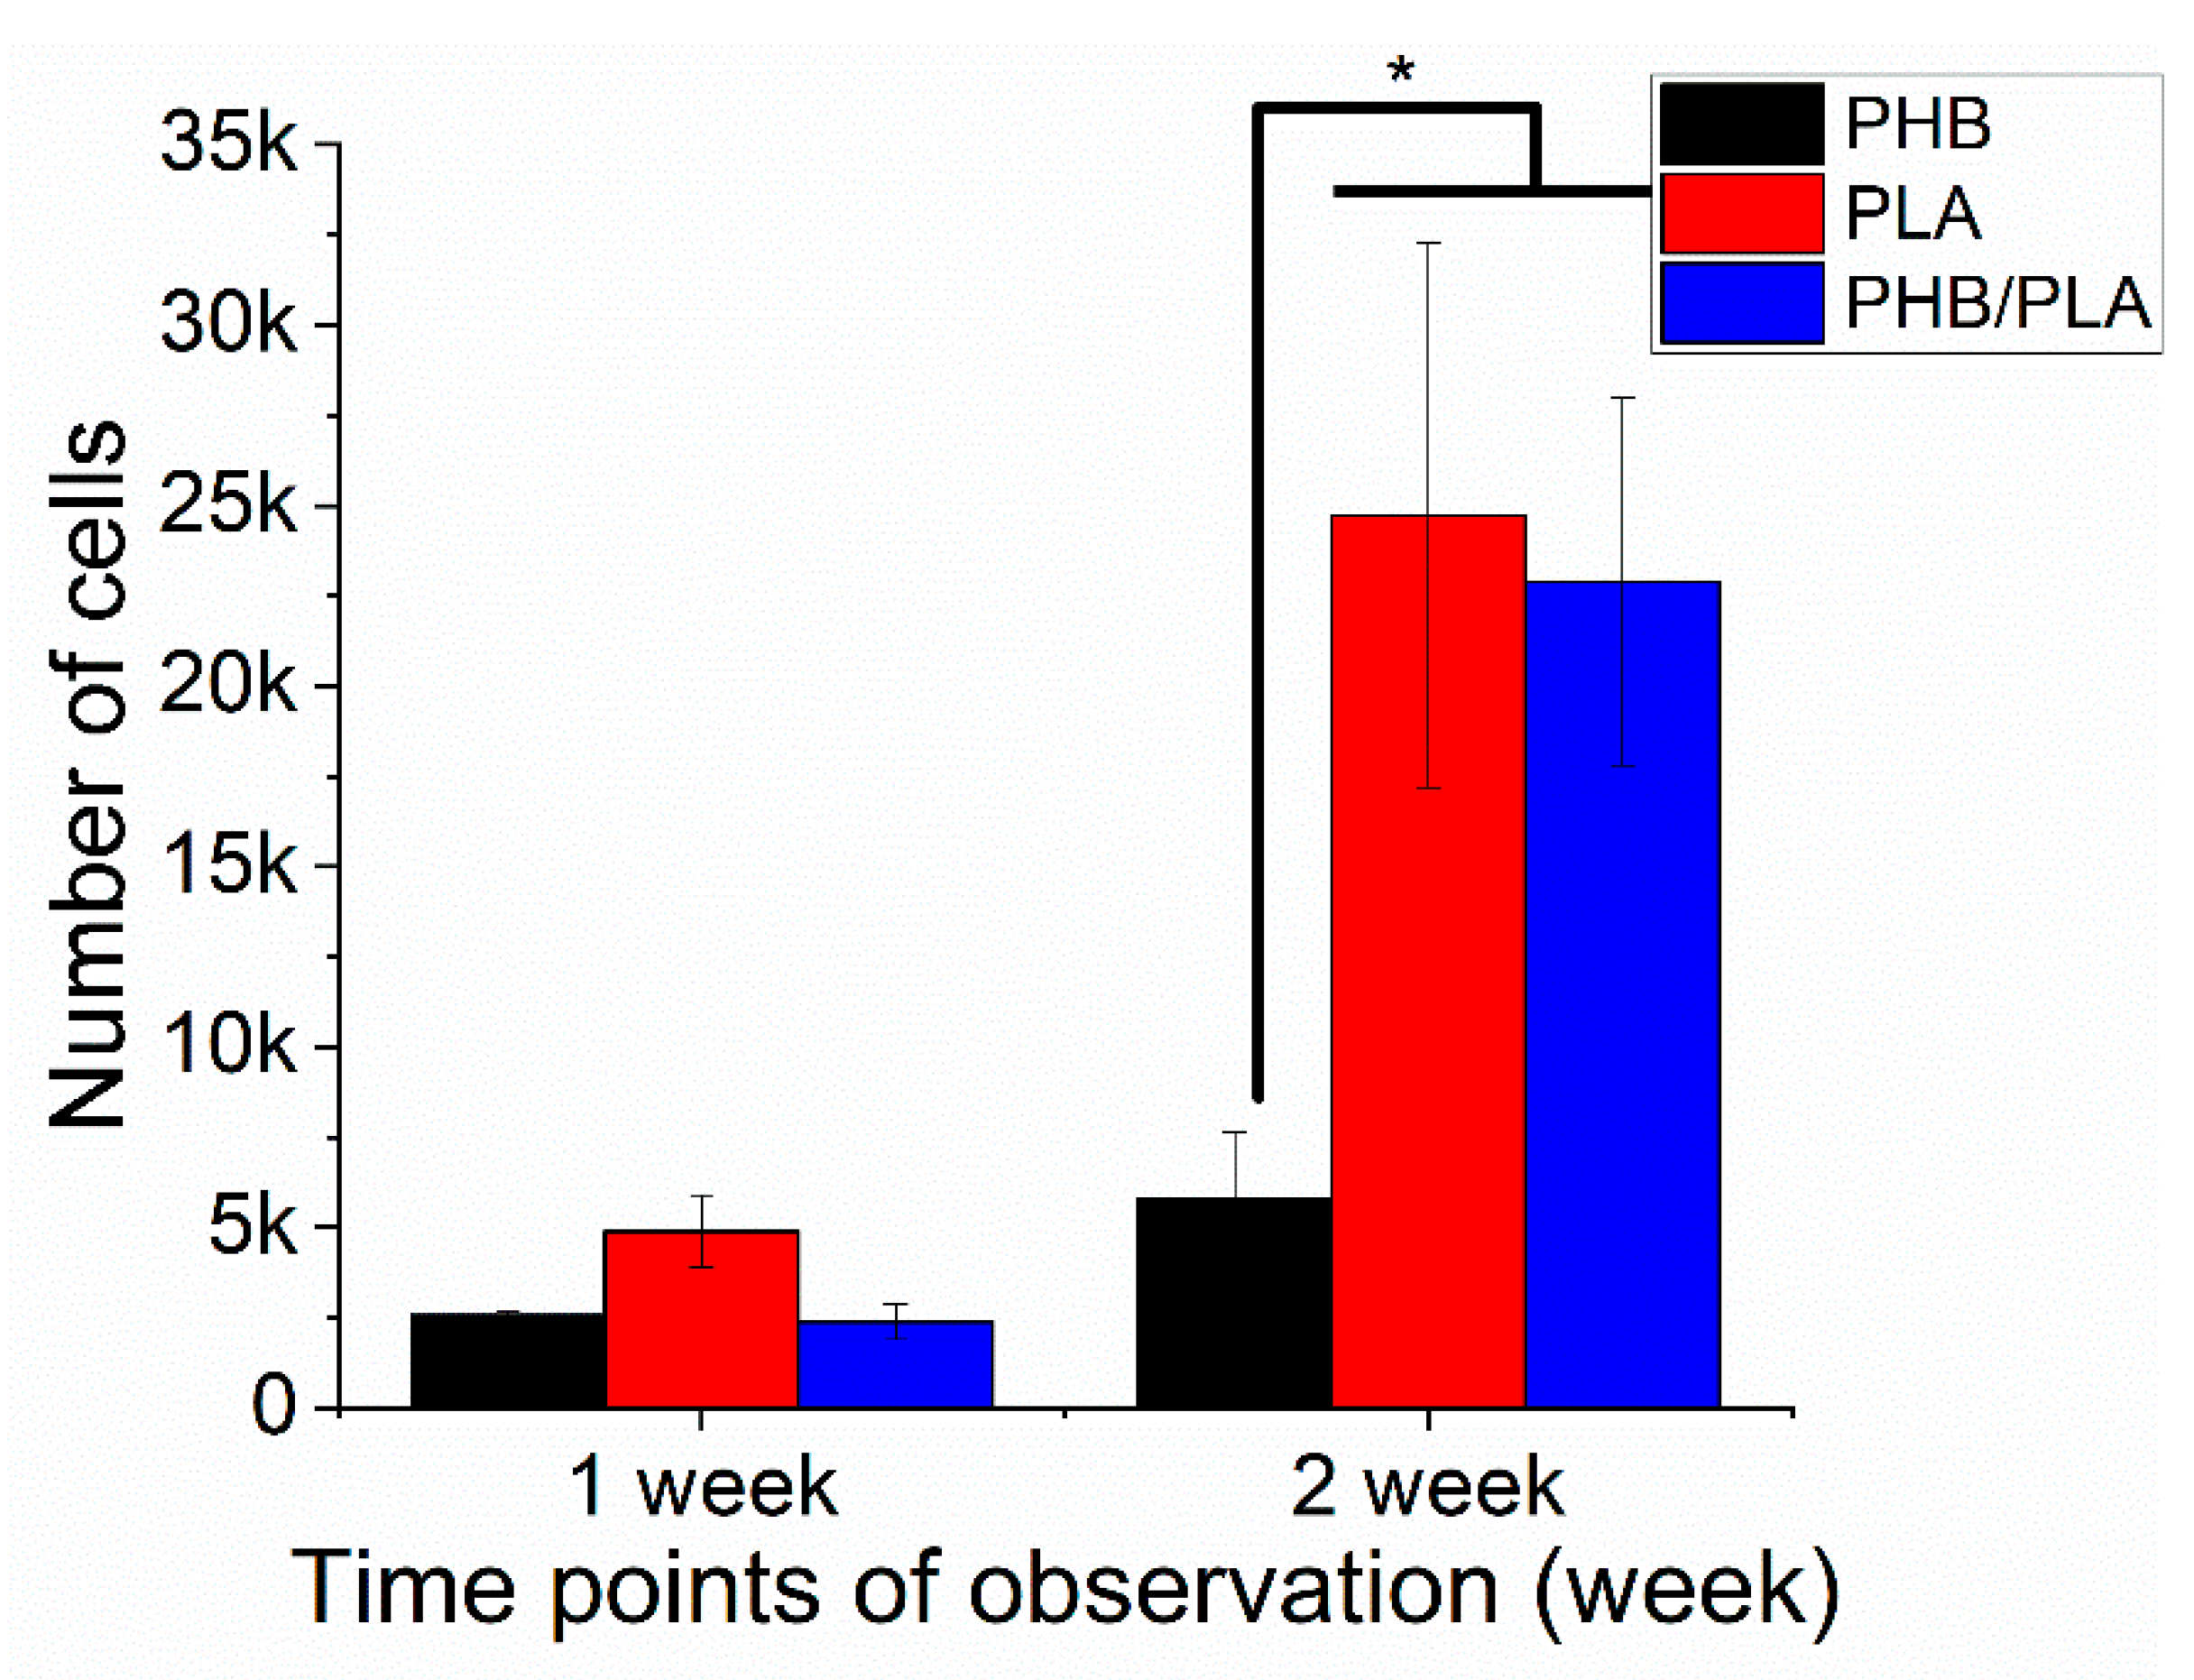
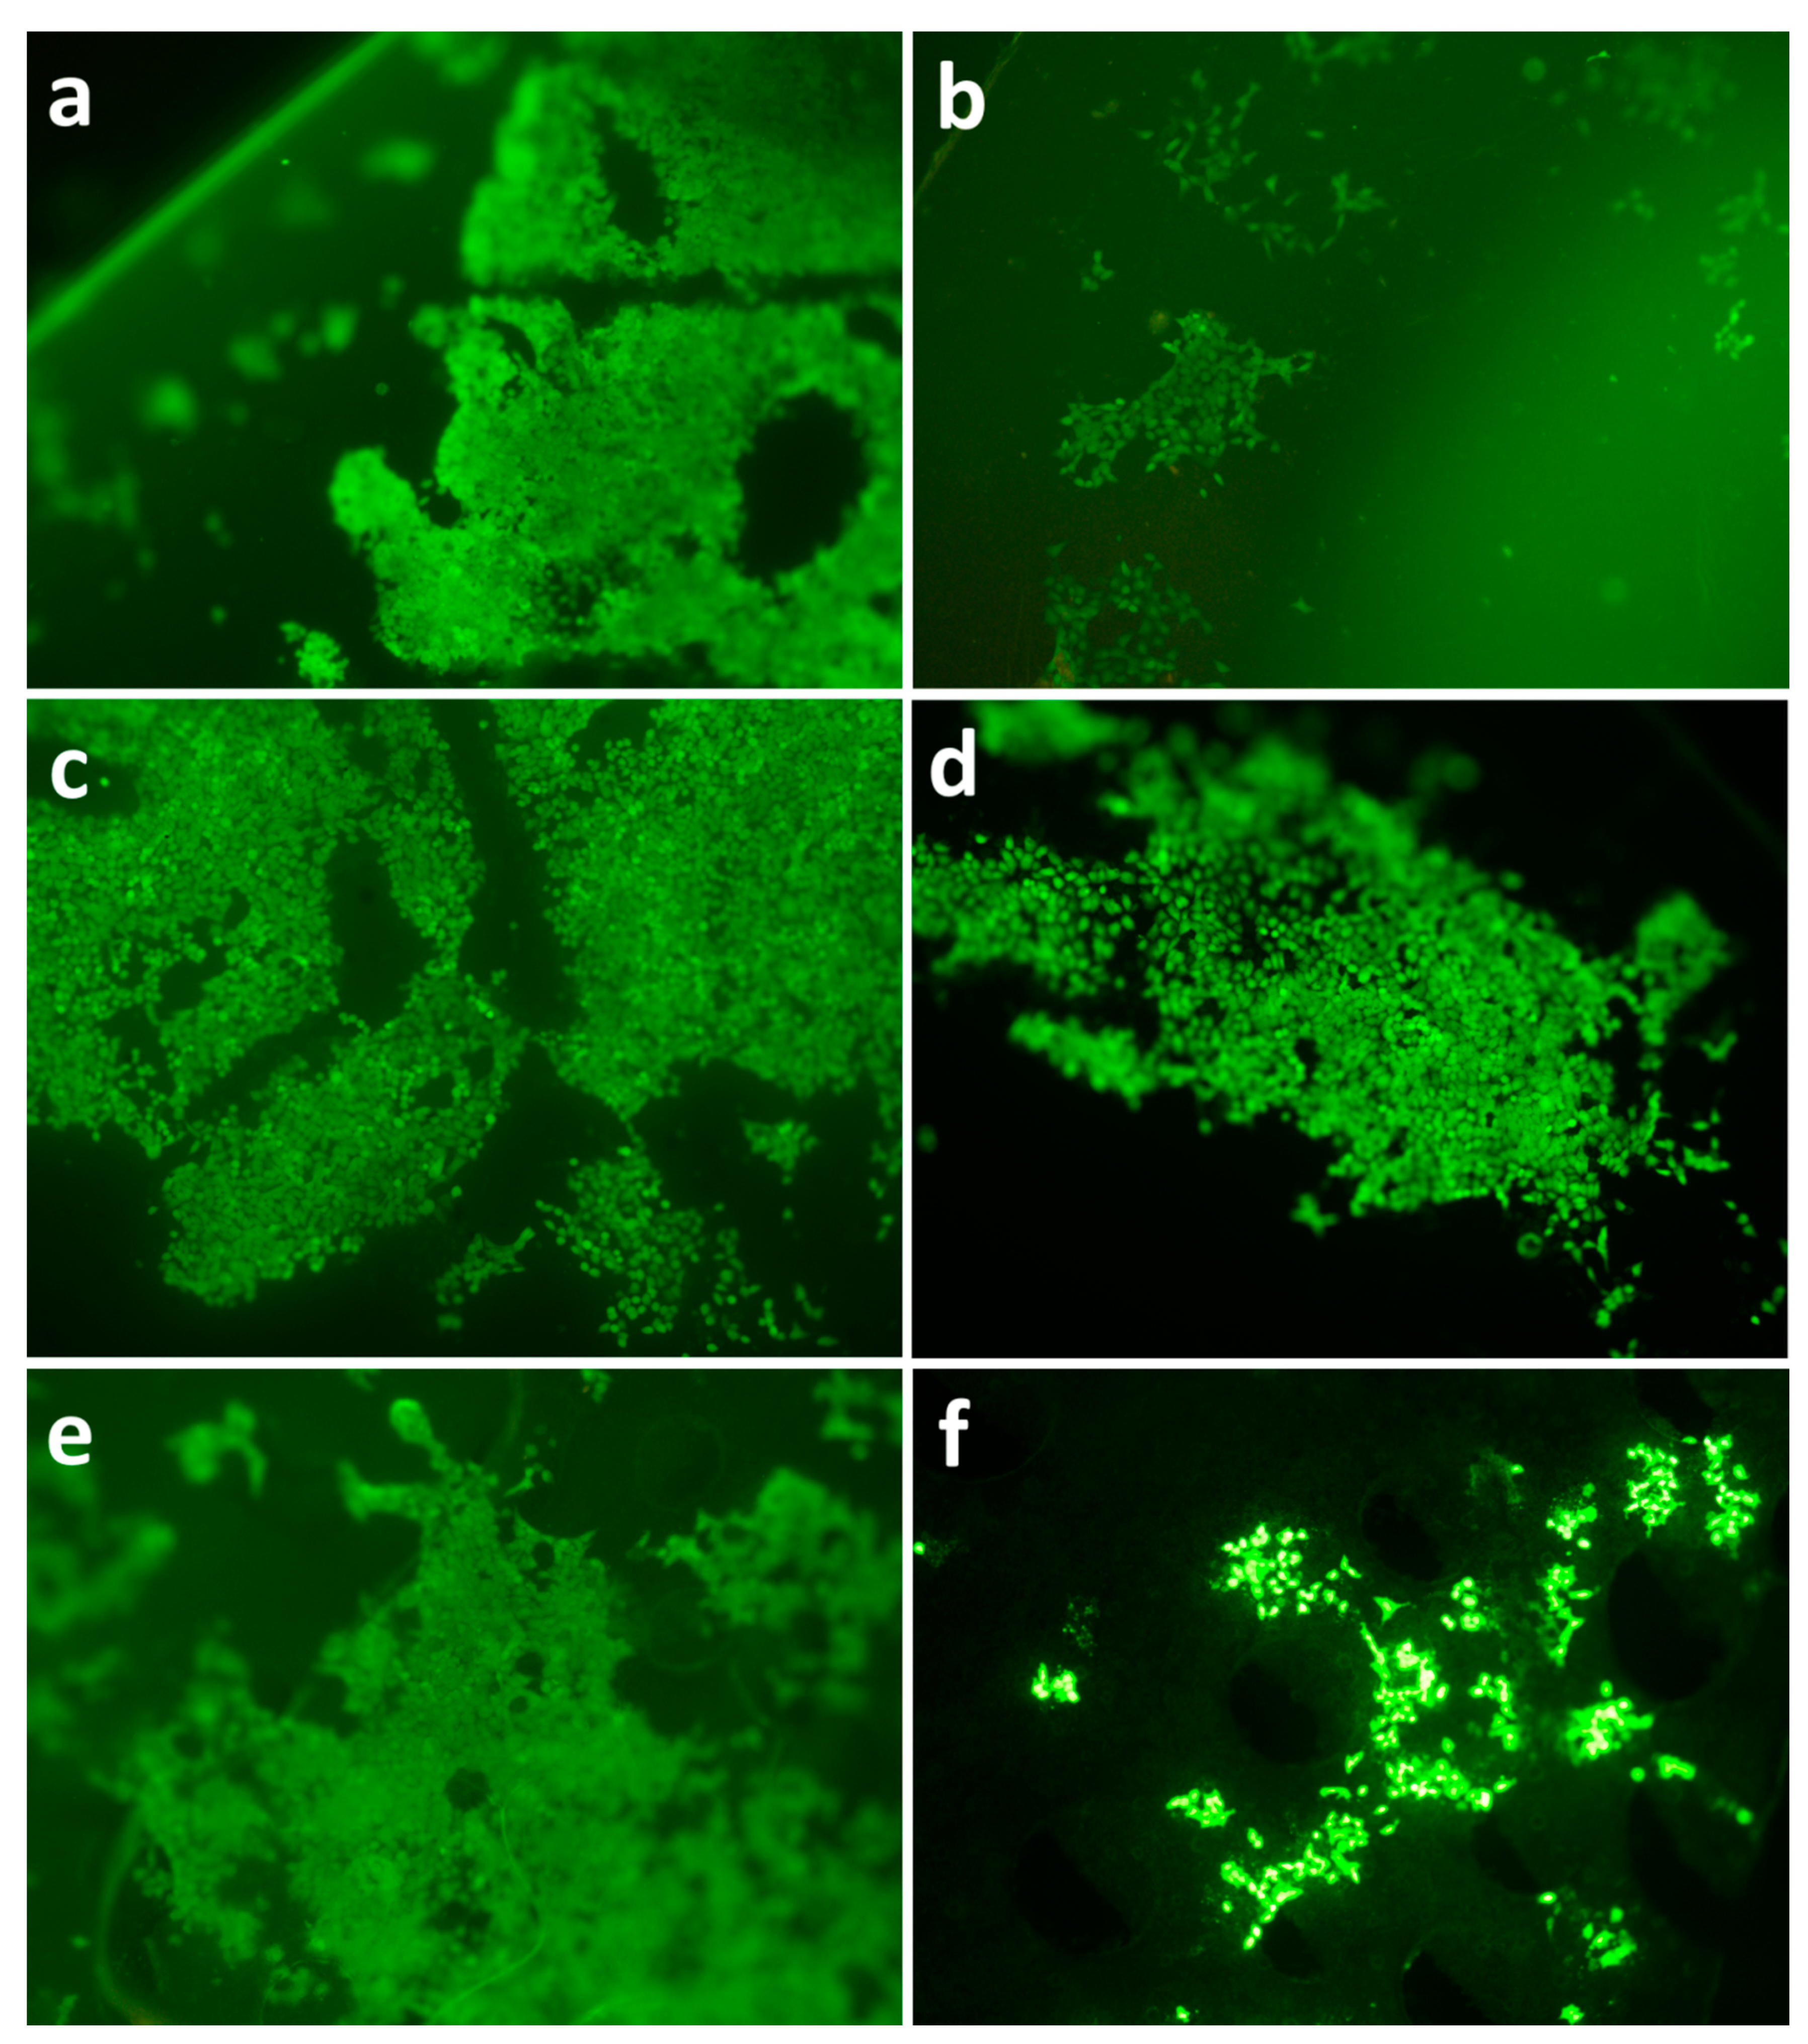
3.4. Cell Viability Analysis
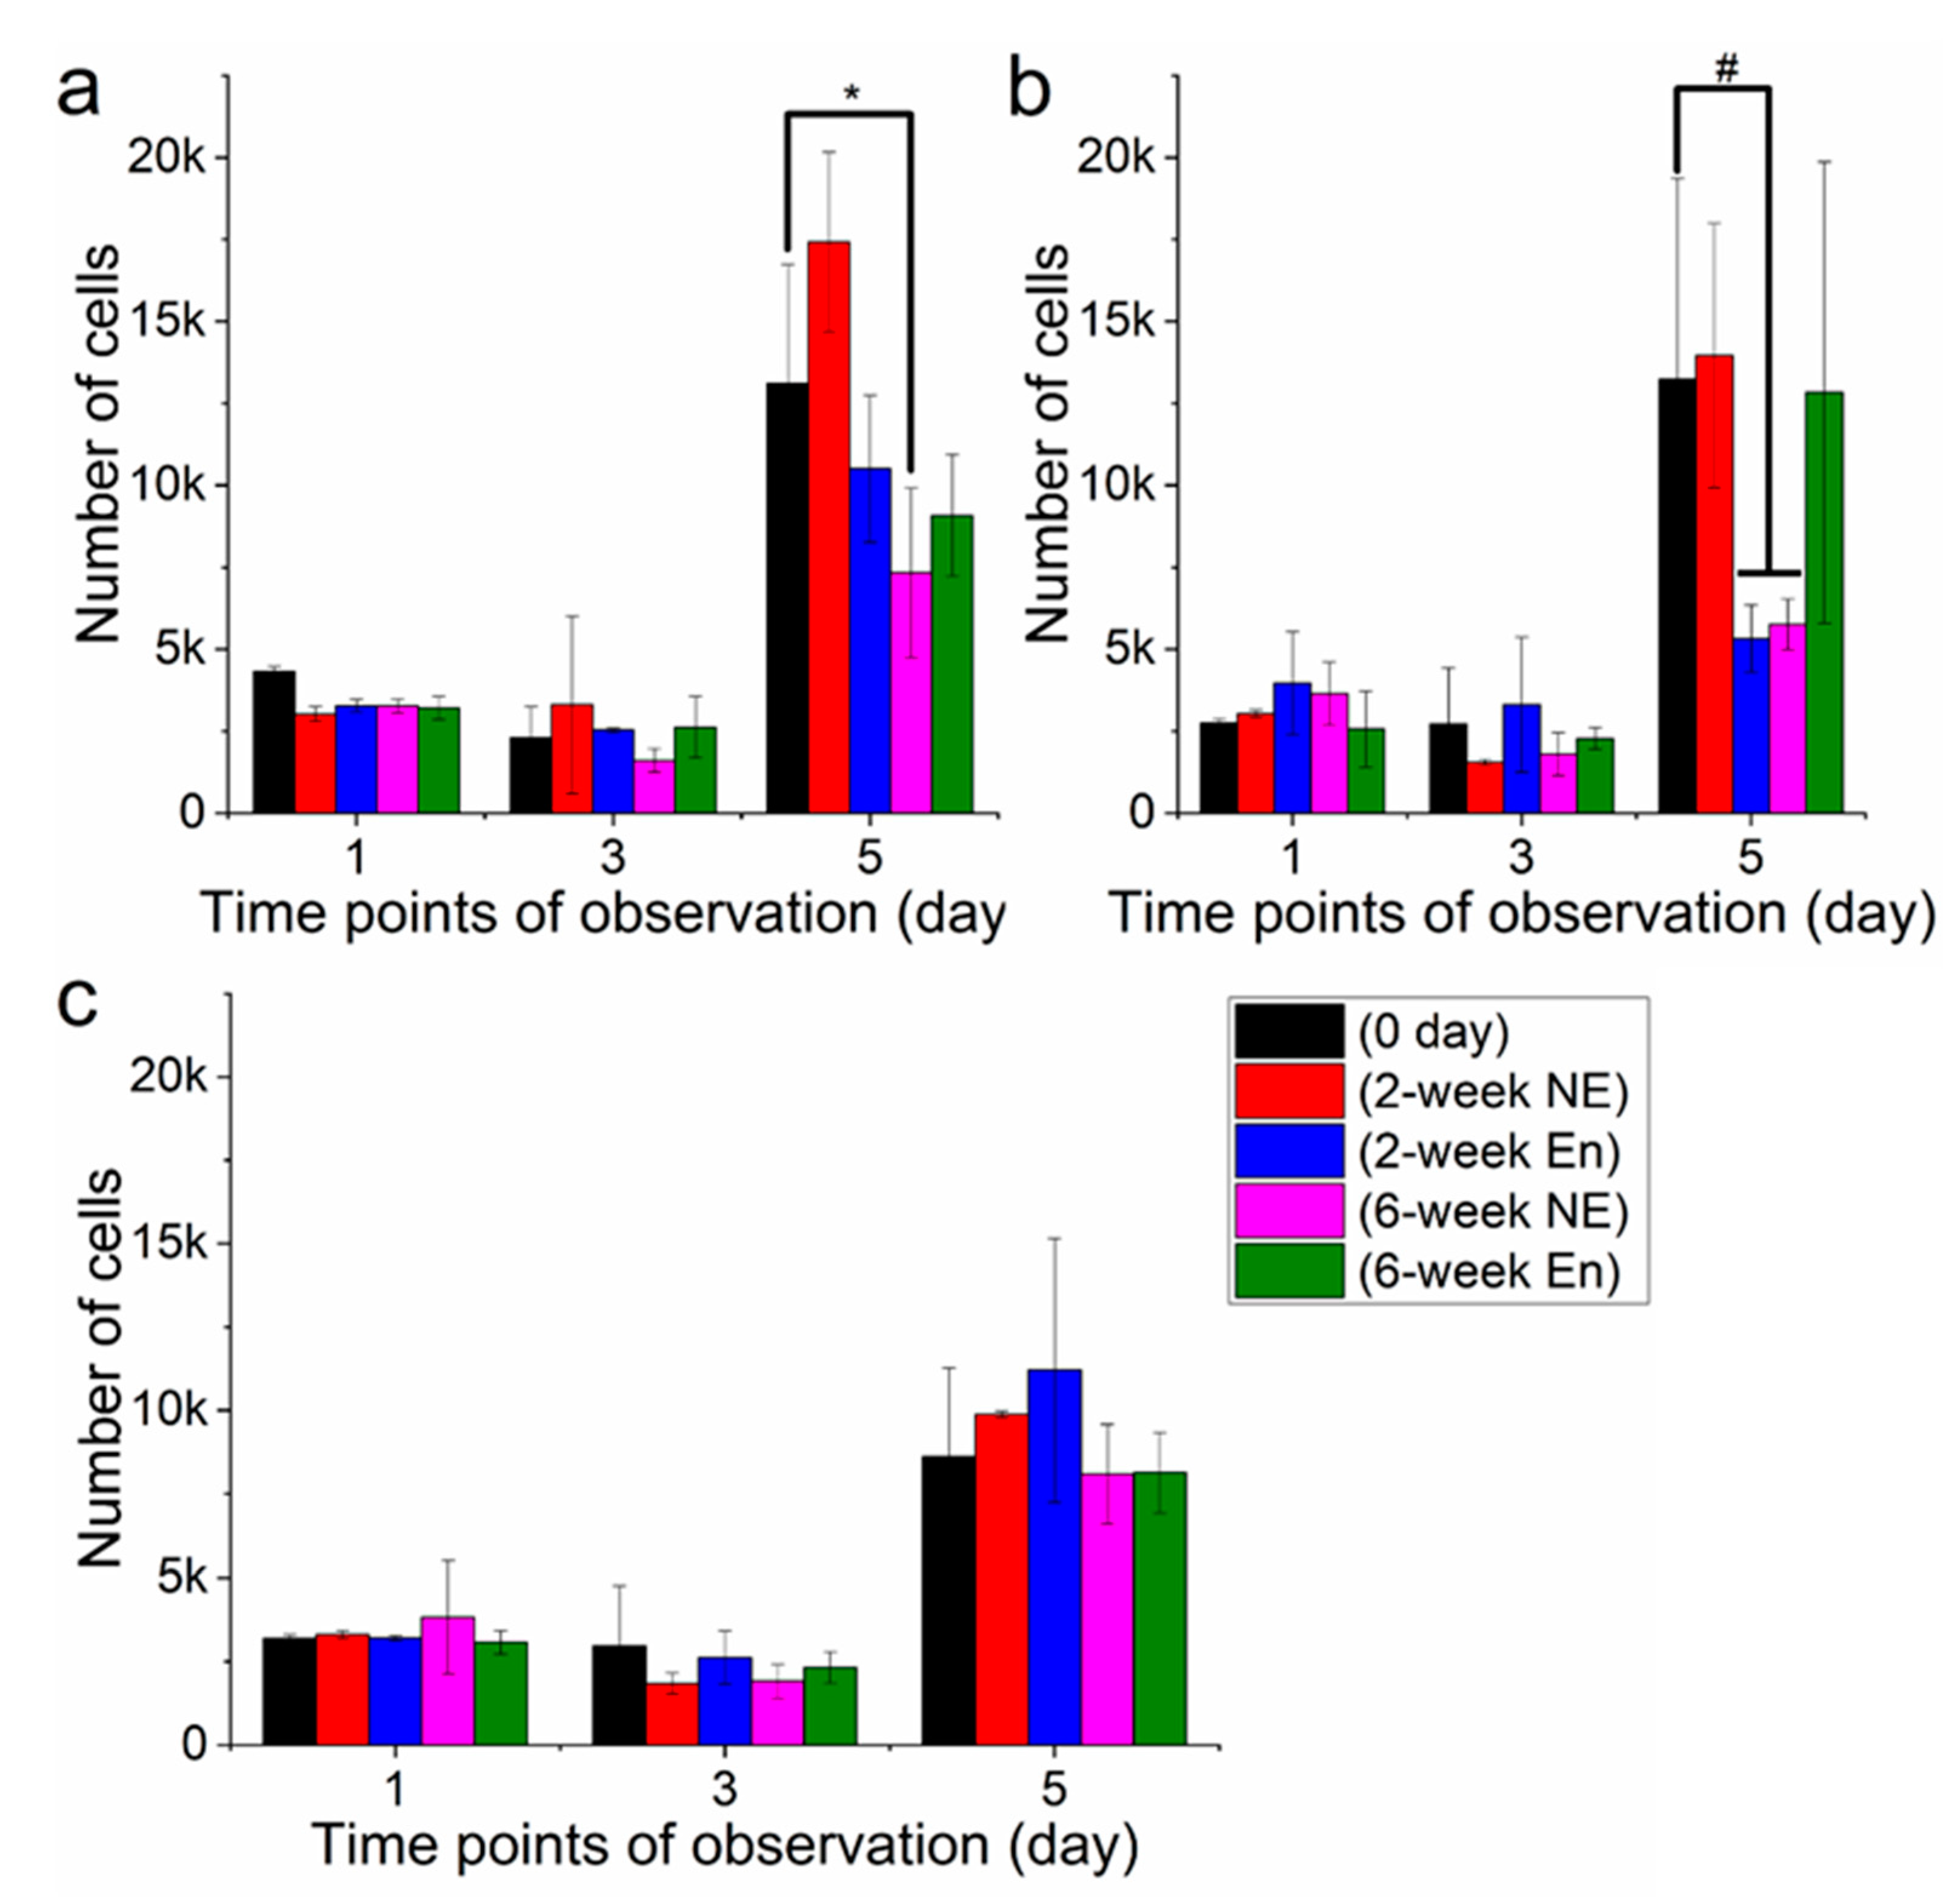
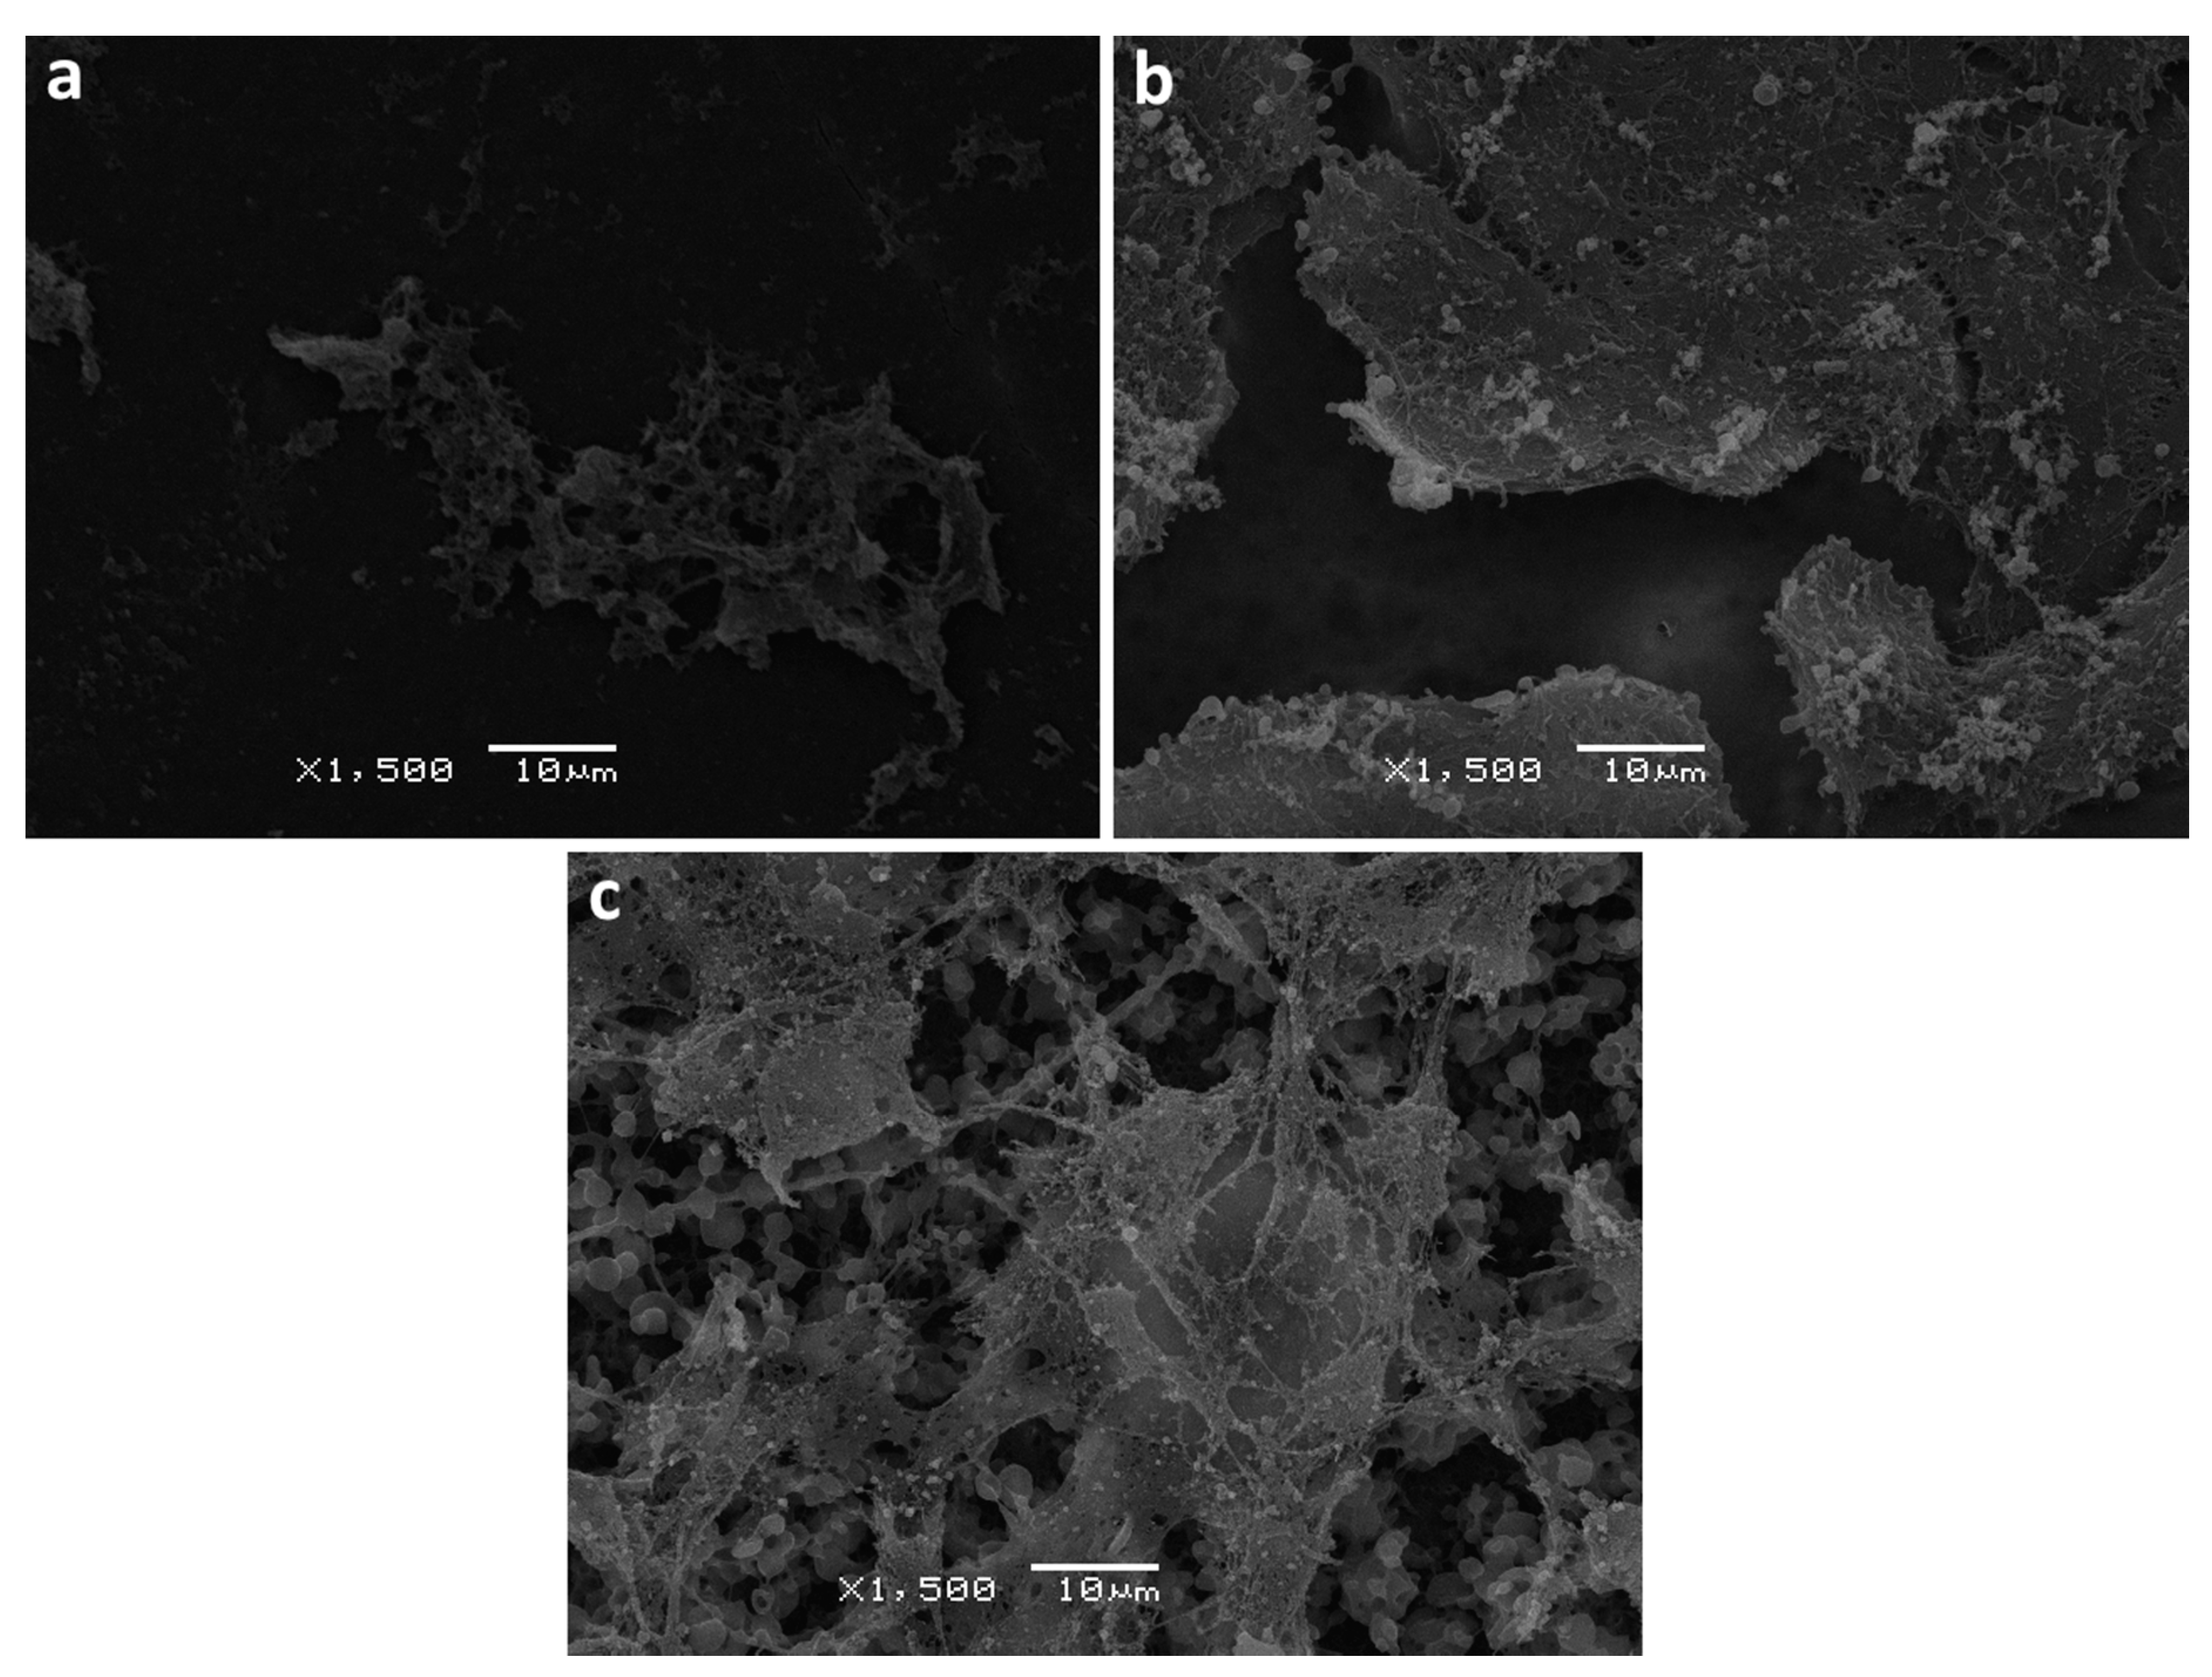
3.5. Analysis of Surface Structure and Cell Distribution
4. Discussion
5. Conclusions
Supplementary Materials
Author Contributions
Funding
Institutional Review Board Statement
Informed Consent Statement
Data Availability Statement
Conflicts of Interest
References
- Rasal, R.M.; Janorkar, A.V.; Hirt, D.E. Poly(lactic acid) modifications. Prog. Polym. Sci. 2010, 35, 338–356. [Google Scholar] [CrossRef]
- Khanna, S.; Srivastava, A.K. Recent advances in microbial polyhydroxyalkanoates. Process. Biochem. 2005, 40, 607–619. [Google Scholar] [CrossRef]
- Mokhtarzadeh, A.; Alibakhshi, A.; Hejazi, M.; Omidi, Y.; Dolatabadi, J.E.N. Bacterial-derived biopolymers: Advanced natural nanomaterials for drug delivery and tissue engineering. TrAC Trends Anal. Chem. 2016, 82, 367–384. [Google Scholar] [CrossRef]
- Lenz, A.R.W.; Marchessault, R.H. Bacterial Polyesters: Biosynthesis, Biodegradable Plastics and Biotechnology. Biomacromolecules 2005, 6, 1–8. [Google Scholar] [CrossRef] [PubMed]
- Rehm, B.H.A. Bacterial polymers: Biosynthesis, modifications and applications. Nat. Rev. Genet. 2010, 8, 578–592. [Google Scholar] [CrossRef]
- Volova, T.G.; Kiselev, E.G.; Shishatskaya, E.; Zhila, N.; Boyandin, A.N.; Syrvacheva, D.A.; Vinogradova, O.N.; Kalacheva, G.S.; Vasiliev, A.D.; Peterson, I.V. Cell growth and accumulation of polyhydroxyalkanoates from CO 2 and H 2 of a hydrogen-oxidizing bacterium, Cupriavidus eutrophus B-10646. Bioresour. Technol. 2013, 146, 215–222. [Google Scholar] [CrossRef]
- Bonartseva, G.A.; Zharkova, I.I.; Yakovlev, S.G.; Myshkina, V.L.; Mahina, T.K.; Voinova, V.V.; Zernov, A.L.; Zhuikov, V.A.; Akoulina, E.A.; Ivanova, E.V.; et al. Biosynthesis of poly(3-hydroxybutyrate) copolymers by Azotobacter chroococcum 7B: A precursor feeding strategy. Prep. Biochem. Biotechnol. 2016, 47, 173–184. [Google Scholar] [CrossRef]
- Zhang, J.; Shishatskaya, E.I.; Volova, T.G.; Silva, L.F.; Chen, G.-Q. Polyhydroxyalkanoates (PHA) for therapeutic applications. Mater. Sci. Eng. C 2018, 86, 144–150. [Google Scholar] [CrossRef]
- Możejko-Ciesielska, J.; Kiewisz, R. Bacterial polyhydroxyalkanoates: Still fabulous? Microbiol. Res. 2016, 192, 271–282. [Google Scholar] [CrossRef]
- Kimura, Y.; Shirotani, K.; Yamane, H.; Kitao, T. Ring-opening polymerization of 3(S)-[(benzyloxycarbonyl)methyl]-1,4-dioxane-2,5-dione: A new route to a poly(.alpha.-hydroxy acid) with pendant carboxyl groups. Macromology 1988, 21, 3338–3340. [Google Scholar] [CrossRef]
- Auras, R.; Harte, B.R.; Selke, S. An Overview of Polylactides as Packaging Materials. Macromol. Biosci. 2004, 4, 835–864. [Google Scholar] [CrossRef] [PubMed]
- Ray, S.S.; Okamoto, M. Biodegradable Polylactide and Its Nanocomposites: Opening a New Dimension for Plastics and Composites. Macromol. Rapid Commun. 2003, 24, 815–840. [Google Scholar] [CrossRef]
- Schugens, C.; Grandfils, C.; Jerome, R.; Teyssié, P.; Delree, P.; Martin, D.; Malgrange, B.; Moonen, G. Preparation of a macroporous biodegradable polylactide implant for neuronal transplantation. J. Biomed. Mater. Res. 1995, 29, 1349–1362. [Google Scholar] [CrossRef] [PubMed]
- Ramot, Y.; Haim-Zada, M.; Domb, A.J.; Nyska, A. Biocompatibility and safety of PLA and its copolymers. Adv. Drug Deliv. Rev. 2016, 107, 153–162. [Google Scholar] [CrossRef]
- Karahaliloğlu, Z.; Demirbilek, M.; Şam, M.; Sağlam, N.; Mızrak, A.K.; Denkbaş, E.B.; Mizrak, A.K. Surface-modified bacterial nanofibrillar PHB scaffolds for bladder tissue repair. Artif. Cells Nanomed. Biotechnol. 2014, 44, 74–82. [Google Scholar] [CrossRef]
- Zhijiang, C.; Yi, X.; Haizheng, Y.; Jia, J.; Liu, Y. Poly(hydroxybutyrate)/cellulose acetate blend nanofiber scaffolds: Preparation, characterization and cytocompatibility. Mater. Sci. Eng. C 2016, 58, 757–767. [Google Scholar] [CrossRef]
- Sin, M.C.; Tan, I.K.P.; Annuar, M.S.M.; Gan, S.N. Thermal behaviour and thermodegradation kinetics of poly(vinyl chloride) plasticized with polymeric and oligomeric medium-chain-length poly(3-hydroxyalkanoates). Polym. Degrad. Stab. 2012, 97, 2118–2127. [Google Scholar] [CrossRef]
- Senatov, F.; Anisimova, N.; Kiselevskiy, M.; Kopylov, A.; Tcherdyntsev, V.; Maksimkin, A. Polyhydroxybutyrate/Hydroxyapatite Highly Porous Scaffold for Small Bone Defects Replacement in the Nonload-bearing Parts. J. Bionic Eng. 2017, 14, 648–658. [Google Scholar] [CrossRef]
- Gupta, B.; Revagade, N.; Hilborn, J. Poly(lactic acid) fiber: An overview. Prog. Polym. Sci. 2007, 32, 455–482. [Google Scholar] [CrossRef]
- Sawyer, D.J. Bioprocessing—No Longer a Field of Dreams. In Proceedings of the IUPAC Polymer Conference on the Mission and Challenge of Polymer Science and Technology, Kyoto, Japan, 2–5 December 2002; Volume 201, pp. 271–282. [Google Scholar]
- Athanasiou, K.A. Sterilization, toxicity, biocompatibility and clinical applications of polylactic acid/ polyglycolic acid copolymers. Biomaterials 1996, 17, 93–102. [Google Scholar] [CrossRef]
- Zhao, K.; Deng, Y.; Chen, J.C.; Chen, G.-Q. Polyhydroxyalkanoate (PHA) scaffolds with good mechanical properties and biocompatibility. Biomaterials 2003, 24, 1041–1045. [Google Scholar] [CrossRef]
- JunLohbf, X.; Loh, X.J. Water soluble polyhydroxyalkanoates: Future materials for therapeutic applications. Chem. Soc. Rev. 2015, 44, 2865–2879. [Google Scholar] [CrossRef]
- Silverman, T.; Naffakh, M.; Marco, C.; Ellis, G.J. Morphology and thermal properties of biodegradable poly(hydroxybutyrate-co-hydroxyvalerate)/tungsten disulphide inorganic nanotube nanocomposites. Mater. Chem. Phys. 2016, 170, 145–153. [Google Scholar] [CrossRef]
- Obruca, S.; Sedlacek, P.; Mravec, F.; Samek, O.; Marova, I. Evaluation of 3-hydroxybutyrate as an enzyme-protective agent against heating and oxidative damage and its potential role in stress response of poly(3-hydroxybutyrate) accumulating cells. Appl. Microbiol. Biotechnol. 2015, 100, 1365–1376. [Google Scholar] [CrossRef] [PubMed]
- Zhang, M.; Thomas, N.L. Blending polylactic acid with polyhydroxybutyrate: The effect on thermal, mechanical, and biodegradation properties. Adv. Polym. Technol. 2011, 30, 67–79. [Google Scholar] [CrossRef]
- Furukawa, T.; Sato, H.; Murakami, R.; Zhang, J.; Duan, Y.; Noda, I.; Ochiai, S.; Ozaki, Y. Structure, Dispersibility, and Crystallinity of Poly(hydroxybutyrate)/Poly(l-lactic acid) Blends Studied by FT-IR Microspectroscopy and Differential Scanning Calorimetry. Macromolecules 2005, 38, 6445–6454. [Google Scholar] [CrossRef]
- Abdelwahab, M.A.; Flynn, A.; Chiou, B.-S.; Imam, S.H.; Orts, W.J.; Chiellini, E. Thermal, mechanical and morphological characterization of plasticized PLA–PHB blends. Polym. Degrad. Stab. 2012, 97, 1822–1828. [Google Scholar] [CrossRef]
- Arrieta, M.P.; Fortunati, E.; Dominici, F.; López, J.; Kenny, J.M. Bionanocomposite films based on plasticized PLA–PHB/cellulose nanocrystal blends. Carbohydr. Polym. 2015, 121, 265–275. [Google Scholar] [CrossRef]
- Zhao, Q.; Cheng, G.; Song, C.; Zeng, Y.; Tao, J.; Zhang, L. Crystallization behavior and biodegradation of poly(3-hydroxybutyrate) and poly(ethylene glycol) multiblock copolymers. Polym. Degrad. Stab. 2006, 91, 1240–1246. [Google Scholar] [CrossRef]
- Masood, F.; Aziz, M.; Haider, H.; Shakil, O.; Yasin, T.; Hameed, A. Biodegradation of gamma irradiated poly-3-hydroxybutyrate/sepiolite nanocomposites. Int. Biodeterior. Biodegrad. 2018, 126, 1–9. [Google Scholar] [CrossRef]
- Bonartseva, G.A.; Zharkova, I.I.; Yakovlev, S.G.; Myshkina, V.L.; Makhina, T.K.; Zernov, A.L.; Kudryashova, K.S.; Feofanov, A.V.; Akulina, E.A.; Ivanova, E.V.; et al. 3D-Scaffolds from Poly(3-hydroxybutyrate)Poly(ethylene glycol) Copolymer for Tissue Engineering. J. Biomater. Tissue Eng. 2016, 6, 42–52. [Google Scholar] [CrossRef]
- González-Pleiter, M.; Tamayo-Belda, M.; Pulido-Reyes, G.; Amariei, G.; Leganés, F.; Rosal, R.; Fernández-Piñas, F. Secondary nanoplastics released from a biodegradable microplastic severely impact freshwater environments. Environ. Sci. Nano 2019, 6, 1382–1392. [Google Scholar] [CrossRef]
- Zheng, Z.; Bei, F.-F.; Tian, H.-L.; Chen, G.-Q. Effects of crystallization of polyhydroxyalkanoate blend on surface physicochemical properties and interactions with rabbit articular cartilage chondrocytes. Biomaterials 2005, 26, 3537–3548. [Google Scholar] [CrossRef] [PubMed]
- Bonartseva, G.A.; Zharkova, I.I.; Voinova, V.; Kuznetsova, E.S.; Zhuikov, V.A.; Makhina, T.K.; Myshkina, V.L.; Potashnikova, D.; Chesnokova, D.; Khaydapova, D.D.; et al. Poly(3-hydroxybutyrate)/poly(ethylene glycol) scaffolds with different microstructure: The effect on growth of mesenchymal stem cells. 3 Biotech 2018, 8, 328. [Google Scholar] [CrossRef]
- Kovalcik, A.; Obruca, S.; Kalina, M.; Machovský, M.; Enev, V.; Jakesova, M.; Sobkova, M.; Marova, I. Enzymatic Hydrolysis of Poly(3-Hydroxybutyrate-co-3-Hydroxyvalerate) Scaffolds. Materials 2020, 13, 2992. [Google Scholar] [CrossRef]
- Zaheer, M.R.; Kuddus, M. PHB (poly-β-hydroxybutyrate) and its enzymatic degradation. Polym. Adv. Technol. 2018, 29, 30–40. [Google Scholar] [CrossRef]
- Tokiwa, Y.; Suzuki, T. Hydrolysis of copolyesters containing aromatic and aliphatic ester blocks by lipase. J. Appl. Polym. Sci. 1981, 26, 441–448. [Google Scholar] [CrossRef]
- Numata, K.; Abe, H.; Iwata, T. Biodegradability of Poly(hydroxyalkanoate) Materials. Materials 2009, 2, 1104–1126. [Google Scholar] [CrossRef]
- Zhuikov, V.A.; Bonartseva, G.A.; Makhina, T.K.; Myshkina, V.L.; Voinova, V.; Bonartseva, G.A.; Shaitan, K.V. Hydrolytic Degradation of Poly(3-Hydroxybutyrate) and Its Copolymer with 3-Hydroxyvalerate of Different Molecular Weights in vitro. Biophysics 2018, 63, 169–176. [Google Scholar] [CrossRef]
- Sudesh, K.; Abe, H.; Doi, Y. Synthesis, structure and properties of polyhydroxyalkanoates: Biological polyesters. Prog. Polym. Sci. 2000, 25, 1503–1555. [Google Scholar] [CrossRef]
- Rebia, R.A.; Rozet, S.; Tamada, Y.; Tanaka, T. Biodegradable PHBH/PVA blend nanofibers: Fabrication, characterization, in vitro degradation, and in vitro biocompatibility. Polym. Degrad. Stab. 2018, 154, 124–136. [Google Scholar] [CrossRef]
- Mochizuki, M.; Hirami, M. Structural effects on the biodegradation of aliphatic polyesters. Polym. Adv. Technol. 1997, 8, 203–209. [Google Scholar] [CrossRef]
- Hocking, P.J.; Marchessault, R.H.; Timmins, M.R.; Lenz, R.W.; Fuller, R.C. Enzymatic Degradation of Single Crystals of Bacterial and Synthetic Poly(β-hydroxybutyrate). Macromolecules 1996, 29, 2472–2478. [Google Scholar] [CrossRef]
- Zhuikov, V.A.; Zhuikova, Y.V.; Makhina, T.K.; Myshkina, V.L.; Rusakov, A.; Useinov, A.; Voinova, V.; Bonartseva, G.A.; Berlin, A.A.; Bonartseva, G.A.; et al. Comparative Structure-Property Characterization of Poly(3-Hydroxybutyrate-Co-3-Hydroxyvalerate)s Films under Hydrolytic and Enzymatic Degradation: Finding a Transition Point in 3-Hydroxyvalerate Content. Polymers 2020, 12, 728. [Google Scholar] [CrossRef] [PubMed]
- D’Amico, D.; Montes, M.I.; Manfredi, L.B.; Cyras, V.P. Fully bio-based and biodegradable polylactic acid/poly(3-hydroxybutirate) blends: Use of a common plasticizer as performance improvement strategy. Polym. Test. 2016, 49, 22–28. [Google Scholar] [CrossRef]
- Karahaliloglu, Z.; Ercan, B.; Taylor, E.N.; Chung, S.; Denkbaş, E.B.; Webster, T.J. Antibacterial Nanostructured Polyhydroxybutyrate Membranes for Guided Bone Regeneration. J. Biomed. Nanotechnol. 2015, 11, 2253–2263. [Google Scholar] [CrossRef]
- Jendrossek, D.; Pfeiffer, D. New insights in the formation of polyhydroxyalkanoate granules (carbonosomes) and novel functions of poly(3-hydroxybutyrate). Environ. Microbiol. 2014, 16, 2357–2373. [Google Scholar] [CrossRef]


| Sample | PBS | Lipase | ||
|---|---|---|---|---|
| kD (Week−1) | R2 | kD (Week−1) | R2 | |
| PHB | 0.12 ± 0.01 | 0.96 | 0.28 ± 0.046 0.01 ± 0.002 * | 0.97 0.98 |
| PLA | 0.1 ± 0.009 | 0.97 | 0.26 ± 0.035 0.07 ± 0.02 * | 0.98 0.93 |
| PHB/PLA | 0.07 ± 0.01 | 0.97 | 0.07 ± 0.007 | 0.96 |
| Degradation Model | Polymer Sample | R2 Nonautocatalic Model | R2 Autocatalic Model |
|---|---|---|---|
| Non-enzymatic | PHB | 0.91 | 0.85 |
| PLA | 0.97 | 0.97 | |
| PHB/PLA | 0.87 | 0.84 | |
| Enzymatic | PHB | 0.76 | 0.61 |
| PLA | 0.90 | 0.83 | |
| PHB/PLA | 0.94 | 0.91 | |
| Cell-cultivating | PHB | 0.95 | 0.93 |
| PLA | 0.85 | 0.74 | |
| PHB/PLA | 0.97 | 0.98 |
| Polymer | Samples | Tm (PHB), °C | Tm (PLA), °C | Xc (PHB), % | Xc (PLA), % |
|---|---|---|---|---|---|
| PHB | Fresh | 176.5 | --- | 63.0 | --- |
| NE | 175.0 | - | 58.6 | - | |
| En | 176.1 | - | 64.0 | - | |
| PLA | Fresh | - | 148.1 | - | 34.0 |
| NE | - | 153.4 | - | 29.2 | |
| En | - | 147.0 | - | 29.5 | |
| PHB/PLA | Fresh | 175.4 | 146.6 | 46.7 | 18.5 |
| NE | 175.2 | 151.3 | 52.1 | 21.5 | |
| En | 174.8 | 147.0 | 66.3 | 13.2 |
| Polymer Films | Molecular Weight Loss, % | ||
|---|---|---|---|
| Enzymatic Degradation | Non-Enzymatic Degradation | Cell Experiment | |
| PHB | 45 ± 2.2 | 27 ± 1.3 | 21 ± 1 |
| PLA | 42 ± 2.1 | 25 ± 1.2 | 33 ± 1.6 |
| PHB/PLA | 23 ± 1.2 | 14 ± 0.7 | 10 ± 0.5 |
Publisher’s Note: MDPI stays neutral with regard to jurisdictional claims in published maps and institutional affiliations. |
© 2020 by the authors. Licensee MDPI, Basel, Switzerland. This article is an open access article distributed under the terms and conditions of the Creative Commons Attribution (CC BY) license (http://creativecommons.org/licenses/by/4.0/).
Share and Cite
Zhuikov, V.A.; Akoulina, E.A.; Chesnokova, D.V.; Wenhao, Y.; Makhina, T.K.; Demyanova, I.V.; Zhuikova, Y.V.; Voinova, V.V.; Belishev, N.V.; Surmenev, R.A.; et al. The Growth of 3T3 Fibroblasts on PHB, PLA and PHB/PLA Blend Films at Different Stages of Their Biodegradation In Vitro. Polymers 2021, 13, 108. https://doi.org/10.3390/polym13010108
Zhuikov VA, Akoulina EA, Chesnokova DV, Wenhao Y, Makhina TK, Demyanova IV, Zhuikova YV, Voinova VV, Belishev NV, Surmenev RA, et al. The Growth of 3T3 Fibroblasts on PHB, PLA and PHB/PLA Blend Films at Different Stages of Their Biodegradation In Vitro. Polymers. 2021; 13(1):108. https://doi.org/10.3390/polym13010108
Chicago/Turabian StyleZhuikov, Vsevolod A., Elizaveta A. Akoulina, Dariana V. Chesnokova, You Wenhao, Tatiana K. Makhina, Irina V. Demyanova, Yuliya V. Zhuikova, Vera V. Voinova, Nikita V. Belishev, Roman A. Surmenev, and et al. 2021. "The Growth of 3T3 Fibroblasts on PHB, PLA and PHB/PLA Blend Films at Different Stages of Their Biodegradation In Vitro" Polymers 13, no. 1: 108. https://doi.org/10.3390/polym13010108
APA StyleZhuikov, V. A., Akoulina, E. A., Chesnokova, D. V., Wenhao, Y., Makhina, T. K., Demyanova, I. V., Zhuikova, Y. V., Voinova, V. V., Belishev, N. V., Surmenev, R. A., Surmeneva, M. A., Bonartseva, G. A., Shaitan, K. V., & Bonartsev, A. P. (2021). The Growth of 3T3 Fibroblasts on PHB, PLA and PHB/PLA Blend Films at Different Stages of Their Biodegradation In Vitro. Polymers, 13(1), 108. https://doi.org/10.3390/polym13010108