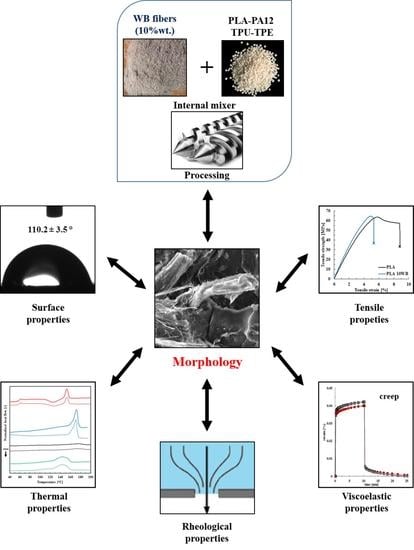
3.1. Characterization of the WB Fibers
The main properties of the wet blue (WB) fibers used in this work are reported in
Table 1. From a morphological point of view, WB fibers presented a fibrous backbone with a mean size diameter of around 70 μm, which branched into tiny exfoliated fibers (22 μm) and entangled quasi-spherical coarse clusters (222 μm) along the edge of the fiber backbone (
Figure 1). Despite the simultaneous presence of these three different structures, the WB fibers had overall good homogeneity in terms of shape and mean diameters. The presence of branched and rough tiny fibers is a positive feature since they have higher chances of mechanically interlocking with the polymer chains during the melt compounding phase. However, the presence of coarse clusters could negatively affect the mechanical performances of composites since they could inhibit or limit the correct orientation of the fibers during the injection molding process, leading to a not-oriented, less resistant composite product [
32,
33]. Finally, the density of the WB fibers (
Table 1) was low (apparent and real densities of 190 and 300 g dm
3, respectively), evidencing the possibility to obtain lightened composite materials.
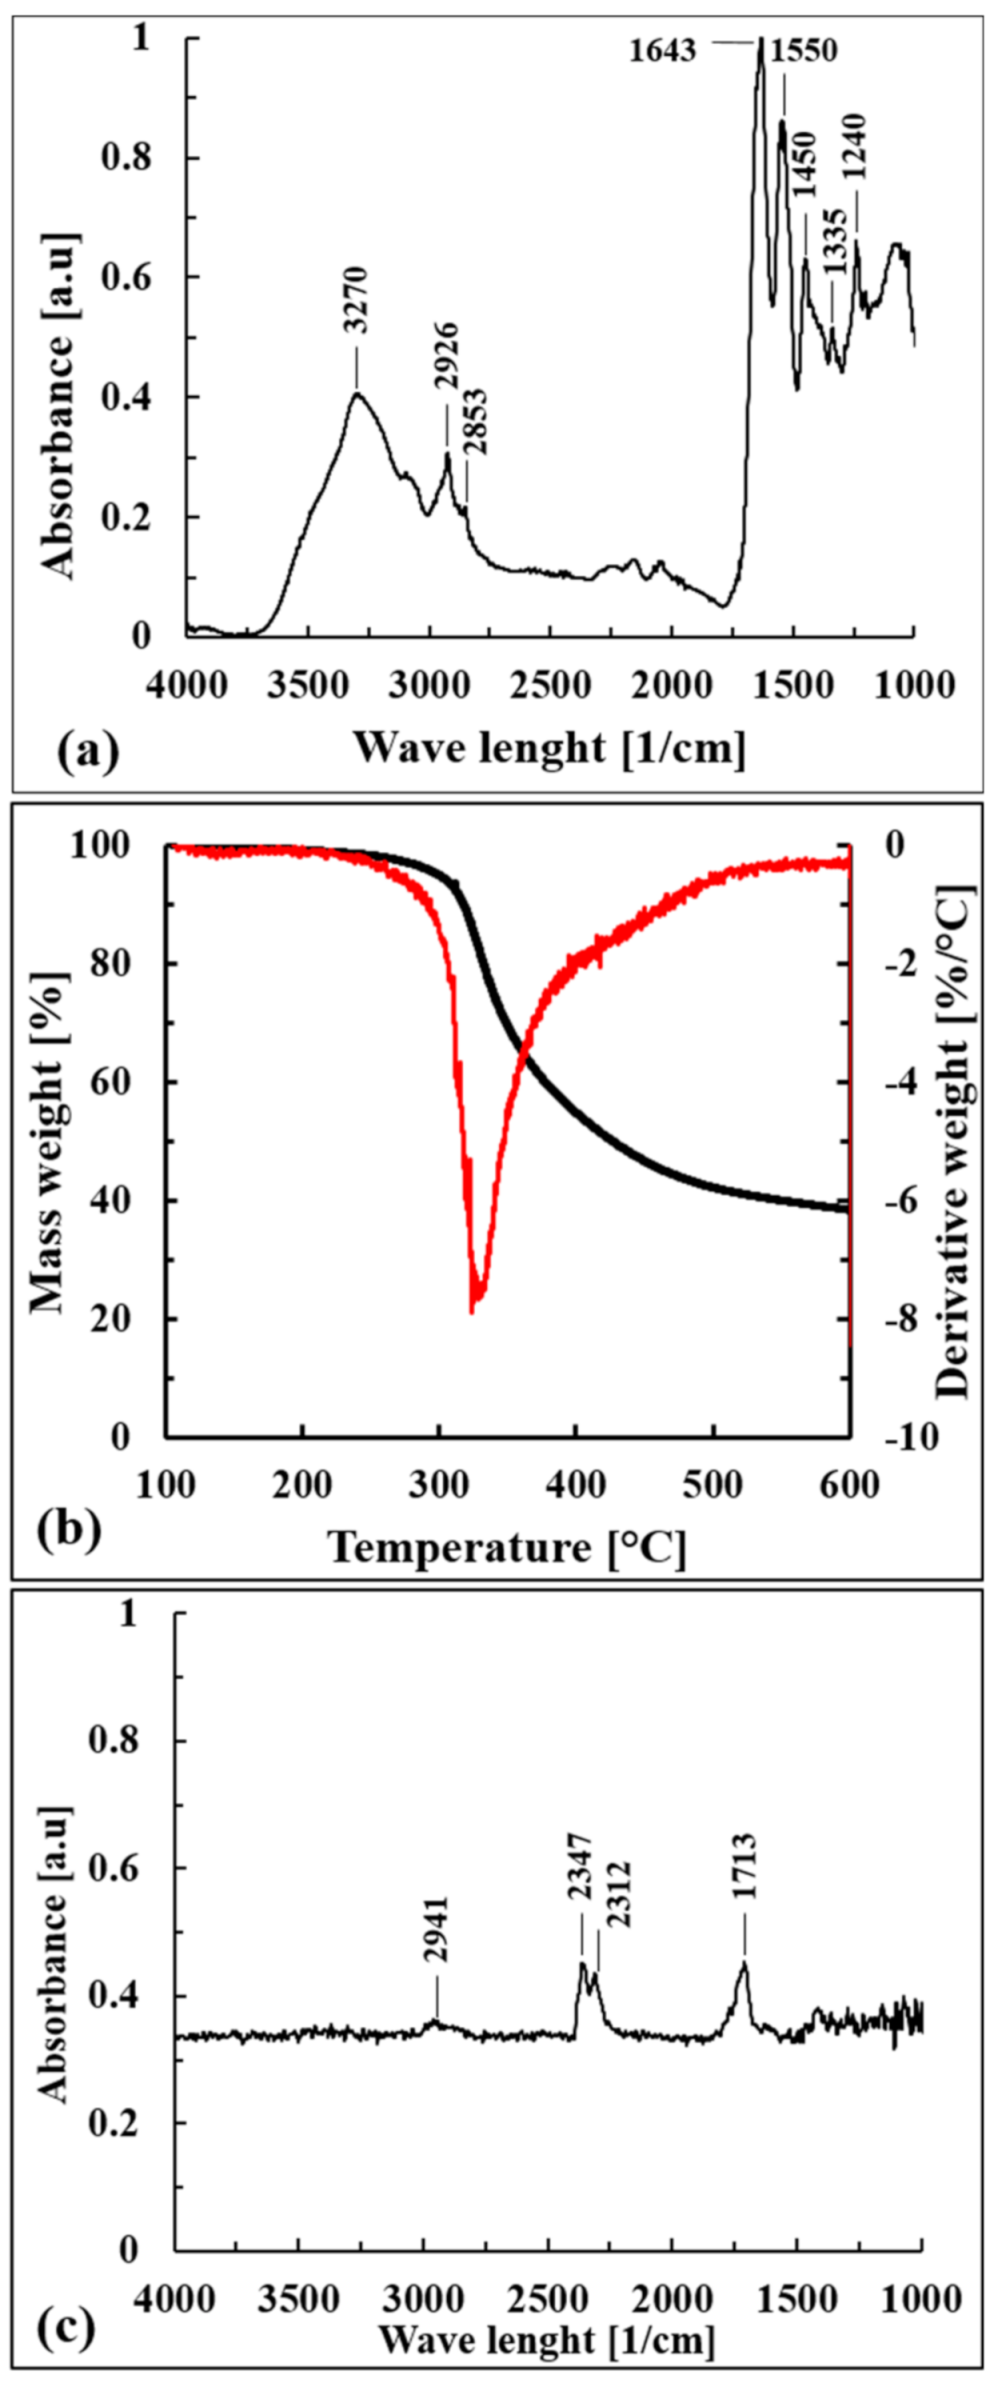
From a chemical point of view, the FT-IR (ATR) spectrum shown in
Figure 2a confirmed that the composition was due to bovine skins, which consist mostly of water and proteins such as collagen (29%), keratin (2%), and elastin (0.3%) and minor components such as fats and inorganic substances [
34]. It is possible to recognize the typical signals of NH and OH stretching vibrations (3300–3270 cm
−1), while the peak at 2926 cm
−1 is ascribed to the stretching of the CH group. The amide I vibration, adsorbing near 1650 cm
−1, is ascribed to C=O stretching along with C-N stretching and N-H bending.
The signals near 1550 cm−1 are ascribable to the presence of secondary amides; in particular, they arise from NH bending and CN stretching, with a smaller contribution of CO bending. The peaks in the region from 1400 to 1200 cm−1 are ascribed to the presence of tertiary amides; they are associated with NH bending and CN stretching, with a smaller contribution of CO bending and CC stretching.
Dried WB fibers showed an intrinsic pronounced thermal stability, as confirmed by the thermogravimetric data reported in
Table 1 and by the curves shown in
Figure 2b. WB fibers degraded in one mass loss step between 300 °C and 330 °C, and the FT-IR spectrum of released gases at T
peak (328.6 °C) is reported in
Figure 2c.
The asymmetrical stretching bands of CO
2 (2312–2347 cm
−1), the C=O carbonyl stretching band (1713 cm
−1), and the CH stretching band (2941 cm
−1) can be detected. These reveled peaks could be associated to the direct decarboxylation of free –COOH groups of carboxylic acids, generally present in high amounts in bovine collagen [
35], that would have formed carbon dioxide and/or to the reactions of dehydration of intramolecular amino acids [
36] that would have mainly formed degradative products with carbonyl groups. The CH stretching absorption could be attributed to the formation of hydrocarbons, probably ethane [
36], and/or to the degradation of organic products containing carbonyl groups. Nevertheless, further works should confirm these hypotheses through mass spectrometry, which is more capable for the purpose.
From a technological point of view, WB fibers were also found stable in isothermal conditions (200 °C) for around 10 min, evidencing the possibility of processing these natural fibers within internal-mixer or twin-screw extruders for significant residence times without encountering degradation.
3.2. Processability of the WB-Based Composites
The processing behavior of WB-based composites during the melt-mixing step was investigated, recording the torque as a function of time. Generally, the torque rapidly increases when the polymer and fibers are added to the internal mixer, since polymer pellets are still in the solid state, and subsequently, the torque starts to decrease as a consequence of the melting or softening of the polymer matrix. After a certain time (generally 4–10 min), which depends on the processing conditions such as temperature and screw speed and on the polymer and fiber typologies, the torque reaches a steady state and a stable value, indicating that the entire polymer has melted (or softened) and fibers (or fillers) have been well dispersed and distributed in the polymer matrix [
37]. The equilibrium values of the torque (T) of the WB-based samples are reported in
Figure 3a, where it can be noted that the addition of 10 wt.% of WB fibers increased the T values of respective neat polymers. This expected phenomenon is explainable by the fact that WB fibers increase the melt viscosity of the polymer and thus the torque value, as similarly reported in other works [
38,
39,
40]. Nevertheless, from a comparative point of view, the increase in torque for PA12- and, especially, PLA-based composites is much higher than for TPE- and TPU-based formulations. Since PLA and PA12 present polar groups in the polymer backbone, their interactions with polar WB fibers are much stronger than in the case of TPE- and TPU-based samples, and the required mixing energy is therefore significantly higher. It is reasonable to believe that this pronounced affinity exhibited during the compounding step would be positively reflected in the morphological and mechanical properties of the PLA10WB sample.
The increased melt viscosity of WB-based composites was also testified by the mass melt flow rate (MFR) values reported in
Figure 3b, from which it can be observed that MFR values of polymers decreased by around 10–20% by WB addition, similarly to other works on composites [
41]. In parallel, as reported in
Table 2, the thermal stability of neat polymers was lowered by WB fibers by around 5–30 °C. This result was expected, since natural fibers or fillers generally lower polymer stability [
42] and thus their resulting composites start to degrade at lower temperatures. Nevertheless, from a technological point of view, both increases in viscosity and decreases in thermal stability did not significantly affect the injection molding processing, since it was conducted under the same conditions of neat polymers, at temperatures well below the degradative temperatures (T
5 and T
15).
3.4. Mechanical and Morphological Properties of the WB-Based Composites
In
Table 4, the tensile and impact properties of the WB-based composites are summarized. It can be noticed that WB fibers improved the Young modulus of the investigated polymers from around 20%, in the case of PLA and TPE, up to 36% and 58%, in the case of PA12 and TPU, respectively. This pronounced gain can be explained by the higher stiffness of the WB fibers if compared to the polymer matrices. In addition, since the elastic modulus of composites is dependent on the volume fraction of the added fiber/filler (and not on their weight fraction), the lightness of the WB fibers would explain the significant gain in stiffness despite the loading at just 10 wt.% (which in fact corresponds to 25–31% in volume). In contrast, tensile strength and elongation at break values were found lowered by the addition of WB fibers in all samples, except PLA10WB (
Figure 5). In composites, these mechanical properties mainly depend on morphological aspects such as the distribution and dispersion of the fibers within the polymer matrix and the interfacial adhesion between the polymer and the fibers [
32]. Generally, the distribution and dispersion of natural fibers is not easily estimated, both quantitatively and qualitatively, since they are mainly formed by cellulose, hemicellulose, and lignin, which have the same elemental composition as polymer matrices [
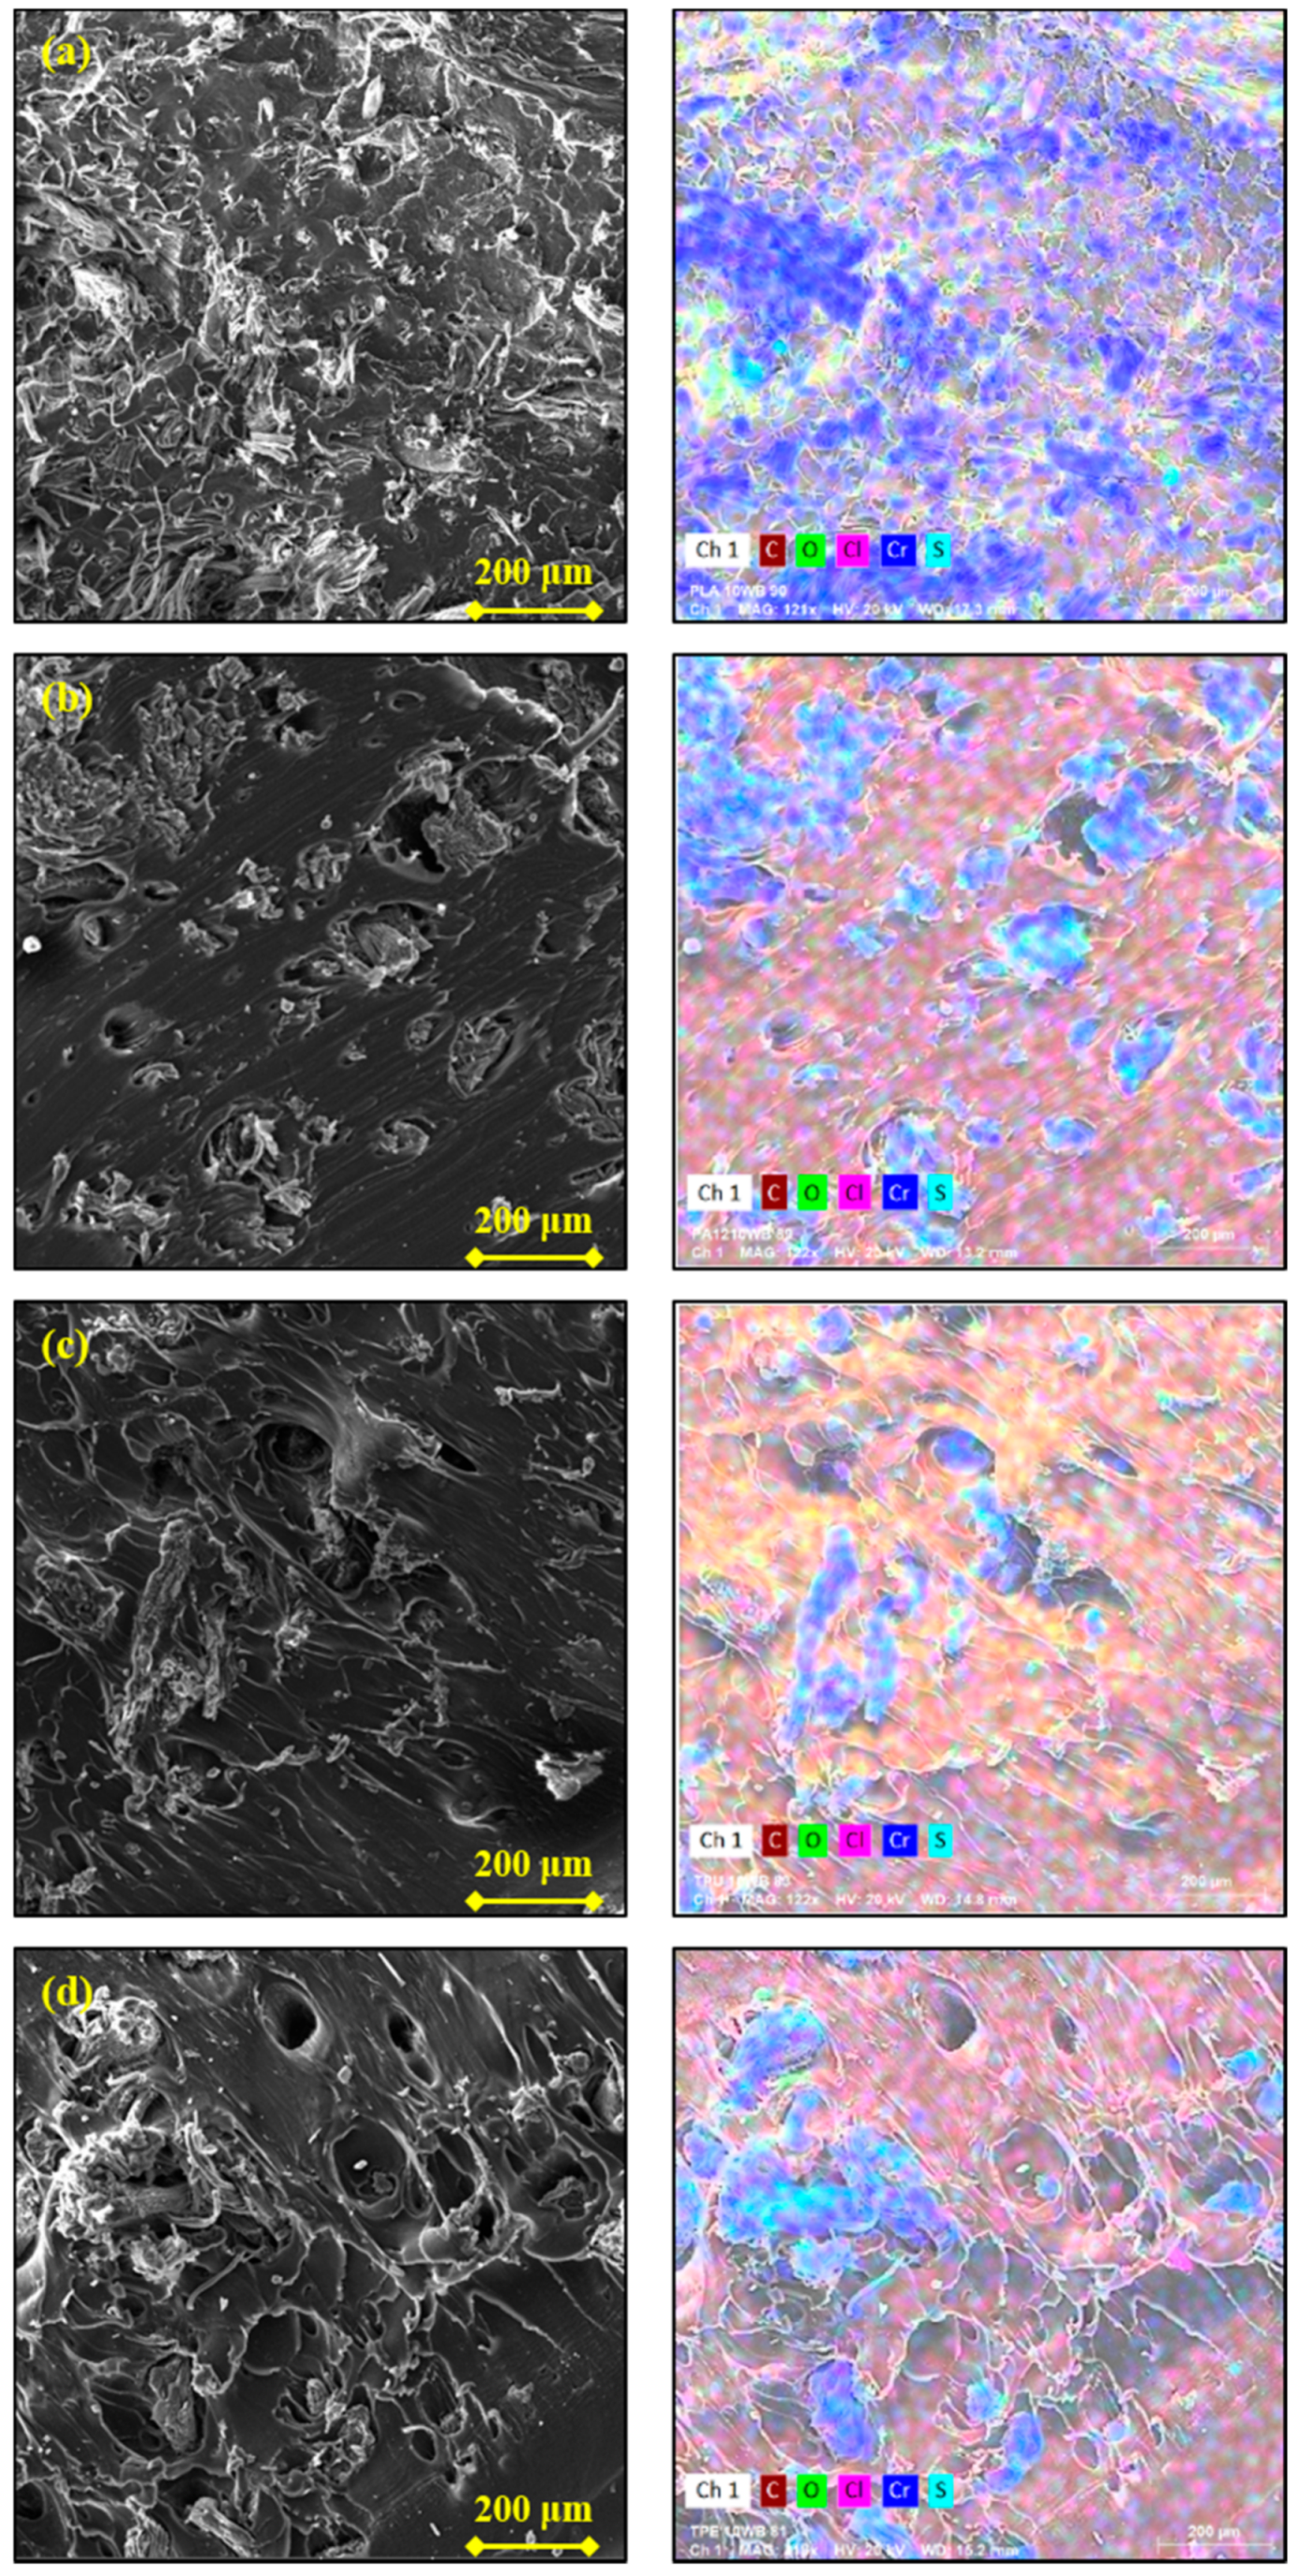
44]. In this case, because of the presence of inorganic elements and compounds such as chromium, sodium chloride, and sulfur, it was possible to evaluate qualitatively the WB dispersion and distribution within the different polymer matrices through energy-dispersive X-ray spectroscopy (EDS).
The SEM images of the WB-based samples taken at low magnification (200×) and their corresponding EDS maps are reported in
Figure 6. It is possible to notice that within TPU and TPE matrices, WB fibers formed aggregates and they were not homogenously distributed through the polymer matrix (
Figure 6c,d). In contrast, the distribution and dispersion of WB fibers was still good within PA1210WB and excellent within PLA.
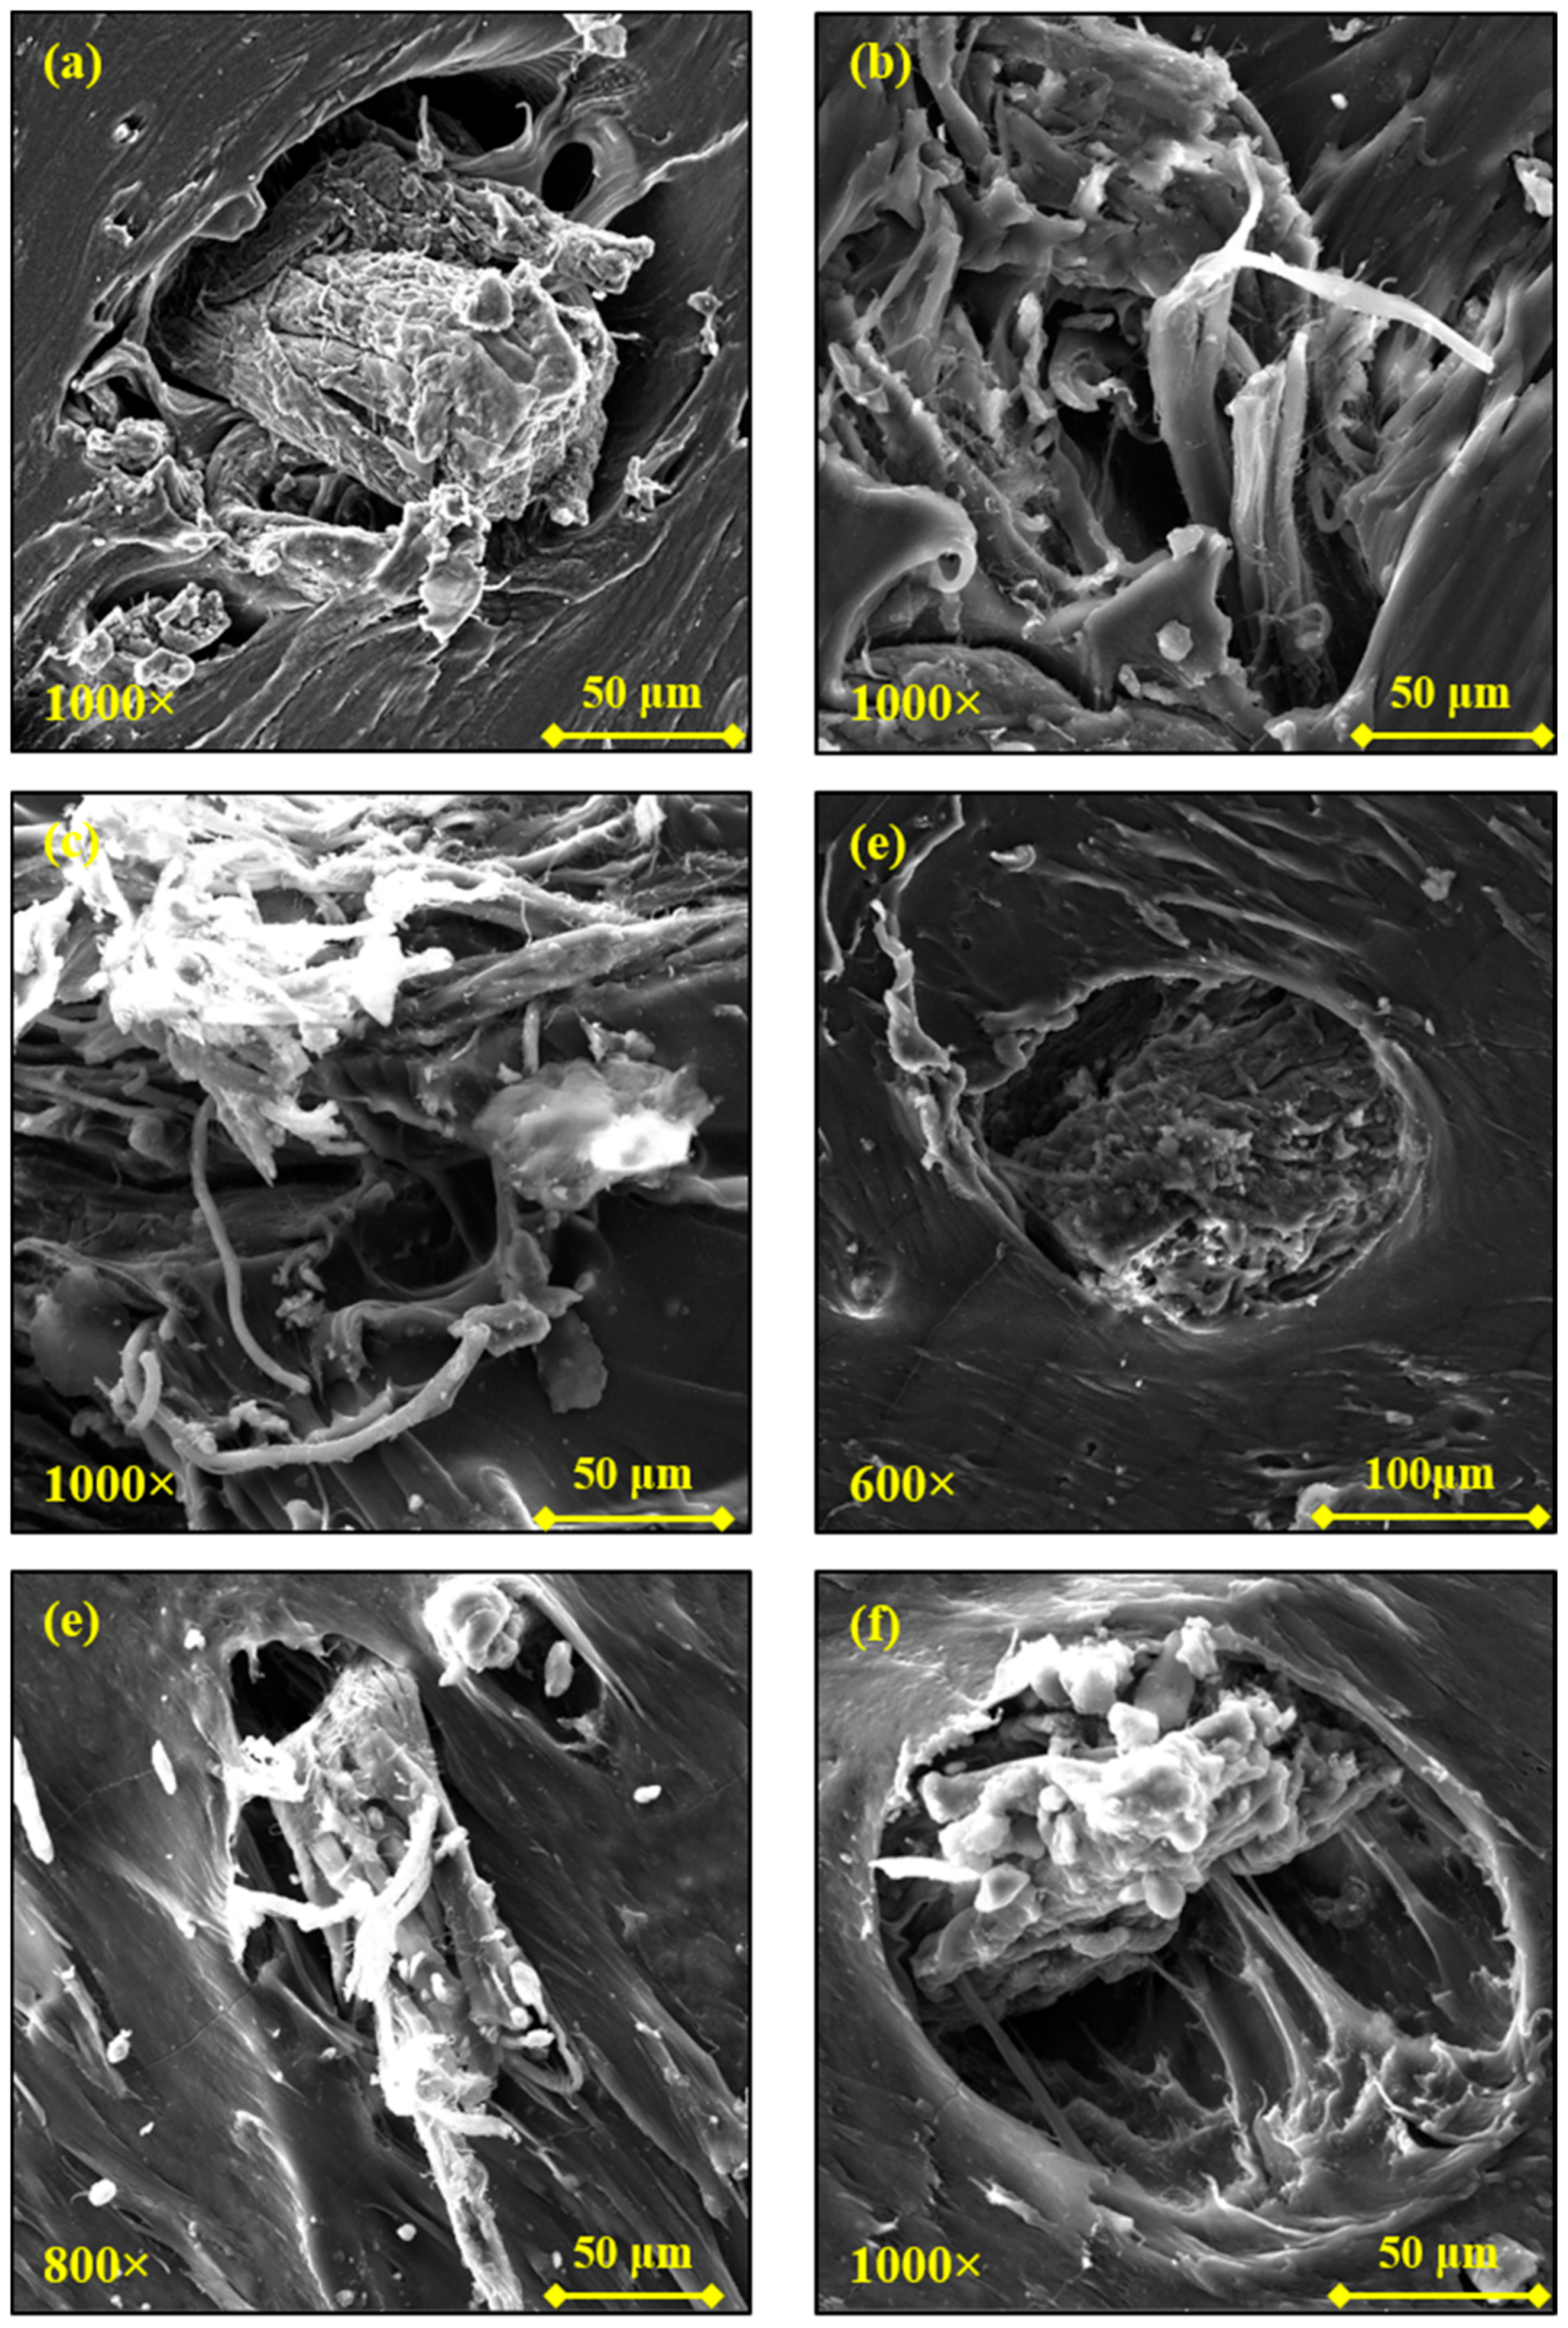
In the case of PLA, the excellent dispersion and distribution is also due to the fact that WB fibers appear de-fibered and branched in nanofibers, which therefore occupy the polymer matrix better and more uniformly. These tiny WB fibers are depicted in
Figure 7, from which it can also be noticed how they are perfectly bonded with the polymer (
Figure 7c), since the decrease in the fiber diameter enhances the fiber–matrix interface and the fiber wettability [
45].
This phenomenon, even if in a limited way, was also observable in PA12 composites (
Figure 8a,b), while it was absent in the TPU- and TPE-based composites (
Figure 8c–f). These observations are perfectly consistent with the torque analysis previously described: the higher torque values recorded during the processing of PA12- and, especially, PLA-based samples could have aided the de-fibering of the WB.
Nevertheless, cap-shaped cavities were also recognized within the PA1210WB surface, indicating that some WB fibers are poorly connected with the PA12 matrix. As a consequence of this poor polymer–fiber adhesion, the tensile strength (TS
max) and elongation at break (
) values of the PA1210WB sample were lowered by around 35% and 66%, respectively, compared with neat PA12. Analogously, TPU10WB showed a similar decrease in those properties (−44% and −57%) despite much fewer voids detected across its surface. As previously mentioned, TPU10WB did not present de-fibered WB. Therefore, it can be supposed that mechanical properties overly reflect and balance the concomitant presence of positive and negative morphological aspects, as reported in
Table 5. Thus, the TPE10WB sample, which exhibited not-ideal WB dispersion and distribution and poor fiber–matrix adhesion (high presence of voids) and was not subjected to de-fibering effects, showed the worst mechanical performance, as confirmed by the dramatic loss in the elongation at break value (
Table 4). In contrast, the PLA10WB composite showed enhanced tensile strength as a consequence of its excellent morphological properties.
From a chemical point of view, these morphological and mechanical behaviors are connected with the chemical structure of the investigated polymers. In particular, hydrophilic WB fibers are able to interact significantly with the polar ester groups of PLA to partially interact with the polar urethane groups of TPU [
46] and with the polar amide linkages of PA12 [
47] and to poorly join with non-polar TPE.
The water contact angle values of investigated samples are reported in
Table 4. Considering and comparing neat polymers, the obtained values are in perfect agreement with the polarity of the polymer matrices, as previously discussed. Indeed, PLA showed the lower water contact angle (90.6°), followed by PA12 (98.9°), TPU (119.9°), and TPE (124.0°). In contrast, considering reinforced polymers, the addition of WB fibers increased the contact angle values of each polymer, except TPE. This fact was unexpected since hydrophilic fibers generally increase the surface wettability of polymers. Other authors [
48,
49] have reported a similar behavior investigating wood plastic composites formed by wood flours and/or fibers and polyolefins, but an explanation of the phenomenon was not furnished. Our interpretation is that the exfoliated nanofibers could have reached the polymer surface and, therefore, the contact angle values would have been increased because of this induced roughness on the polymer surface (
Figure 9c). A similar explanation was also furnished in [
50], where the insertion of glass fibers in a rubber matrix generated a morphological effect of roughening able to overcome the polar character of the SiO
2 glass groups and thus to increase the surface hydrophobicity of the rubber. In addition, this hypothesis seems to be supported by the fact that the TPE10WB sample, which did not manifest de-fibering phenomena, showed a decreased water contact angle. Nevertheless, further works should investigate this possibility in depth.
Finally, the PLA10WB sample exhibited an enhanced impact resistance (+11%) compared with neat PLA, indicating the ability of WB fibers to also act as energy absorption fibers, similar to what has been observed in other PLA-based composites [
51,
52].
3.5. Viscoelastic Properties of the WB-Based Composites
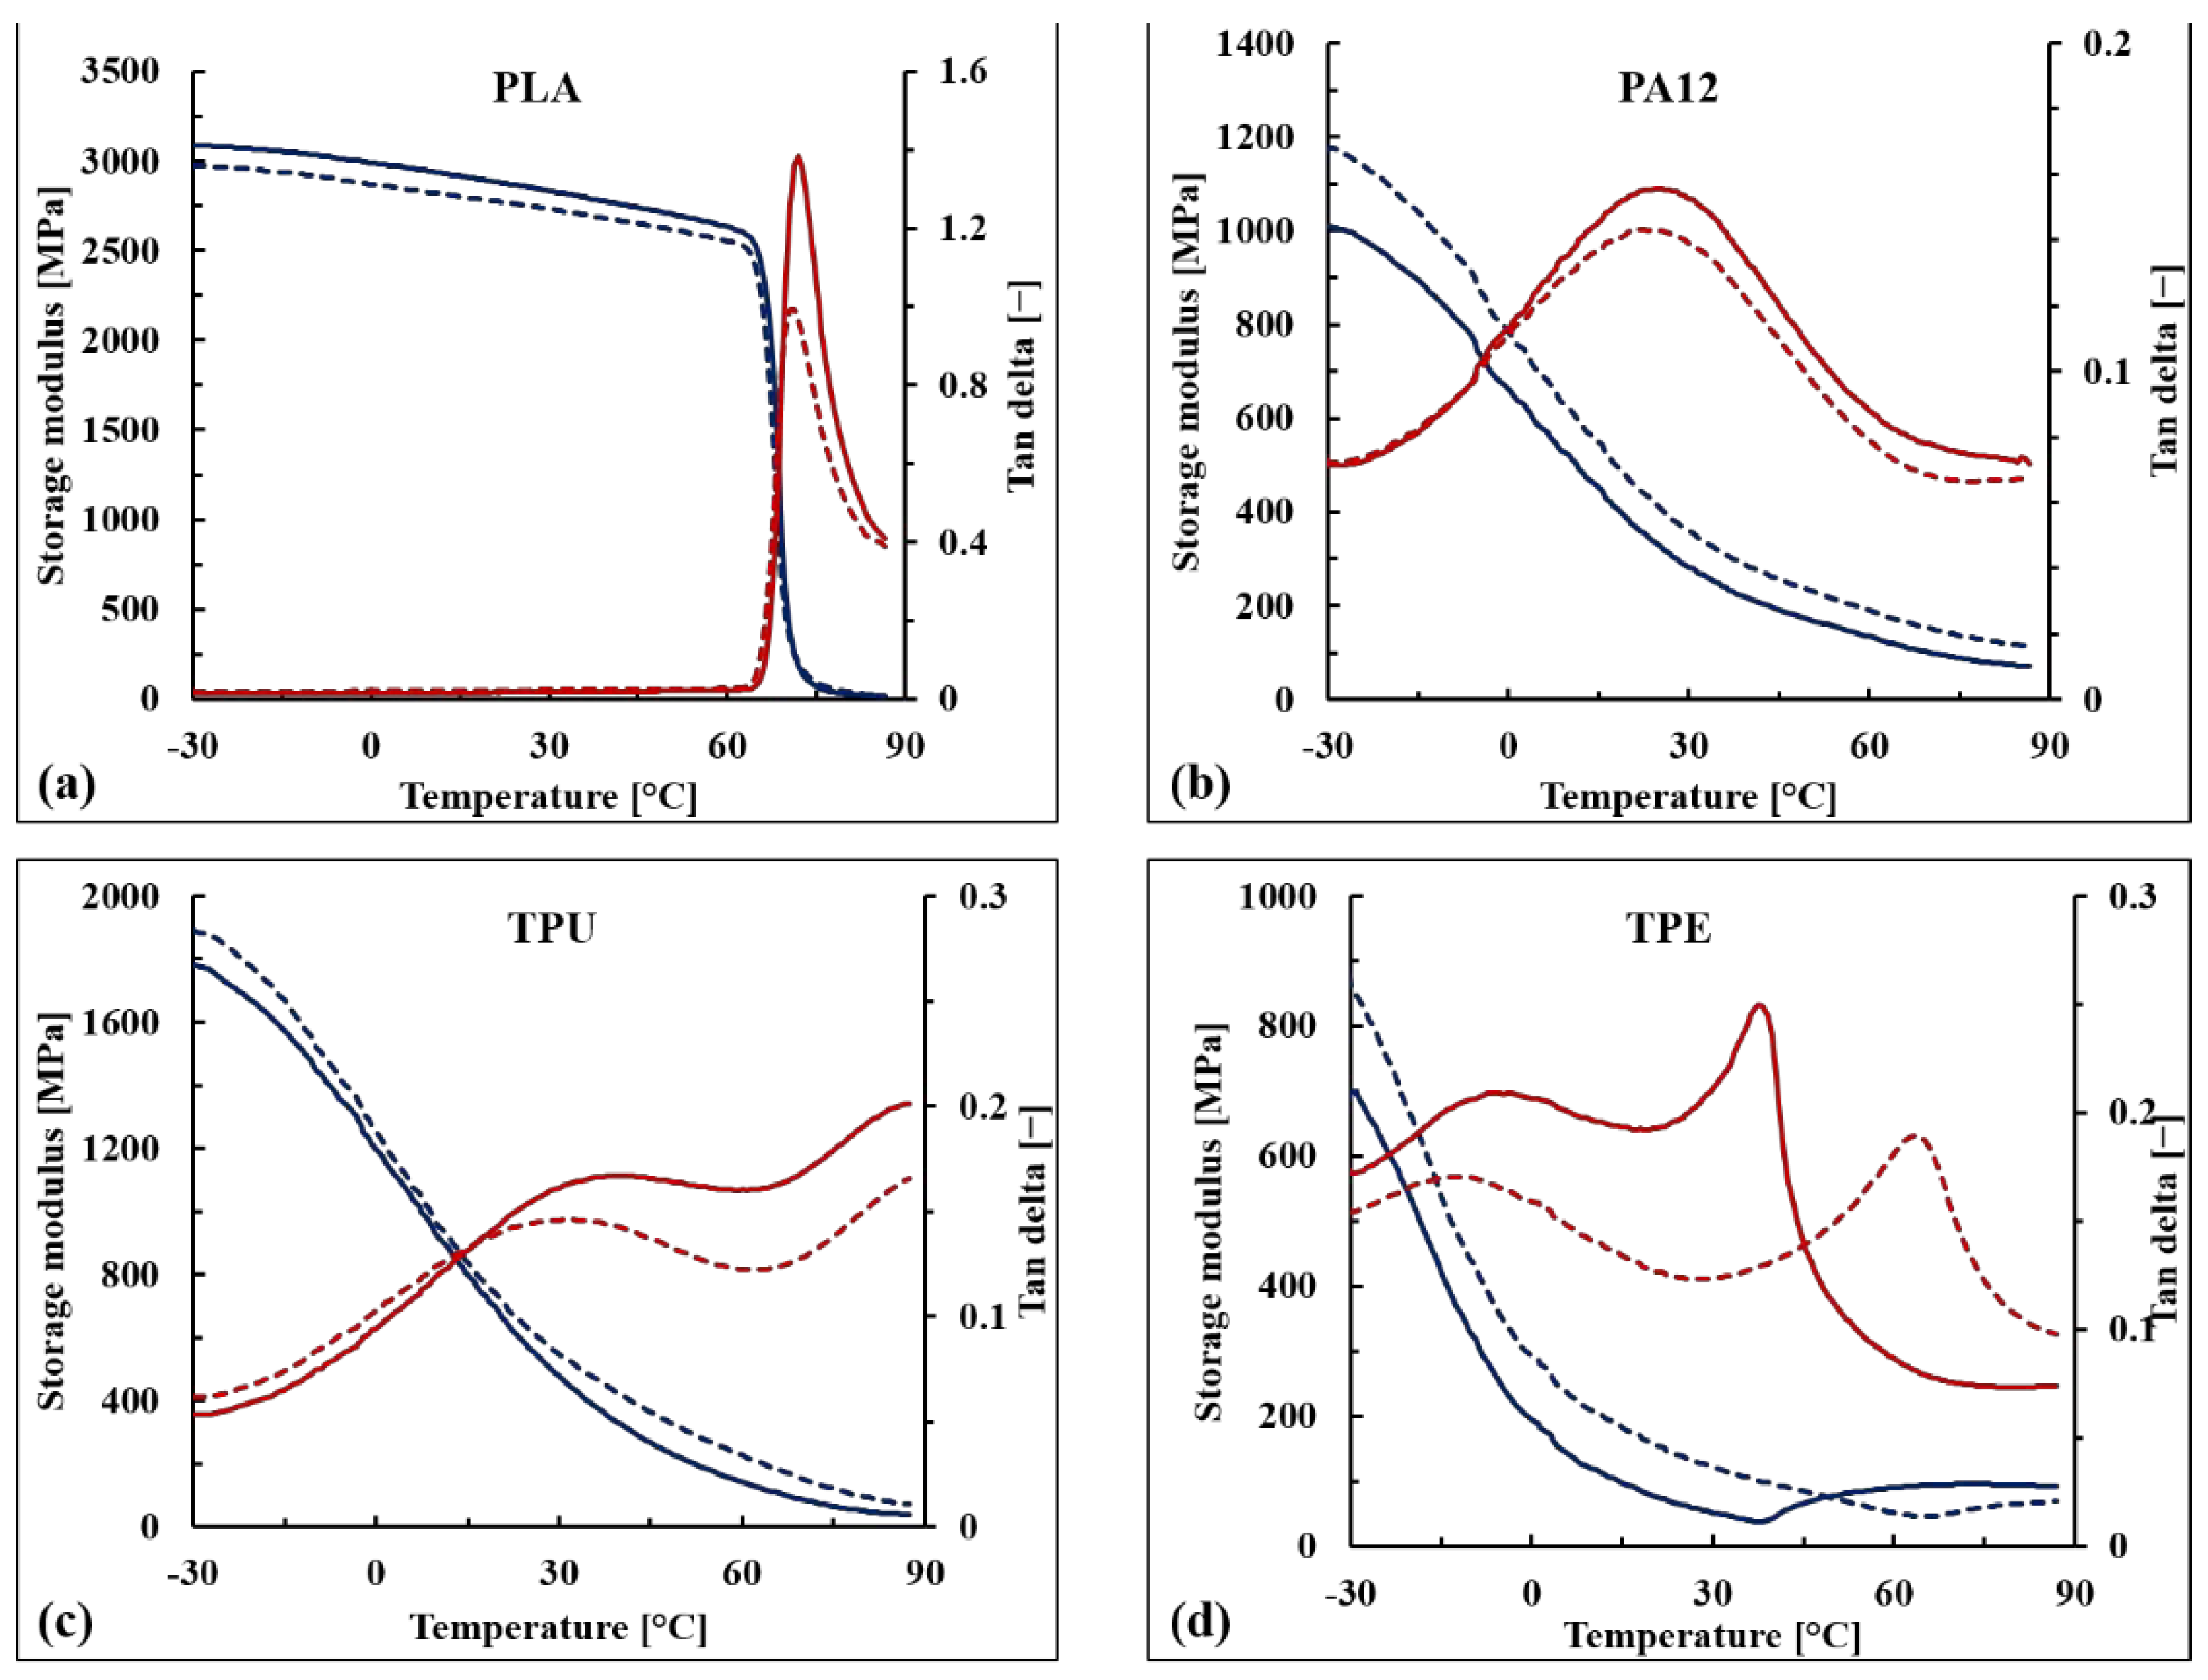
The storage modulus (E’) and the damping factor (tan δ) of the WB-based samples are reported as a function of temperature in
Figure 10 as well as in
Table 6. Similar to what was observed for the tensile modulus, the stiffening effect of the WB fibers was confirmed for PA12-, TPU-, and TPE-based samples within the whole range of tested temperatures (from −30 to 90 °C), and the increments in E’ values were particularly marked above the glass transition temperature (T
g) (+40–60%). This behavior was observed for each formulation, except PLA10WB, which exhibited slightly decreased E’ values compared with neat PLA. This contrasting behavior between storage and elastic moduli could be due to the orientation of the WB fibers that were oriented parallel to the applied force in the case of the tensile modulus, while in the case of DMA, the applied stress was perpendicular to the specimen axis and, thus, to the fiber orientation. This anisotropic behavior has also been observed in other composites reinforced by leather fibers [
53].
Looking at the tan δ curves, it can be noticed that below the glass transition temperature, no significant difference between neat and reinforced polymers is observable. Above T
g, WB-based composites exhibited lower tan δ values, except for TPE, indicating that reinforced samples have a more elastic than viscous nature compared with corresponding neat polymers [
54]. The maximum damping reduction was observed in T
g as a consequence of the stiffness of the WB fibers that affect the relaxation of the neat polymer from the glassy to the rubbery state. Nevertheless, the T
g values of WB-based composites were not particularly affected, indicating that WB fibers did not immobilize the polymer chains [
55].
The unique significant difference in terms of damping behavior was observed when comparing neat TPE with TPE10WB. From a qualitative point of view, the transitions of thermoplastic elastomers are not easy to discuss since they strongly depend on many factors such as the typology and amounts of the elastomeric component, of the polyolefin, and of the oils and additives involved in the formulation [
56]. Regarding the TPE used in this study, the only information provided by the producer was that it is formed by SEBS and polyolefins. According to the literature [
56], different peaks can be recognized in SEBS–polyolefin blends: the glass transition of the soft segment of a styrene–olefin block copolymer (from −70 to −55 °C), the glass transition of the amorphous domain of the polyolefin (from −20 to 10 °C), the α-relaxation of the crystalline phase of the polyolefin (between 50 and 125 °C), and the glass transition of the hard segment of the styrene–olefin block copolymer (between 30 °C and 60 °C).
Looking at the neat TPE curves (
Figure 10d), only two different peaks of tan δ can be observed. The first peak, at around −7 °C, is attributed to the β-relaxation of the amorphous region of the polyolefin (polypropylene and/or polyethylene), while the second one, at around 40 °C, is attributed to the glass transition of the hard segment of styrene-olefin block copolymer. The first transition was not significantly affected by the addition of WB fibers, while the second one increased by around 20 °C. Therefore, it can be supposed that the WB fibers hinder and immobilize the hard segments of the TPE polymer, leading to a much more brittle material. This hypothesis is also supported by the dramatic loss in elongation at break values of TPE10WB, as previously shown.
The creep deformations and strain recovery of the WB-based samples are reported in
Figure 11. Generally, when a polymer is loaded below its elastic limit, there is an instantaneous elastic deformation, followed by a slower, time-dependent, viscoelastic deformation. When the load is removed, an instantaneous elastic recovery takes place, which is followed by a further time-dependent viscoelastic recovery, which may or may not be complete within the given limited time of the test. In this case, a permanent deformation is observable.
The maximum creep compliance (
) and the creep recovery (
) observed during tests, as well as the extrapolated parameter of the models, are reported in
Table 7.
From an overall point of view, the values of PLA-, PA12-, TPU-, and TPE-based composites reduced0 by the addition of around 5%, 44%, 35%, and 44% WB fibers, respectively, compared with neat polymers. In addition, the lowered creep compliance was also maintained for time tending to infinity (), indicating the ability of WB fibers to improve the creep resistance for both short and long times.
In the case of PLA, PA12, and TPE, WB fibers improved both elastic and viscous creep resistance in a comparable way since both and lowered by around 6%, 42%, and 44%, respectively, while in the case of the TPU10WB sample, WB fibers mainly lowered the viscous deformation (+62%) rather than the elastic one (+24%).
Comparing the elastic contribution to the maximum experimental creep compliance (/), it can be noticed that PLA- and PA12-based samples mainly deformed elastically (86% and 76%), while in TPE-based samples both contributions were more involved (56%). Considering the viscous creep compliance limit for times tending to infinity (), it can be observed that it only slightly diverges from in the case of TPE and TPE10WB samples, as also confirmed by the characteristic time , which was just 156 and 206 s. PA12-based samples and neat TPU deformed slower, as confirmed by the / ratio, which was around 83%; meanwhile, TPU10WB reached 97% of the theoretical maximum creep compliance after 10′, since its creep response was mainly elastic. Finally, PLA-based samples showed the highest values, indicating that viscous deformations become significant only after long times of applied stress. In conclusion, WB fibers were able to improve the creep response of the investigated materials, reducing both elastic and viscous deformations. In the case of PLA- and TPU-based samples, the characteristics times were lowered by the addition of WB fibers, evidencing that these composites deform more rapidly but to a lower extent, while PA1210WB and TPE10WB samples deformed less and slowly compared with neat polymers.
As expected, the creep recovery behavior was concordant with the creep compliance analysis previously discussed. Rigid and stiff PLA composites recovered 100% of deformation in just 15 min, and the elastic contribution of recovery represented 86% of the final recovery. Soft materials such as TPU-, TPE-, and PA12-based samples are able to recover around 80–90% of deformation, indicating that a certain part of the viscous compliance is permanent. Nevertheless, the addition of WB fibers mitigates this effect since the viscous compliance is lowered. Moreover, because of the creep, deformation is much more marked in WB-based composites, and their unrecovered strain is low in terms of absolute values (and not in percentages). Therefore, it can be stated that the addition of WB fibers, increasing the viscosity of neat polymers, inhibits the slippage of macromolecular chains and, thus, the permanent strain significantly decreases [
30].

