Abstract
Two factors, the crosslinking degree of the matrix (ν) and the size of the filler (Sz), have significant impact on the Mullins effect of filled elastomers. Herein, the result. of the two factors on Mullins effect is systematically investigated by adjusting the crosslinking degree of the matrix via adding maleic anhydride into a rubber matrix and controlling the particle size of the filler via ball milling. The dissipation ratios (the ratio of energy dissipation to input strain energy) of different filled natural rubber/butadiene rubber (NR/BR) elastomer composites are evaluated as a function of the maximum strain in cyclic loading (εm). The dissipation ratios show a linear relationship with the increase of εm within the test range, and they depend on the composite composition (ν and Sz). With the increase of ν, the dissipation ratios decrease with similar slope, and this is compared with the dissipation ratios increase which more steeply with the increase in Sz. This is further confirmed through a simulation that composites with larger particle size show a higher strain energy density when the strain level increases from 25% to 35%. The characteristic dependence of the dissipation ratios on ν and Sz is expected to reflect the Mullins effect with mathematical expression to improve engineering performance or prevent failure of rubber products.
1. Introduction
Elastomeric materials with fillers have a broad range of industrial applications because of their unique properties, such as high tensile strength, deformability, and toughness. However, the addition of fillers also causes significant inelastic behavior [1,2,3]. When composites are stretched from their virgin state, unloaded and then reloaded, the stress required on reloading is lower than that during the initial loading; this stress softening phenomenon called the Mullins effect [4,5]. The Mullins effect is generally attributed to a continuous damage process; however, the damage mechanisms under a large cyclic applied stress are still not fully understood [6]. The Mullins effect is involved in both the engineering performance and failure of rubber products, therefore, a comprehensive understanding of the Mullins effect is important [7,8,9].
The possible physical mechanisms and mathematical models of the Mullins effect have attracted great attentions from researchers. Mullins et al. [10,11] proposed that filled elastomers have amorphous micro-structures consisting of hard and soft phases. The hard phase transformed into the soft phase during the deformation process, which led to the Mullins effect. This concept has been used to explain the Mullins effect in many filled elastomers [12,13,14,15]. The Mullins effect is also proposed to be based on continuum damage mechanics, and strain constitutive equations coupled with damage was used to describe this effect [16,17,18,19,20]. Other physical mechanisms proposed to explain the Mullins effect include bond rupture [21,22,23,24], molecular slip at the matrix–filler interface [25,26], breakdown of aggregates and agglomerates of filler particles [27,28], and disentanglement [29,30]. It is believed that the mechanisms vary with the nature of the filler and polymer of the filled elastomers [31]. Li et al. divided the energy loss accompanying the Mullins effect into recovery hysteresis (Erh) and softening parts (Es). They found that both Erh and Es were dependent on nanocomposite structure (filler volume fraction and crosslinking degree) [32]. Strain-induced light emission from mechanoluminescent cross-linkers in silica-filled poly(dimethylsiloxane) has been recently used to reveal the covalent bond scission which contributes to the Mullins effect [33]. However, the experimental works mentioned above are complex to achieve in composites, which hinder their wide application. Therefore, establishing a simple method to evaluate the influence of cross-linking degree of matrix and filler size on Mullins effect would promote better understanding of the Mullins effect, and may eventually improve the performance of the products.
Based on Green’s equation (), it is feasible to quantitatively analyze the Mullins effect based on the energy change rather than the stress difference. It is worth noting that the strain interval should be the same when calculating the energy of different loading paths. There is an energy reduction when a filled elastomeric material is subjected to cyclic loading with tension from its initial (virgin) natural configuration, whereas the largest reduction is observed in the first and second cycles. Therefore, it is reasonable to evaluate the Mullins softening with the energy difference corresponding to the same strain between the first and the second cycle. It has been reported that the exact mechanisms of Mullins effect varied with the nature of the polymer and filler of the system. If the energy difference also varies systematically with the polymer and filler of the system, the energy difference would provide a criterion for evaluating the degree of Mullins effect in the experimental range.
In this study, the influence of two key factors, crosslinking degree of matrix and size of filler, on the Mullins effect were systematically investigated. The two key factors were purposely controlled, cross-linking degree was adjusted through via adding maleic anhydride into rubber matrix and particle size of the filler was changed via ball milling. The dissipation ratios during cyclic uniaxial tensile tests were evaluated as functions of the maximum strain in cyclic loading and they showed linear relationships with the increase of the εm within the test range. Crosslinking degree determines the value of the dissipation ratios, but the size of the filler affects the trend of the dissipation ratios with εm, which indicates crosslinking degree and size of filler have different contributions to the Mullins effect. These results provide new insights for designing filled elastomeric materials and predict their behavior.
2. Materials and Methods
2.1. Materials
Natural rubber (RSS1) consists of cis-1,4-polyisoprene with a Mooney viscosity of 79.9 at ML (1 + 4) at 100 °C, and butadiene rubber (BR9000) consists cis-1,4-polybutadiene with a Mooney viscosity of 50 at ML (1 + 4) at 100 °C. Both natural rubber and butadiene rubber were from Shanghai Dukang Co., Ltd., (Shanghai, China). The pyrolytic rice husk ash containing biochar and silica (Trade Name as SiCB) were produced by Jilin Kaiyu Biomass Development and Utilization Co., Ltd. (Changchun, China). Milled SiCB (MSiCB) were prepared according to reported procedure using the XQM-2 planetary ball mill (Tianchuang Co., Changsha, China) [34], and the milling parameters of SiCB are described in Table S1. Maleic anhydride (MA), stearic acid, zinc oxide (ZnO), and sulfur (S) in analytical grades were purchased from Sinopharm Chemical Reagent Co., Ltd. (Shanghai, China). All the other chemicals including N-1,3-dimethylbutyl-N′-phenyl-P-phenylenediamine (antioxidant 4020), poly(1,2-dihydro-2,2,4-trimethyl-quinoline) (antioxidant RD), wax, N-tertbutylbenzothiazole-2-sulphenamide (accelerator NS), dicumyl peroxide (DCP, 98%), and aromatic hydrocarbon oil (DAE) in chemical grade were supplied by Beijing Chemical Works. (Beijing, China) and used without further purification.
2.2. Preparation of Filled Elastomer Composites
Natural rubber/butadiene rubber (NR/BR) were chosen as elastomer matrix due to activity in chemistry of NR which provides the chance for graft of maleic anhydride and low thermogenesis of BR which reduces energy loss. Mechanical properties of NR/BR materials are shown in Table S2. The elastomer composites were prepared using a laboratory-sized internal mixer (KY-3220C-1L, Dongguan Kaiyan Machinery Equipment Factory, Dongguan, China) according to the formulations listed in previous work [35]. NR and MA were first mixed in an internal mixer at 40 rpm and 100 °C for 10 min to incorporate MA onto the main chain of NR. Then pre-weighted filler, BR and rubber additives were added and blended for another 13 min. Finally, the obtained composites were hot-pressed at 150 °C and 20 MPa. The prepared samples were named as SiCB-MNRx/BR, with the numbers x representing the corresponding loading of MA with a unit of phr. SiCB was milled under different conditions (M1SiCB and M2SiCB) and were used as the fillers. The as-prepared milled SiCB mixed with NR/BR to prepare M1SiCB-NR/BR and M2SiCB-NR/BR. The detailed sample information is listed in Table 1.

Table 1.
Recipes for preparation of SiCB-NR/BR.
2.3. Characterization
Fourier transform infrared (FTIR) spectra were collected on a Bruker V70 FTIR spectrometer (Bruker, Karlsruhe, Germany) using attenuated total reflection (ATR) mode in order to substantiate the interaction between NR and MA. Particle size distribution of the fillers were measured by the laser scattering particle size analyzer (BT-9300ST, Baite Instrument, Dandong, China) using water as the dispersant. The particle morphology and cryogenic fracture surfaces of composites were observed using scanning electron microscope (SEM, SU8020, Hitachi & SEM, JSM-6700F, Jeol, Tokyo, Japan). The crosslinking density [ν]es was determined from equilibrium swelling experiments with toluene. Rubber samples (around 1 g) were weighed in 50 mL vials (m0) and immersed in 20 mL of solvent to reach equilibrium swelling (72 h). The solvent was removed from the sample surface with filter paper and the sample was (m1) and finally dried at 80 °C in an oven for 48 h until a constant weight was reached (m2). The crosslinking density was calculated according to the Flory–Rehner expression: [36,37]
where VR is the volume fraction of rubber in swollen sample, vs. is the molar volume of toluene (106.3 mL/mol), χ is the NR/BR–toluene interaction parameter (here, χ = 0.534), and are the density of rubber (: 0.930 g/mL; : 1.930 g/mL) and toluene (toluene: 0.866 g/mL), respectively.
The crosslinking density [ν]ts was determined from the stress–strain curves via the Mooney–Rivlin approach [38,39,40]. The crosslinking density was subsequently calculated from C1.
where σ is the true stress, which is measured in the strained state, C1 and C2 are characteristic parameters of the vulcanized rubber, representing effects of chemical crosslinking and entanglements, respectively. λ is the extension ratio, X is the strain amplification factor (X = 1 for gum rubber), ε is the engineering strain, kB is the Boltzmann constant (1.38 × 10⁻²³ m2 kg s−2 K−1), and T is the absolute temperature.
Uniaxial cyclic tension test was conducted on the CMT-20 testing machine equipped with an extensometer (Liangong Testing Technology Co., Ltd., Jinan, China). The rectangular specimens with a dimension of 70 mm 12.5 mm 3.5 mm were stretched with a constant strain rate of 0.025 s−1 (l0 = 40.0 mm).
To investigate the Mullins softening, the specimens were stretched using various the maximum strain in cyclic loading (εm, εm varied from 0.5 to 3.0 for the samples). The measurements were repeated at least three times for each specimen to confirm satisfactory reproducibility.
3. Results and Discussion
3.1. Characterization of the Fillers
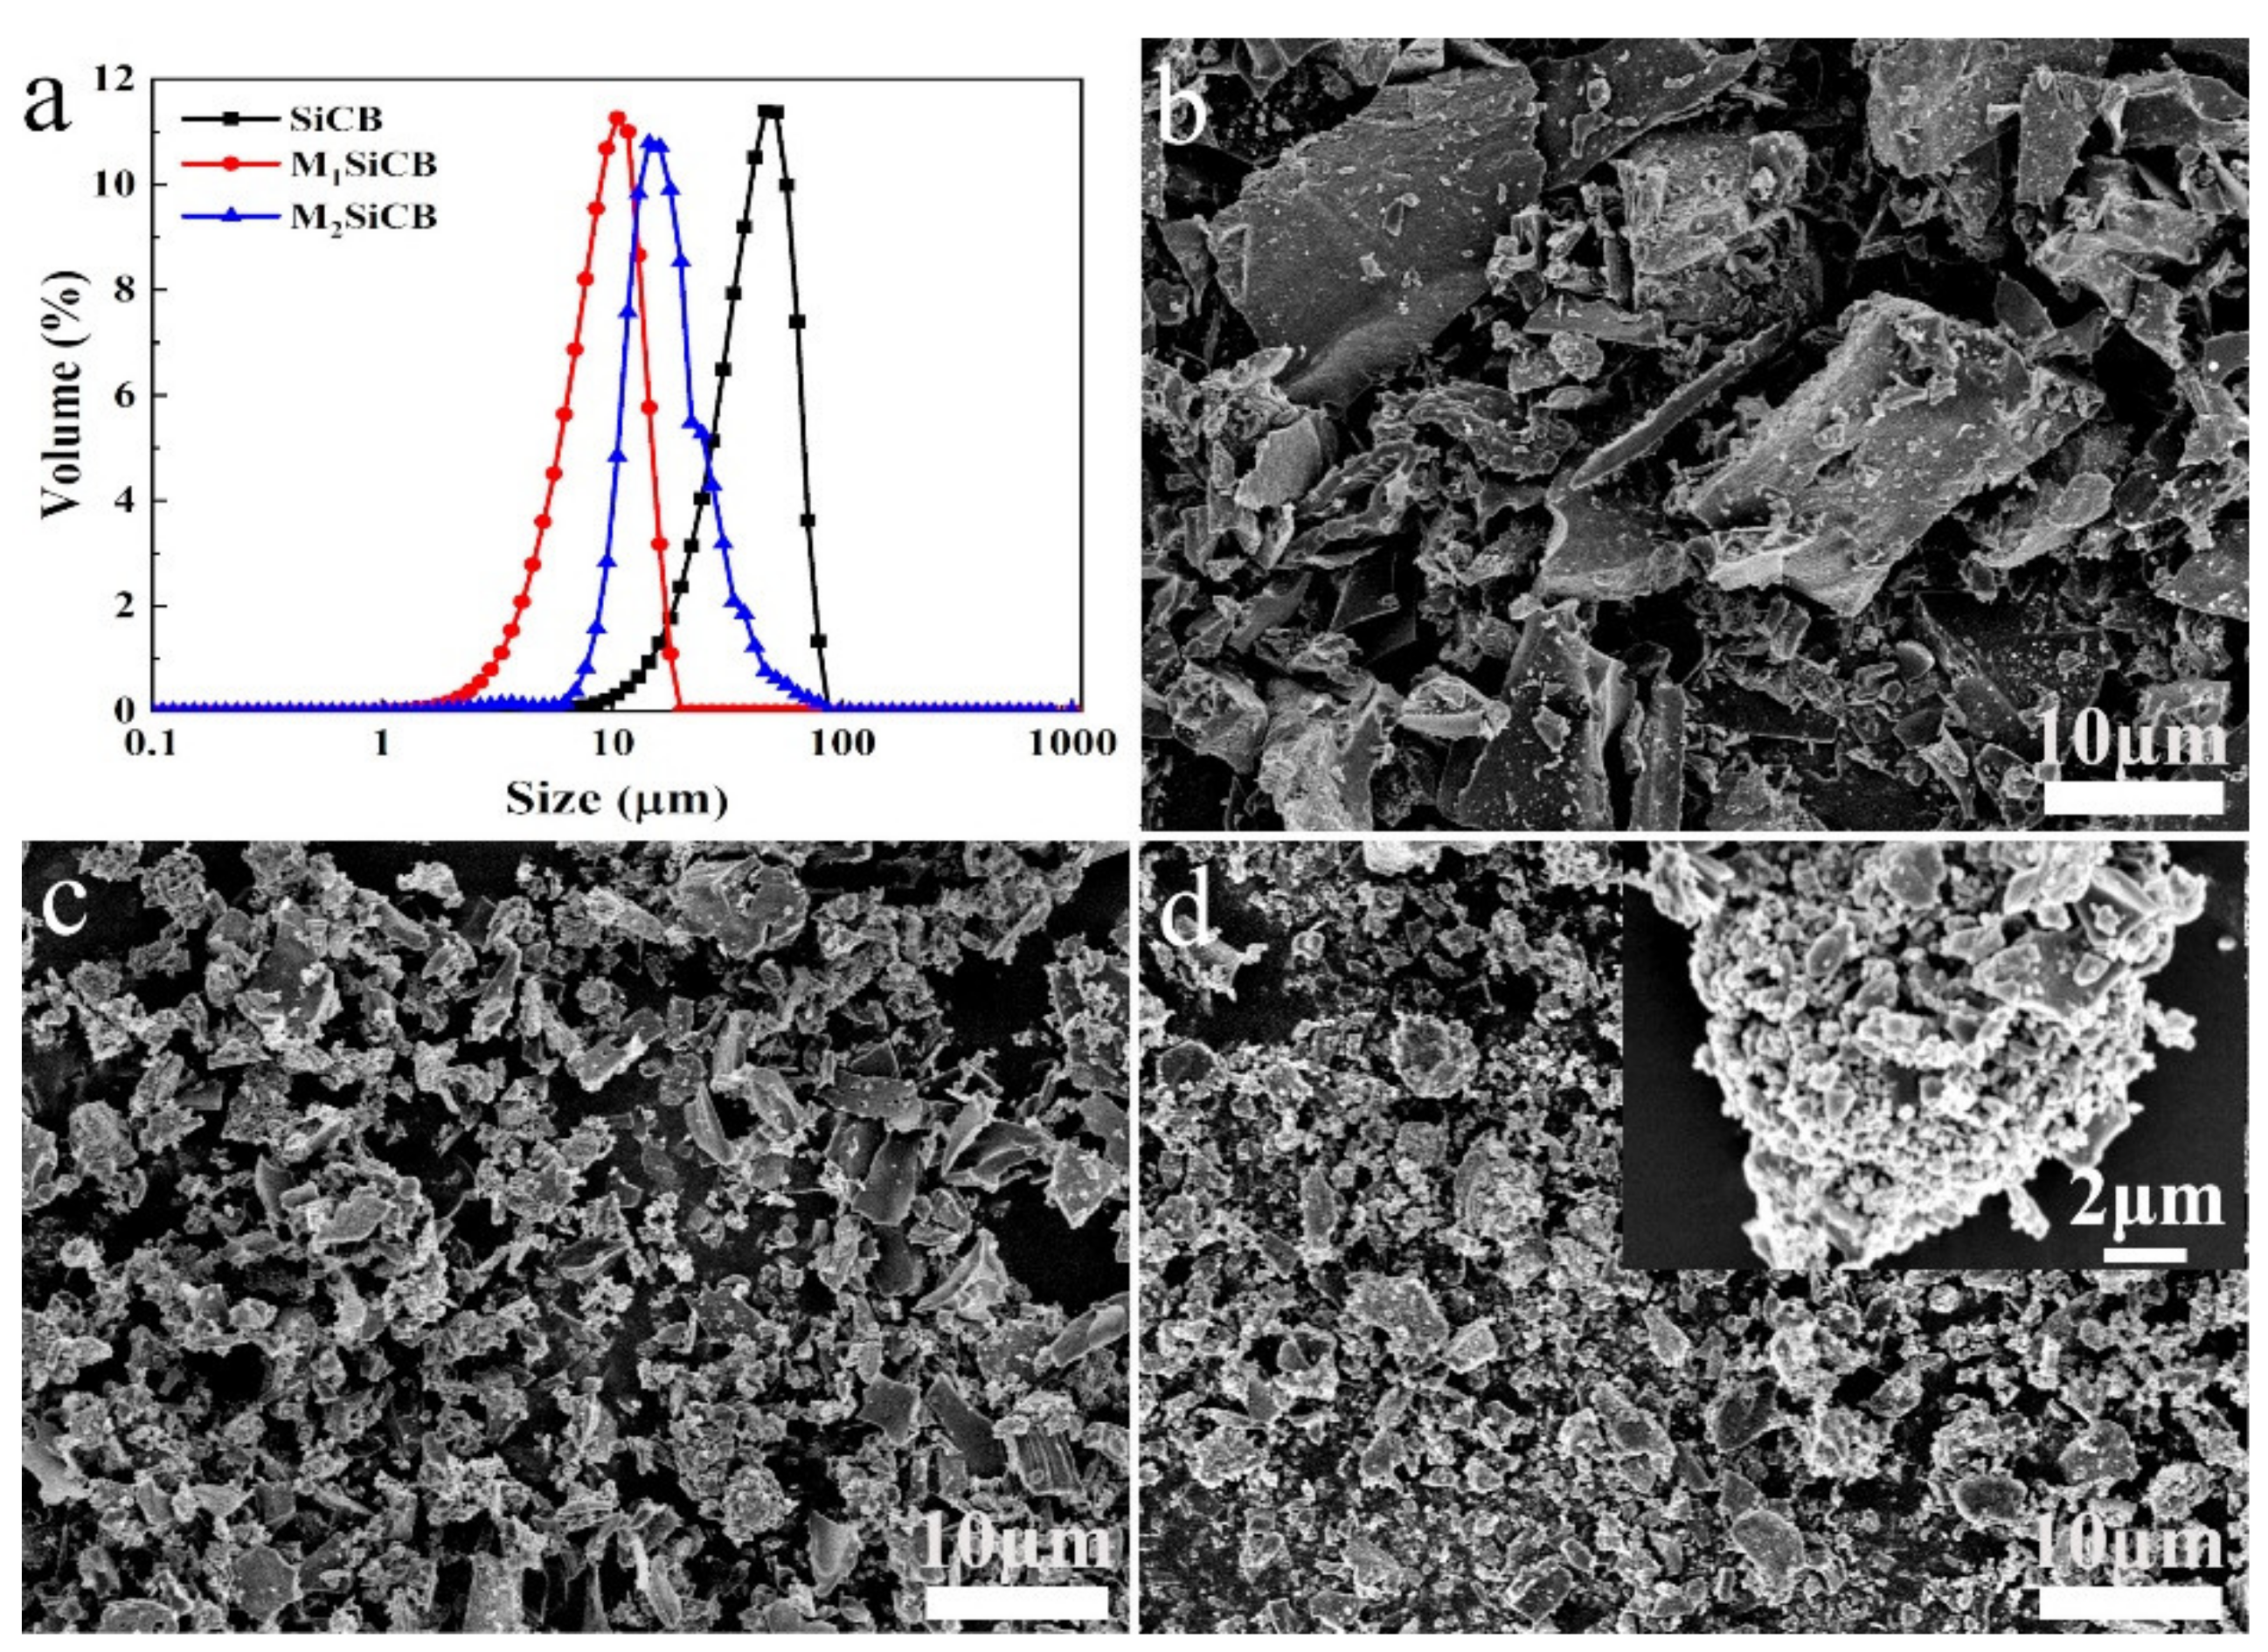
The particle size of filler is one of the important factors that substantially affect the performances of filled rubber composites [41,42]. Figure 1a shows particle size distribution of fillers of the as-prepared composites. The size distribution of SiCB particles ranged from tens of nanometers to 70 μm broadly. After ball milling treatment, the obtained M1SiCB showed a reduced size and a narrower size distribution ranging from a few nanometers to 20 μm. When the milling speed was further increased, the obtained particles shifted to a smaller size range, and at the same time the particles started to form agglomerates ranged from 10 to 60 μm due to the excessive surface energy (Figure 1a).

Figure 1.
(a) The particle size distribution of fillers, SEM of (b) SiCB, (c) M1SiCB and (d) M2SiCB.
The morphologies of the obtained fillers were observed by SEM. SiCB showed large irregular shape with bright particles distributed over the surface of the primary particles, suggesting the presence of two different materials [43] (Figure 1b). After ball milling, the as-prepared M1SiCB showed reduced particle size than SiCB (Figure 1c), while big agglomerates formed in M2SiCBs with uneven surfaces (Figure 1d), which are consistent with the particle size analyzer result. These three fillers with same composition but different size range were further used to study filler size effect on viscoelasticity in the following session.
3.2. Crosslinking Density of SiCB-MNRx/BR Composites
Crosslinking density (number of crosslinking bonds in a crosslinked polymer) is one of the main variables affecting the properties of vulcanized rubbers. Crosslinking densities of the SiCB-MNRx/BR composites with various MA contents were determined by equilibrium swelling (Table 2). With an increasing MA contents, the crosslinking density determined from equilibrium swelling ([ν]es) increased gradually, indicating changes of the rubber matrix after adding MA (confirmed by FTIR spectra in Figure S1). The crosslinking density determined from the stress–strain curve ([ν]ts) was also obtained, which was larger than [ν]es. This may be because [ν]ts includes both the chemical crosslinking and the temporarily trapped chain entanglements [44,45,46].
Table 2.
Crosslinking densities determined from both equilibrium swelling and tensile testing.
3.3. Properties of the Filled NR/BR Composites
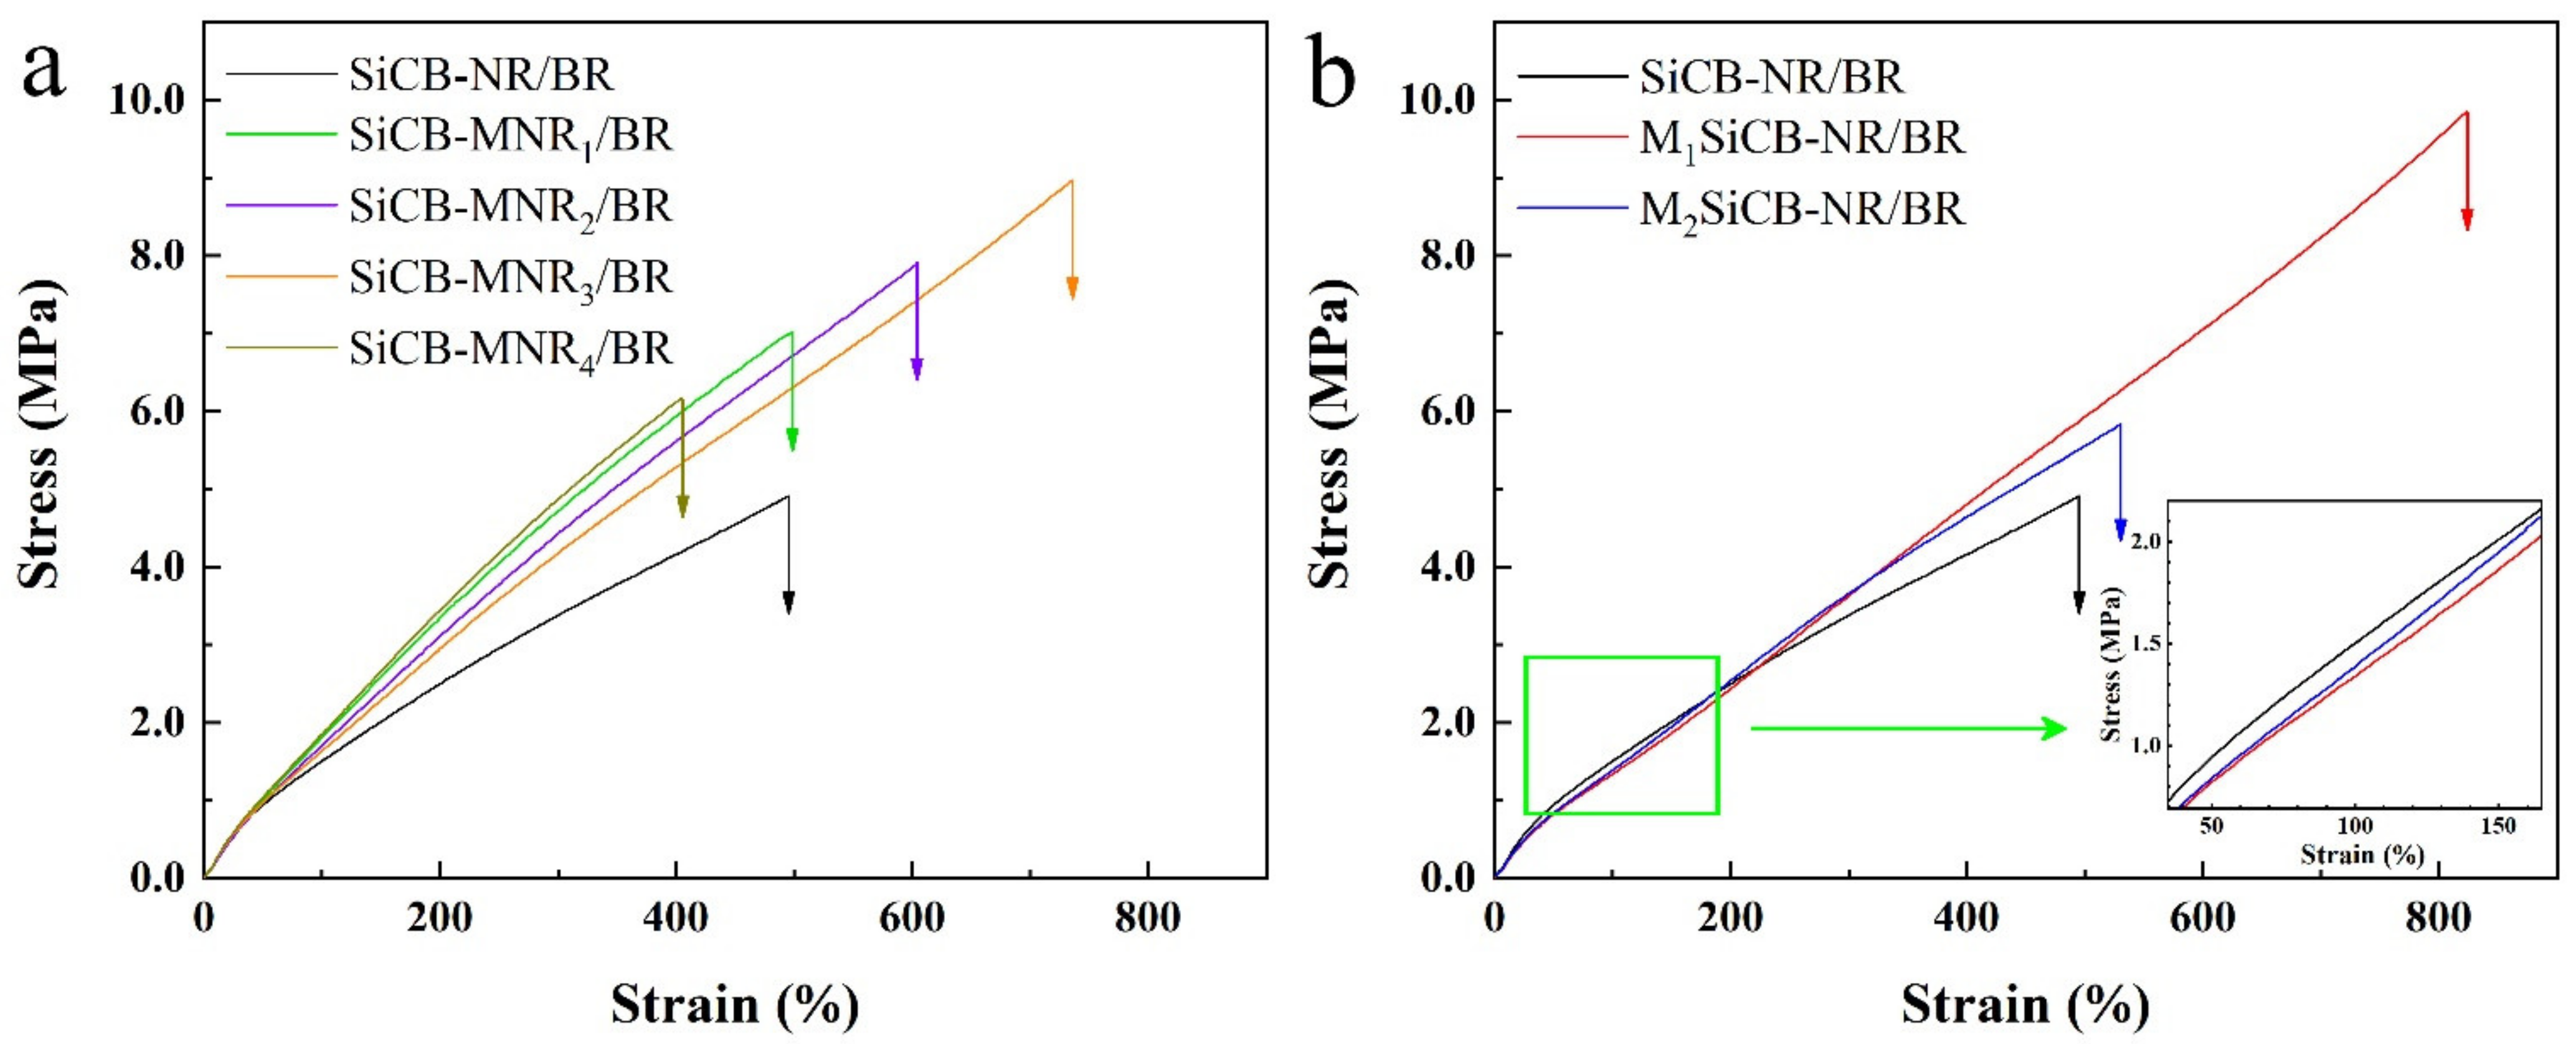
The effect of the filler particle size and crosslinking degree of polymer matrix on the filler reinforce performance was evaluated in detail. Figure 2a displays stress–strain curves of NR/BR composites with different crosslinking. Among all the composites, SiCB-NR/BR showed the lowest stress of 4.9 MPa upon breakage, which could be attributed to the poor compatibility between filler SiCB and rubber matrix. However, the stress increased to 6.2 MPa after the inclusion of MA (1 phr). The crosslinking degree of polymer matrix improved with an increase in the MA content up to 3 phr, leading to increased tensile strength as shown in Figure 2a.

Figure 2.
Representative stress–strain curves of the filled NR/BR composites: (a) with different crosslinking densities and (b) with different fillers particle size.
Stress–strain curves of SiCB-NR/BR composites with different filler particle sizes are shown in Figure 2b. Compared to SiCB, the milled SiCB has a smaller size with an enhanced reinforcing performance. This is because the filler with a small size provided a large contact area with the rubber matrix and offered more sites to share the stress loaded on the molecular chains. The reinforcing performance of M2SiCB was lower than M1SiCB, which may be attributed to the non-uniform size distribution of M2SiCB. Compared with M1SiCB-NR/BR and M2SiCB-NR/BR, the stress of SiCB-NR/BR increased quickly at the initial stage, which arose from the large particle size of filler acting as hindrance during tensile testing. The stress–strain curve gradually becomes flattened as further stretching the SiCB-NR/BR sample due to the rupture of filler clusters [47].
The uniformity of the filler dispersion in the matrix also played an important role in the composite properties. The fracture surfaces of the composites were observed by SEM as shown in Figure 3. The aggregation of filler particles and cavities in the matrix were observed on the fracture surface of SiCB-NR/BR (Figure 3a), which indicated the weak filler–rubber interaction. In contrast, no obvious phase separation between the filler and polymer matrix was observed for the M1SiCB-NR/BR (Figure 3b), which indicates that small particle size and uniform dispersion of M1-SiCB in the rubber matrix could improve interfacial compatibility. This, in turn, should result in the improved reinforcement in the mechanical property of composites, consistent with the previous report [34]. Small biochar block and rough surface were observed on the fracture surface of SiCB-MNR3/BR (Figure 3c), which indicated enhanced interfacial adhesion between SiCB and MNR/BR polymer matrix due to the presence of MA.
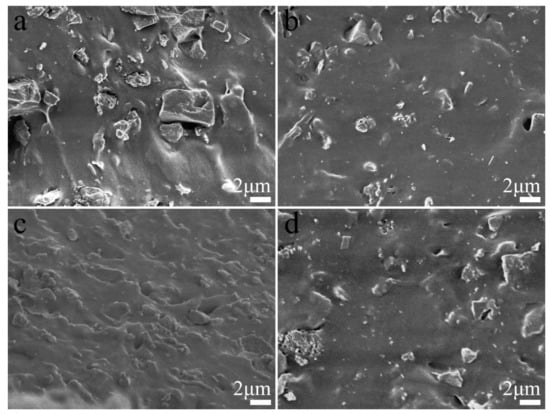
Figure 3.
SEM images of the brittle fracture surfaces (a) SiCB-NR/BR, (b) M1SiCB-NR/BR, (c) SiCB-MNR3/BR, and (d) M2SiCB-NR/BR.
3.4. Mullins Effect of the Filled NR/BR Composites
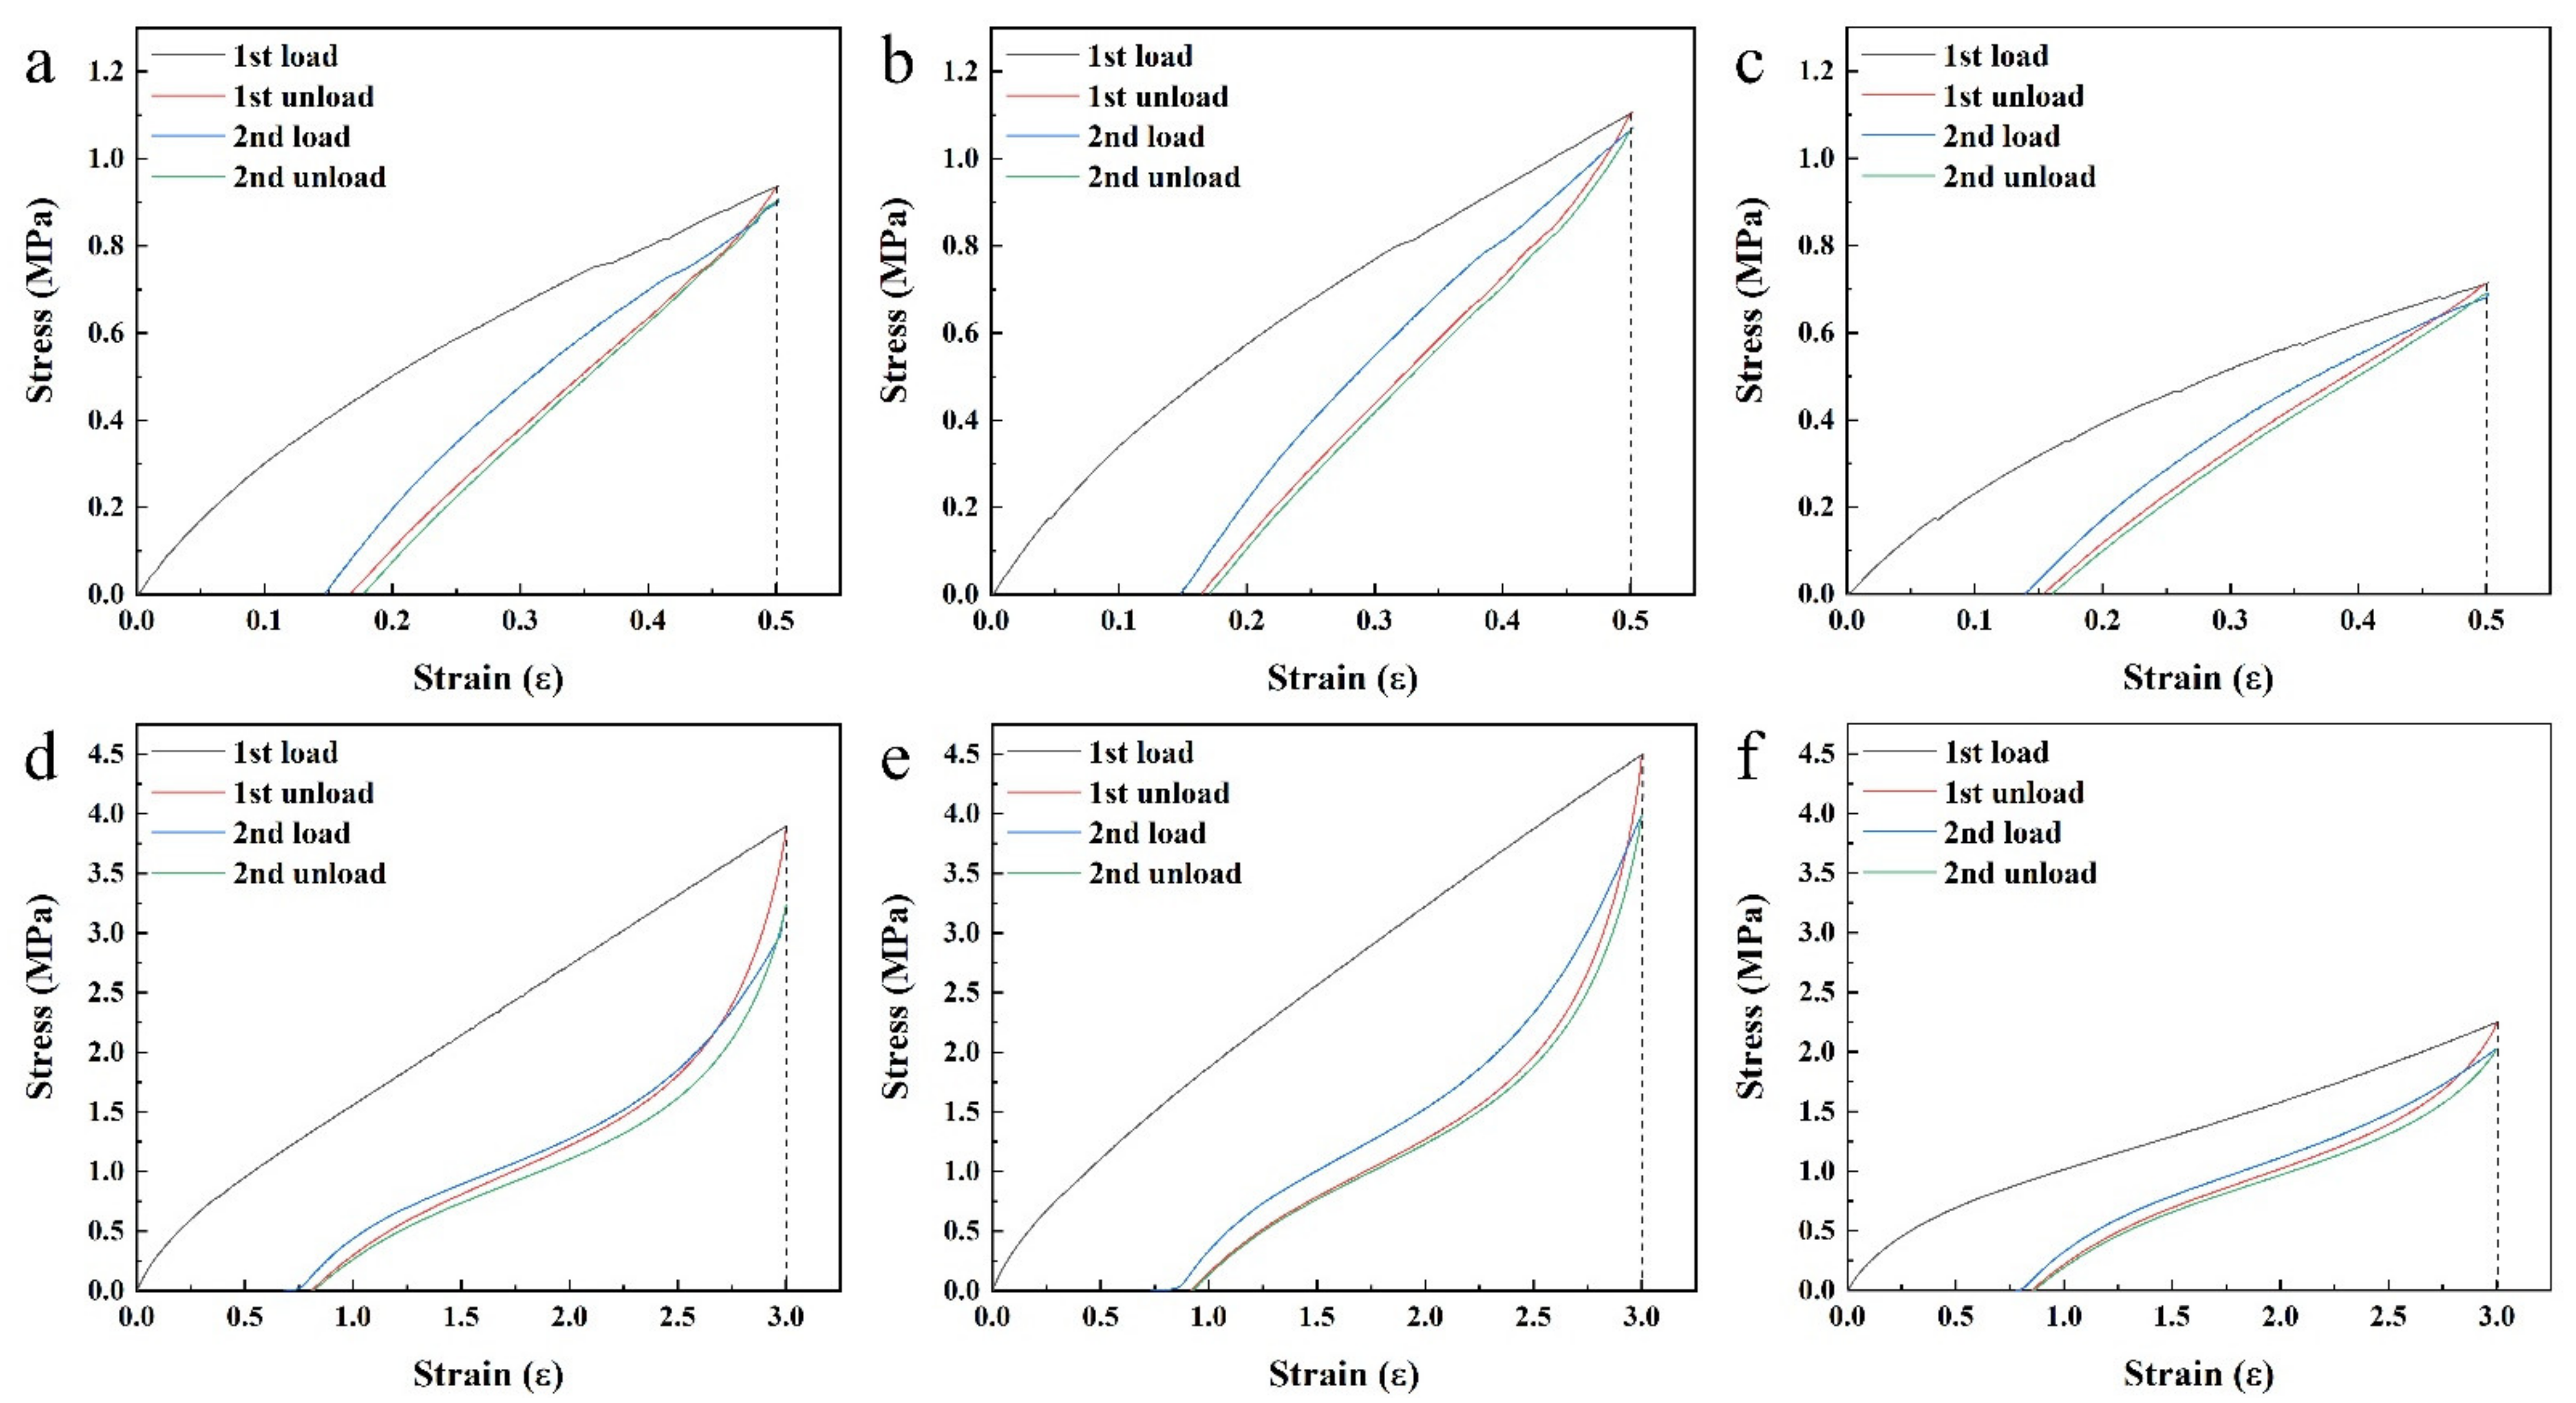
To study the Mullins effect of the filled NR/BR composites, uniaxial cyclic tensile tests were conducted at various strains from 0.5 to 3.0. As shown in Figure 4, a significant stress softening was observed for SiCB-NR/BR, SiCB-MNR3/BR and M1SiCB-NR/BR in the first two tensile loop. The stress required on reloading was lower than that during the initial loading in the regime of ε < εm for all the composites (Figures S2–S8). This result indicates that all composites exhibited Mullins effect which is considered a damage mechanism of rubber materials.
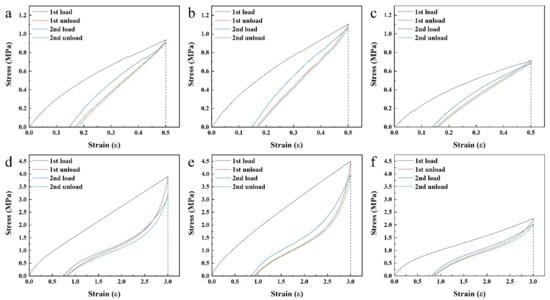
Figure 4.
Stress–strain response of SiCB-NR/BR (a,d), SiCB-MNR3/BR (b,e) and M1SiCB-NR/BR (c,f) subjected to uniaxial cyclic tension with different strain (a–c, ε = 0.5; d–f, ε = 3.0).
In order to further investigate the Mullins effect, three basic parameters are defined, namely, stored elastic energy in loading and reloading processes (W0 and Wr), and the released energy in the unloading process (Wu) as shown in Figure 5. Four derived parameters have also been defined based on W0, Wr, and Wu. The list of notations has been showed in Table A1.
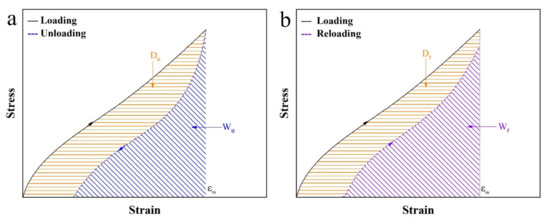
Figure 5.
Schematics for the evaluations of energy dissipation based on (a) loading–unloading and (b) loading–reloading curves with the same maximum strain of εm. W and D are the stored and dissipated energies, respectively. The subscripts u and r denote unloading and reloading, respectively.
The first two derived parameters, Energy dissipation D is obtained from the area enclosed by the loading–unloading or loading–reloading curves as shown in Figure 5. Du and Dr are defined by the following equations.
where Du represents the difference between stored elastic energy and released energy in each loading–unloading cycle. Dr represents the difference of stored elastic energies in loading–reloading cycles.
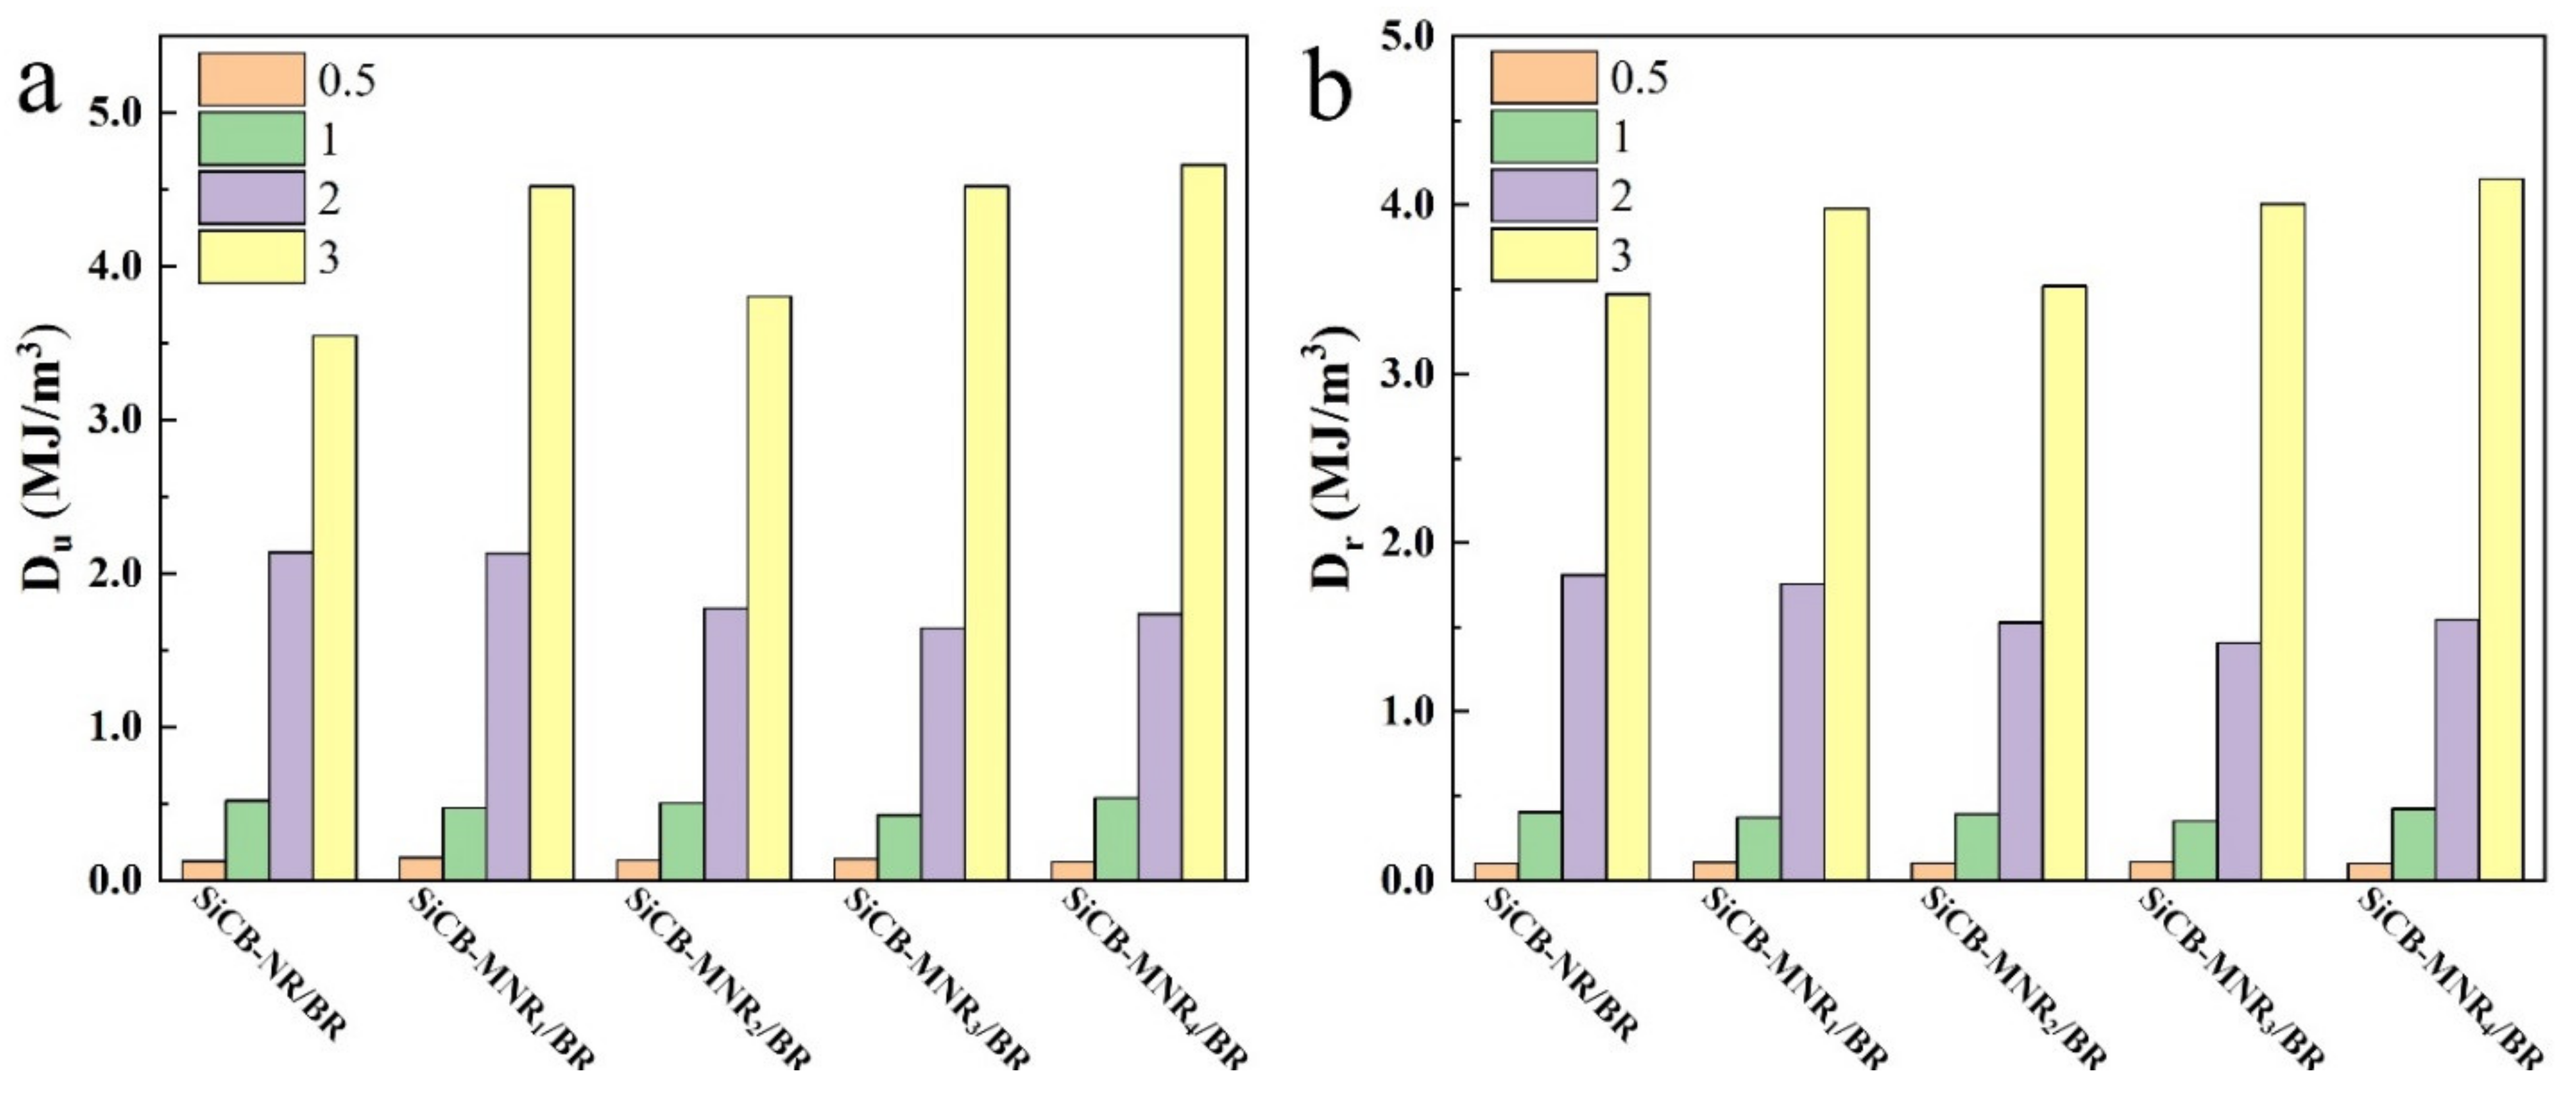
Figure 6 shows the energy dissipation of SiCB-MNRx/BR composites with different crosslinking densities at different strain ε during the unloading (Du) and reloading (Dr) processes. It can be seen that both Du and Dr increased with the increase of εm for all composites. Du was larger than Dr at the same strain, which indicates that stress in reloading was larger than that in unloading at the same ε. The energy difference is indicative of the viscoelasticity in the filled elastomers [5]. Li et al. investigated the energy dissipation accompanying the Mullins effect in virgin loading–unloading process. They divided the energy dissipation into recovery hysteresis and softening stages, and suggested the energy loss associated with hysteretic recovery was mainly determined by the microscopic strain of the rubber phase, while the energy loss associated with softening was involved in both the rubber and filler phases [32]. Compared with the virgin loading–unloading process, energy dissipation in loading–reloading processes was defined as the permanent hysteresis energy, which was regarded as irreversible energy dissipation [33].
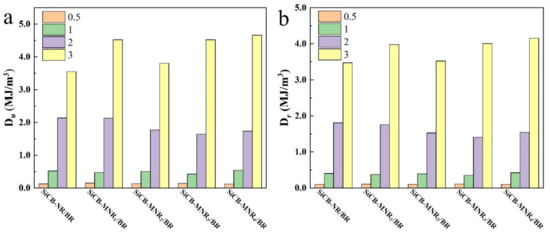
Figure 6.
Energy dissipation of SiCB-MNRx/BR composites with different crosslinking densities at different ε during the (a) unloading and (b) reloading processes.
It should be considered that the input energy by loading (W0) increases with the increase of εm, resulting in increased D at the same time [48]. In order to compare energy dissipation D with consideration of W0 among the deformations under various degrees of strain, a derived parameter ‘dissipation factor’ (Δ) can be defined as the ratio of energy dissipation to the stored elastic energy of loading (input elastic energy):
The filled elastomers exhibit a significantly lower stress on reloading than that on the virgin loading under the previously applied maximum strain. Larger stress difference indicates more energy dissipation resulting from the damage between the first and the second loading paths. Therefore, Δr associated with loading–reloading process could be as a measure of the degree of softening effect. Large Δr indicates high energy dissipation, which could reflect high manifest degree of the Mullins effect. Assuming that the loss factor under the experimental conditions is a function of elastic matrix crosslink density (ν), particle size (Sz) and strain (ε), it can be described by the following equation:
3.5. Influences of Crosslinking Degree of Polymer Matrix on the Mullins Effect
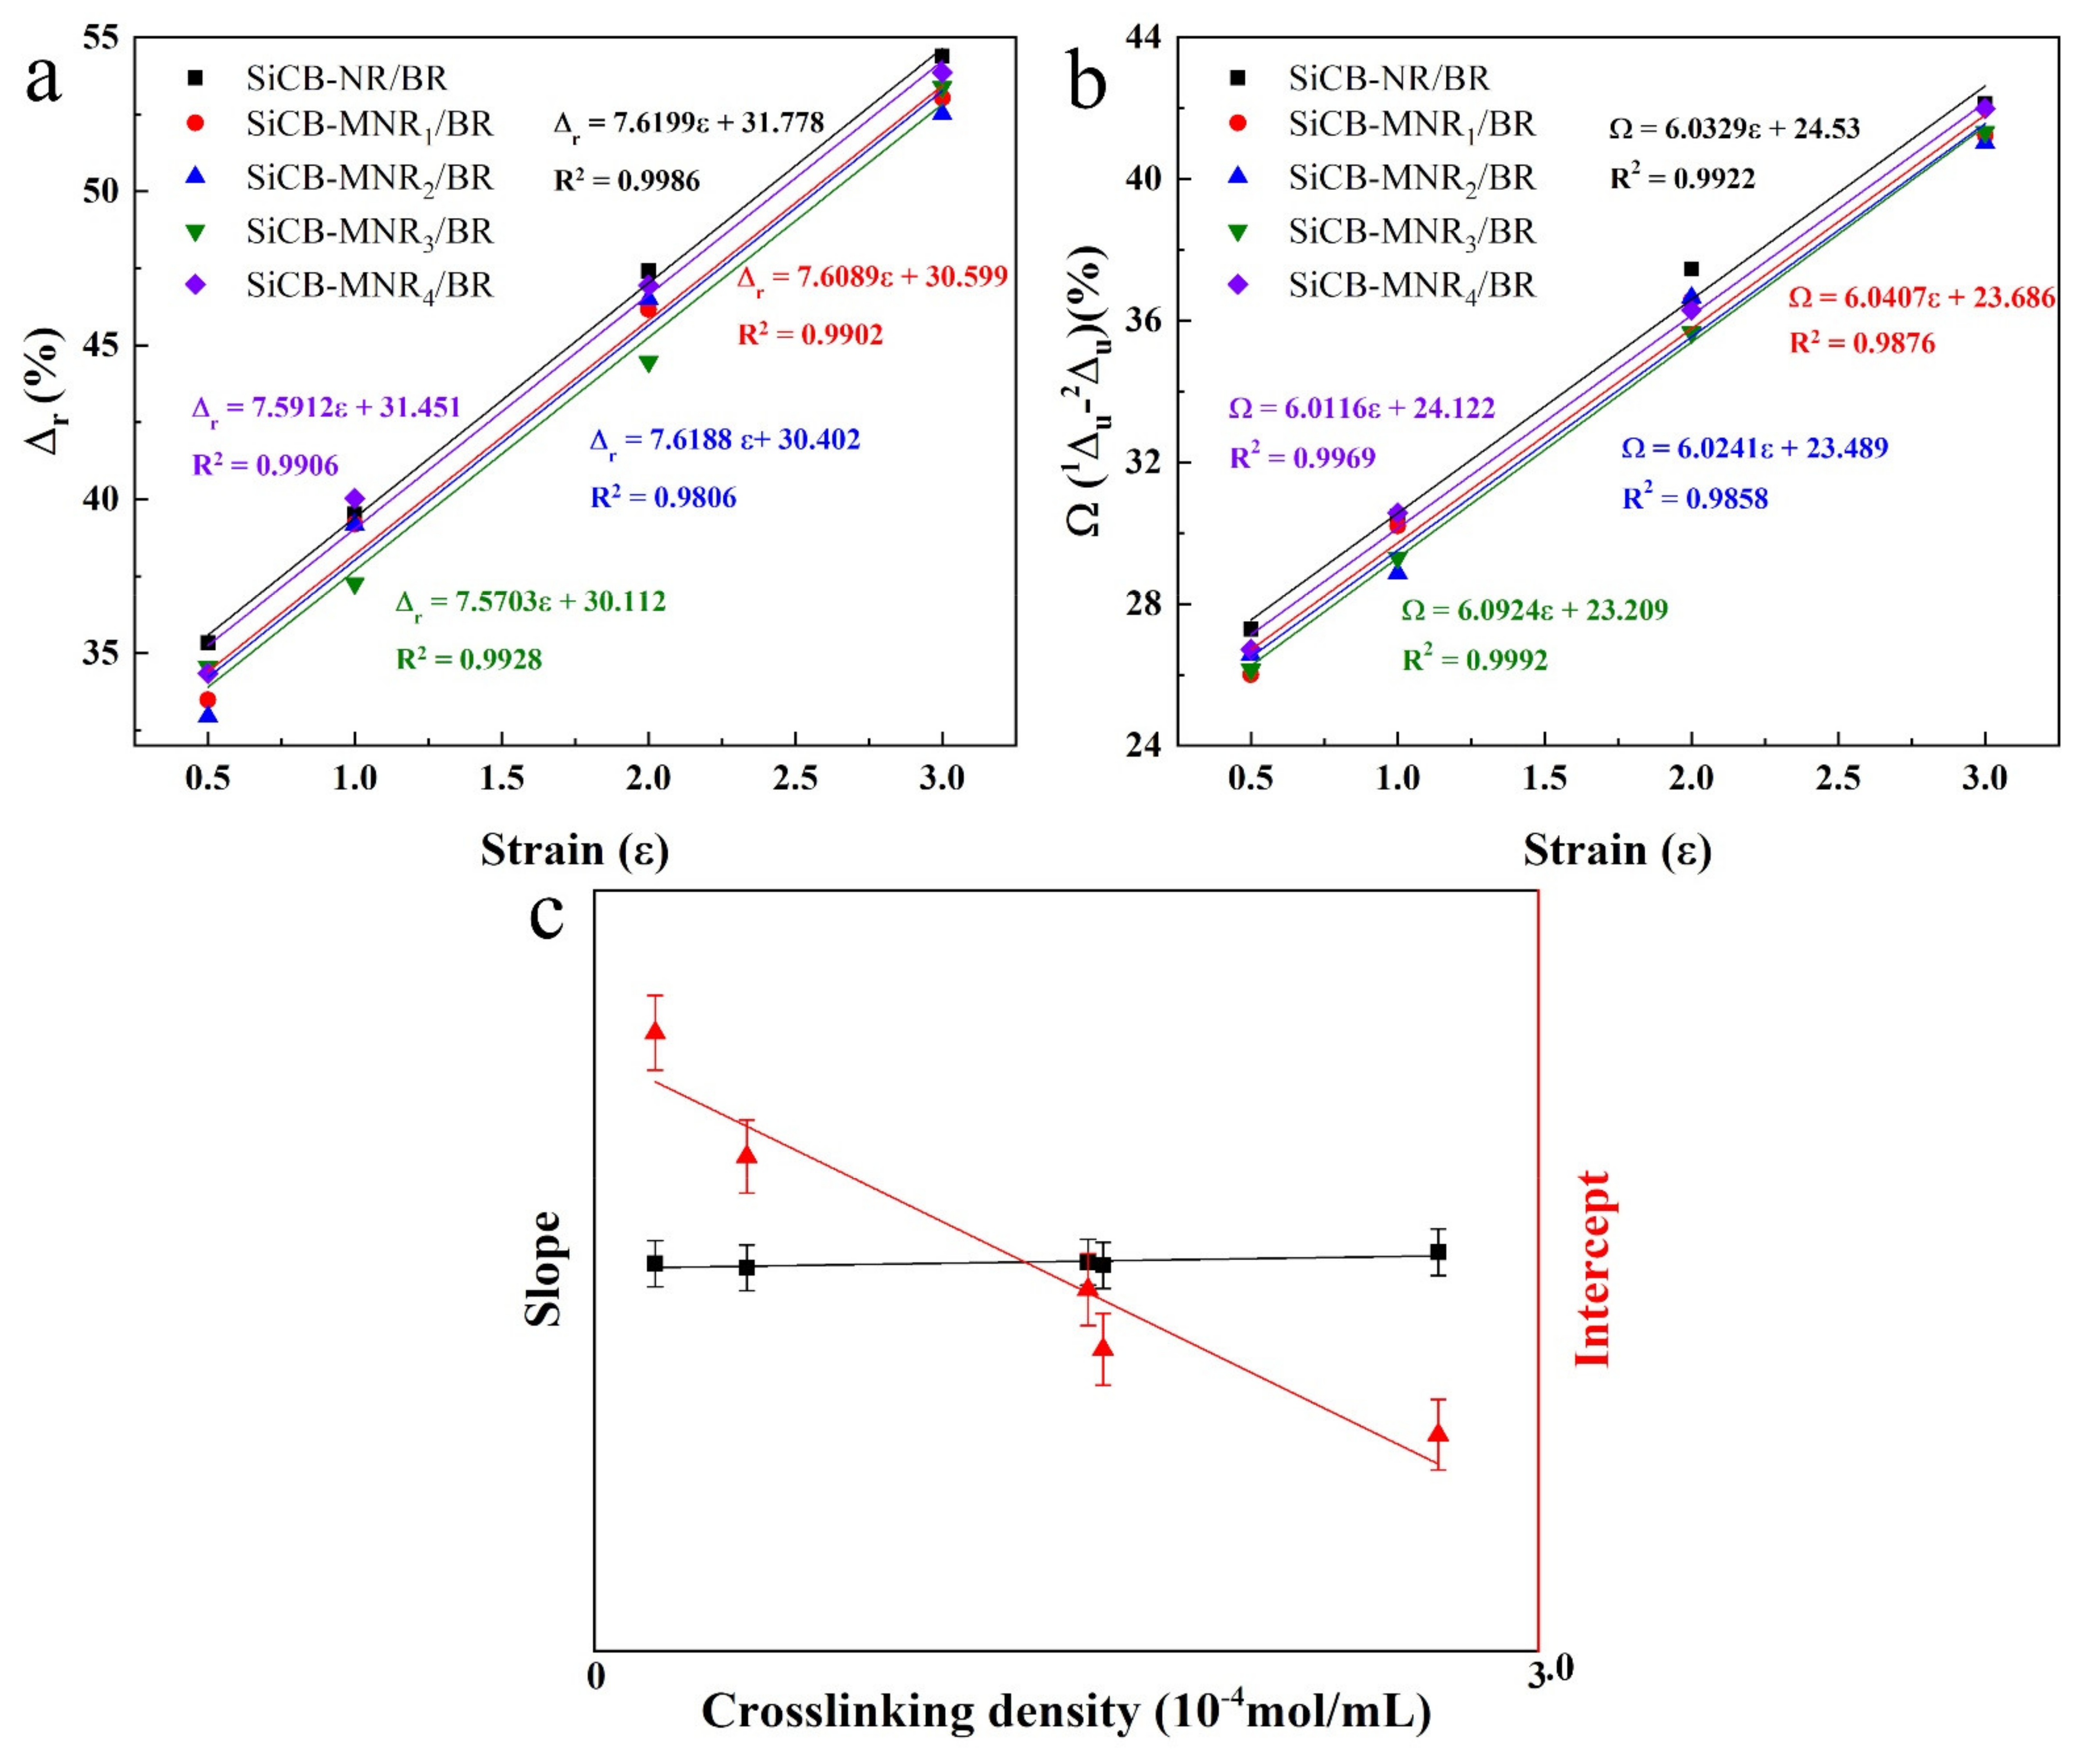
Figure 7a displays Δr as a function of εm for SiCB-MNRx/BR composites with different crosslinking densities. It can be seen that Δr increased with increasing the strain for SiCB-MNRx/BR composites. It is worth mentioning that all the SiCB-MNRx/BR composites showed a very close slope of the fitting curve, which was around 7.6. This result may suggest that when SiCB-MNRx/BR composite specimens completed the first two stretching cycles under the same maximum strain, the ratio of the energy dissipation to the total stored energy of the composite showed a simple linear relationship with the change of the εm. Since the SiCB-MNRx/BR composites were prepared with the same filler under the same conditions, the only difference between these composites was the crosslinking degree of the elastomer. This finding reveals that the softening depends on the crosslinking degrees of the rubber when the other conditions are the same. Furthermore, higher crosslinking density resulted in the weaker softening degree, this difference had no correlation with the change of εm of the specimen. It was also found that higher ν would lead to smaller Δr, which could be ascribed to increased chemically crosslinked network; higher molecular weight polymer network provided more extra reversible deformation, thus there would be less energy dissipation. Zhong et al. [49,50] proposed that increasing the elastomer crosslinking degree would result in chain entanglement, slippage, and twisting more likely to occur, therefore leading to the magnitude of strain energy change. However, this strain energy change would also be averaged over the different strains. Therefore, for the samples with the same Sz, ν only affected the value of Δr, but did not affect the trend of Δr as a function of εm.
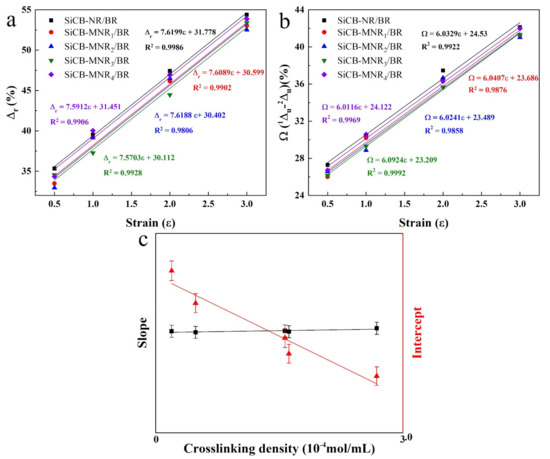
Figure 7.
(a) The dissipation factor (Δr), (b) the difference of dissipation factor (Ω) as a function of εm for SiCB-MNRx/BR composites with different crosslinking densities, and (c) schematic for the effect of crosslinking degree of polymers on Mullins effect.
On the other hand, Δu only reflects the energy dissipation in first loading–unloading process, this is in agreement with the reported theory that the main Mullins effect is represented by the difference between the first and the second loading–unloading runs. Therefore, to compare Δu during the loading–unloading processes among the as-prepared composites, the difference of the dissipation factors (Ω (u -u)) between the first and second loading–unloading runs was used to reflect the degree of the softening effect. A larger Ω indicates a higher energy dissipation, which would reflect a higher manifest degree of the Mullins effect. The Ω value as a function of εm for SiCB-MNRx/BR composites was shown in Figure 7b. It can be seen that Ω increased with increasing the strain for SiCB-MNRx/BR composites, which was ν-independent. For SiCB-MNRx/BR composites, Ω behaves very similarly to Δr under different strains, as shown in Figure 7c.
3.6. Influences of the Filler Particle Size on the Mullins Effect
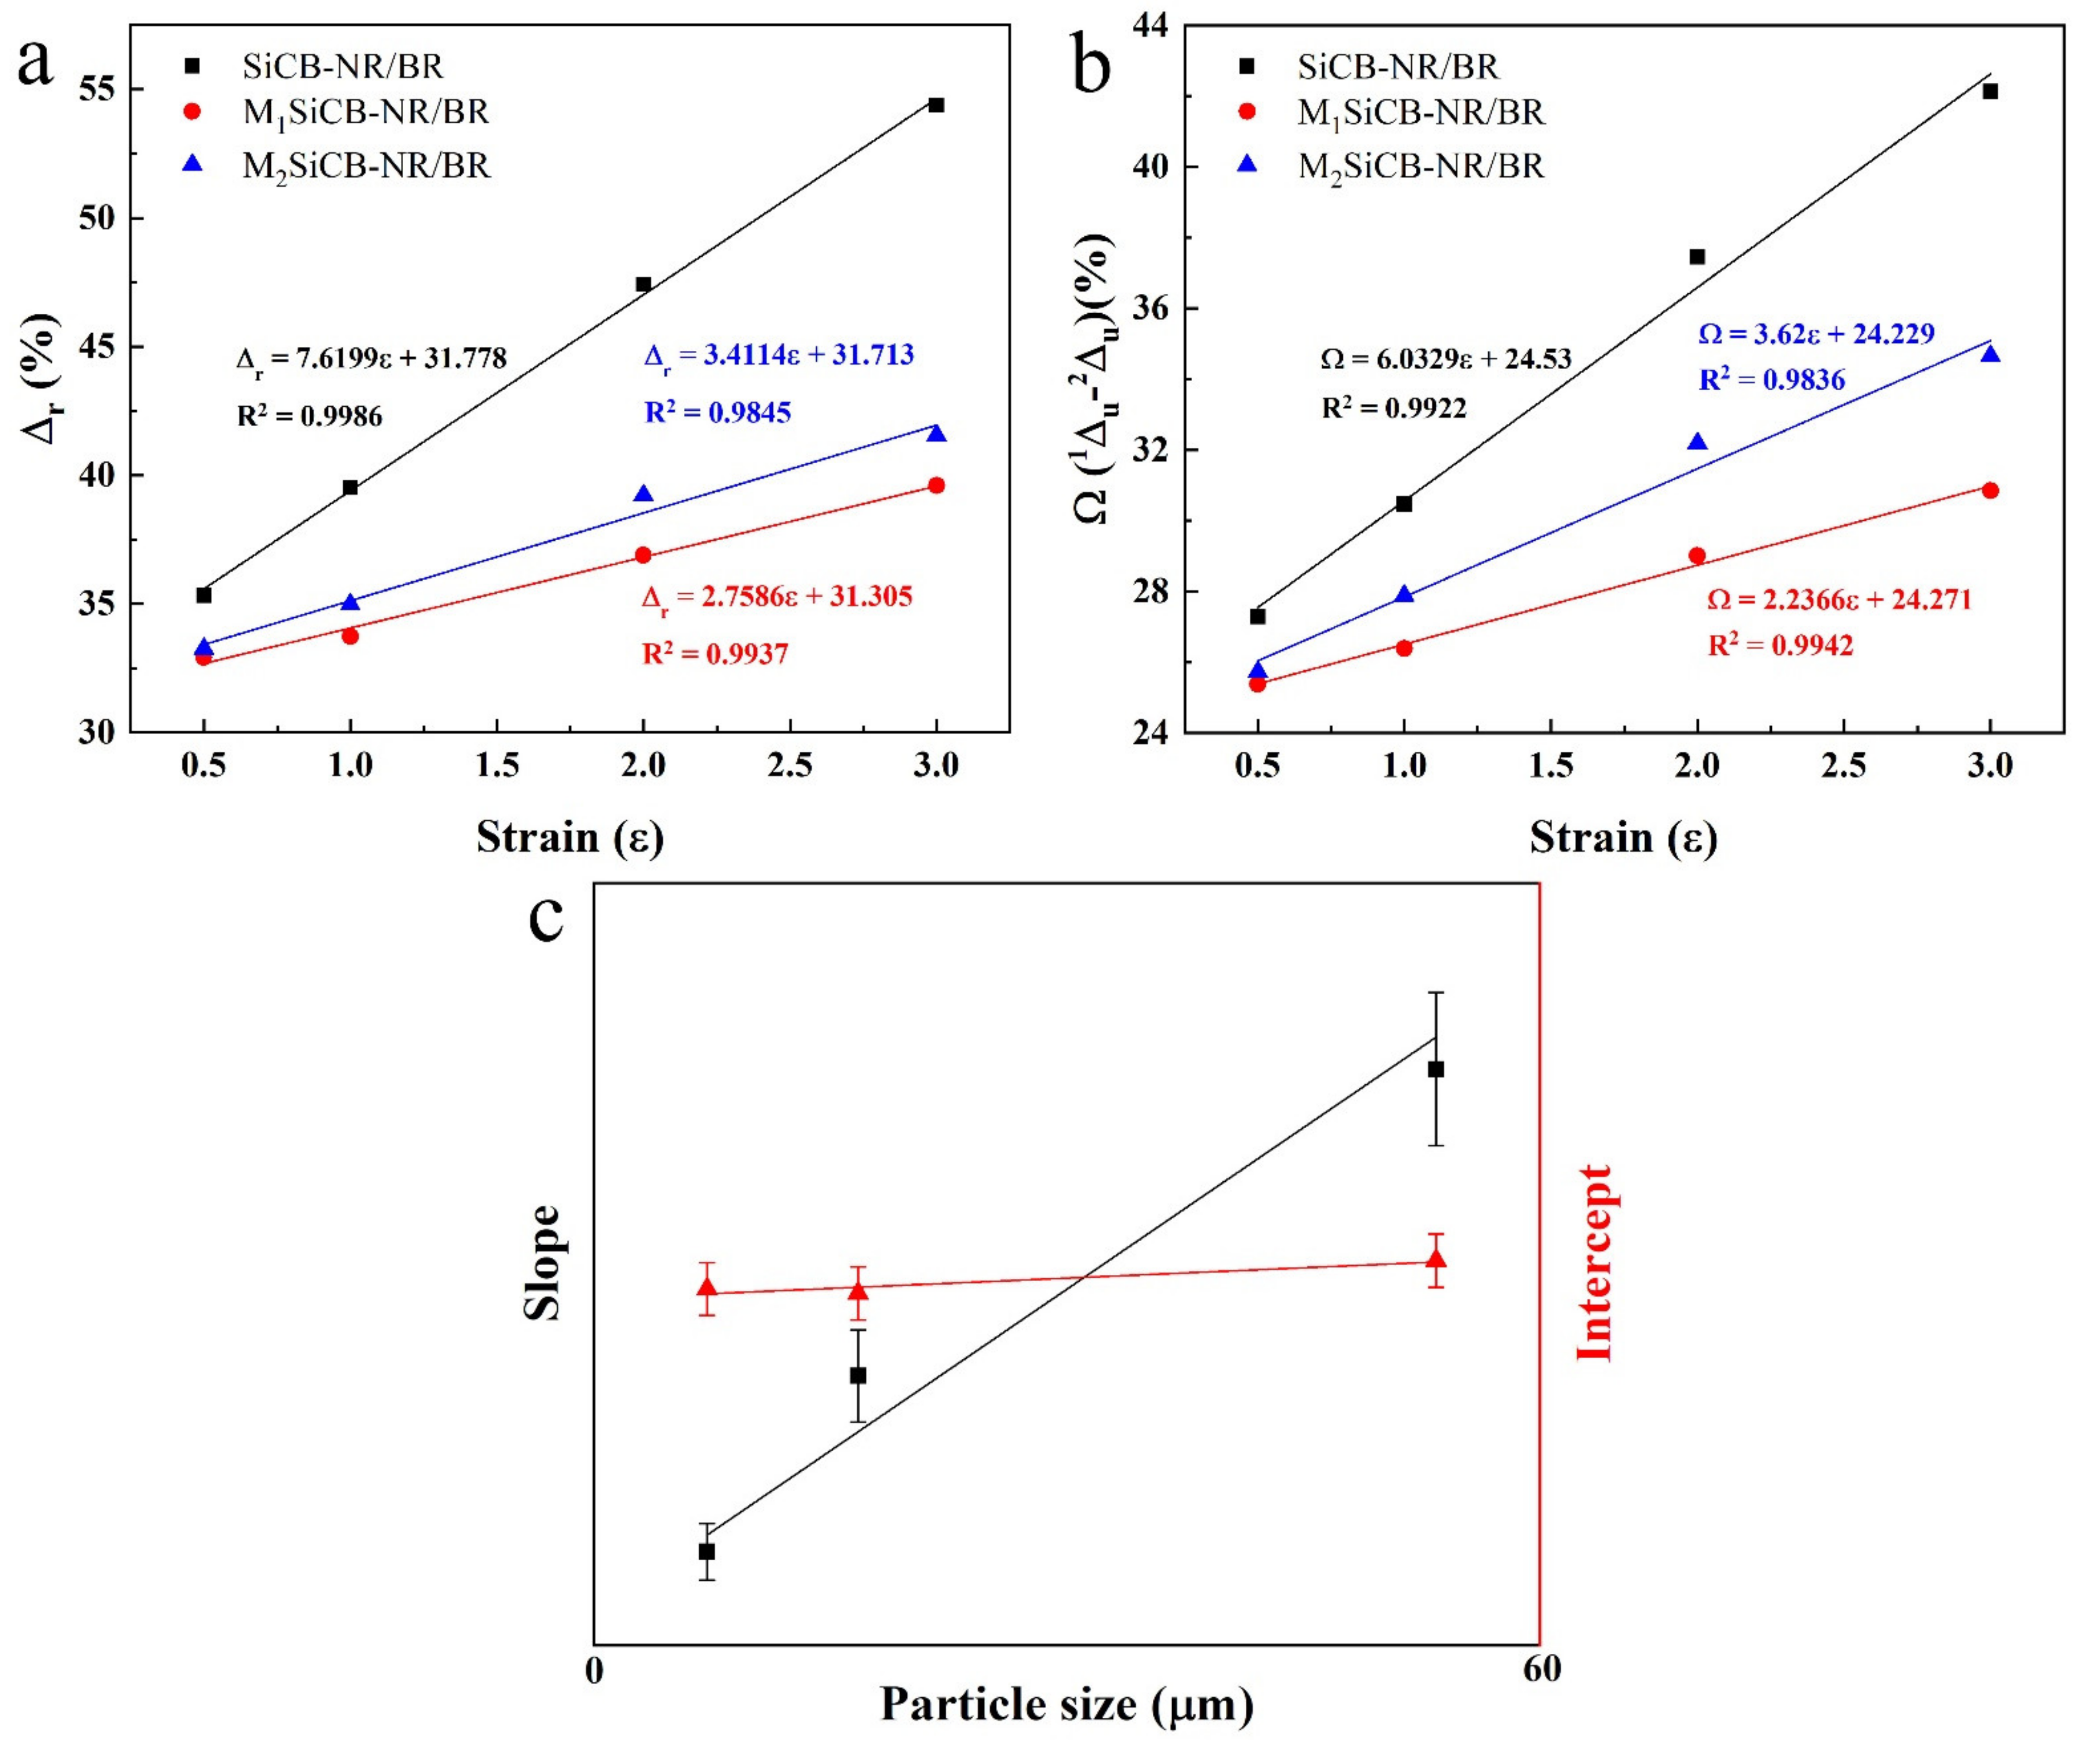
The influences of the filler particle size on Mullins effect of the SiCB-NR/BR composites was also evaluated in detail. As shown in Figure 8, for the same SiCB-NR/BR sample, Δr and Ω increased with increasing the strain. It was also observed that the slope of the fitting curve of the three samples follow the order of SiCB-NR/BR > M2SiCB-NR/BR > M1SiCB-NR/BR, which corresponds to the filler size order of SiCB > M2SiCB > M1SiCB. Since the samples were prepared under the same conditions, we suggest that the slop differences of the three samples are ascribed to the particle size of the filler. The reduced filler particle size resulted in a decreased slope, which indicates that the trend of Δr as a function of εm is Sz-dependent (b is a constant). The average particle size of the filler SiCB in the composite matrix would result in the molecular network undergoing a high degree of structural breakdown during the cyclic deformation, which could lead to increased energy loss and more obvious softening behavior. These results reveal that ν and Sz have different influence on the Mullins effect, ν determines the intercept of Δr and Ω (Figure 7c), while Sz affects the slope of Δr and Ω (Figure 8c) with εm. Therefore, both particle size and crosslinking degree are key factors that determines the Mullins effect in filled rubber composites.

Figure 8.
(a) The dissipation factor (Δr), (b) the difference of dissipation factor (Ω) as a function of εm for SiCB-NR/BR composites with different fillers particle size, and (c) schematic for the effect of filler size on Mullins effect.
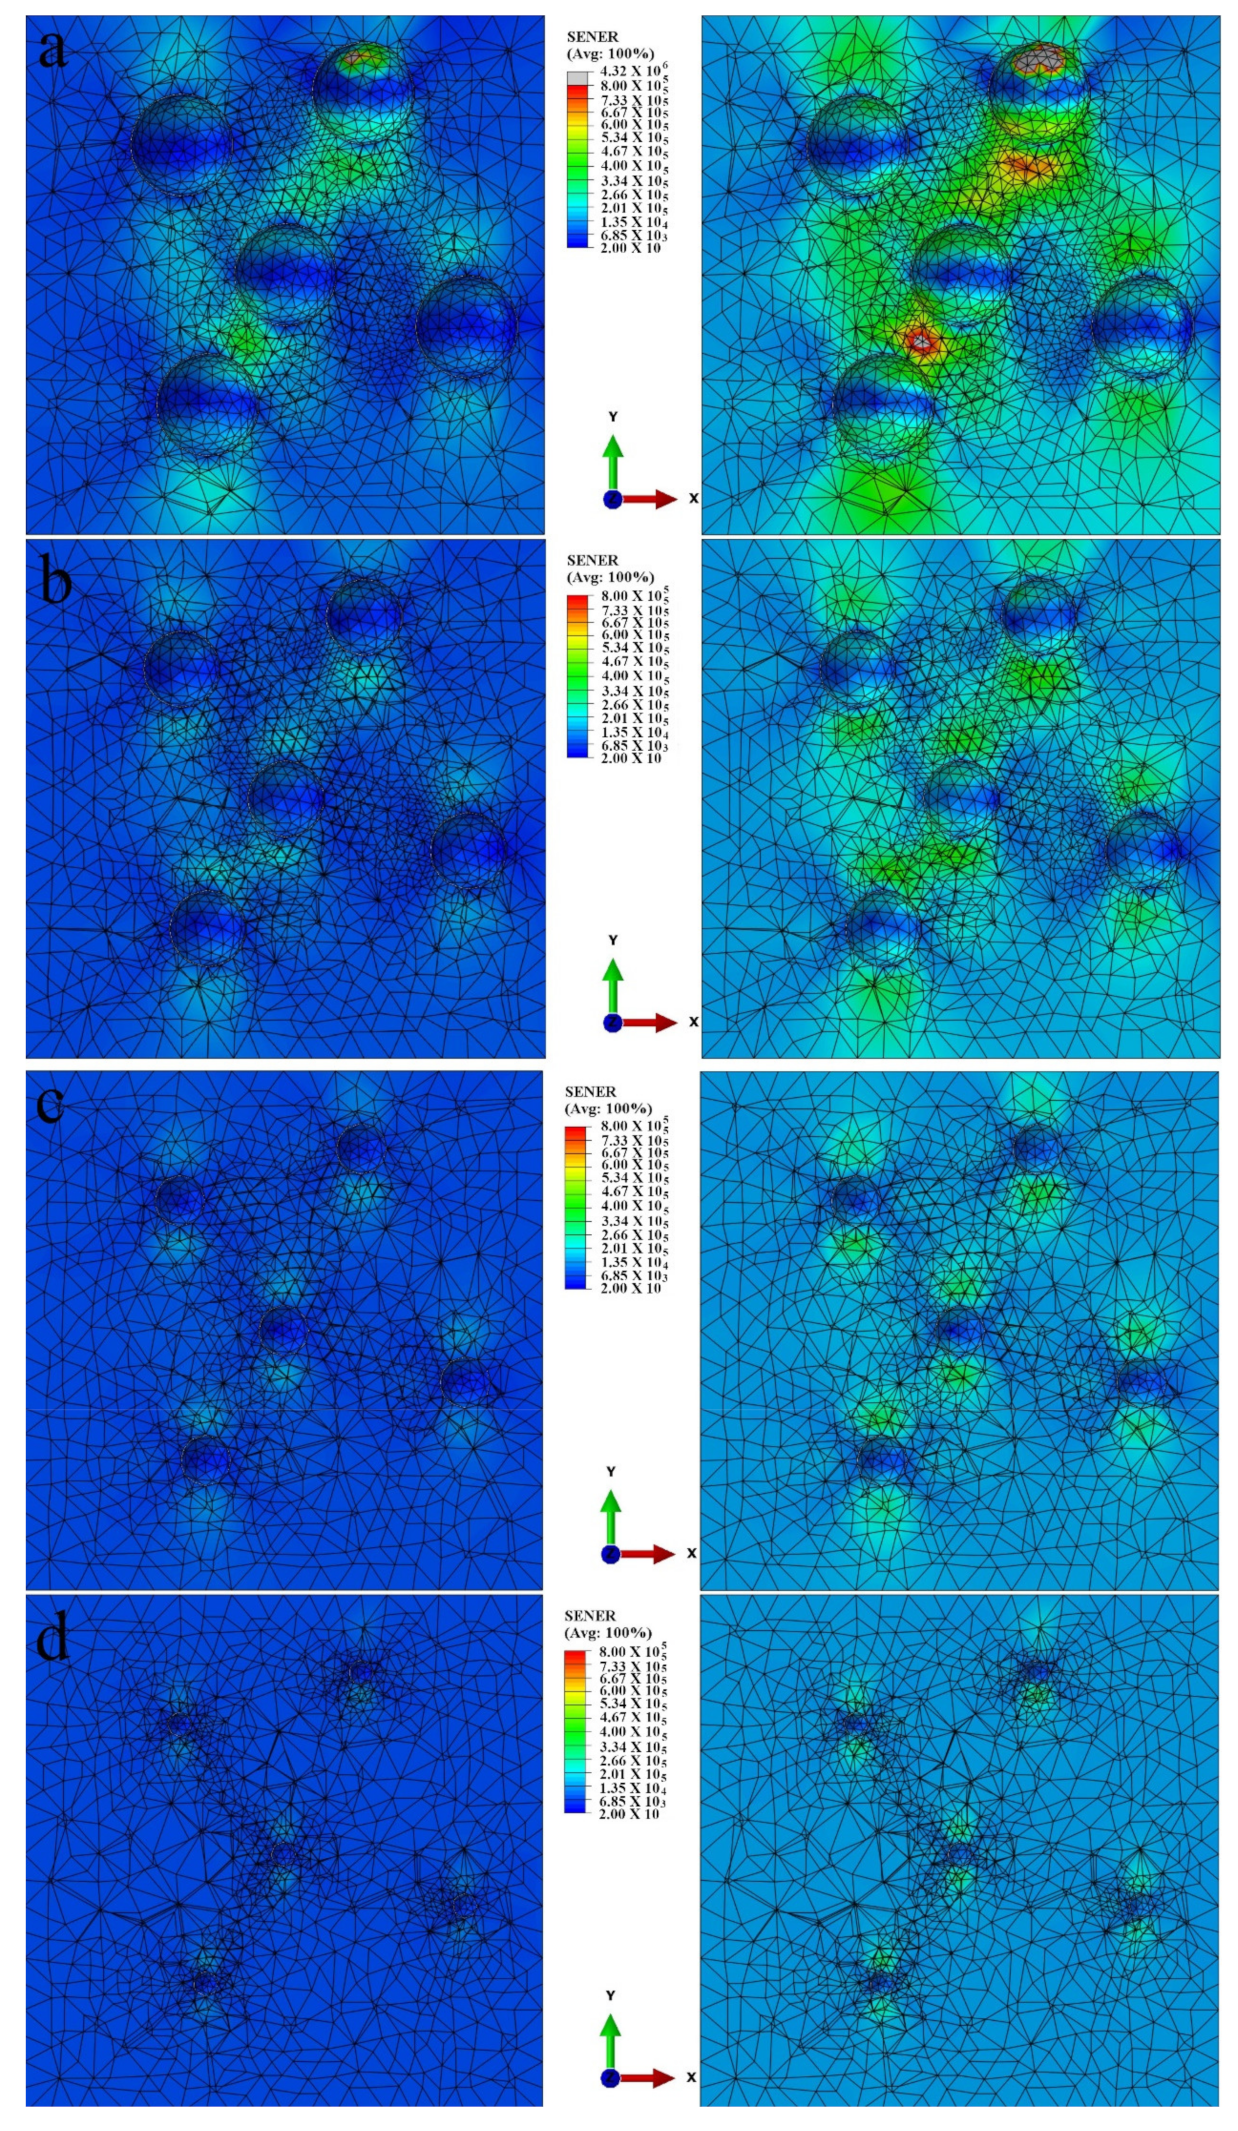
Varying fillers particle size is limited due to the nature of filler SiCB, therefore, the particles size effect on strain energy density are further investigated by simulation. The Mooney–Rivlin model was used to simulate the particle size effect on the strain energy density of the composite samples via finite element analysis coded with ABAQUS, which was carried out at the different strain. Uniaxial cyclic test data was used as the input source to calculate the coefficients. Figure 9 shows the strain energy density distribution profiles of model NR/BR composites, where fillers are schematized by rigid body balls with different radii (r = 0.1, 0.2, 0.3 and 0.4 mm) at the strain level of 25% and 35%, respectively. Composites with larger particle size show a higher strain energy density of composites when the strain level increases from 25% to 35%.
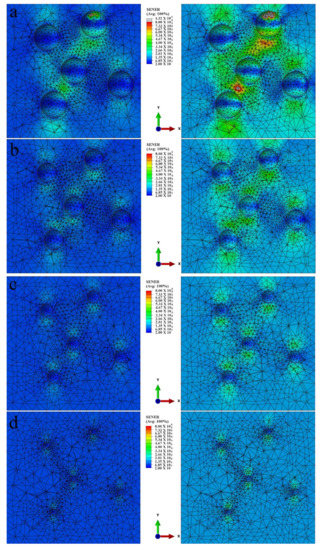
Figure 9.
Contour plots of strain energy density distributions in the uniaxial specimen for model NR/BR composites filled with different particle size with diameter of (a) r = 0.4 mm, (b) r = 0.3 mm, (c) r = 0.2 mm, (d) r = 0.1 mm, at different strain level from 25% to 35%.
4. Conclusions
In summary, Δr and Ω associated with energy dissipation from different composites subjected to uniaxial cyclic tensile testing were used for the first time to evaluate the effect of filler particle size and polymers’ crosslinking degree on the Mullins effect. The study was performed by evaluating the relationship between Δr, Ω of the different composites and the maximum strain. When the particle size of filler was the same, increased crosslinking degree led to a reduced Mullins effect of the composites. In contrast, filler with larger particle size promoted the Mullins effect when other conditions were the same. Δr and Ω could be the effective factors to describe the Mullins effect, which makes it possible to understand the softening performance of rubber composites caused by the filler size or crosslinking degree of matrix in practice.
Supplementary Materials
The following are available online at https://www.mdpi.com/article/10.3390/polym13142284/s1, Figure S1: Infrared spectra of NR compared with MNR, Figure S2: Stress–strain response of SiCB-NR/BR subjected to cyclic uniaxial tension: (a) ε = 0.5, (b) ε = 1.0, (c) ε = 2.0, (d) ε = 3.0, Figure S3: Stress–strain response of SiCB-MNR1/BR subjected to cyclic uniaxial tension: (a) ε = 0.5, (b) ε = 1.0, (c) ε = 2.0, (d) ε = 3.0, Figure S4: Stress–strain response of SiCB-MNR2/BR subjected to cyclic uniaxial tension: (a) ε = 0.5, (b) ε = 1.0, (c) ε = 2.0, (d) ε = 3.0, Figure S5: Stress–strain response of SiCB-MNR3/BR subjected to cyclic uniaxial tension: (a) ε = 0.5, (b) ε = 1.0, (c) ε = 2.0, (d) ε = 3.0, Figure S6: Stress–strain response of SiCB-MNR4/BR subjected to cyclic uniaxial tension: (a) ε = 0.5, (b) ε = 1.0, (c) ε = 2.0, (d) ε = 3.0, Figure S7: Stress–strain response of M1SiCB-NR/BR subjected to cyclic uniaxial tension: (a) ε = 0.5, (b) ε = 1.0, (c) ε = 2.0, (d) ε = 3.0, Figure S8: Stress–strain response of M2SiCB-NR/BR subjected to cyclic uniaxial tension: (a) ε = 0.5, (b) ε = 1.0, (c) ε = 2.0, (d) ε = 3.0, Table S1: Various milling parameters in designed experiments, Table S2: Mechanical properties of the rubber materials.
Author Contributions
M.Q.: Conceptualization, Methodology, Software, Validation, Formal analysis, Investigation, Writing—original draft. B.Z.: Resources, Validation. Z.C.: Investigation, Validation. W.H.: Resources. X.W.: Resources, Project administration, Funding acquisition. B.T.: Investigation, Validation. Q.L.: Writing—review and editing. Y.Z.: Conceptualization, Methodology, Writing-review & editing, Supervision, Project administration. All authors have read and agreed to the published version of the manuscript.
Funding
This work was partly supported by the National Nature Science Foundation of China (No. 51502108) and the Foundation of Jilin Provence Development and Reform Commission, China (No. 2014N145).
Institutional Review Board Statement
Not applicable.
Informed Consent Statement
Informed consent was obtained from all subjects involved in the study.
Data Availability Statement
The data presented in the study are available on request from the corresponding author.
Acknowledgments
The authors are grateful to the National Nature Science Foundation of China (No. 51502108) and the Foundation of Jilin Provence Development and Reform Commission, China (No. 2014N145).
Conflicts of Interest
The authors declare no conflict of interest.
Appendix A
Table A1.
The list of notations.
Table A1.
The list of notations.
| Symbol | Physical Meaning |
|---|---|
| ν | Crosslinking degree |
| Sz | Size of filler |
| εm | The maximum strain |
| W0 | The stored elastic energy in loading processes |
| Wu | The released energy in the unloading process |
| Wr | The stored elastic energy in reloading processes |
| D | The energy dissipation |
| Δ | The dissipation factors |
| Ω | The difference of the dissipation factors |
References
- Harish, A.B.; Wriggers, P.; Jungk, J.; Hojdis, N.; Recker, C. Mesoscale constitutive modeling of non-crystallizing filled elastomers. Comput. Mech. 2016, 57, 653–677. [Google Scholar] [CrossRef]
- Yang, R.; Song, Y.; Zheng, Q. Payne effect of silica-filled styrene-butadiene rubber. Polymers 2017, 116, 304–313. [Google Scholar] [CrossRef]
- Ponnamma, D.; Thomas, S. Non-Linear Viscoelasticity of Rubber Composites and Nanocomposites. In Influence of Filler Geometry and Size in Different Length Scales Preface; Advances in Polymer Science; Springer: Cham, Switzerland, 2014; Volume 264, pp. V–VII. [Google Scholar]
- Mullins, L. Effect of Stretching on the Properties of Rubber. Rubber Chem. Technol. 1948, 21, 281–300. [Google Scholar] [CrossRef]
- Diani, J.; Fayolle, B.; Gilormini, P. A review on the Mullins effect. Eur. Polym. J. 2009, 45, 601–612. [Google Scholar] [CrossRef] [Green Version]
- Diaz, R.; Diani, J.; Gilormini, P. Physical interpretation of the Mullins softening in a carbon-black filled SBR. Polymers 2014, 55, 4942–4947. [Google Scholar] [CrossRef] [Green Version]
- Zhang, H.; Scholz, A.K.; Vion-Loisel, F.; Merckel, Y.; Brieu, M.; Brown, H.; Roux, S.; Kramer, E.J.; Creton, C. Opening and closing of nanocavities under cyclic loading in a soft nanocomposite probed by real-time small-angle X-ray scattering. Macromolecules 2013, 46, 900–913. [Google Scholar] [CrossRef]
- Le Cam, J.-B.; Huneau, B.; Verron, E.; Gornet, L. Mechanism of fatigue crack growth in carbon black filled natural rubber. Macromolecules 2004, 37, 5011–5017. [Google Scholar] [CrossRef] [Green Version]
- Mai, T.-T.; Okuno, K.; Tsunoda, K.; Urayama, K. Anisotropic stress-softening effect on fast dynamic crack in filler-reinforced elastomers. Mech. Mater. 2021, 155, 103786. [Google Scholar] [CrossRef]
- Mullins, L.; Tobin, N.R. Theoretical model for the elastic behavior of filler-reinforced vulcanized rubbers. Rubber Chem. Technol. 1957, 30, 555–571. [Google Scholar] [CrossRef]
- Mullins, L.; Tobin, N.R. Stress softening in rubber vulcanizates. Part I. Use of a strain amplification factor to describe the elastic behavior of filler-reinforced vulcanized rubber. J. Appl. Polym. Sci. 1965, 9, 2993–3009. [Google Scholar] [CrossRef]
- Merckel, Y.; Diani, J.; Brieu, M.; Caillard, J. Constitutive modeling of the anisotropic behavior of Mullins softened filled rubbers. Mech. Mater. 2013, 57, 30–41. [Google Scholar] [CrossRef] [Green Version]
- Qi, H. Constitutive model for stretch-induced softening of the stress-stretch behavior of elastomeric materials. J. Mech. Phys. Solids 2004, 52, 2187–2205. [Google Scholar] [CrossRef]
- Zhu, P.; Zhong, Z. Constitutive modelling for the mullins effect with permanent set and induced anisotropy in particle-filled rubbers. Appl. Math. Model. 2021, 97, 19–35. [Google Scholar] [CrossRef]
- Arash, B.; Unger, R.; Exner, W.; Rolfes, R. A finite deformation gradient-enhanced damage model for nanoparticle/polymer nanocomposites: An atomistically-informed multiscale approach. Compos. Struct. 2021, 258, 113211. [Google Scholar] [CrossRef]
- Itskov, M.; Ehret, A.; Weinhold, G.; Kazakevičiutė-Makovska, R. A thermodynamically consistent phenomenological model of the anisotropic Mullins effect. ZAMM 2010, 90, 370–386. [Google Scholar] [CrossRef]
- Diani, J.; Brieu, M.; Vacherand, J. A damage directional constitutive model for Mullins effect with permanent set and induced anisotropy. Eur. J. Mech. A/Solids 2006, 25, 483–496. [Google Scholar] [CrossRef]
- Dargazany, R.; Khiêm, V.N.; Itskov, M. A generalized network decomposition model for the quasi-static inelastic behavior of filled elastomers. Int. J. Plast. 2014, 63, 94–109. [Google Scholar] [CrossRef]
- Khiêm, V.N.; Itskov, M. An averaging based tube model for deformation induced anisotropic stress softening of filled elastomers. Int. J. Plast. 2017, 90, 96–115. [Google Scholar] [CrossRef]
- Morovati, V.; Bahrololoumi, A.; Dargazany, R. Fatigue-induced stress-softening in cross-linked multi-network elastomers: Effect of damage accumulation. Int. J. Plast. 2021, 142, 102993. [Google Scholar] [CrossRef]
- Dargazany, R.; Itskov, M. Constitutive modeling of the Mullins effect and cyclic stress softening in filled elastomers. Phys. Rev. E 2013, 88, 012602. [Google Scholar] [CrossRef]
- Blanchard, A.F.; Parkinson, D. Breakage of Carbon-Rubber Networks by Applied Stress. Ind. Eng. Chem. 1952, 44, 799–812. [Google Scholar] [CrossRef]
- Davis, D.A.; Hamilton, A.; Yang, J.; Cremar, L.D.; Van Gough, D.; Potisek, S.L.; Ong, M.T.; Braun, P.V.; Martínez, T.J.; White, S.; et al. Force-induced activation of covalent bonds in mechanoresponsive polymeric materials. Nature 2009, 459, 68–72. [Google Scholar] [CrossRef]
- Yin, Y.; Bertin, N.; Wang, Y.; Bao, Z.; Cai, W. Topological origin of strain induced damage of multi-network elastomers by bond breaking. Extreme Mech. Lett. 2020, 40, 100883. [Google Scholar] [CrossRef]
- Dargazany, R.; Itskov, M. A network evolution model for the anisotropic Mullins effect in carbon black filled rubbers. Int. J. Solids Struct. 2009, 46, 2967–2977. [Google Scholar] [CrossRef] [Green Version]
- Cantournet, S.; Desmorat, R.; Besson, J. Mullins effect and cyclic stress softening of filled elastomers by internal sliding and friction thermodynamics model. Int. J. Solids Struct. 2009, 46, 2255–2264. [Google Scholar] [CrossRef]
- Kraus, G.; Childers, C.W.; Rollmann, K.W. Stress softening in carbon black-reinforced vulcanizates. Strain rate and temperature effects. J. Appl. Polym. Sci. 1966, 10, 229–244. [Google Scholar] [CrossRef]
- Lorenz, H.; Freund, M.; Juhre, D.; Ihlemann, J.; Klüppel, M. Constitutive generalization of a microstructure-based model for filled elastomers. Macromol. Theory Simul. 2010, 20, 110–123. [Google Scholar] [CrossRef]
- Hanson, D.E.; Hawley, M.; Houlton, R.; Chitanvis, K.; Rae, P.; Orler, E.B.; Wrobleski, D.A. Stress softening experiments in silica-filled polydimethylsiloxane provide insight into a mechanism for the Mullins effect. Polymers 2005, 46, 10989–10995. [Google Scholar] [CrossRef]
- Qian, D.; Meng, F. Modelling Mullins effect induced by chain delamination and reattachment. Polymers 2021, 222, 123608. [Google Scholar] [CrossRef]
- Ma, C.; Ji, T.; Robertson, C.G.; Rajeshbabu, R.; Zhu, J.; Dong, Y. Molecular insight into the Mullins effect: Irreversible disentanglement of polymer chains revealed by molecular dynamics simulations. Phys. Chem. Chem. Phys. 2017, 19, 19468–19477. [Google Scholar] [CrossRef]
- Li, Z.; Xu, H.; Xia, X.; Song, Y.; Zheng, Q. Energy dissipation accompanying Mullins effect of nitrile butadiene rubber/carbon black nanocomposites. Polymers 2019, 171, 106–114. [Google Scholar] [CrossRef]
- Clough, J.M.; Creton, C.; Craig, S.L.; Sijbesma, R.P. Covalent bond scission in the mullins effect of a filled elastomer: Real-time visualization with mechanoluminescence. Adv. Funct. Mater. 2016, 26, 9063–9074. [Google Scholar] [CrossRef] [Green Version]
- Xue, B.; Wang, X.; Sui, J.; Xu, D.; Zhu, Y.; Liu, X. A facile ball milling method to produce sustainable pyrolytic rice husk bio-filler for reinforcement of rubber mechanical property. Ind. Crop. Prod. 2019, 141, 111791. [Google Scholar] [CrossRef]
- Qian, M.; Huang, W.; Wang, J.; Wang, X.; Liu, W.; Zhu, Y. Surface treatment effects on the mechanical properties of silica carbon black reinforced natural rubber/butadiene rubber composites. Polymers 2019, 11, 1763. [Google Scholar] [CrossRef] [PubMed] [Green Version]
- Hirschl, C.; Biebl–Rydlo, M.; De Biasio, M.; Mühleisen, W.; Neumaier, L.; Scherf, W.; Oreski, G.; Eder, G.; Chernev, B.; Schwab, W. Determining the degree of cross-linking of ethylene vinyl acetate photovoltaic module encapsulants—A comparative study. Sol. Energy Mater. Sol. Cells 2013, 116, 203–218. [Google Scholar] [CrossRef] [Green Version]
- Flory, P.J.; Rehner, J. Statistical theory of chain configuration and physical properties of high polymers. Ann. N. Y. Acad. Sci. 1943, 44, 419–429. [Google Scholar] [CrossRef]
- Bornstein, D.; Pazur, R. The sulfur reversion process in natural rubber in terms of crosslink density and crosslink density distribution. Polym. Test. 2020, 88, 106524. [Google Scholar] [CrossRef]
- El-Sabbagh, S.; Yehia, A. Detection of crosslink density by different methods for natural rubber blended with SBR and NBR. Egypt. J. Solids 2007, 30, 157–166. [Google Scholar]
- Sombatsompop, N. Practical concerns regarding the use of the Mooney-Rivlin equation to assess degree of crosslinking of swollen rubber vulcanisates. Polym. Polym. Compos. 1999, 7, 41–44. [Google Scholar]
- Mermet-Guyennet, M.; de Castro, J.G.; Varol, H.S.; Habibi, M.; Hosseinkhani, B.; Martzel, N.; Sprik, R.; Denn, M.; Zaccone, A.; Parekh, S.; et al. Size-dependent reinforcement of composite rubbers. Polymers 2015, 73, 170–173. [Google Scholar] [CrossRef]
- Mermet-Guyennet, M.; Dinkgreve, M.; Habibi, M.; Martzel, N.; Sprik, R.; Denn, M.; Bonn, D. Dependence of nonlinear elasticity on filler size in composite polymer systems. Rheol. Acta 2017, 56, 583–589. [Google Scholar] [CrossRef] [Green Version]
- Wang, Z.; Smith, A.T.; Wang, W.; Sun, L. Versatile nanostructures from rice husk biomass for energy applications. Angew. Chem. Int. Ed. 2018, 57, 13722–13734. [Google Scholar] [CrossRef] [PubMed]
- Sekkar, V. Comparison between crosslink densities derived from stress-strain data and theoretically data evaluated through the α-model approach for a polyurethane network system based on hydroxyl terminated polybutadiene and isophorone-diisocyanate. J. Appl. Polym. Sci. 2010, 117, 920–925. [Google Scholar] [CrossRef]
- Saleesung, T.; Reichert, D.; Saalwächter, K.; Sirisinha, C. Correlation of crosslink densities using solid state NMR and conventional techniques in peroxide-crosslinked EPDM rubber. Polymers 2015, 56, 309–317. [Google Scholar] [CrossRef]
- Twardowski, T.; Kramer, O. Elastic contributions from chain entangling and chemical cross-links in elastomer networks in the small-strain limit. Macromolecules 1991, 24, 5769–5771. [Google Scholar] [CrossRef]
- Polgar, L.M.; Hagting, E.; Raffa, P.; Mauri, M.; Simonutti, R.; Picchioni, F.; Van Duin, M. Effect of Rubber Polarity on Cluster Formation in Rubbers Cross-Linked with Diels–Alder Chemistry. Macromolecules 2017, 50, 8955–8964. [Google Scholar] [CrossRef] [PubMed]
- Mai, T.-T.; Morishita, Y.; Urayama, K. Novel features of the Mullins effect in filled elastomers revealed by stretching measurements in various geometries. Soft Matter 2017, 13, 1966–1977. [Google Scholar] [CrossRef] [PubMed]
- Zhong, D.; Xiang, Y.; Yin, T.; Yu, H.; Qu, S.; Yang, W. A physically-based damage model for soft elastomeric materials with anisotropic Mullins effect. Int. J. Solids Struct. 2019, 176–177, 121–134. [Google Scholar] [CrossRef]
- Diani, J.; Le Tallec, P. A fully equilibrated microsphere model with damage for rubberlike materials. J. Mech. Phys. Solids 2019, 124, 702–713. [Google Scholar] [CrossRef] [Green Version]


Publisher’s Note: MDPI stays neutral with regard to jurisdictional claims in published maps and institutional affiliations. |
© 2021 by the authors. Licensee MDPI, Basel, Switzerland. This article is an open access article distributed under the terms and conditions of the Creative Commons Attribution (CC BY) license (https://creativecommons.org/licenses/by/4.0/).