Abstract
The post-process thermal treatment of thermoplastics improves their mechanical properties, but causes deformations in parts, making them unusable. This work proposes a powder mould to prevent dimensional part deformation and studies the influence of line building direction in part deformations in a post-process thermal treatment of 3D printed polymers. Two sets of ABS (acrylonitrile butadiene styrene) test samples manufactured by fused deposition modelling (FDM) in six different raster directions have been treated and evaluated. One set has been packed with a ceramic powder mould during thermal treatment to evaluate deformations and mould effectiveness. Thermogravimetric tests have been carried out on ABS samples, concluding that the thermal treatment of the samples does not cause degradations in the polymeric material. An analysis of variance (ANOVA) was performed to study internal building geometry and mould influence on part deformation after the thermal treatment. It can be concluded that powder mould considerably reduces dimensional deformations during the thermal treatment process, with length being the most affected dimension for deformation. Attending to the length, mould effectiveness is greater than 80% in comparison to non-usage of moulding, reaching 90% when the building lines are in the same direction as the main part.
1. Introduction
Fused deposition modelling (FDM) has become the most widely adopted additive manufacturing technology for manufacturing complex structures. This success can mainly be attributed to its extraordinary ability to manufacture complex parts without special tooling, besides significantly reducing material waste, time and cost process of manufacturing prototypes [1]. Despite the proliferation of this manufacturing technology, FDM is used in a few functional parts because they have anisotropic characteristics [2,3,4] and their mechanical properties are usually inferior to those parts fabricated through injection moulding [5]. The mechanical properties of parts manufactured with the FDM process depend on several variables, such as parameters related to process conditions, parts orientation during manufacturing, percentage filling, space between filaments, etc. [6,7,8]. On the other hand, internal micro-void patterns and residual thermal stresses resulting from the manufacturing process also affect the mechanical properties of the final part [9,10,11]. Residual stresses are significant during material consolidation of the deposited layers, due to different factors: thermal or cooling stresses owed to differential cooling and building line orientation, resulting in internal stresses, and quenching stresses caused by cooling too quickly below the glass transition point before thermodynamic equilibrium is archived [12]. Additionally, residual stresses are influenced by the part manufacturing direction and its position during manufacturing [13].
The quality and mechanical properties of FDM parts can be improved if modifications before, on site and after manufacturing are made. In order to improve the quality, some works have developed a control system for the most common additive manufacturing processes and materials, including dimensional parts control [14]. Other studies improve the properties evaluating the effect of infill parameters [15,16], such as layer thickness, raster direction and layup order. These parameters have a significant effect on the mechanical performance. The anisotropic behaviour of parts could be minimized when FDM fabrication process parameters are properly configured [17]. Other authors evaluate the process parameters’ effect on stress accumulation during the deposition process. They conclude that stress accumulations are related to part distortions and depend on building parameters, such as layer thickness and line width [18]. Nevertheless, a proper selection of FDM parameters could improve the mechanical properties and it is possible to reach the obtained result using injection-moulded parts [19].
The most promising results to improve quality and mechanical properties have been found in post-manufacturing processes. One study designed and fabricated a device that uses acetone to modify FDM ABS parts surface to enhanced quality by providing smooth surfaces and fix imperfections [20]. On the other hand, other studies improve dimensional accuracy eliminating edge part defects by the laser-cutting post-process [21]. Thermal annealing is one of the best performing post-processes in FDM. The parts are heated between the glass transition and melting point temperature for a fixed time period and cooled to room temperature [22]. Annealing promotes the relaxation of residual stresses developed during cooling after building process, thanks to the molecular mobility of the amorphous fraction. Residual stresses can be related to dimensional deformations of the part [23]. The literature shows that heating ABS parts above its glass transition temperature produces material reflow that reduces internal micro-voids; therefore, annealing has positive results on the mechanical properties of ABS parts [24]. Annealing post-process increases interlayer adhesion and improves mechanical properties, therefore reducing the internal thermal stress that occurs as a result of manufacturing and the anisotropy of FDM parts. These improvements may significantly modify the structure and properties of FDM parts and depend on annealing temperatures, cooling methods and times, etc. They should be considered by the processing industry [25,26]. However, other studies have shown that thermal post-process annealing affects some infill patterns more than others. Additionally, these thermal treatments can cause deformations in the parts that make them unusable [25,27]. In addition, during the thermal process, mass loss may occur in the parts, which could result in a dimensional decrease of the part. These losses would occur in mass fraction of volatiles [28].
Tensile testing shows more positive results in semi-crystalline materials (PLA and Cu-PLA) than in the amorphous materials (ABS and Al-ASA), since the latter only show a small increment in tensile strength. Nevertheless, under the most aggressive annealing conditions, ABS 3D printed parts’ inter-laminar toughness increases more than 2700% than the non-annealed baseline material [29]. Therefore, if a significant improvement in the properties of ABS parts subjected to thermal post-processing is to be obtained, temperatures and times will have to be increased, leading to unacceptable deformations of the treated parts.
To avoid part deformations during thermal treatments, a recent study has packed complex-shaped parts in sodium chloride powder during the thermal remelting process [30]. An analysis of the treated parts reveals an improved internal structure that increases mechanical and changes optical properties. No noticeable part deformation was observed after the thermal process. However, several samples developed defects due to inadequate powder packing. Another study characterizes deformations and residual stress in FDM ABS parts under thermal treatment, obtaining shrinkages and displacement fields, and relating them to two key processing parameters: raster angle and printing speed [31].
Powder packing could be the most promising method to avoid part deformations during the thermal post-process. However, there is currently no work evaluating the effectiveness of this method. This work aims to evaluate the effectiveness of ceramic powder mould packing when aiming to avoid or minimize part deformations in 3D printed parts during thermal post-processes. The temperature and time of the thermal treatment have been increased in comparison with another studies [24] in order to obtain significant part deformations. To avoid undesired reactions during heat treatment, alumina has been selected as ceramic powder, because it is an inert material and does not react with plastic parts.
In this paper, dimensional part deformation in post-process thermal treatment is studied, in addition to the influence of part line building direction on the effectiveness of the mould to avoid part deformations. To reach this objective, variation of part dimensions (length, width and height) will be measured according to their line building direction. The thermal decomposition of the ABS is studied via thermogravimetric analysis (TGA) in order to ensure that mass loss is not noticeable in treated parts and is used to validate dimensional results, because mass loss might affect part dimensions. This work also develops an analysis of variance (ANOVA) to evaluate the effect of internal geometry and mould packaging in part deformation.
2. Materials and Methods
2.1. Test Specimens Design and Manufacturing
ABS sample geometries manufactured by FDM were printed in the lab and subsequently evaluated. The commercial 2.85 mm White ABS 3D Printer Filament Material (Ultimaker B.V., Gerdelmalsen, The Netherlands) was used. The values of the main thermal properties of ABS material used in this paper are as follows: the melting temperature range was 225–245 °C (test method according to ISO 294-1:2017 [32]) and the glass transition temperature was 97 °C (test method according to ISO 306:2013 [33]).
The samples were manufactured according to standard ISO 179-1:2010 [34] Type 1 (Figure 1) due to its external geometrical simplicity, which allowed us to print all building lines in a single direction and avoid stress concentration [16].
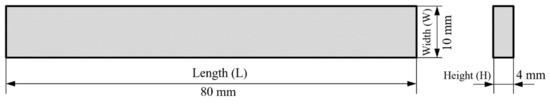
Figure 1.
ISO 179-1:2010 Type 1 geometry.
ABS samples were manufactured using an Ultimaker 3 Extended printer (Ultimaker B.V., Gerdelmalsen, The Netherlands) equipped with a 0.4 mm-diameter nozzle. All building lines of each specimen have been printed without differences between infill lines, wall lines and bottom and top layer lines. A unidirectional raster orientation with a 100% density infill line pattern was chosen. In the fabrication process, the following values were used: printing speed of 60 mm/s, temperature of 240 °C and build plate temperature of 80 °C. In order to reduce the interaction between lines of the same layer, a layer height of 0.2 mm and a line width of 0.5 mm were chosen (Figure 2).
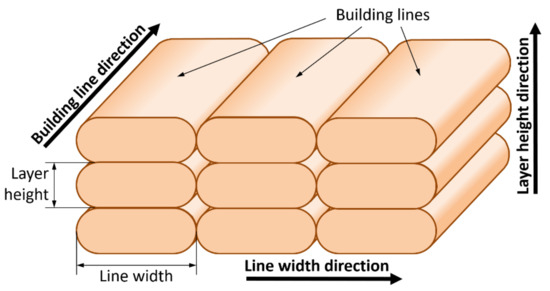
Figure 2.
Building line dimensions.
Cura software (4.9.1 Version, Ultimaker B.V., Gerdelmalsen, The Netherlands) was used to generate G-code files and to command and control all the process parameters. 3D printed sample geometries were modelled using Inventor software (Version 2019, Autodesk, Inc., San Rafael, CA, USA) and imported to Cura.
Internal Geometry
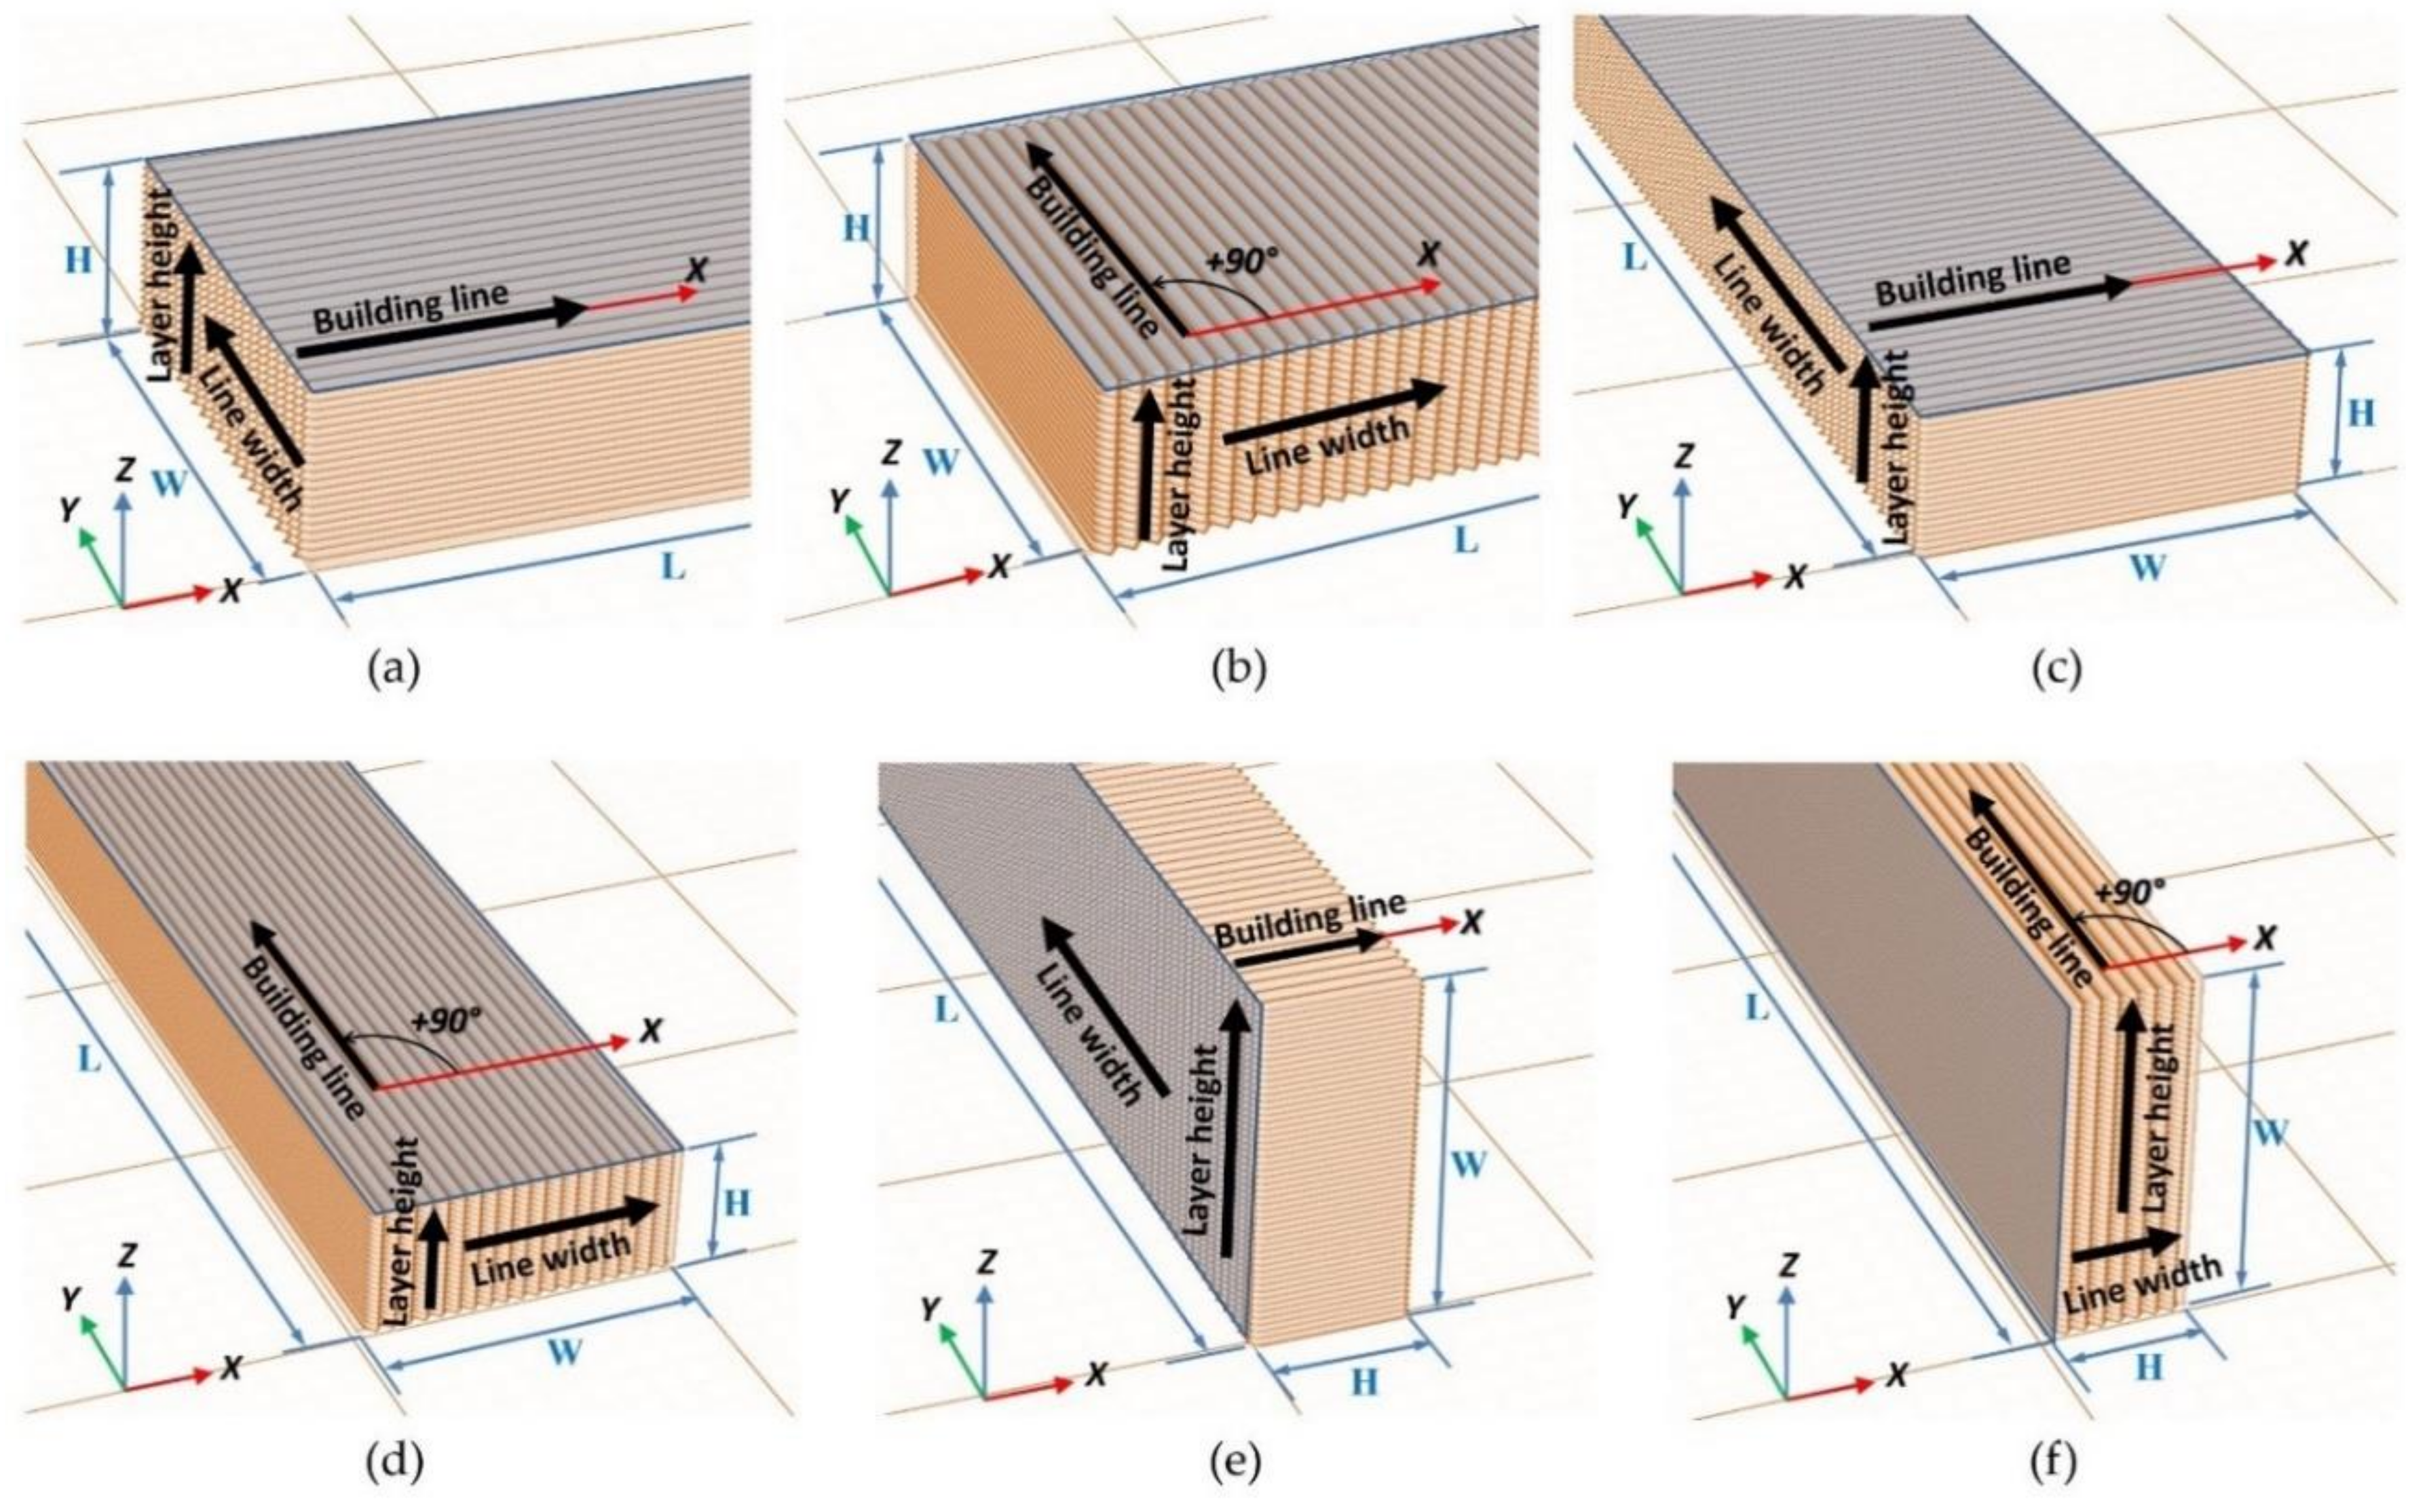
In order to manufacture and to code samples test, Standard ISO/ASTM 52921:2013 [35] was used to define orthogonal layer orientation with respect to the coordinate system of the 3D printer machine. As the orientation of building lines in each layer is not defined in this Standard, a nomenclature to code each test sample was developed, taking into account the orientation of building direction lines [4]. The samples with six different internal geometries based in building line directions were manufactured and coded as shown in Figure 3.
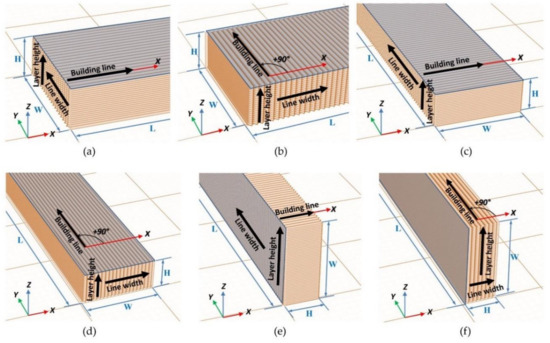
Figure 3.
Internal sample geometry code: (a) XY + 0; (b) XY + 90; (c) YX + 0; (d) YX + 90; (e) YZ + 0; (f) YZ + 90.
For each internal geometry, the directions of each dimension of the building lines (Figure 2) can be related to directions of the outer dimensions of the sample: length (L), width (W) and height (H) (Table 1).

Table 1.
Relationship between dimensions of the building lines and the directions of the sample dimensions for each type of internal sample geometry.
2.2. Thermal Post-Process Treatment
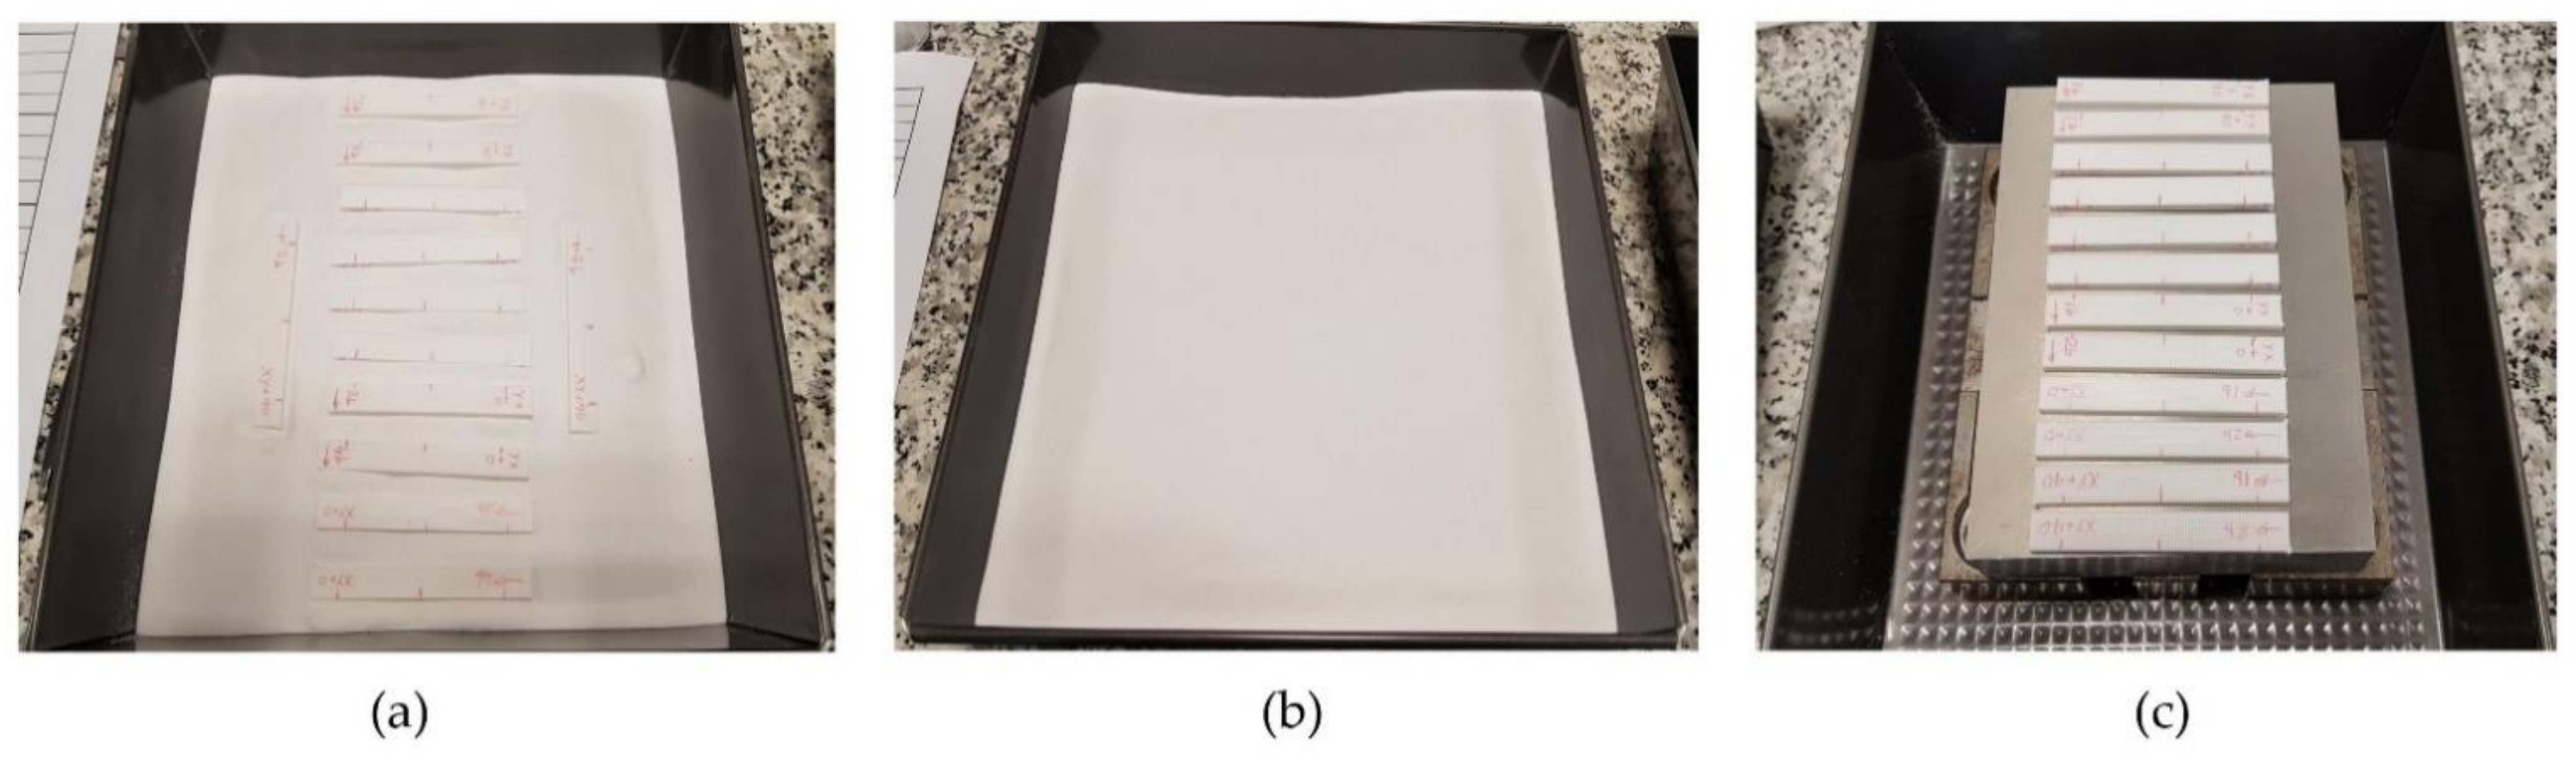
The samples set were introduced on a dry alumina powder bed inside a non-stick steel container (Figure 4a) and they were covered with an upper-layer alumina powder (Figure 4b), forming a ceramic mould around specimens in order to avoid deformations due to creep. A one-centimetre-thick alumina powder was used in both layers. Other samples were placed outside the mould (Figure 4c) to compare mould effectiveness. Samples are packed in aluminium oxide powder with granulometry of 150 micrometres and 99.78% purity (Protechno, Girona, Spain). The powder granulometry used was lower than layer height to ensure that no details were lost from the part surface. Ceramic powder was packed around the specimens with a pressure of 12 g/cm2, forming an expendable mould. For this purpose, another steel container with a metal plate of 7 kg was placed on top, covering the entire surface of the ceramic powder. To ensure constant pressure in the mould, the metal plate was maintained throughout the thermal process. No binding agents were used because the pressure was enough to ensure that the ceramic powder behaved as a solid.
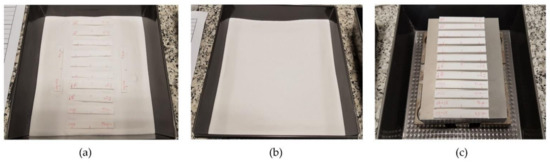
Figure 4.
(a) Samples set inside of the mould over a powder layer of 1 cm; (b) upper alumina powder layer of 1 cm covers samples; (c) samples set outside the mould, over the 7 kg metal plate.
Samples were heat treated in a convection furnace at a temperature of 135 °C (38 °C above ABS glass transition temperature) for 120 min. A 10 °C/min ramp was used to ensure that temperature inside the mould reached 135 °C. Before unpacking samples, the mould was kept in the furnace until it reached room temperature.
2.3. Design of Experiments
The internal geometry and the utilization of ceramic mould for packing samples were the variables considered to study dimensional deformations in samples after the thermal treatment process. The Taguchi’s method for two variables at different levels was used to elaborate the design of experiments (Table 2).
Table 2.
Variables and levels.
A full factorial design was used to determine the combination of variable levels to use for each experimental case (Table 3). Five replicas of each experiment were carried out.
Table 3.
Experimental parameters.
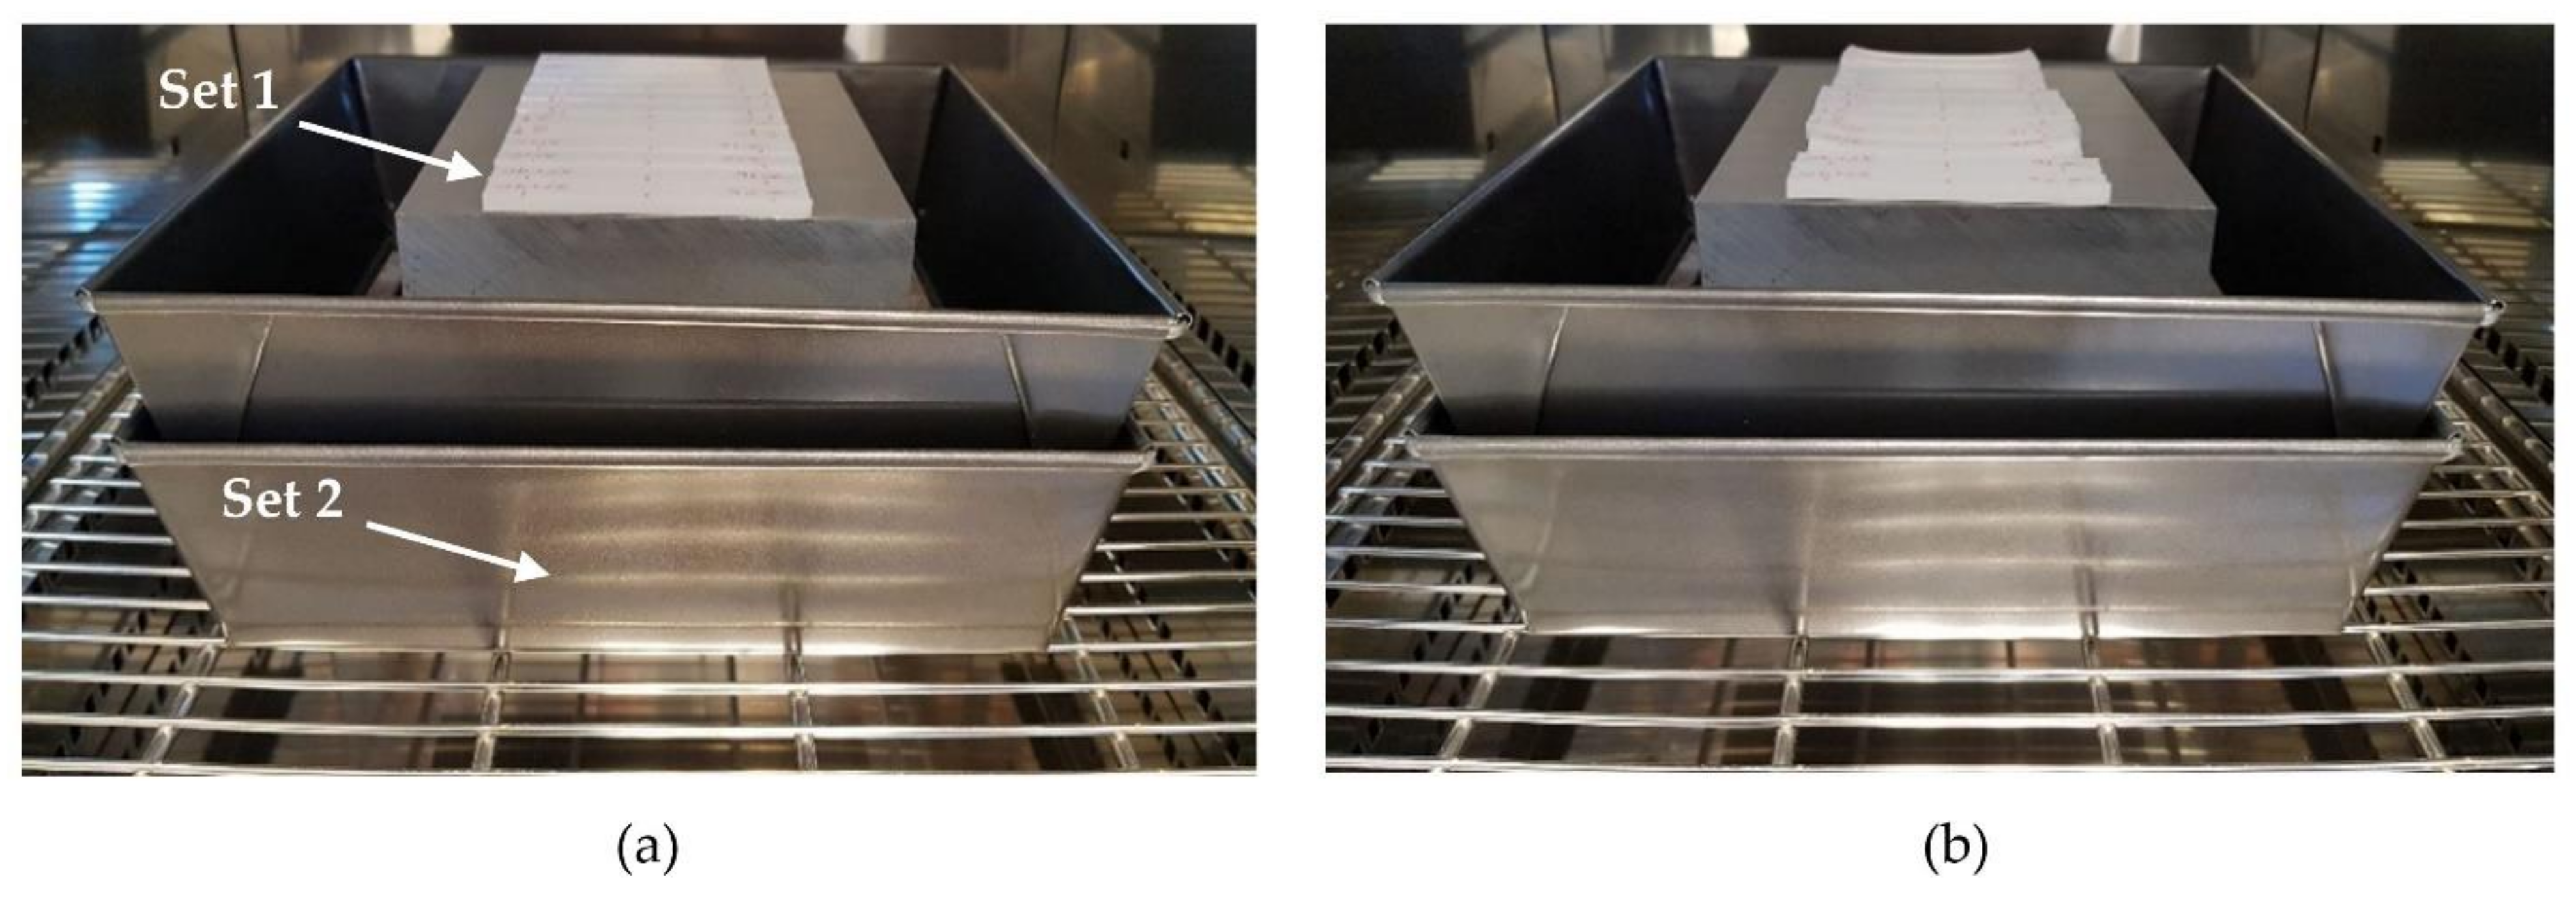
The experimental test was classified in two sets. Set 1 included samples from 1 to 6, where the ceramic mould was not used. Set 2 included samples from 7 to 12, where the ceramic mould was used, allowing us to study the mould effectiveness to prevent dimensional deformation in samples (Figure 5).
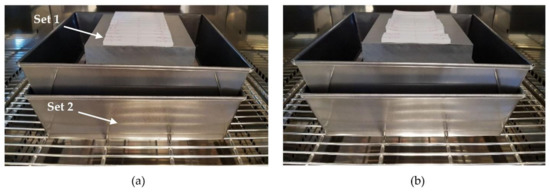
Figure 5.
(a) Samples before thermal treatment in the furniture; (b) after thermal process, deformation is clearly visible in samples of Set 1.
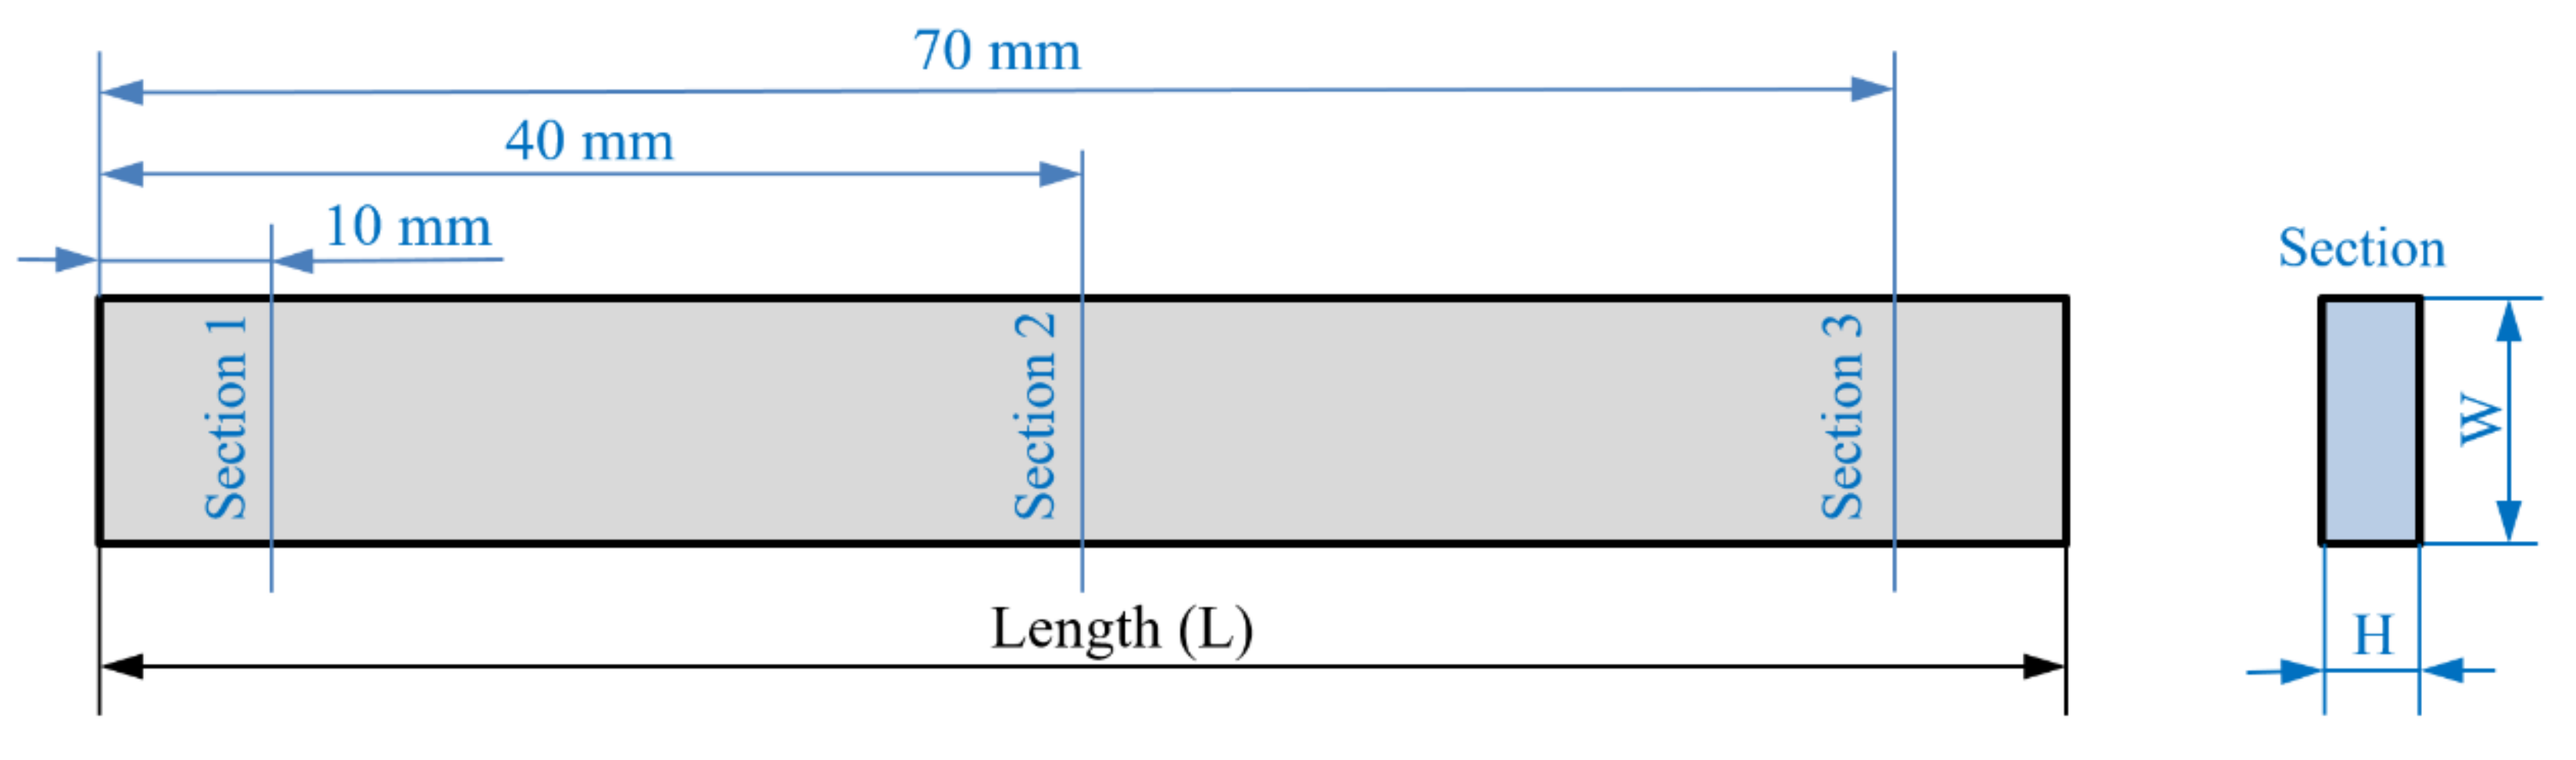
Dimensional measurements (length, width and height) were carried out in all tests to evaluate deformations on samples. The length (L), width (W) and height (H) values of each specimen are taken before and after thermal treatment in order to evaluate dimensional changes. The width (W) and height (H) values were obtained as the average of values in three sections of each specimen (Figure 6). The measurements were carried out with an electronic digital calliper instrument (Resolution = 0.01 mm, Accuracy = ±0.03 mm) according to the standard methods.

Figure 6.
Measured sections in each specimen.
In each specimen, ΔL, ΔW, and ΔH are calculated according to ISO 294-4:2018 [36] using Equations (1)–(3). Subscripts f and o indicate, respectively, measurements of each property evaluated after and before the thermal post-process.
2.4. Thermogravimetric Analysis
The thermal decomposition of the samples was carried out with a Thermogravimetric Analyzer (TGA-Q50, TA Instruments, NewCastle DE, USA). A Ni standard reference was used for the temperature calibration of TGA. The nitrogen flow was 40.0 mL min−1 through the balance. Samples were spread on a platinum pan and the gas over the sample was nitrogen or air at 60.0 mL min−1.
3. Results and Discussion
Table 4 shows the average measurements observed in variations of length (ΔL), width (ΔW) and height (ΔH) for all specimens in each sample. Negative values represent a decrease in percentage, while positive values represent an increase in percentage in every evaluated dimension.
Table 4.
Average dimensional changes after thermal treatment.
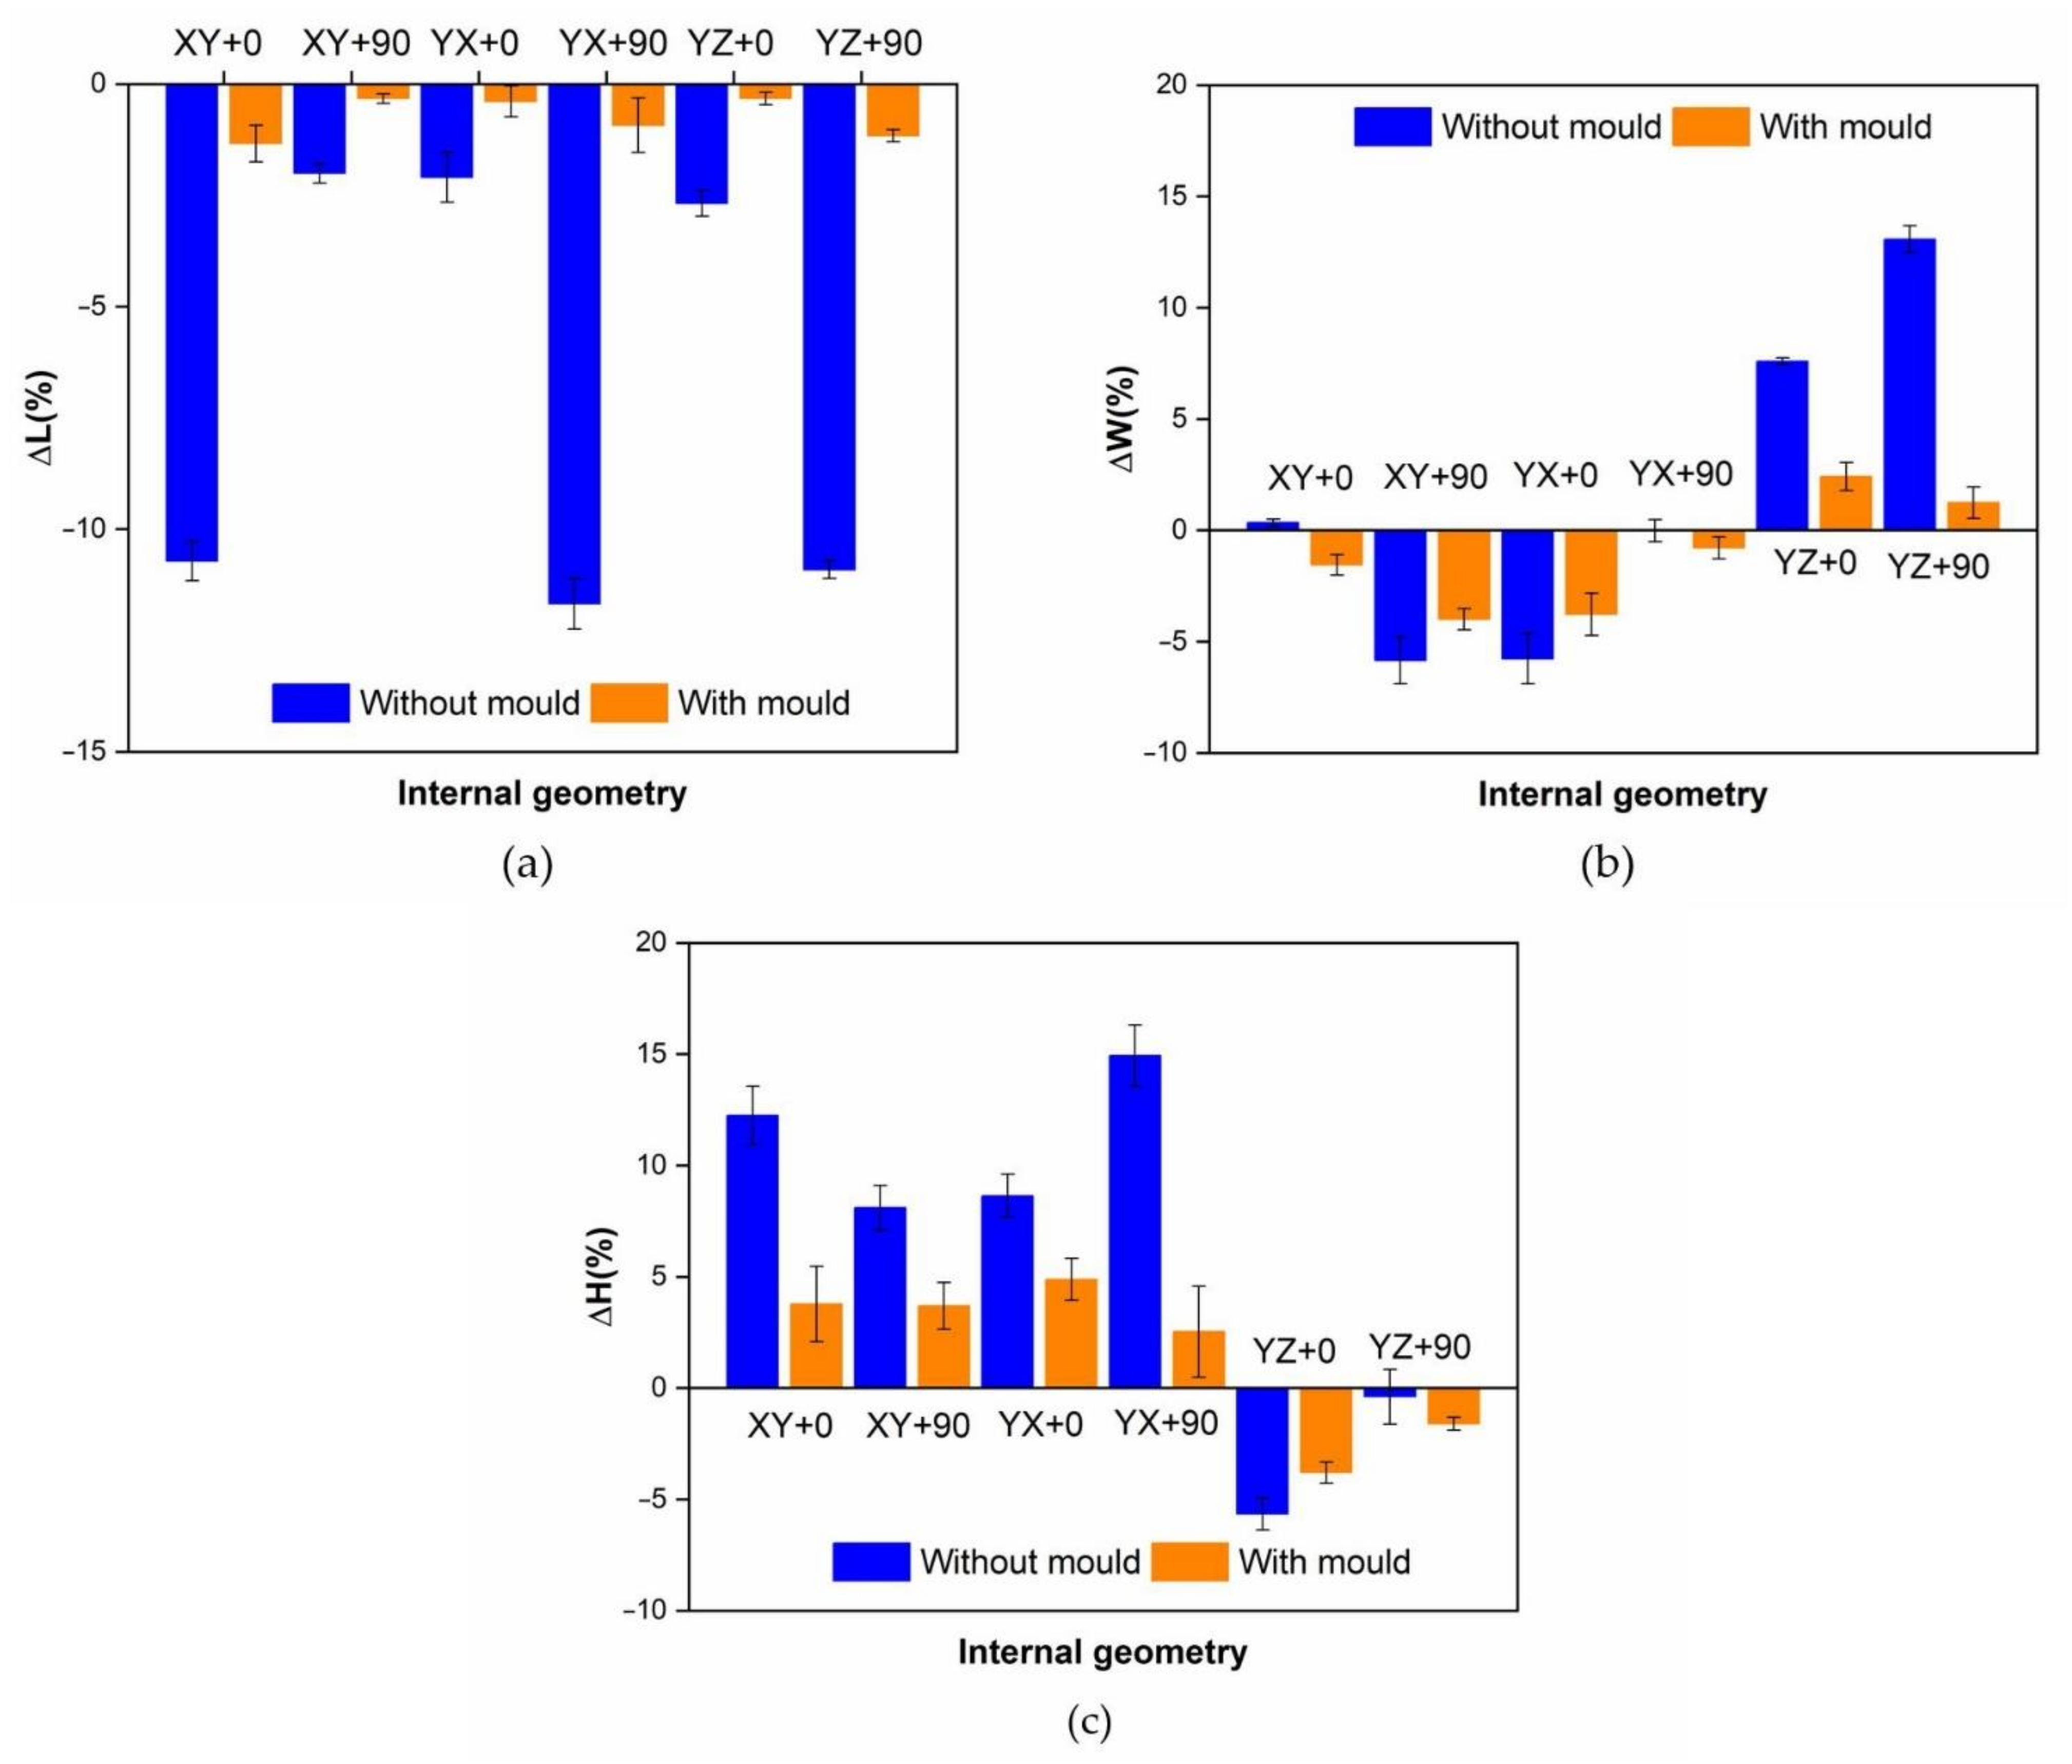
The values obtained for the average dimensional variations are represented in the bar charts in Figure 7. It can be observed that using a ceramic powder mould reduces the dimensional variations in the samples after thermal treatment, while the dimensional variation in samples without the mould during thermal treatment is quite significant.
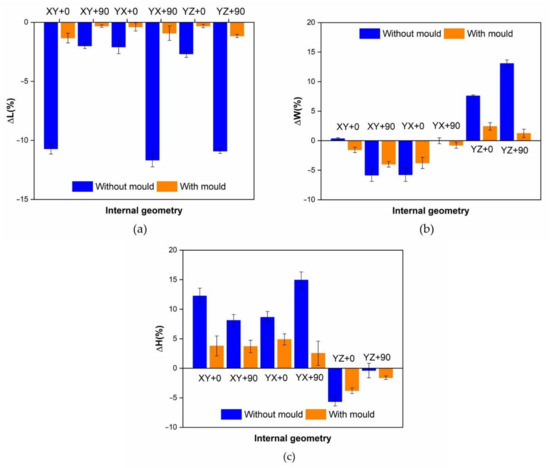
Figure 7.
Variations attending to internal geometry and powder mould usage. (a) Length variations; (b) width variations; (c) height variations.
The results show a decrease in the length (L) and the width (W), and an increase in the height (H) dimension for XY + 0, XY + 90, YX + 0 and YX + 90 internal geometries. On the other hand, in YZ + 0 and YZ + 90 internal geometries, a decrease in length (L) and height (H), and increase in width (W) dimension is observed. Shrinkage is always higher in the direction of the building lines, and the mould reduces deformations in all cases.
An analysis of variance (ANOVA) was performed to quantify the mould effectiveness to avoid dimensional variations during the thermal process in samples with different building directions (Table 5, Table 6 and Table 7). In order to analyse the significant effect of the factors on responses, an F test with a level significance of 0.05 has been used. Table 5, Table 6 and Table 7 show that internal geometry and the use of ceramic mould have significant effect on all dimensional changes produced after thermal post-process.
Table 5.
ANOVA for ΔL.
Table 6.
ANOVA for ΔW.
Table 7.
ANOVA for ΔH.
3.1. Internal Geometry Influence
Fisher’s Least Significant Difference (LSD) procedure was used to discriminate between mean values. No statistically significant differences were observed between the internal geometry XY + 0 vs. YX + 90 and XY + 90 vs. YX + 0 in any of the dimensions analysed (Table 8). These pairs of internal geometries have been included because some studies [13] show that in some 3D printers the position of parts in the build plate can generate residual tensions and subsequent deformations. However, in these tests, the 3D printer has not generated differences between them.
Table 8.
Dimension deformation showing significant differences between internal geometries (* denotes a statistically significant difference).
As shown by the ANOVA and bar charts (Figure 7), a strong influence of internal geometry on the dimensional variations of samples was observed. Samples made with building lines in the main sample direction (XY + 0, YX + 90 and YZ + 90 samples) show five times more length deformation than the samples made with building lines in a perpendicular direction to the main sample direction (XY + 90, YX + 0 and YZ + 0). If a mould is used, three times longer deformation is shown. Attending to width (W) deformation, samples with building lines in the direction of the width of the part (XY + 90 and YX + 0) present elevated shrinkage. In samples with building lines in the height direction (YZ + 0 and YZ + 90), shrinkage only appears in this direction. It can be concluded that there is a relationship between building line directions and the shrinkages in the part.
Table 9 shows deformations in the building line, line width and layer height directions. The deformation of samples during the thermal treatment mainly appears in the direction of the building lines and layer height. Elongations always appear in the layer height direction, because building lines shrink the part in its direction. There is a major deformation in the layer height direction than in the line width direction due to the larger contact area between building lines in this direction (Figure 2). It demonstrates the influence of these parameters in part deformations during the thermal process. On the other hand, the average deformations in the line width were ten times smaller than in the layer height direction due to the small contact zone, because the value of the line width is 0.5 mm, instead of the 0.2 mm value of the layer height. If a mould is used, this difference decreases up to five times.
Table 9.
Deformations between dimensions of the building lines and the directions of the sample dimensions for each type of internal sample geometry.
In Table 9, samples can be grouped in two sets: XY + 0, YX + 90, YZ + 90 in the first set and XY + 90, YX + 0, YZ + 90 in the second one. Deformations in building line, line width and layer height directions are similar in every set. Deformations during the thermal treatment are more important if the building line direction matches the main length of the part. All these effects are observed independently if a mould is used or not. For this reason, in order to reduce deformations, building lines directions at 90° to the longest dimension of the part should be selected to manufacture it.
3.2. Ceramic Mould Effectiveness
Using a ceramic mould during the thermal post-process has a clear influence on decreasing all dimension deformations (Figure 7). Nevertheless, the length (Figure 7a) is the most affected dimension for deformation. For this reason, length will be used to evaluate mould effectiveness in all internal geometries studied.
In order to measure mould effectiveness, Equation (4) is used, E being the mould effectiveness to avoid deformations in the length L during the thermal post-process.
The mould effectiveness for each evaluated direction is shown in Table 10.
Table 10.
Mould effectiveness.
It can be observed that mould effectiveness decreased when parts are fabricated with XY + 90 y YX + 0 internal geometries, due to the fact that the largest shrinkages during the thermal process were produced in the direction of the manufacturing lines.
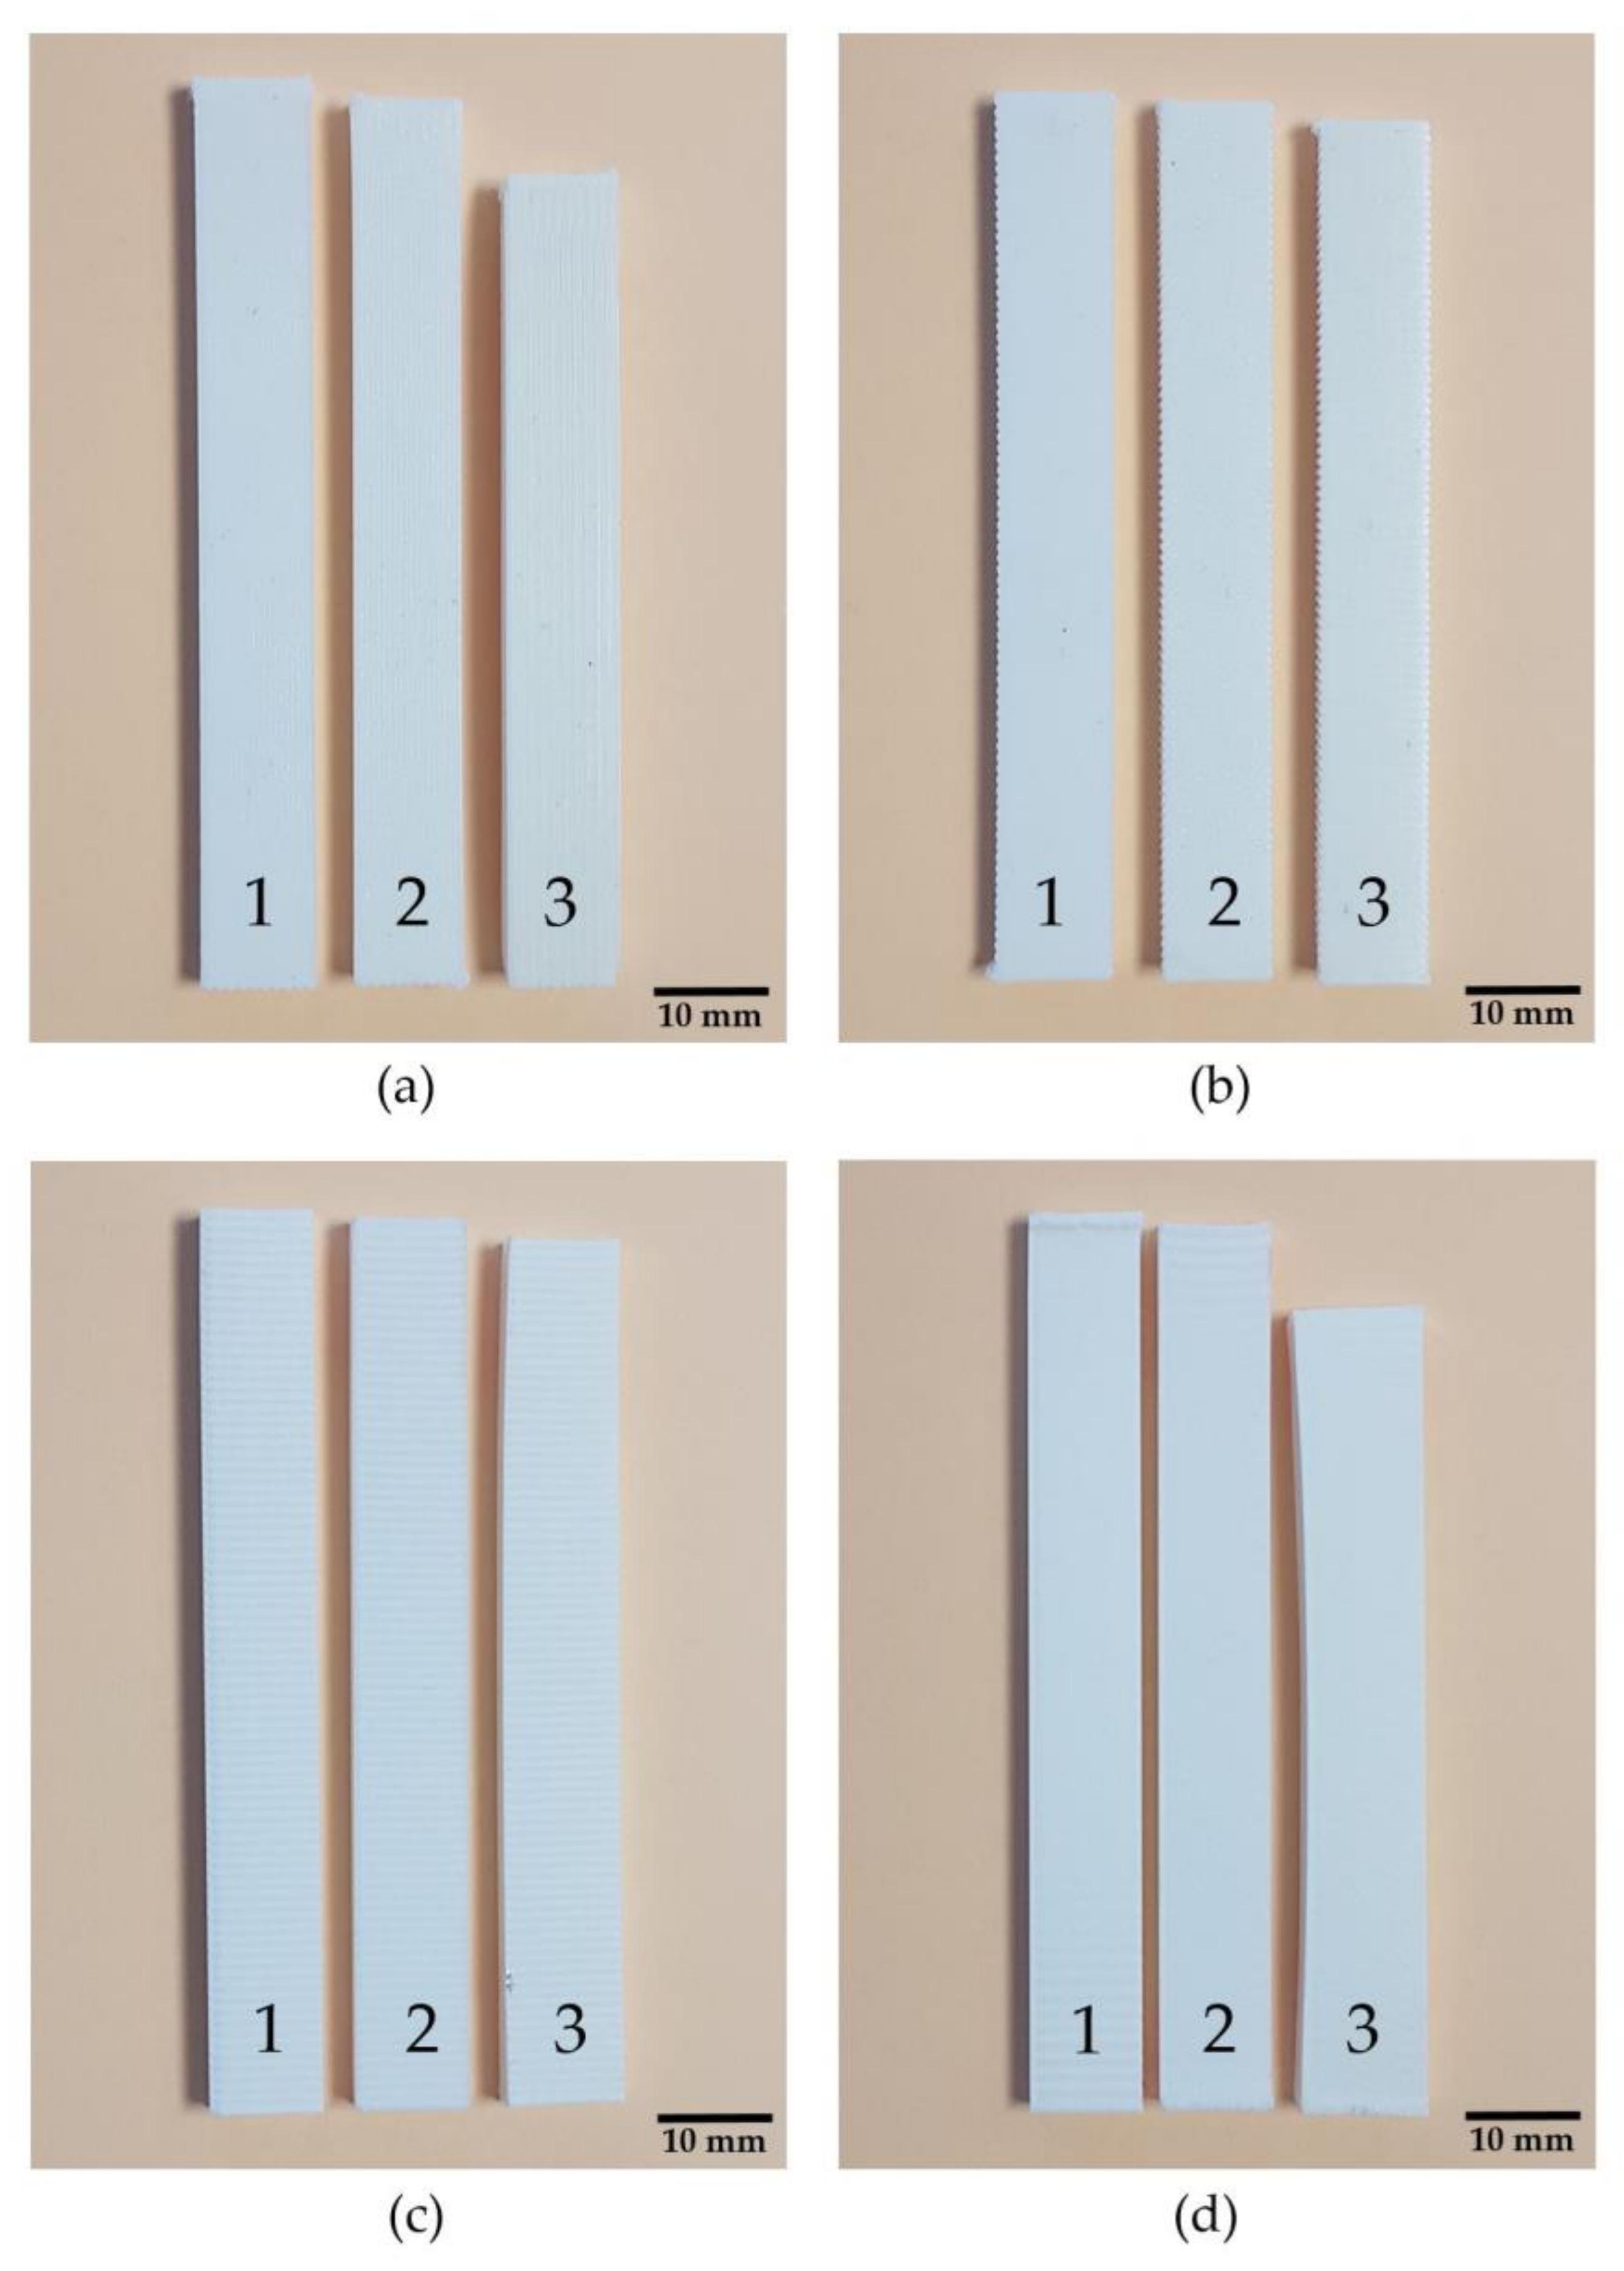
Deformations in significant internal geometries are shown in Figure 8. In all cases, the effectiveness of the mould is clearly visible because it reduces sample deformation. Nevertheless, samples with internal geometries XY + 0 and YZ + 0 are less affected by deformations in a thermal post-process. It can be concluded that mould is less necessary when building lines are perpendicular to main part dimension. On the other hand, XY + 0 and YZ + 90 samples are stronger affected by deformations, being the mould that is highly recommended when the building lines are in the same direction that main part dimension.
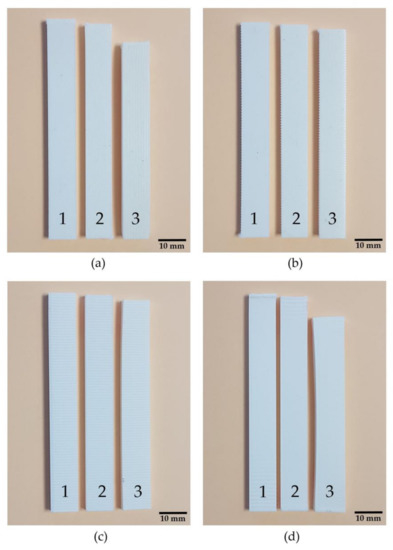
Figure 8.
Specimen comparison before thermal process (1), after thermal process with mould (2) and after thermal process without mould (3). (a) XY + 0 Samples; (b) XY+90 Samples; (c) YZ + 0 Samples; (d) YZ + 90 Samples.
3.3. Thermogravimetric Analysis
In order to determine whether the thermal treatments performed on ABS samples modify their composition, thermogravimetric tests have been carried out [28,37].
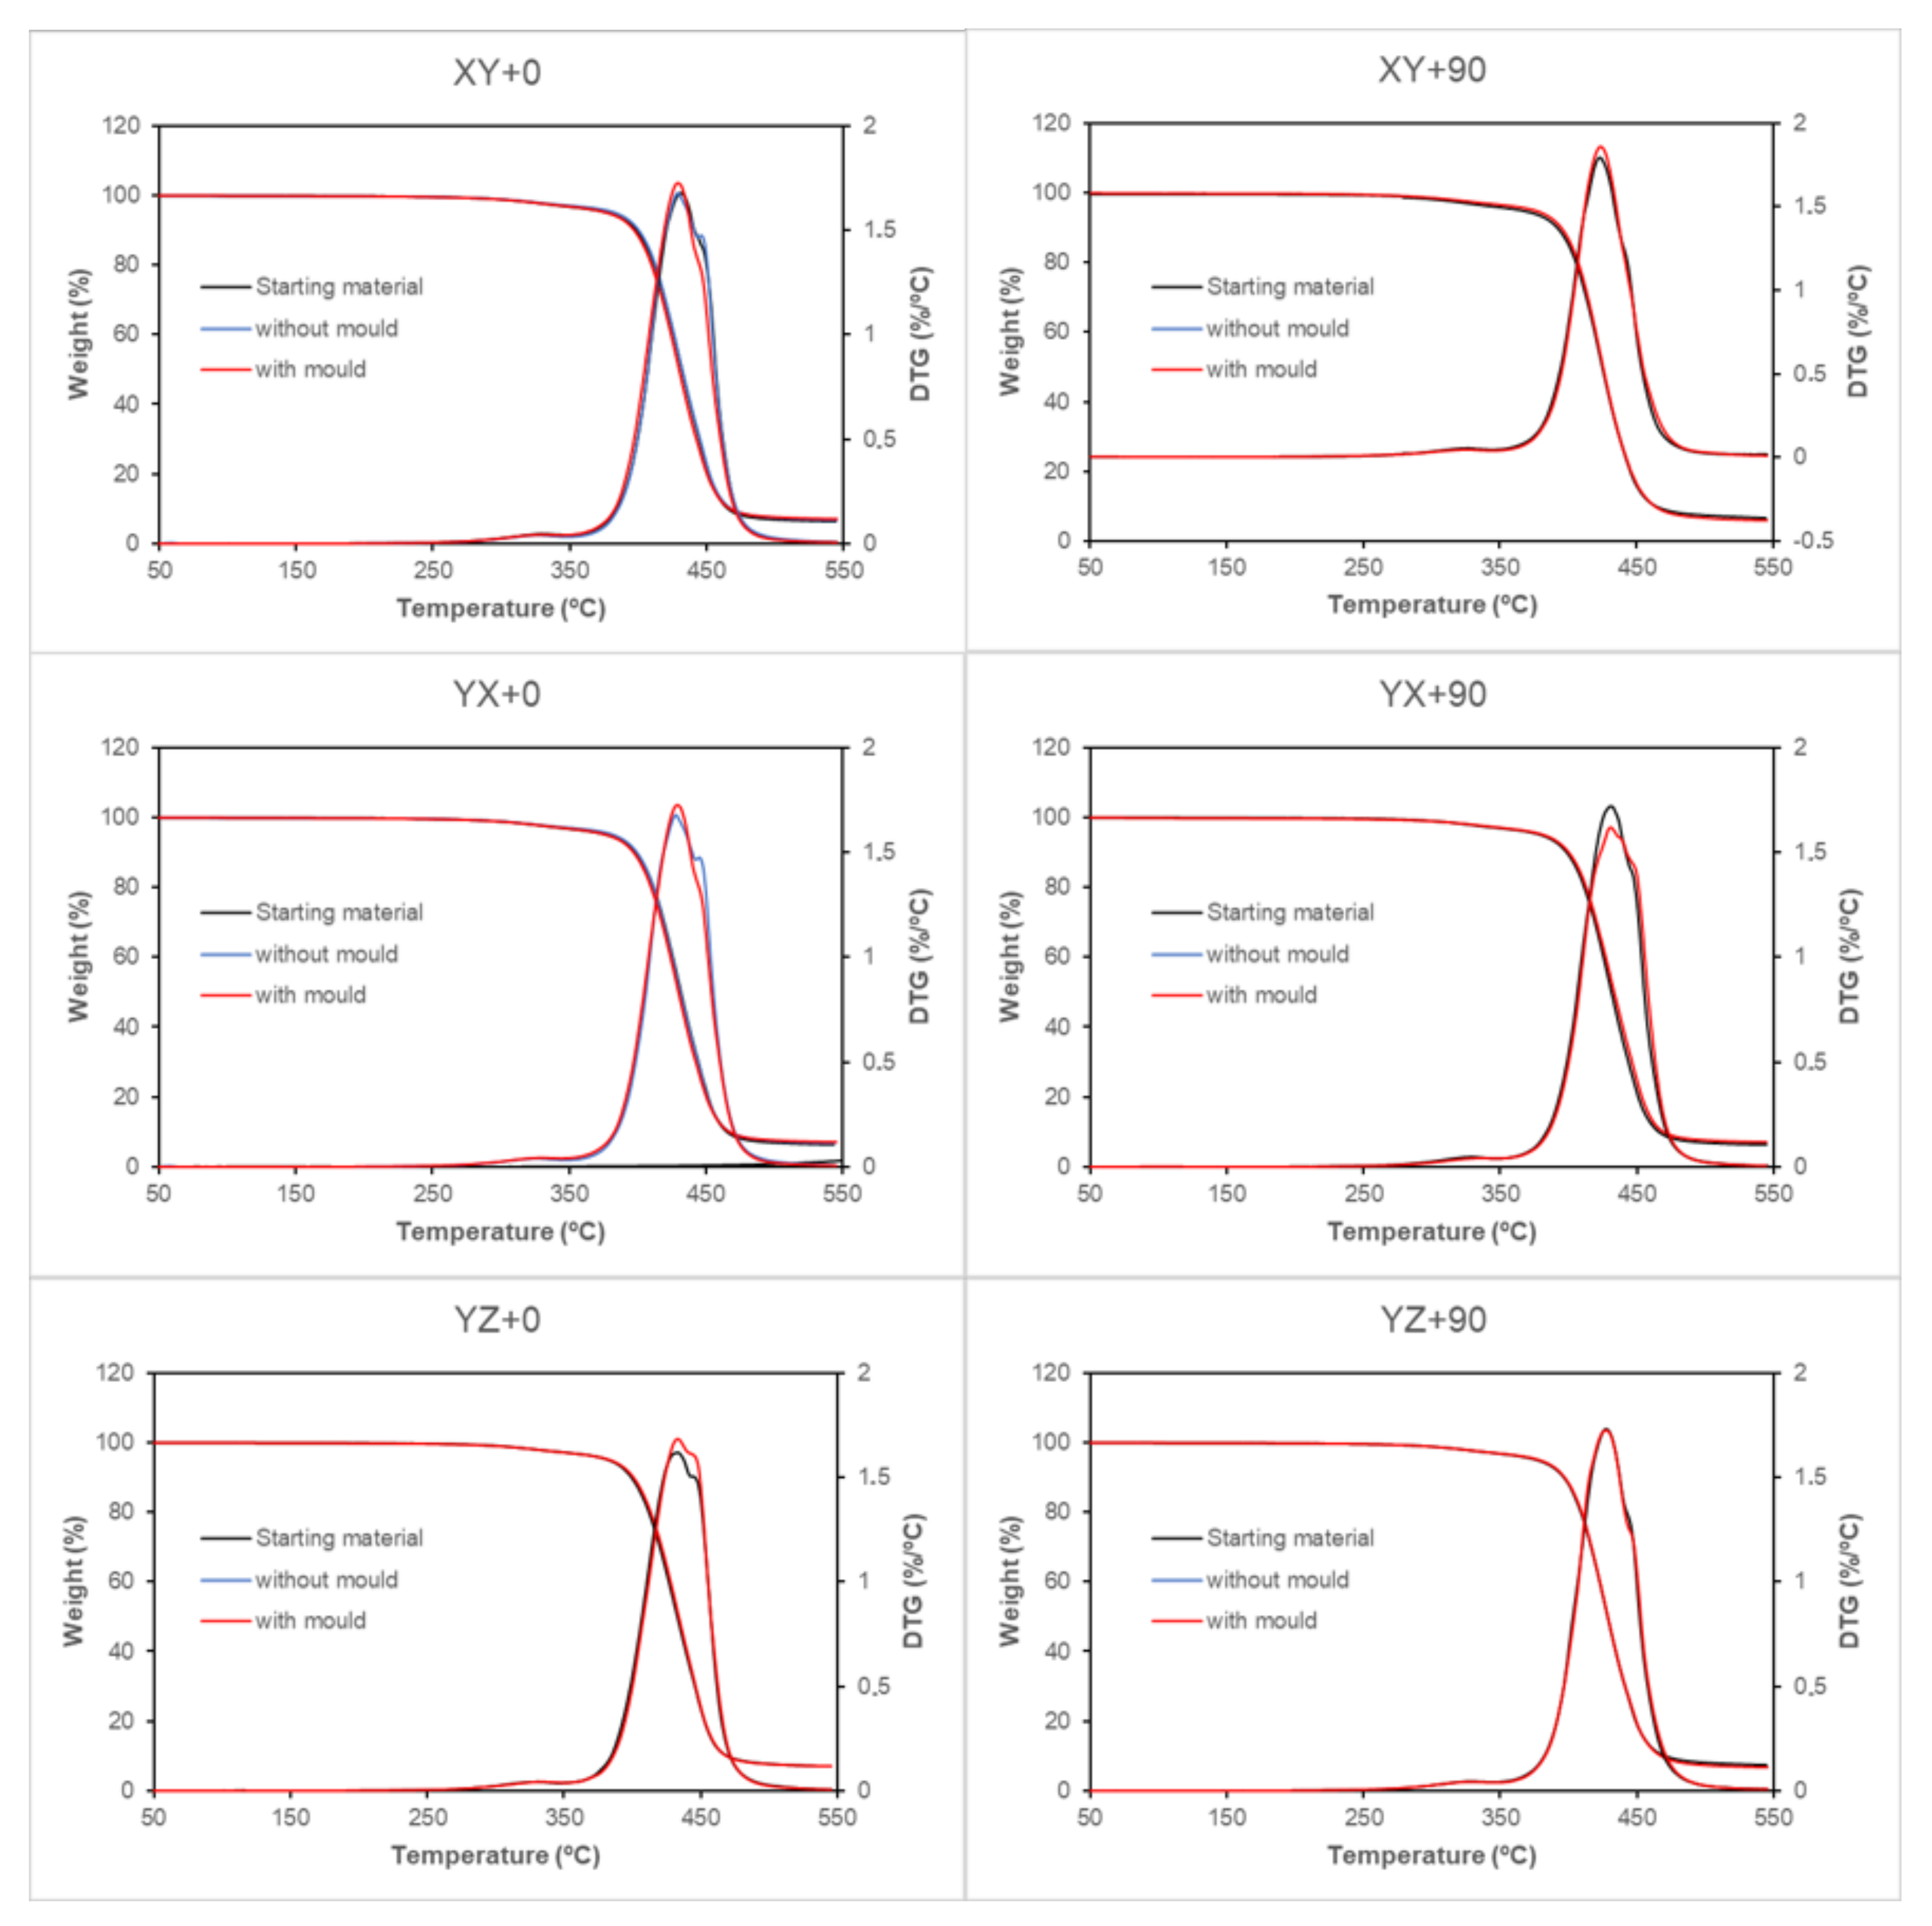
Figure 9 shows the thermogravimetric/differential thermogravimetric (TG/DTG) curves before thermal process, after thermal process with mould and after thermal process without mould for XY + 0, XY + 90, YX + 0, YX + 90, YZ + 0 and YZ + 90 for ABS samples.
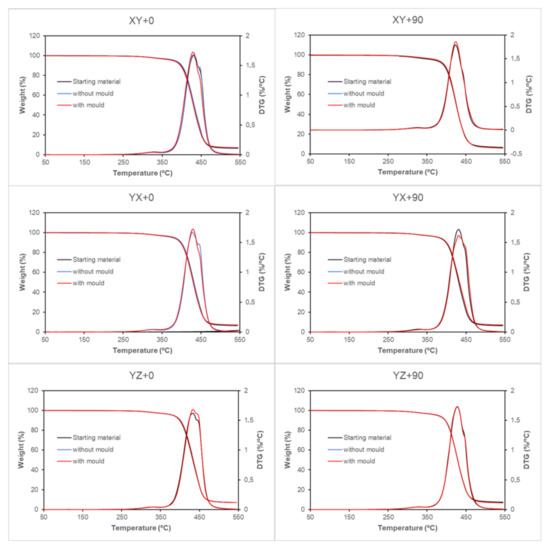
Figure 9.
TG/DTG curves of ABS samples at 10 °C min−1 in nitrogen atmosphere. Specimens comparison before thermal process, after thermal process with mould and after thermal process without mould for XY + 0, XY + 90, YX + 0, YX + 90, YZ + 0 and YZ + 90 samples.
A small degradation step was observed between room temperature and 350 °C with mass loss less than 4 %. The main degradation step starts and ends between 350 and 550 °C. The residue at 550 °C is in the vicinity of 7 %. From an inspection of the DTG curves, it is clear that the main degradation of ABS takes place in two steps. The first degradation step corresponds to the loss of the volatile compounds [37,38]. The second step corresponds to the breaking of the stronger bonds from the reticulated product of the first step, referring mainly to the scission of C-C main chain bonds [38,39].
In Figure 9, it can be observed that the two degradation steps are consecutive and appear partially overlapping in the range 350–550 °C; in this research, to simplify the calculations, the separate steps will not be considered. Thus, two temperature ranges have been established for weight loss measurements: from 25 to 350 °C (light fraction) and from 350 to 550 °C (heavy fraction). The inorganic residue was obtained at 550 °C.
The weight loss and the residue obtained for the different samples tested as a function of the heat treatment followed are shown in Table 11.
Table 11.
Weight loss and residue obtained.
In all cases, the thermal degradation of ABS presents the same profile, there being no significant differences in the degradation percentages of the samples before heat treatment and after heat treatment with and without mould. In weight loss 1, it can be seen that the thermal treatment slightly reduces the fraction, although this reduction is less than 0.3%. Weight loss 2, with values around 90%, sees its values modified by less than 1.5%. The residue fraction modifies its values around 0.6%. These slight differences in the fractions are not related to the geometry with which the specimens are manufactured, nor to the use of the mould in the thermal process, which indicates that the thermal treatment carried out on the specimens does not cause degradations in the polymeric material.
4. Conclusions
Post-process thermal treatment has positive results on the mechanical properties of thermoplastics. However, thermal treatment can cause deformations in the parts that make them unusable. Annealing treatments produce a relaxation of the samples. When working with semi-crystalline materials, manufacturing process as injection or extrusion, with rapid cooling, causes highly amorphous structures, depending on the direction of the fibres in the extrusion process and their length. Annealing gives the polymer the energy necessary to recrystallize, although long production times are required.
This paper evaluates the use of a ceramic powder mould during thermal post-process of ABS 3D printed parts in order to decrease dimensional variations in specimens. The influence of internal geometry direction with the building line, line width and layer height directions on specimen deformations caused by thermal treatment is also studied.
When an ABS sample obtained by extrusion is subjected to an annealing process, deformations occur due to the movement of polymeric chains towards a more ordered microstructure. This deformation can be controlled, even prevented, if a mould is used during the thermal cycle. The ceramic power mould minimizes the dimensional changes of the sample in all the internal geometries studied, although the influence of the building line direction on the final deformation is observed.
ABS samples are manufactured according to standard ISO 179-1:2010 Type 1. Thermogravimetric tests have been carried out to determine if ABS-sampled deformations could be associated with evaporation of any volatile species, concluding that the thermal treatment carried out on the specimens does not cause degradations in the polymeric material.
An analysis of variance (ANOVA) was performed to study mould influence and internal geometry of the part in deformation during the annealing treatment. Using a ceramic powder mould considerably reduces dimensional deformations that occur during the annealing process. Length is the most affected dimension due to deformation of the sample. For this reason, length has been used to evaluate mould effectiveness. This effectiveness is greater than 80% in all internal geometries evaluated, in comparison to non-usage of mould, reaching 90% when the building lines are in the same direction as the main part.
After evaluating the annealed specimens, it can be concluded that building line directions at 90° to the longest dimension of the part have a major influence on part deformation. On the other hand, the use of a ceramic powder mould considerably reduces dimensional deformations that occur during the annealing process. Specimens building with XY + 0 and YZ + 90 internal geometries are stronger affected by deformations, making it the most highly recommend powder mould when the building lines are in the same direction as the main part.
Author Contributions
Conceptualization, J.L.-C., M.D.M. and J.A.G.-M.; Data curation J.L.-C. and R.B.; Formal analysis, J.L.-C. and R.B.; Funding acquisition, J.A.G.-M.; Investigation, J.L.-C., R.B., M.D.M. and J.A.G.-M.; Methodology, J.L.-C., R.B. and M.D.M.; Project administration, J.A.G.-M.; Supervision, J.A.G.-M.; Validation, J.L.-C., R.B. and M.D.M.; Visualization, J.L.-C. and M.D.M.; Writing—original draft, J.L.-C. and M.D.M.; Writing—review & editing, R.B. and J.A.G.-M. All authors have read and agreed to the published version of the manuscript.
Funding
This research received partial funding from the Government of Spain under the project PID2019-108807RB-I00.
Conflicts of Interest
The authors declare no conflict of interest. The funders had no role in the design of the study; in the collection, analyses, or interpretation of data; in the writing of the manuscript, or in the decision to publish the results.
References
- Ngo, T.D.; Kashani, A.; Imbalzano, G.; Nguyen, K.T.Q.; Hui, D. Additive manufacturing (3D printing): A review of materials, methods, applications and challenges. Compos. Part B Eng. 2018, 143, 172–196. [Google Scholar] [CrossRef]
- Ahn, S.H.; Montero, M.; Odell, D.; Roundy, S.; Wright, P.K. Anisotropic material properties of fused deposition modeling ABS. Rapid Prototyp. J. 2002, 8, 248–257. [Google Scholar] [CrossRef] [Green Version]
- Ziemian, C.; Sharma, M.; Ziemi, S. Anisotropic Mechanical Properties of ABS Parts Fabricated by Fused Deposition Modelling. Mech. Eng. 2012, 23, 2397. [Google Scholar] [CrossRef] [Green Version]
- Cantrell, J.T.; Rohde, S.; Damiani, D.; Gurnani, R.; DiSandro, L.; Anton, J.; Young, A.; Jerez, A.; Steinbach, D.; Kroese, C.; et al. Experimental characterization of the mechanical properties of 3D-printed ABS and polycarbonate parts. Rapid Prototyp. J. 2017, 23, 811–824. [Google Scholar] [CrossRef]
- Behalek, L.; Safka, J.; Seidl, M.; Habr, J.; Bobek, J. Fused deposition modelling vs. Injection moulding: Influence of fiber orientation and layer thickness on the mechanical properties. MM Sci. J. 2018, 2018, 2722–2726. [Google Scholar] [CrossRef]
- Popescu, D.; Zapciu, A.; Amza, C.; Baciu, F.; Marinescu, R. FDM process parameters influence over the mechanical properties of polymer specimens: A review. Polym. Test. 2018, 69, 157–166. [Google Scholar] [CrossRef]
- Turner, B.N.; Strong, R.; Gold, S.A. A review of melt extrusion additive manufacturing processes: I. Process design and modeling. Rapid Prototyp. J. 2014, 20, 192–204. [Google Scholar] [CrossRef]
- Cole, D.P.; Riddick, J.C.; Iftekhar Jaim, H.M.; Strawhecker, K.E.; Zander, N.E. Interfacial mechanical behavior of 3D printed ABS. J. Appl. Polym. Sci. 2016, 133, 1–12. [Google Scholar] [CrossRef]
- Wang, X.; Zhao, L.; Fuh, J.Y.H.; Lee, H.P. Effect of porosity on mechanical properties of 3D printed polymers: Experiments and micromechanical modeling based on X-ray computed tomography analysis. Polymers 2019, 11, 1154. [Google Scholar] [CrossRef] [Green Version]
- El Moumen, A.; Tarfaoui, M.; Lafdi, K. Modelling of the temperature and residual stress fields during 3D printing of polymer composites. Int. J. Adv. Manuf. Technol. 2019, 104, 1661–1676. [Google Scholar] [CrossRef]
- Morales, N.G.; Fleck, T.J.; Rhoads, J.F. The effect of interlayer cooling on the mechanical properties of components printed via fused deposition. Addit. Manuf. 2018, 24, 243–248. [Google Scholar] [CrossRef]
- Dillon, B.; Doran, P.; Fuenmayor, E.; Healy, A.V.; Gately, N.M.; Major, I.; Lyons, J.G. Influence of annealing and biaxial expansion on the properties of poly(l-lactic acid) medical tubing. Polymers 2019, 11, 1172. [Google Scholar] [CrossRef] [PubMed] [Green Version]
- Kousiatza, C.; Karalekas, D. In-situ monitoring of strain and temperature distributions during fused deposition modeling process. Mater. Des. 2016, 97, 400–406. [Google Scholar] [CrossRef]
- Budzik, G.; Woźniak, J.; Paszkiewicz, A.; Przeszłowski, Ł.; Dziubek, T.; Dębski, M. Methodology for the quality control process of additive manufacturing products made of polymer materials. Materials 2021, 14, 2202. [Google Scholar] [CrossRef] [PubMed]
- Rodríguez-Panes, A.; Claver, J.; Camacho, A.M. The influence of manufacturing parameters on the mechanical behaviour of PLA and ABS pieces manufactured by FDM: A comparative analysis. Materials 2018, 11, 1333. [Google Scholar] [CrossRef] [PubMed] [Green Version]
- Lluch-Cerezo, J.; Benavente, R.; Meseguer, M.D.; Gutiérrez, S.C. Study of samples geometry to analyze mechanical properties in Fused Deposition Modeling process (FDM). Procedia Manuf. 2019, 41, 890–897. [Google Scholar] [CrossRef]
- Riddick, J.C.; Haile, M.A.; Wahlde, R.V.; Cole, D.P.; Bamiduro, O.; Johnson, T.E. Fractographic analysis of tensile failure of acrylonitrile-butadiene-styrene fabricated by fused deposition modeling. Addit. Manuf. 2016, 11, 49–59. [Google Scholar] [CrossRef]
- Zhang, Y.; Chou, K. A parametric study of part distortions in fused deposition modelling using three-dimensional finite element analysis. Proc. Inst. Mech. Eng. Part B J. Eng. Manuf. 2008, 222, 959–967. [Google Scholar] [CrossRef]
- Dawoud, M.; Taha, I.; Ebeid, S.J. Mechanical behaviour of ABS: An experimental study using FDM and injection moulding techniques. J. Manuf. Process. 2016, 21, 39–45. [Google Scholar] [CrossRef]
- Khosravani, M.R.; Schüürmann, J.; Berto, F.; Reinicke, T. On the post-processing of 3d-printed abs parts. Polymers 2021, 13, 1559. [Google Scholar] [CrossRef]
- Moradi, M.; Moghadam, M.K.; Shamsborhan, M.; Bodaghi, M.; Falavandi, H. Post-processing of FDM 3d-printed polylactic acid parts by laser beam cutting. Polymers 2020, 12, 550. [Google Scholar] [CrossRef] [Green Version]
- Pazhamannil, R.V. Effect of Process Parameters and Thermal Annealing on Mechanical Properties of Fused Filament Fabricated Specimens. SSRN Electron. J. 2021, 358–364. [Google Scholar] [CrossRef]
- Donadei, V.; Lionetto, F.; Wielandt, M.; Offringa, A.; Maffezzoli, A. Effects of blank quality on press-formed PEKK/Carbon composite parts. Materials 2018, 11, 1063. [Google Scholar] [CrossRef] [Green Version]
- Singh, S.; Singh, M.; Prakash, C.; Gupta, M.K.; Mia, M.; Singh, R. Optimization and reliability analysis to improve surface quality and mechanical characteristics of heat-treated fused filament fabricated parts. Int. J. Adv. Manuf. Technol. 2019, 102, 1521–1536. [Google Scholar] [CrossRef]
- Butt, J.; Bhaskar, R. Investigating the effects of annealing on the mechanical properties of FFF-printed thermoplastics. J. Manuf. Mater. Process. 2020, 4, 38. [Google Scholar] [CrossRef]
- Kościuszko, A.; Marciniak, D.; Sykutera, D. Post-processing time dependence of shrinkage and mechanical properties of injection-molded polypropylene. Materials 2021, 14, 22. [Google Scholar] [CrossRef] [PubMed]
- Rangisetty, S.; Peel, L.D. The effect of infill patterns and annealing on mechanical properties of additively manufactured thermoplastic composites. In Proceedings of the ASME 2017 Conference on Smart Materials, Adaptive Structures and Intelligent Systems, SMASIS 2017, Snowbird, UT, USA, 18–20 September 2017; Volume 1. [Google Scholar]
- Font, R. Decomposition of Organic Wastes: Thermal Analysis and Evolution of Volatiles, 2nd ed.; Elsevier B.V.: Amsterdam, The Netherlands, 2018; Volume 6, ISBN 9780444640628. [Google Scholar]
- Hart, K.R.; Dunn, R.M.; Sietins, J.M.; Hofmeister Mock, C.M.; Mackay, M.E.; Wetzel, E.D. Increased fracture toughness of additively manufactured amorphous thermoplastics via thermal annealing. Polymer 2018, 144, 192–204. [Google Scholar] [CrossRef]
- Amza, C.G.; Zapciu, A.; Constantin, G.; Baciu, F.; Vasile, M.I. Enhancing mechanical properties of polymer 3D printed parts. Polymers 2021, 13, 562. [Google Scholar] [CrossRef] [PubMed]
- Zhang, W.; Wu, A.S.; Sun, J.; Quan, Z.; Gu, B.; Sun, B.; Cotton, C.; Heider, D.; Chou, T.W. Characterization of residual stress and deformation in additively manufactured ABS polymer and composite specimens. Compos. Sci. Technol. 2017, 150, 102–110. [Google Scholar] [CrossRef]
- ISO 294-1:2017 Plastics—Injection Moulding of Test Specimens of Thermoplastic Materials—Part 1: General Principles, and Moulding of Multipurpose and Bar Test Specimens. Available online: https://www.iso.org/standard/67036.html (accessed on 12 June 2021).
- ISO 306:2013 Plastics—Thermoplastic Materials—Determination of Vicat Softening Temperature (VST). Available online: https://www.iso.org/standard/55647.html (accessed on 12 June 2021).
- ISO 179-1:2010 Plastics—Determination of Charpy Impact Properties—Part 1: Non-Instrumented Impact Test. Available online: https://www.iso.org/standard/44852.html (accessed on 12 June 2021).
- ISO/ASTM 52921:2013 Standard Terminology for Additive Manufacturing—Coordinate Systems and Test Methodologies. Available online: https://www.iso.org/standard/62794.html (accessed on 12 June 2021).
- ISO 294-4:2018 Plastics—Injection Moulding of Test Specimens of Thermoplastic Materials—Part 4: Determination of Moulding Shrinkage. Available online: https://www.iso.org/standard/70413.html (accessed on 12 June 2021).
- Roussi, A.T.; Vouvoudi, E.C.; Achilias, D.S. Pyrolytic degradation kinetics of HIPS, ABS, PC and their blends with PP and PVC. Thermochim. Acta 2020, 690, 178705. [Google Scholar] [CrossRef]
- Fǎtu, D.; Geambaş, G.; Segal, E.; Budrugeac, P.; Ciutacu, S. On the thermal decomposition of the copolymer ABS and of nylon polyamide. Thermochim. Acta 1989, 149, 181–187. [Google Scholar] [CrossRef]
- Suzuki, M.; Wilkie, C.A. The thermal degradation of acrylonitrile-butadiene-styrene terpolymer as studied by TGA/FTIR. Polym. Degrad. Stab. 1995, 47, 217–221. [Google Scholar] [CrossRef]


Publisher’s Note: MDPI stays neutral with regard to jurisdictional claims in published maps and institutional affiliations. |
© 2021 by the authors. Licensee MDPI, Basel, Switzerland. This article is an open access article distributed under the terms and conditions of the Creative Commons Attribution (CC BY) license (https://creativecommons.org/licenses/by/4.0/).