
Effect of Molecular Weight and Degree of Substitution on the Physical-Chemical Properties of Methylcellulose-Starch Nanocrystal Nanocomposite Films

Abstract
:1. Introduction
2. Materials and Methods
2.1. Materials
2.2. Structural and Characterization of Methylcellulose
2.3. Viscosity of Film-Forming Solutions
2.4. Preparation of Films
2.5. Scanning Electron Microscope (SEM)
2.6. Fourier Transform Infrared Spectroscopy (FTIR)
2.7. X-ray Diffraction (XRD)
2.8. Thermogravimetric Analyzer (TGA)
2.9. Light Transmission
2.10. Mechanical and Barrier Properties
2.11. Statistical Analysis
3. Results and Discussions
3.1. Characteristics of Methylcellulose
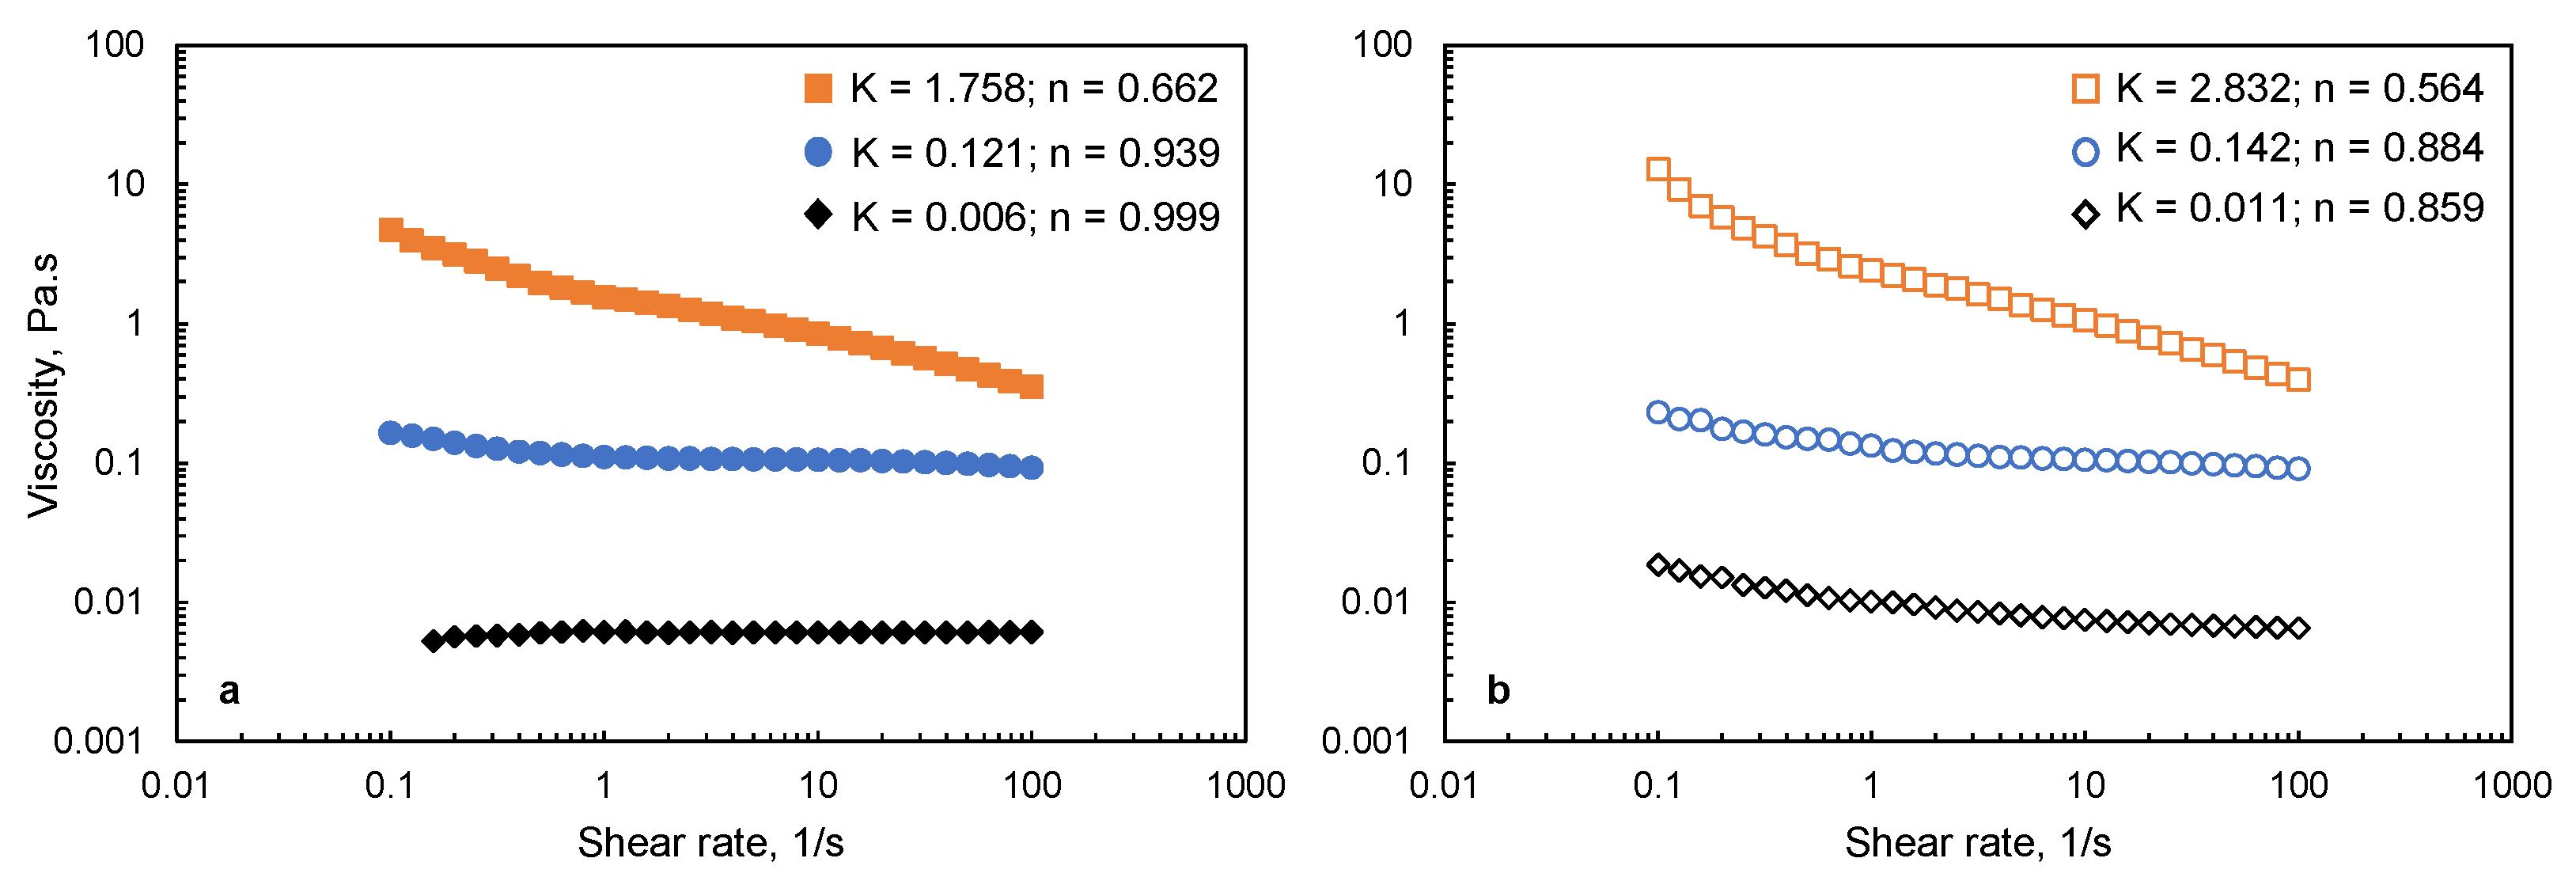
3.2. Viscosity of Film-Forming Solutions
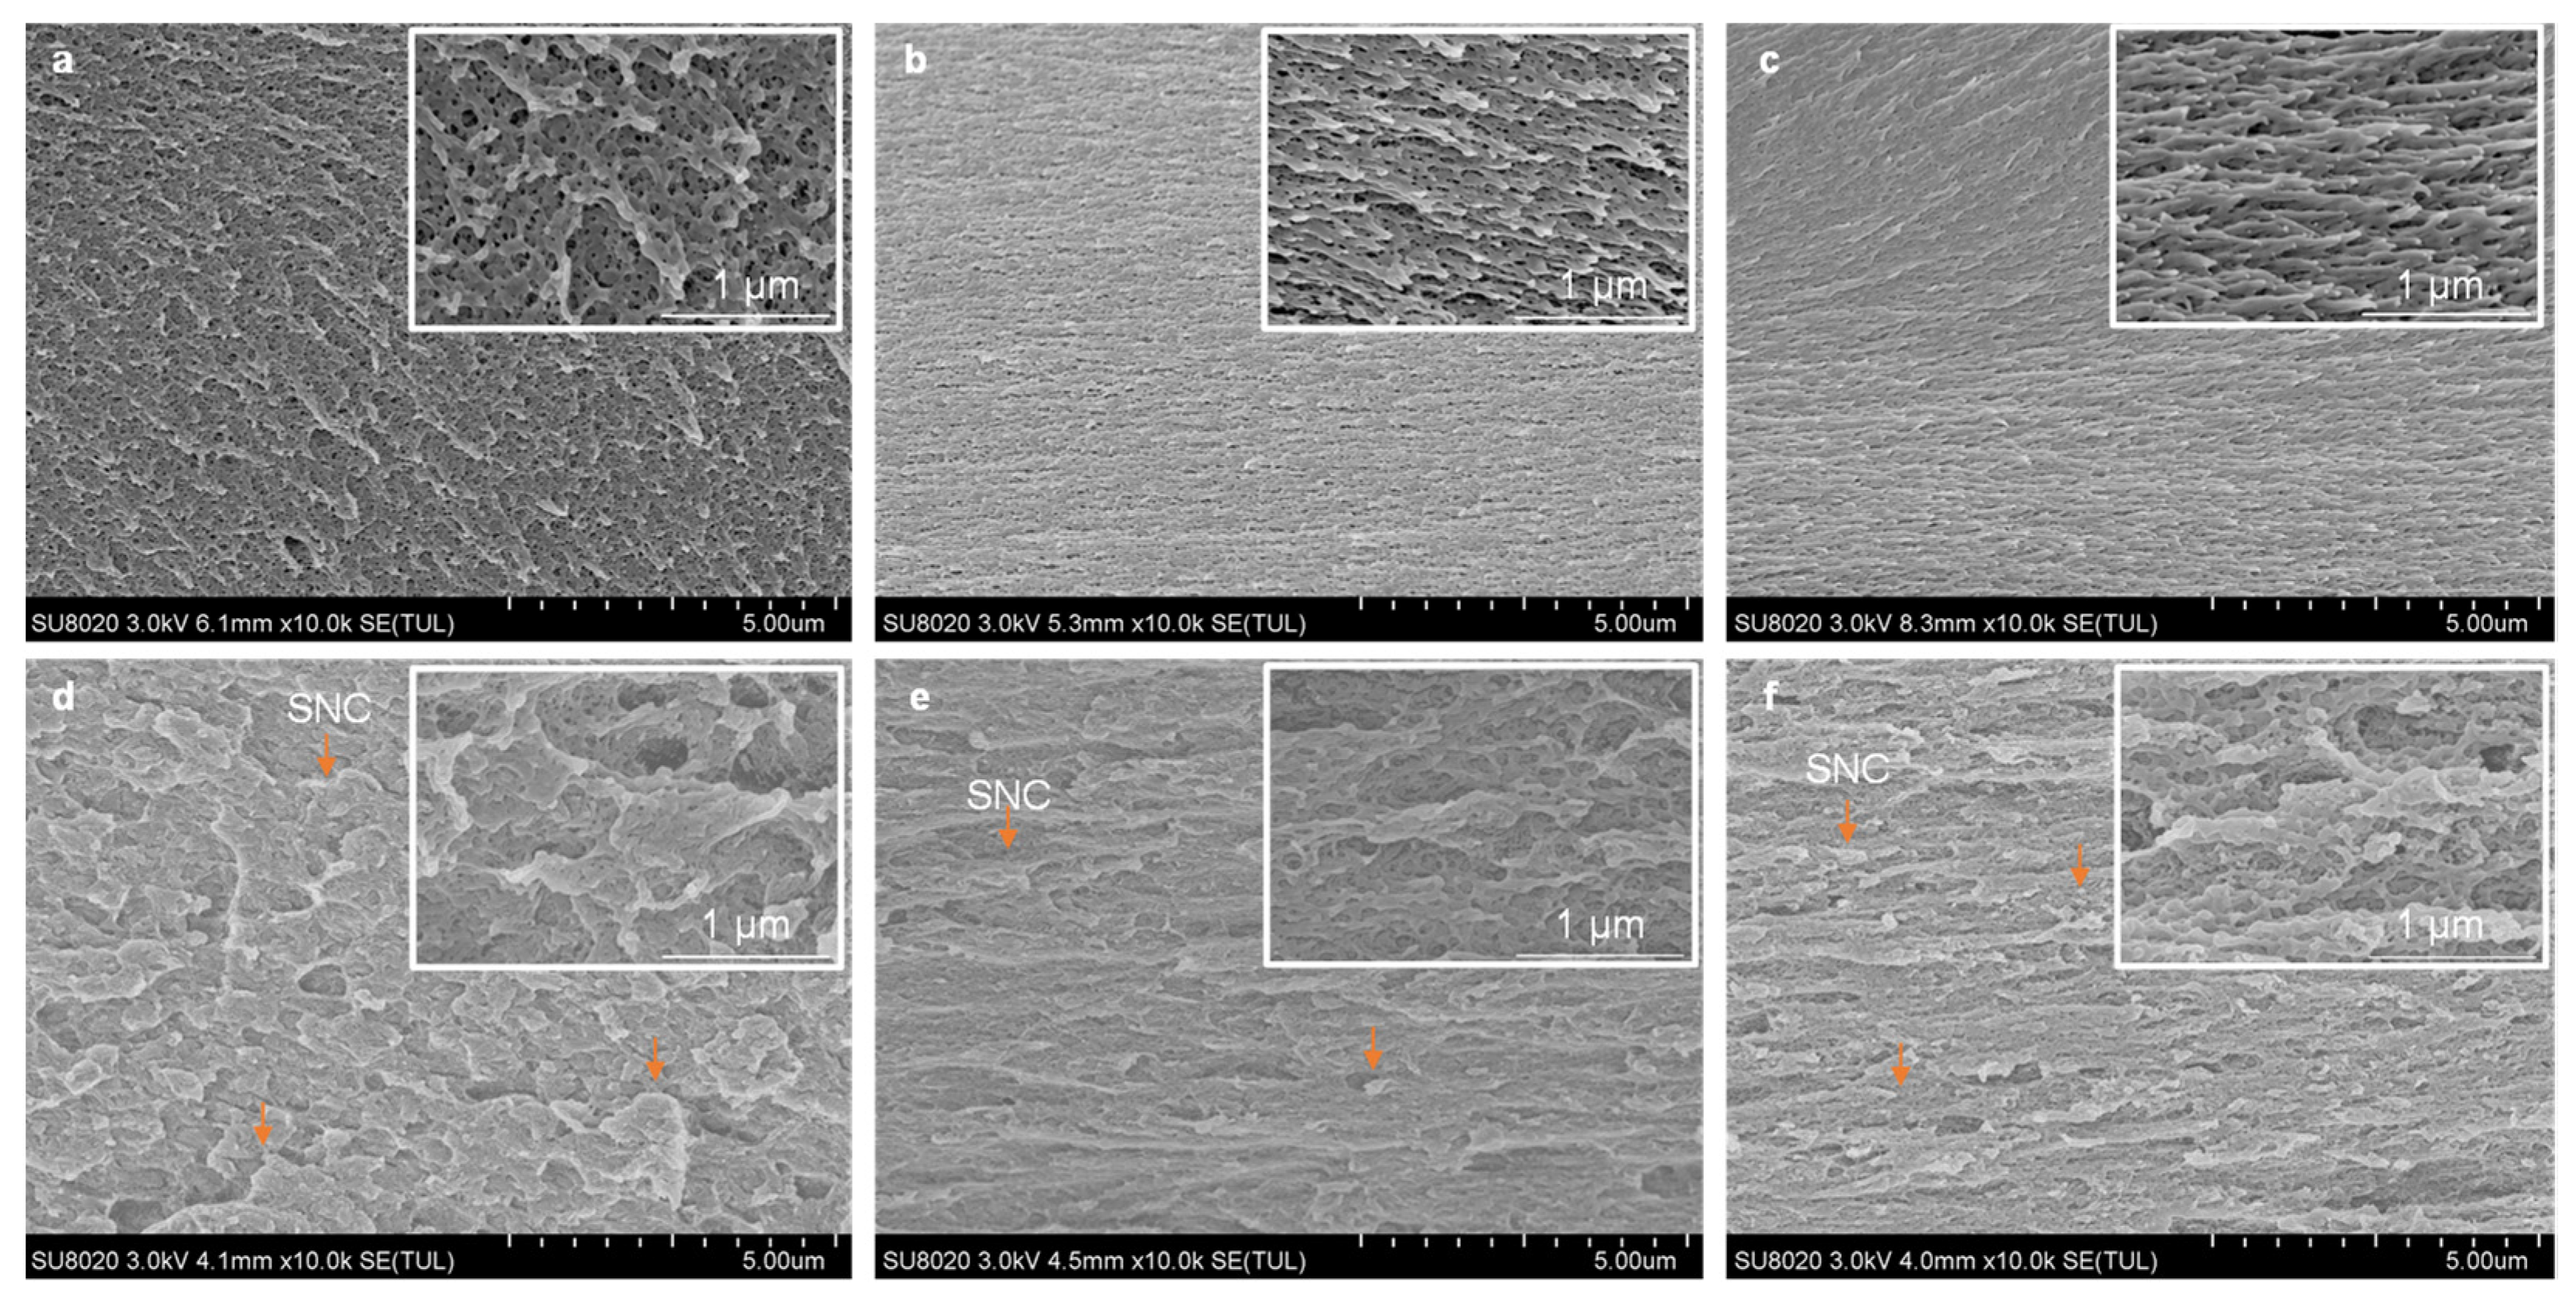
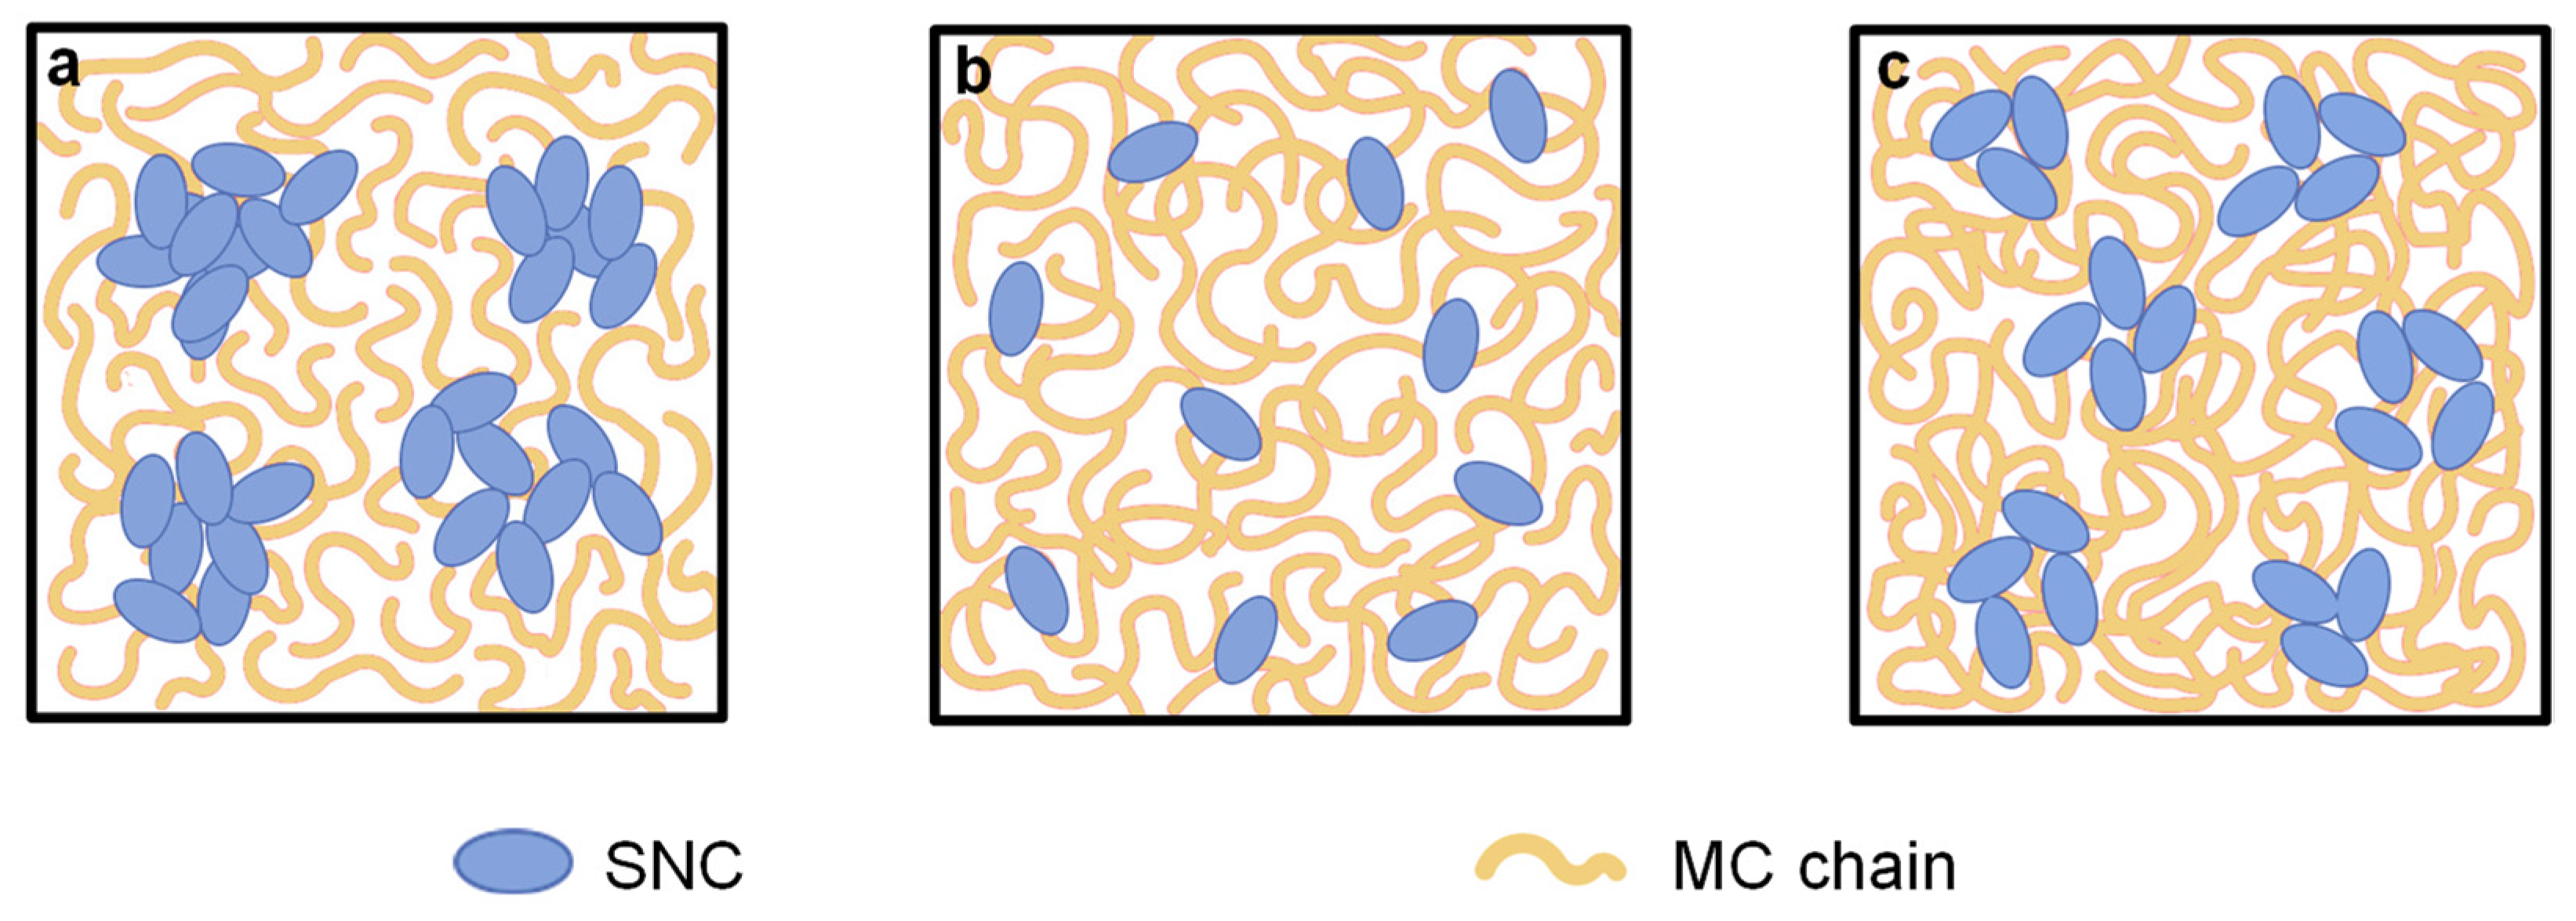
3.3. SEM
3.4. ATR-FTIR
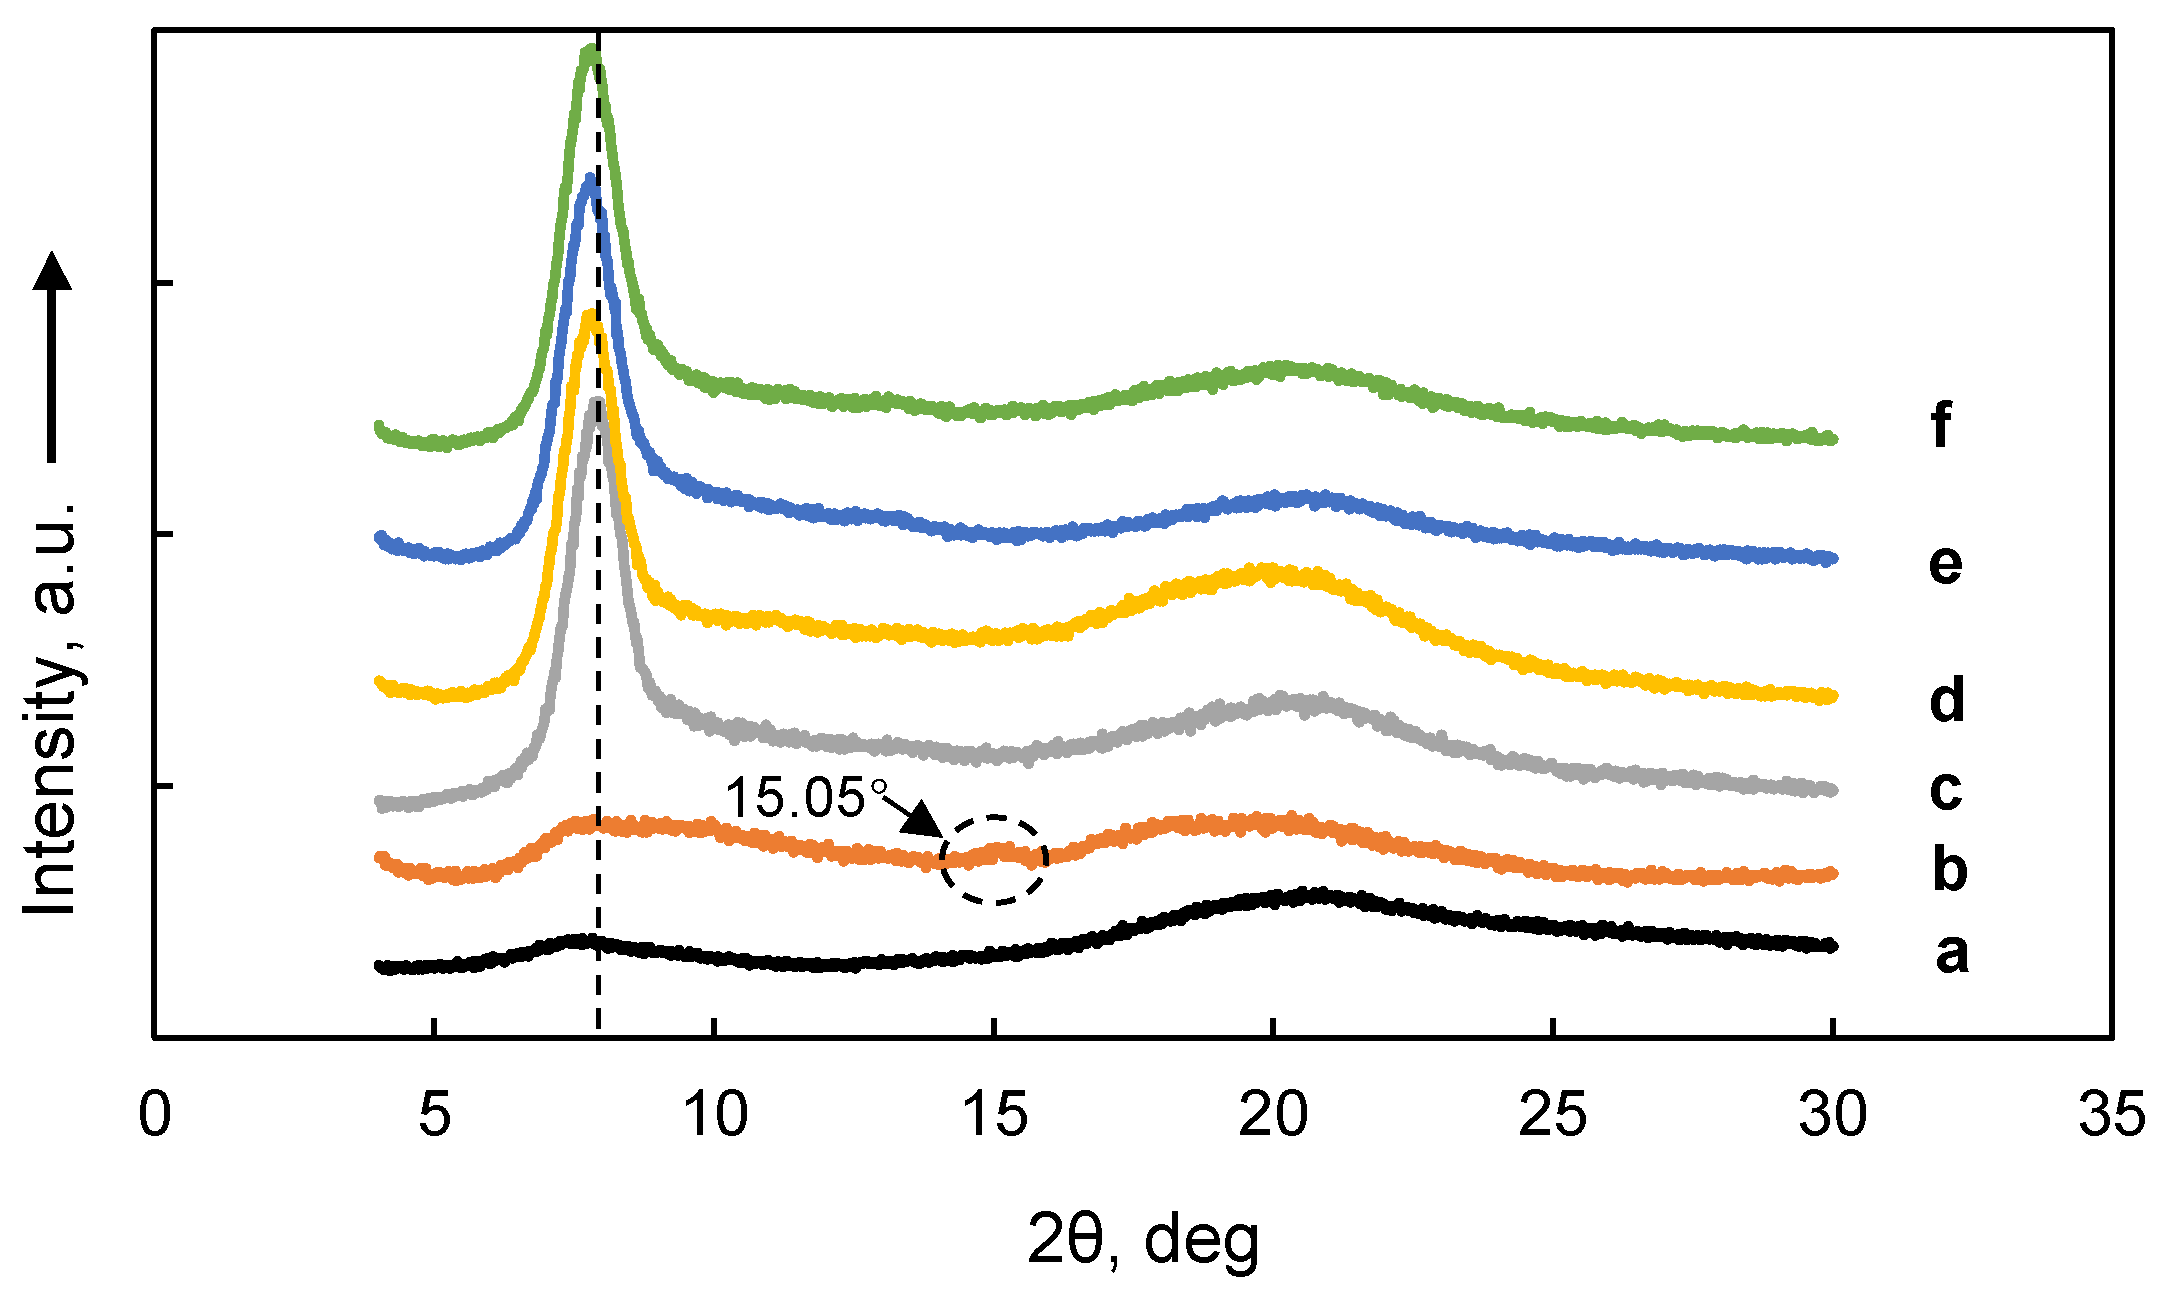
3.5. XRD
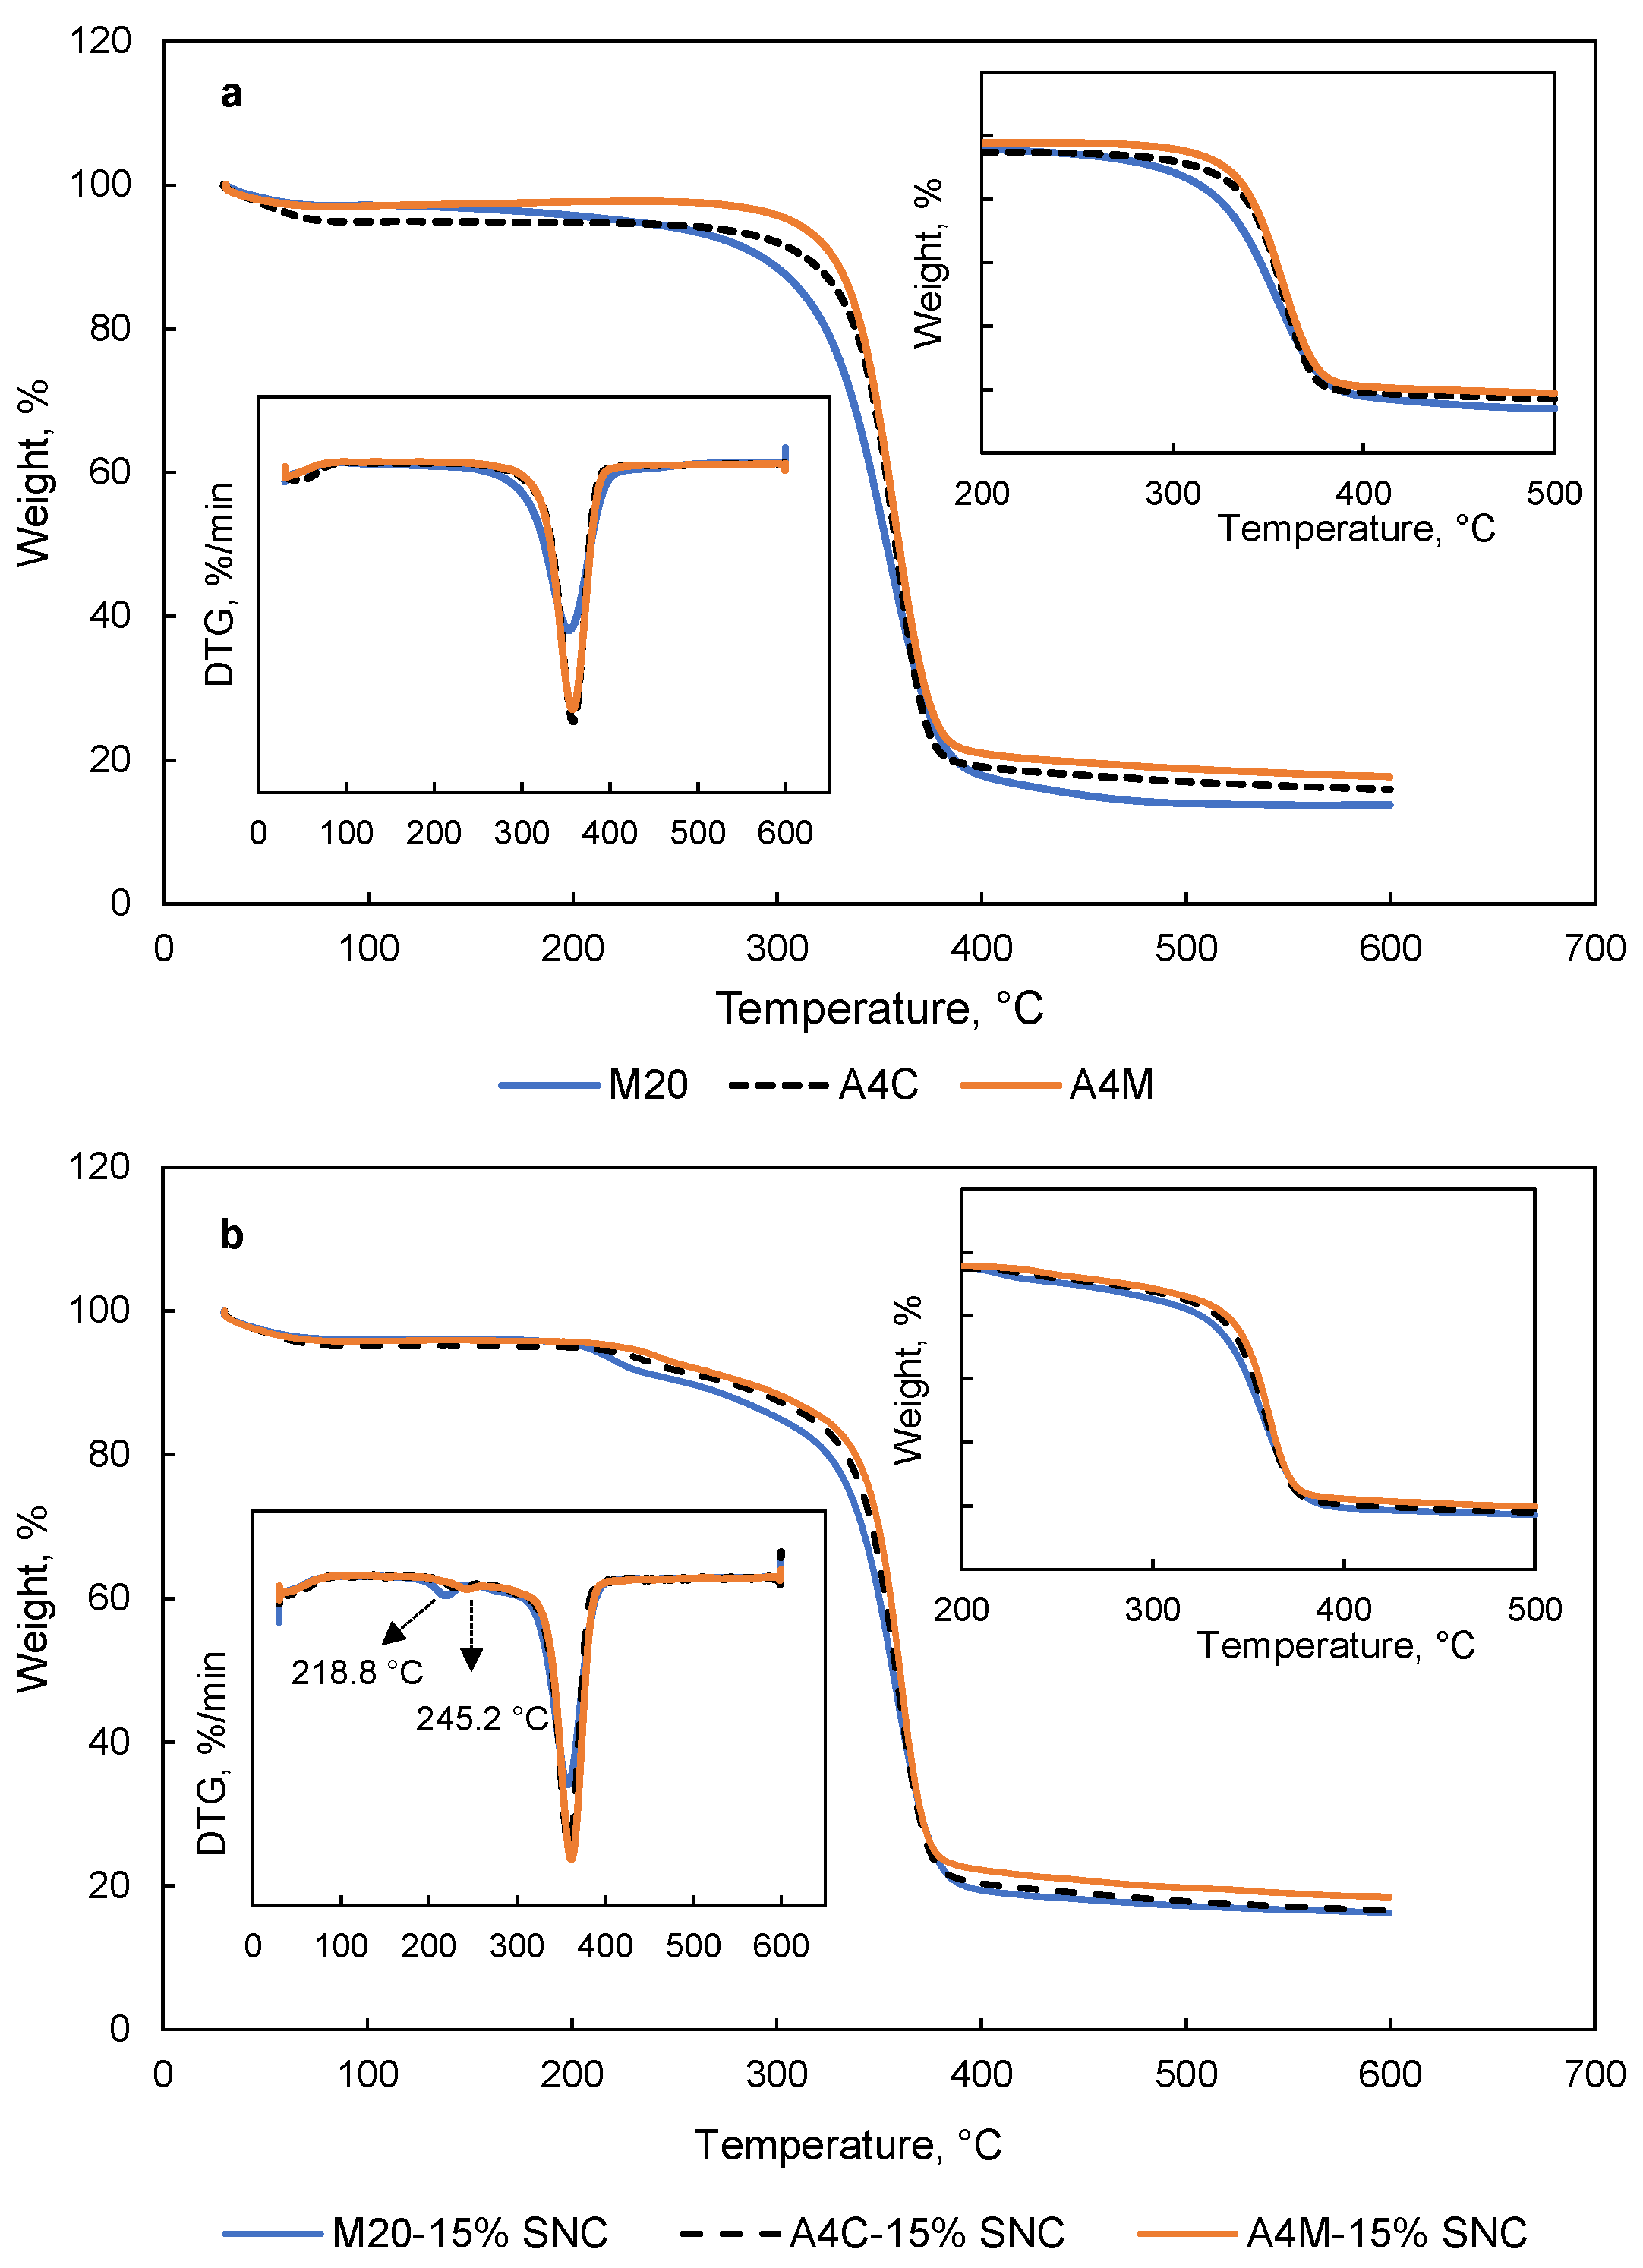
3.6. TGA
3.7. Light Transmission
3.8. Mechanical Properties
3.9. Barrier Properties
4. Conclusions
Supplementary Materials
Author Contributions
Funding
Institutional Review Board Statement
Informed Consent Statement
Data Availability Statement
Acknowledgments
Conflicts of Interest
References
- Moeini, A.; Germann, N.; Malinconico, M.; Santagata, G. Formulation of secondary compounds as additives of biopolymer-based food packaging: A review. Trends Food Sci. Technol. 2021, 114, 342–354. [Google Scholar] [CrossRef]
- Edible Packaging-Global Market Outlook (2021–2026). Available online: https://www.marketdataforecast.com/market-reports/edible-packaging-market (accessed on 10 April 2021).
- Sun, Z.; Qu, K.; You, Y.; Huang, Z.; Liu, S.; Li, J.; Hu, Q.; Guo, Z. Overview of cellulose-based flexible materials for supercapacitors. J. Mater. Chem. A 2021, 9, 7278–7300. [Google Scholar] [CrossRef]
- McAllister, J.W.; Lott, J.R.; Schmidt, P.W.; Sammler, R.L.; Bates, F.S.; Lodge, T.P. Linear and nonlinear rheological behavior of fibrillar methylcellulose hydrogels. ACS Macro Lett. 2015, 4, 538–542. [Google Scholar] [CrossRef]
- Espinoza-Herrera, N.; Pedroza-Islas, R.; San Martín-Martinez, E.; Cruz-Orea, A.; Tomás, S.A. Thermal, mechanical and microstructures properties of cellulose derivatives films: A comparative study. Food Biophys. 2011, 6, 106–114. [Google Scholar] [CrossRef]
- Da Silva Filipini, G.; Romani, V.P.; Guimarães Martins, V. Blending collagen, methylcellulose, and whey protein in films as a greener alternative for food packaging: Physicochemical and biodegradable properties. Packag. Technol. Sci. 2021, 34, 91–103. [Google Scholar] [CrossRef]
- De Dicastillo, C.L.; Bustos, F.; Guarda, A.; Galotto, M.J. Cross-linked methyl cellulose films with murta fruit extract for antioxidant and antimicrobial active food packaging. Food Hydrocoll. 2016, 60, 335–344. [Google Scholar] [CrossRef]
- Otoni, C.G.; Avena-Bustillos, R.J.; Azeredo, H.M.C.; Lorevice, M.V.; Moura, M.R.; Mattoso, L.H.C.; McHugh, T.H. Recent advances on edible films based on fruits and vegetables-a review. Compr. Rev. Food Sci. Food Saf. 2017, 16, 1151–1169. [Google Scholar] [CrossRef] [Green Version]
- Le Corre, D.; Bras, J.; Dufresne, A. Starch nanoparticles: A review. Biomacromolecules 2010, 11, 1139–1153. [Google Scholar] [CrossRef] [PubMed]
- Dai, L.; Yu, H.; Zhang, J.; Cheng, F. Preparation and characterization of cross-linked starch nanocrystals and self-reinforced starch-based nanocomposite films. Int. J. Biol. Macromol. 2021, 181, 868–876. [Google Scholar] [CrossRef]
- Ali, A.; Xie, F.; Yu, L.; Liu, H.; Meng, L.; Khalid, S.; Chen, L. Preparation and characterization of starch-based composite films reinfoced by polysaccharide-based crystals. Compos. Part B Eng. 2018, 133, 122–128. [Google Scholar] [CrossRef]
- Condés, M.C.; Añón, M.C.; Mauri, A.N.; Dufresne, A. Amaranth protein films reinforced with maize starch nanocrystals. Food Hydrocoll. 2015, 47, 146–157. [Google Scholar] [CrossRef]
- González, K.; Retegi, A.; González, A.; Eceiza, A.; Gabilondo, N. Starch and cellulose nanocrystals together into thermoplastic starch bionanocomposites. Carbohydr. Polym. 2015, 117, 83–90. [Google Scholar] [CrossRef]
- Kristo, E.; Biliaderis, C.G. Physical properties of starch nanocrystal-reinforced pullulan films. Carbohydr. Polym. 2007, 68, 146–158. [Google Scholar] [CrossRef]
- Mukurumbira, A.R.; Mellem, J.J.; Amonsou, E.O. Effects of amadumbe starch nanocrystals on the physicochemical properties of starch biocomposite films. Carbohydr. Polym. 2017, 165, 142–148. [Google Scholar] [CrossRef]
- Xiong, X.; Huang, M.; Zhou, X.; Zhou, H.; Zeng, C.; Zhao, Z.; Xiao, Q. Physicochemical studies of nanocrystals of starches from two rice (Oryza sativa L.) types and their characteristics using various modern instrument techniques. J. Sci. Food Agric. 2021, 101, 1038–1046. [Google Scholar] [CrossRef] [PubMed]
- Li, Y.; Shen, H.; Lyons, J.W.; Sammler, R.L.; Brackhagen, M.; Meunier, D.M. Size-exclusion chromatography of ultrahigh molecular weight methylcellulose ethers and hydroxypropyl methylcellulose ethers for reliable molecular weight distribution characterization. Carbohydr. Polym. 2016, 138, 290–300. [Google Scholar] [CrossRef] [PubMed]
- Compounding, P.; Tablets, E. The United States Pharmacopeial Convention; Rockville: Baltimore, MD, USA, 2014. [Google Scholar]
- Ria, S.A.; Ferdous, T.; Yasin Arafat, K.M.; Jahan, M.S. Pulp refining in improving degree of substitution of methylcellulose preparation from jute pulp. Biomass Convers. Biorefin. 2020, 1–9. [Google Scholar] [CrossRef]
- ASTM-D882-91. Standard test method for tensile properties of thin plastic sheeting. In Annual Book of American Standard Testing Methods; American Society for Testing & Materials: Philadelphia, PA, USA, 1991; pp. 161–170.
- ASTM-E96-92. Standard test methods for water vapor transmission of materials. In Annual Book of American Standard Testing Methods; American Society for Testing & Materials: Philadelphia, PA, USA, 1990; pp. 745–754.
- ASTM-D3985-02. Standard test method for oxygen gas transmission rate through plastic film and sheeting using a coulometric sensor. In Annual Book of American Standard Testing Methods; American Society for Testing & Materials: Philadelphia, PA, USA, 2002; pp. 472–477.
- Miao, M.; Bai, A.; Jiang, B.; Song, Y.; Cui, S.W.; Zhang, T. Characterisation of a novel water-soluble polysaccharide from Leuconostoc citreum SK24.002. Food Hydrocoll. 2014, 36, 265–272. [Google Scholar] [CrossRef]
- Funami, T.; Kataoka, Y.; Hiroe, M.; Asai, I.; Takahashi, R.; Nishinari, K. Thermal aggregation of methylcellulose with different molecular weights. Food Hydrocoll. 2007, 21, 46–58. [Google Scholar] [CrossRef]
- Wu, D.; Wang, J.; Zhang, M.; Zhou, W. Rheology of carbon nanotubes-filled poly(vinylidene fluoride) composites. Ind. Eng. Chem. Res. 2012, 51, 6705–6713. [Google Scholar] [CrossRef]
- El Miri, N.; Abdelouahdi, K.; Barakat, A.; Zahouily, M.; Fihri, A.; Solhy, A.; El Achaby, M. Bio-nanocomposite films reinforced with cellulose nanocrystals: Rheology of film-forming solutions, transparency, water vapor barrier and tensile properties of films. Carbohydr. Polym. 2015, 129, 156–167. [Google Scholar] [CrossRef]
- Pinto, E.A.; Dávila, J.L.; d’Avila, M.A. Rheological studies on nanocrystalline cellulose/alginate suspensions. J. Mol. Liq. 2019, 277, 418–423. [Google Scholar] [CrossRef]
- Schmidt, P.W.; Morozova, S.; Owens, P.M.; Adden, R.; Li, Y.; Bates, F.S.; Lodge, T.P. Molecular weight dependence of methylcellulose fibrillar networks. Macromolecules 2018, 51, 7767–7775. [Google Scholar] [CrossRef]
- Maity, D.; Mollick, M.M.R.; Mondal, D.; Bhowmick, B.; Bain, M.K.; Bankura, K.; Sarkar, J.; Acharya, K.; Chattopadhyay, D. Synthesis of methylcellulose–silver nanocomposite and investigation of mechanical and antimicrobial properties. Carbohydr. Polym. 2012, 90, 1818–1825. [Google Scholar] [CrossRef]
- Shamsuri, N.A.; Zaine, S.N.A.; Yusof, Y.M.; Yahya, W.Z.N.; Shukur, M.F. Effect of ammonium thiocyanate on ionic conductivity and thermal properties of polyvinyl alcohol–methylcellulose–based polymer electrolytes. Ionics 2020, 26, 6083–6093. [Google Scholar] [CrossRef]
- Hou, S.-W.; Wei, W.; Wang, Y.; Gan, J.-H.; Lu, Y.; Tao, N.-P.; Wang, X.-C.; Liu, Y.; Xu, C.-H. Integrated recognition and quantitative detection of starch in surimi by infrared spectroscopy and spectroscopic imaging. Spectrochim. Acta Part A Mol. Biomol. Spectrosc. 2019, 215, 1–8. [Google Scholar] [CrossRef] [PubMed]
- Long, M.-C.; Xia, L.-T.; Lyu, T.-B.; Wang, T.; Huang, T.; Chen, L.; Wu, G.; Wang, X.-L.; Wang, Y.-Z. A green and facile way to prepare methylcellulose-based porous polymer electrolytes with high lithium-ion conductivity. Polymer 2019, 176, 256–263. [Google Scholar] [CrossRef]
- Kumar, A.; Negi, Y.S.; Bhardwaj, N.K.; Choudhary, V. Synthesis and characterization of methylcellulose/PVA based porous composite. Carbohydr. Polym. 2012, 88, 1364–1372. [Google Scholar] [CrossRef]
- Tunç, S.; Duman, O. Preparation and characterization of biodegradable methyl cellulose/montmorillonite nanocomposite films. Appl. Clay Sci. 2010, 48, 414–424. [Google Scholar] [CrossRef]
- Qin, C.Q.; Du, Y.M.; Xiao, L. Effect of hydrogen peroxide treatment on the molecular weight and structure of chitosan. Polym. Degrad. Stab. 2002, 76, 211–218. [Google Scholar] [CrossRef]
- Kassab, Z.; Aziz, F.; Hannache, H.; Ben Youcef, H.; El Achaby, M. Improved mechanical properties of k-carrageenan-based nanocomposite films reinforced with cellulose nanocrystals. Int. J. Biol. Macromol. 2019, 123, 1248–1256. [Google Scholar] [CrossRef]
- Bel Haaj, S.; Thielemans, W.; Magnin, A.; Boufi, S. Starch nanocrystals and starch nanoparticles from waxy maize as nanoreinforcement: A comparative study. Carbohydr. Polym. 2016, 143, 310–317. [Google Scholar] [CrossRef]
- Otoni, C.G.; Lorevice, M.V.; Moura, M.R.d.; Mattoso, L.H.C. On the effects of hydroxyl substitution degree and molecular weight on mechanical and water barrier properties of hydroxypropyl methylcellulose films. Carbohydr. Polym. 2018, 185, 105–111. [Google Scholar] [CrossRef] [Green Version]
- Lazaridou, A.; Biliaderis, C.G.; Kontogiorgos, V. Molecular weight effects on solution rheology of pullulan and mechanical properties of its films. Carbohydr. Polym. 2003, 52, 151–166. [Google Scholar] [CrossRef]
- El Achaby, M.; Kassab, Z.; Barakat, A.; Aboulkas, A. Alfa fibers as viable sustainable source for cellulose nanocrystals extraction: Application for improving the tensile properties of biopolymer nanocomposite films. Ind. Crop. Prod. 2018, 112, 499–510. [Google Scholar] [CrossRef]
- Slavutsky, A.M.; Bertuzzi, M.A.; Armada, M.; García, M.G.; Ochoa, N.A. Preparation and characterization of montmorillonite/brea gum nanocomposites films. Food Hydrocoll. 2014, 35, 270–278. [Google Scholar] [CrossRef]
- González, K.; Iturriaga, L.; González, A.; Eceiza, A.; Gabilondo, N. Improving mechanical and barrier properties of thermoplastic starch and polysaccharide nanocrystals nanocomposites. Eur. Polym. J. 2020, 123, 109415. [Google Scholar] [CrossRef]
- Sukyai, P.; Anongjanya, P.; Bunyahwuthakul, N.; Kongsin, K.; Harnkarnsujarit, N.; Sukatta, U.; Sothornvit, R.; Chollakup, R. Effect of cellulose nanocrystals from sugarcane bagasse on whey protein isolate-based films. Food Res. Int. 2018, 107, 528–535. [Google Scholar] [CrossRef]


| Samples | Mw × 105, Da | Mw/Mn | Rz, nm | Methoxy Content, % | DS |
|---|---|---|---|---|---|
| M20 | 0.826 ± 0.02 c | 3.45 ± 0.07 a | 53.0 ± 1.71 c | 29.1 ± 0.26 b | 1.75 ± 0.04 b |
| A4C | 1.329 ± 0.01 b | 2.92 ± 0.06 b | 57.7 ± 2.07 b | 28.4 ± 0.45 c | 1.70 ± 0.06 c |
| A4M | 3.404 ± 0.06 a | 2.76 ± 0.08 b | 102.0 ± 1.91 a | 30.2 ± 0.32 a | 1.83 ± 0.03 a |
| Samples | T10%, °C | Char Yield, % | Td2, °C | Td3, °C |
|---|---|---|---|---|
| M20 | 292.2 ± 4.27 c | 13.79 ± 2.32 b | NA | 354.4 ± 4.63 b |
| A4C | 313.3 ± 5.83 b | 15.91 ± 2.16 a | NA | 358.0 ± 2.63 a |
| A4M | 327.4 ± 3.36 a | 17.66 ± 1.98 a | NA | 357.4 ± 3.79 a |
| M20-15% SNC | 256.0 ± 3.19 C | 16.25 ± 2.07 A | 218.8 ± 2.99 B | 357.6 ± 2.75 A |
| A4C-15% SNC | 276.4 ± 5.29 B | 16.71 ± 1.85 A | 241.4 ± 3.58 A | 358.8 ± 3.18 A |
| A4M-15% SNC | 285.0 ± 2.91 A | 18.49 ± 2.19 B | 245.2 ± 3.21 A | 360.5 ± 3.85 B |
| Samples | TS, MPa | YM, MPa | EAB, % | WVP × 10−4 g·m·Pa−1·h−1·m−2 | OTR, cm3·m−2·day−1 |
|---|---|---|---|---|---|
| M20 | 38.11 ± 5.62 c | 651.71 ± 25.62 c | 4.71 ± 0.50 c | 6.22 ± 0.22 a | 275.92 ± 4.31 a |
| A4C | 61.15 ± 3.36 b | 757.69 ± 34.66 b | 5.77 ± 0.49 b | 6.09 ± 0.25 a | 206.30 ± 6.06 b |
| A4M | 68.31 ± 4.21 a | 890.98 ± 46.89 a | 8.42 ± 0.68 a | 6.28 ± 0.21 a | 248.06 ± 2.22 c |
| M20-15% SNC | 40.43 ± 2.96 C | 757.72 ± 19.07 C | 1.93 ± 0.56 C | 6.07 ± 0.26 A | 204.17 ± 3.71 A |
| A4C-15%SNC | 75.49 ± 4.49 A | 1050.6 ± 56.67 B | 4.68 ± 0.22 B | 4.79 ± 0.25 C | 156.04 ± 3.82 B |
| A4M-15%SNC | 72.99 ± 3.35 B | 1106.5 ± 24.25 A | 7.66 ± 0.37 A | 5.65 ± 0.14 B | 151.84 ± 1.92 C |
Publisher’s Note: MDPI stays neutral with regard to jurisdictional claims in published maps and institutional affiliations. |
© 2021 by the authors. Licensee MDPI, Basel, Switzerland. This article is an open access article distributed under the terms and conditions of the Creative Commons Attribution (CC BY) license (https://creativecommons.org/licenses/by/4.0/).
Share and Cite
Xiao, Q.; Huang, M.; Zhou, X.; Dai, M.; Zhao, Z.; Zhou, H. Effect of Molecular Weight and Degree of Substitution on the Physical-Chemical Properties of Methylcellulose-Starch Nanocrystal Nanocomposite Films. Polymers 2021, 13, 3291. https://doi.org/10.3390/polym13193291
Xiao Q, Huang M, Zhou X, Dai M, Zhao Z, Zhou H. Effect of Molecular Weight and Degree of Substitution on the Physical-Chemical Properties of Methylcellulose-Starch Nanocrystal Nanocomposite Films. Polymers. 2021; 13(19):3291. https://doi.org/10.3390/polym13193291
Chicago/Turabian StyleXiao, Qian, Min Huang, Xiaolan Zhou, Miaoqi Dai, Zhengtao Zhao, and Hui Zhou. 2021. "Effect of Molecular Weight and Degree of Substitution on the Physical-Chemical Properties of Methylcellulose-Starch Nanocrystal Nanocomposite Films" Polymers 13, no. 19: 3291. https://doi.org/10.3390/polym13193291