3.1. Contrast of CNC Particles in a TEM Image
CNCs are low-density (1.6 g/cm
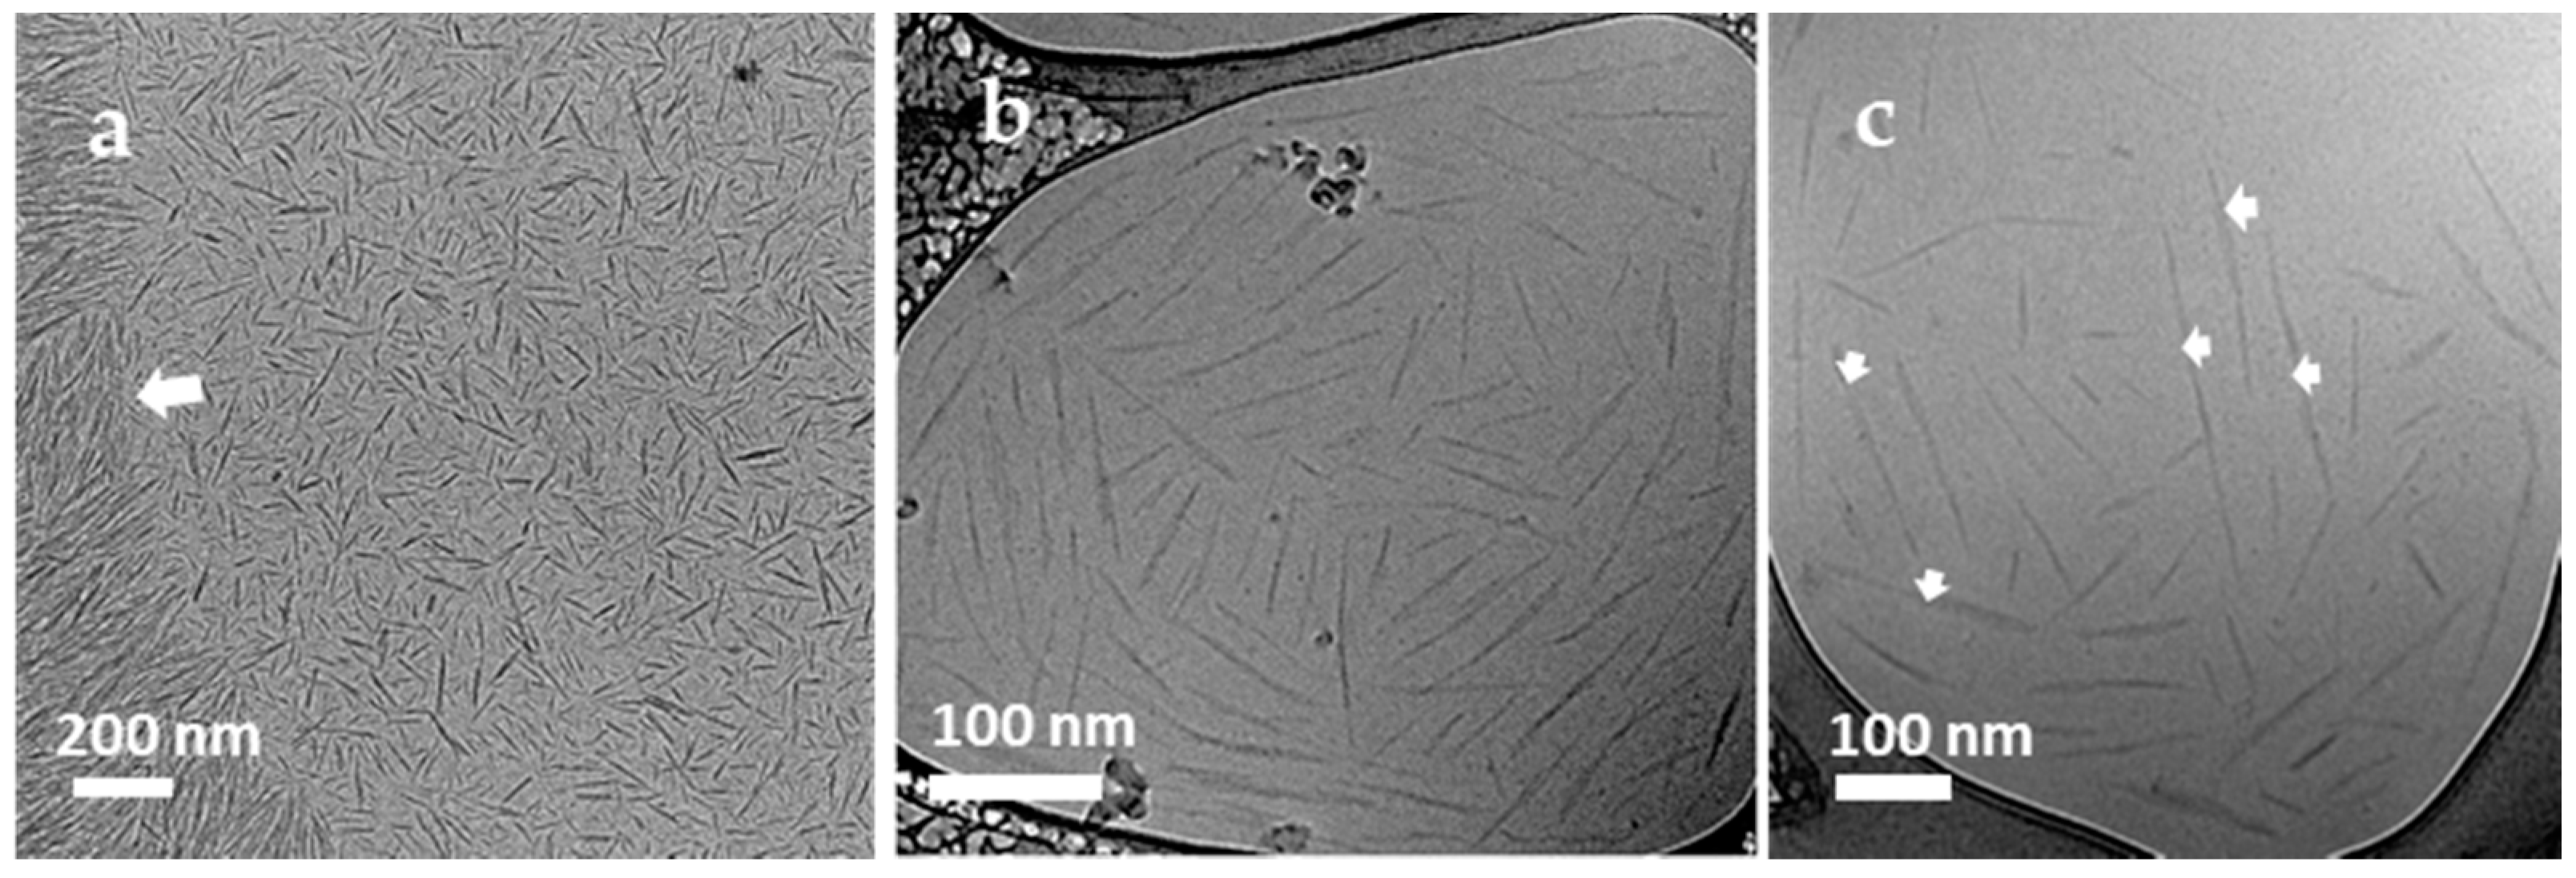
3), high-aspect-ratio and electron-beam-sensitive biopolymers. The mass contrast of CNC nanoparticles in a normal BF-TEM image is very weak (
Figure 2a). To enhance the contrast, conventional negative staining is widely used, and generally, 1–2% aqueous uranyl acetate is used as the staining reagent. However, due to the different staining methods/protocols, inconsistent quality and properties of the supporting films on TEM grids, as well as individual operator skills, staining results vary even for CNCs deposited on the same TEM grids [
21]. As shown in
Figure S2, a typical region of CNCs stained with 2% uranyl acetate has a gradient stain depth, resulting in CNCs with different contrasts. The very shallow stain cannot cover the overall contour of CNCs, resulting in a weak contrast (
Figure 2b). The CNCs in the deep stain appear bright with a fairly uniform dark background (
Figure 2d), whereas those in the shallow stain are outlined by the stain (dark outlines), and the helical structure of the CNC particles is revealed clearly (
Figure 2c). Despite this stain-depth variation, the rapid-flushing staining method described in the TEM specimen preparation was found to be the most suitable method among all those tested. To ensure that particles selected for image processing and size measurement were as homogenous as possible, regions of CNCs with similar stain depths were chosen as one dataset.
In addition to heavy-metal staining such as UA, the contrast of CNCs can also be enhanced with other approaches such as electron energy filtering, objective lens defocusing and phase-plate insertion in the BF-TEM mode. As shown in
Figure 3a, a zero-loss BF-TEM image of unstained CNCs was taken with a 10 eV energy filter and a defocus of −3 µm, in which the helical-like structure of CNCs was revealed, which indicates that the helical structure in stained CNCs is not an artifact. In the last decade, phase-plate imaging has also been explored in contrast enhancement of soft materials. However, considering the various phase-plate types, phase-shift interpretation and access to instruments with a phase plate, it might be challenging to standardize the size distribution with this approach. In addition to the above approaches of contrast enhancement, STEM imaging is an important method of contrast tuning for polymers and biomolecules [
22,
23]. The contrast of an ADF-STEM image is related to mass thickness and atomic numbers in the specimen. The pristine CNCs in the ADF-STEM images give high contrast, the individual CNC particles are distinguishable and some CNC particles (pointed by arrows) with nonuniform width along their long axis can be revealed (
Figure 3b). On the other hand, electron-beam-induced contaminations can easily build up during scanning and blur the image at high resolution. For CNCs stained with uranyl acetate, edges of CNCs exhibit sharp contrast from the stain with a shallow depth in the ADF-STEM image, as shown in
Figure 3d. It is easier to identify the individual CNCs than those in the BF-TEM images (
Figure 3c) taken from an adjacent area, even though the helical or twist structure of CNCs is not revealed in the ADF-STEM images, which may not be important for size measurement.
With the contrast enhancement methods discussed above, sets of BF-TEM and ADF-STEM images of stained and unstained CNCs deposited on carbon TEM grids (Sp1 and Sp2 specimens) were acquired. The length and width of selected CNCs imaged at different conditions were measured, and the descriptive statistics of their distributions are summarized in
Table S1. For curiosity, a set of BF-TEM images of CNCs was taken for each of the areas with a gradient stain depth, indicated as Zones A1, A2 and A3 in
Figure S2, and the image resolution was 0.41 nm/pixel, 0.41 nm/pixel and 0.29 nm/pixel, respectively. The mean length of CNCs in Zones A1, A2 and A3 is 100.5 nm, 88.8 nm and 79.6 nm, and the mean width is 5.8 nm, 6.4 nm and 6.7 nm, respectively. Moving toward inward areas with a shallow stain (a similar stain depth as in Zone A3), an image set of ADF-STEM for Zone A4 was taken with an image resolution of 0.5 nm/pixel. The mean length and width of CNCs in Zone A4 are 76.3 nm and 7.0 nm, respectively. The histograms of length and width distributions are all included in
Figure S3. Box plots of length, width and aspect ratio (length to width) for Zones A1 to A4 are shown in
Figure 4. From Zones A1 to A4 with decreasing stain depths, the CNC width increases, while the CNC length and aspect ratio (AR) decrease, which suggests a correlation between size distribution and stain depth or imaging zone. Thus, the question to be answered is: does the stain depth affect the size of CNCs, or are CNC particles distributed differentially or fractionally on the substrate by size during droplet drying?
3.2. Dispersion of CNCs Adsorbed on Carbon-Film-Supported TEM Grids
As known, when a sessile droplet containing dispersed solid dries on a solid surface, a characteristic “coffee ring” is formed due to capillary flow toward the droplet edge [
24]. In general, during the evaporation of a sessile droplet, the distribution of solids can be affected by capillary flow direction [
24], Marangoni flows [
25], particle−substrate interactions, particle–particle interaction and particle shape [
26]. During TEM specimen preparation, the coffee-ring effect starts once the initial droplet is placed on TEM grids, and the degree of this effect depends on CNC concentration, incubation time, droplet volume and film surface properties. In the initial droplet, rod-shaped particles can be fractionated by particle size along the capillary flow direction when the contact lines of droplets recede on the substrate [
27,
28]. Particles with a high AR can be orderly arranged near the ring (droplet) edge with their major axis parallel to the contact lines [
29]. After a certain incubation time, the initial capillary flow direction is interrupted by shear force from blotting, and the initial droplet is divided into many smaller droplets scattered on the carbon film surface, which might cause redistribution of the CNC particles on the substrate. In subsequent staining, the staining reagent may change the CNC distribution and orientation, but the lateral movement of CNCs should be confined within small areas. After drying, coffee rings might be formed, resulting in gradient thickness of stain. In Specimen Sp1 of stained CNCs, 3 µL of CNC solution and a 10 s incubation time for the initial droplet were used to minimize the coffee-ring effect so that CNCs of all sizes are included for quantitative analysis. However, it is difficult to void the coffee-ring effect completely, as seen in the gradient depth of stain in
Figure S2. The results from Zone A1 to Zone A4 with decreasing stain depth, showing that the mean width increases while the mean length and the mean AR decrease, are due to the coffee-ring effect fractionating CNC dispersion on the substrate, instead of different stain thicknesses.
To avoid the influence of staining reagent on CNC distribution, unstained CNCs dried on TEM grids (Specimen Sp2) were prepared with the same volume of the initial droplet (3 µL) as Sp1 but with a longer incubation time (60 s). As shown in
Figure 5a, well-dispersed CNCs are surrounded by more concentrated CNCs lying along their major axis in a coffee-ring pattern (only part of the ring is shown). The major axis of CNCs was redirected to follow the blotting direction rather than being parallel to the pinned line. The size distribution of CNCs in the center area is shown as Dataset A5 in
Table S1. The mean length and width are 85.6 nm and 8.9 nm, respectively. The mean length is comparable to those in Datasets A1 to A4, while the mean width is much larger. Such a large mean width was also reported by Johnston’s team with a consensus distribution of 7.7 ± 2.2 nm [
15]. In their case, a 10 µL volume and a 4 min incubation time were used for the initial droplet of CNCs, and an extra washing step with water was added before the subsequent staining of CNCs. The larger droplet volume and longer incubation time made the fractionation and ordered arrangement of CNCs on the substrate driven by the coffee-ring effect more predominant. The washing step may have removed or redistributed some loose CNCs, but the subsequent staining should not affect the dispersion of CNCs already adsorbed on the carbon film surface. Due to the polydispersity of CNCD-1 materials, the fractionated dispersion of CNCs caused by the coffee-ring effect may introduce variability of size distribution when CNCs are imaged and selected from different regions on TEM grids, especially in the radial direction (TEM grid center to edge). The measured mean width of CNCs adsorbed on the center of the TEM grids is larger than that near the edge. Unfortunately, the location of images taken for each laboratory was not specified. In general, areas near the center of the TEM grids would be used for imaging as the default location, likely resulting in biased size distributions.
To further prove this coffee-ring effect or the dispersion of CNCs within a droplet, Specimen Sp4 was prepared using the plunge-freezing method to vitrify the CNC aqueous solution without a further drying process. Compared with Specimens Sp1 and Sp2, the incubation time of Sp4 was longer so that most CNCs could settle down within the droplet. Despite blotting from the backside of the droplet, the majority of CNCs near the edge of the droplet were arranged with their major axis parallel to each other (
Figure 5b) and dispersed across the entire carbon film hole. CNCs near the center of the TEM grids were less ordered and dispersed than those near the edge of the carbon film hole (
Figure 5c). Cryo-TEM images were acquired from regions near the center of the TEM grids as Datasets A6 and near the edge as Dataset A7, respectively. The size distribution in each dataset is summarized in
Table S1. The histograms of length and width distributions are shown in
Figure S4. The mean width and length with standard deviation for A6 and A7 are 7.0 ± 1.1 nm and 112.4 ± 40.6 nm, 6.2 ± 1.2 nm and 96.4 ± 30.0 nm, respectively. The population of CNCs near the center (A6) has a larger length and width than that near the edge (A7), as shown in the box plots in
Figure 6. The ARs in both regions are similar, in contradiction to the dried CNC specimen, Sp1. The blotting direction and TEM grid surface used for the cryo-TEM specimen and the dried CNC specimen were different, which may interfere with the CNC distribution differently during blotting. As illustrated in
Figure S5, shear force is induced once the filter paper touches the edge of the continuous carbon-film-coated TEM grid, causing CNCs near the air–water interface to drain along the shear force direction. However, when blotting from the backside of perforated film, the shear force induced flow is through the holes so that CNCs near the air–water interface are drawn within thinned aqueous film rather than being removed [
30,
31]. CNCs within frozen aqueous film can be dispersed at different heights along the beam direction, which is different from CNCs drying on continuous film after blotting. As shown in
Figure 5c, the larger particles marked by arrows might be composed of multiple end-to-end or slightly side-by-side CNC particles or overlapped projections from two particles embedded in different vertical positions, contributing to size inflation for both length and width.
3.3. Orientation of CNCs on Carbon-Film-Supported TEM Grids
As discussed above, CNCs on TEM grids could be fractionated during TEM specimen preparation, resulting in variability of size distribution when CNCs images are taken from different regions in the radial direction. In addition to the fractionated dispersion, the orientation of CNCs on the substrate also has a significant influence on size measurement from TEM images, as illustrated in
Figure S1. In the CNCD-1 materials, about 28% of CNCs are particles with a square or a symmetric cross-section, while the remainder are asymmetric with one axis 2–3 times longer than the other, as analyzed in AFM [
17]. When these asymmetric particles adsorb on the substrate surface with random orientations, the width distribution measured from TEM images may have large heterogeneity, as the TEM images are mixed projections of width and height from the minor-axial side of CNCs. Due to the strong hydrogen bond, CNCs tend to be laterally or twistedly jointed, and the widest side is normally the preferred orientation on the substrate.
Figure 7 shows a typical example of aggregated CNCs in one region, which are either in a lateral (NP1, NP2), vertical and lateral (NP3) or twisted arrangement (NP4). NP3 and NP4 may be composed of more than two CNCs, and the width of NP4 along the long axis is not uniform. All these arrangements and orientations of CNCs on the substrate cause the variability of size measurement both in TEM and AFM. With proper staining of CNCs, the separation line between laterally jointed CNCs can be resolved in TEM. As shown in the line profile of NP1 in
Figure 7, two particles with widths of 5.34 nm and 5.64 nm are well revealed and resolved. However, for unstained CNCs dried or embedded in vitreous ice or overstained CNCs, the separation between two CNC particles may not be revealed, resulting in inflated width measurement in TEM. In AFM, due to its limited resolving power in the lateral direction, it is difficult to resolve or separate laterally jointed CNCs. Therefore, the mean width measured with AFM may be overestimated when the orientation of CNCs is on the wider side. When CNC particles are arranged end-to-end or slightly side-by-side as illustrated in
Figure S1, the length measurement will be affected if the separation cannot be resolved in either TEM or AFM.
To reveal particle orientation and arrangement on the substrate, typical regions of CNC particles on Specimen Sp3 were used for ET.
Figure 8a shows a reconstructed 3D micrograph of two geometrically twisted CNCs, which are identified as one individual CNC particle (marked with an orange arrow) in the BF-TEM image (
Figure 8b). These two CNCs are screw-like or helical along the long axis, as revealed in the reconstructed volume views. The length and width of these two CNCs measured from the reconstructed 3D data are 57 nm and 3.5 nm and 60 nm and 3.8 nm, respectively. Moreover, in the 2D TEM image (
Figure 8b), the width measured for this twisted particle is 5.7 nm, which is used for width distribution analysis. In the same field of view, there is another particle marked with a white arrow. Tilting the particle along the long axis by about 20 degrees showed the particle is actually composed of three end-to-end-connected single CNC particles (
Figure 9). Thus, the length measurement for size distribution will give a larger value.
In addition to the particle–particle interactions and arrangement on TEM specimens, the intrinsic shape of CNC particles also contributes to size measurement variability. Ribbon-like CNCs marked with an orange arrow in
Figure 8d coexist in the same materials, as shown in
Figure 8c of a typical reconstructed 3D isosurface view. The reconstructed 3D data reveal that the CNC particle is helical-like, and its width is not uniform along the long axis. The length, height (thickness) and width of this particle are 60 nm, 3.6 nm (left in
Figure 8c) and 5.7 nm (right in
Figure 8c), respectively. Thus, this asymmetric or rectangular cross-section suggests that CNC particles with a large width may be composed of more than one single crystallite.
Therefore, the shape, geometrical variation and orientation of CNCs on the substrate all contribute to the size measurement. The size measured from 2D images may not be the true parameter of CNC particles; rather, it is the average size of the projected images of all possible shapes and geometrical arrangements of CNCs deposited on the substrate, resulting in large variability of size distribution.


