
Influence of the Graphene Filler Nature on the Morphology and Properties of Melt Blended EVOH Based Nanocomposites

Abstract
:1. Introduction
2. Materials and Methods
2.1. Materials
2.2. Nanocomposite Films Preparation
2.3. Morphology Analysis
2.4. Thermal Analysis
2.5. Tensile Tests
2.6. Water Permeability
2.7. Oxygen Permeability
3. Results
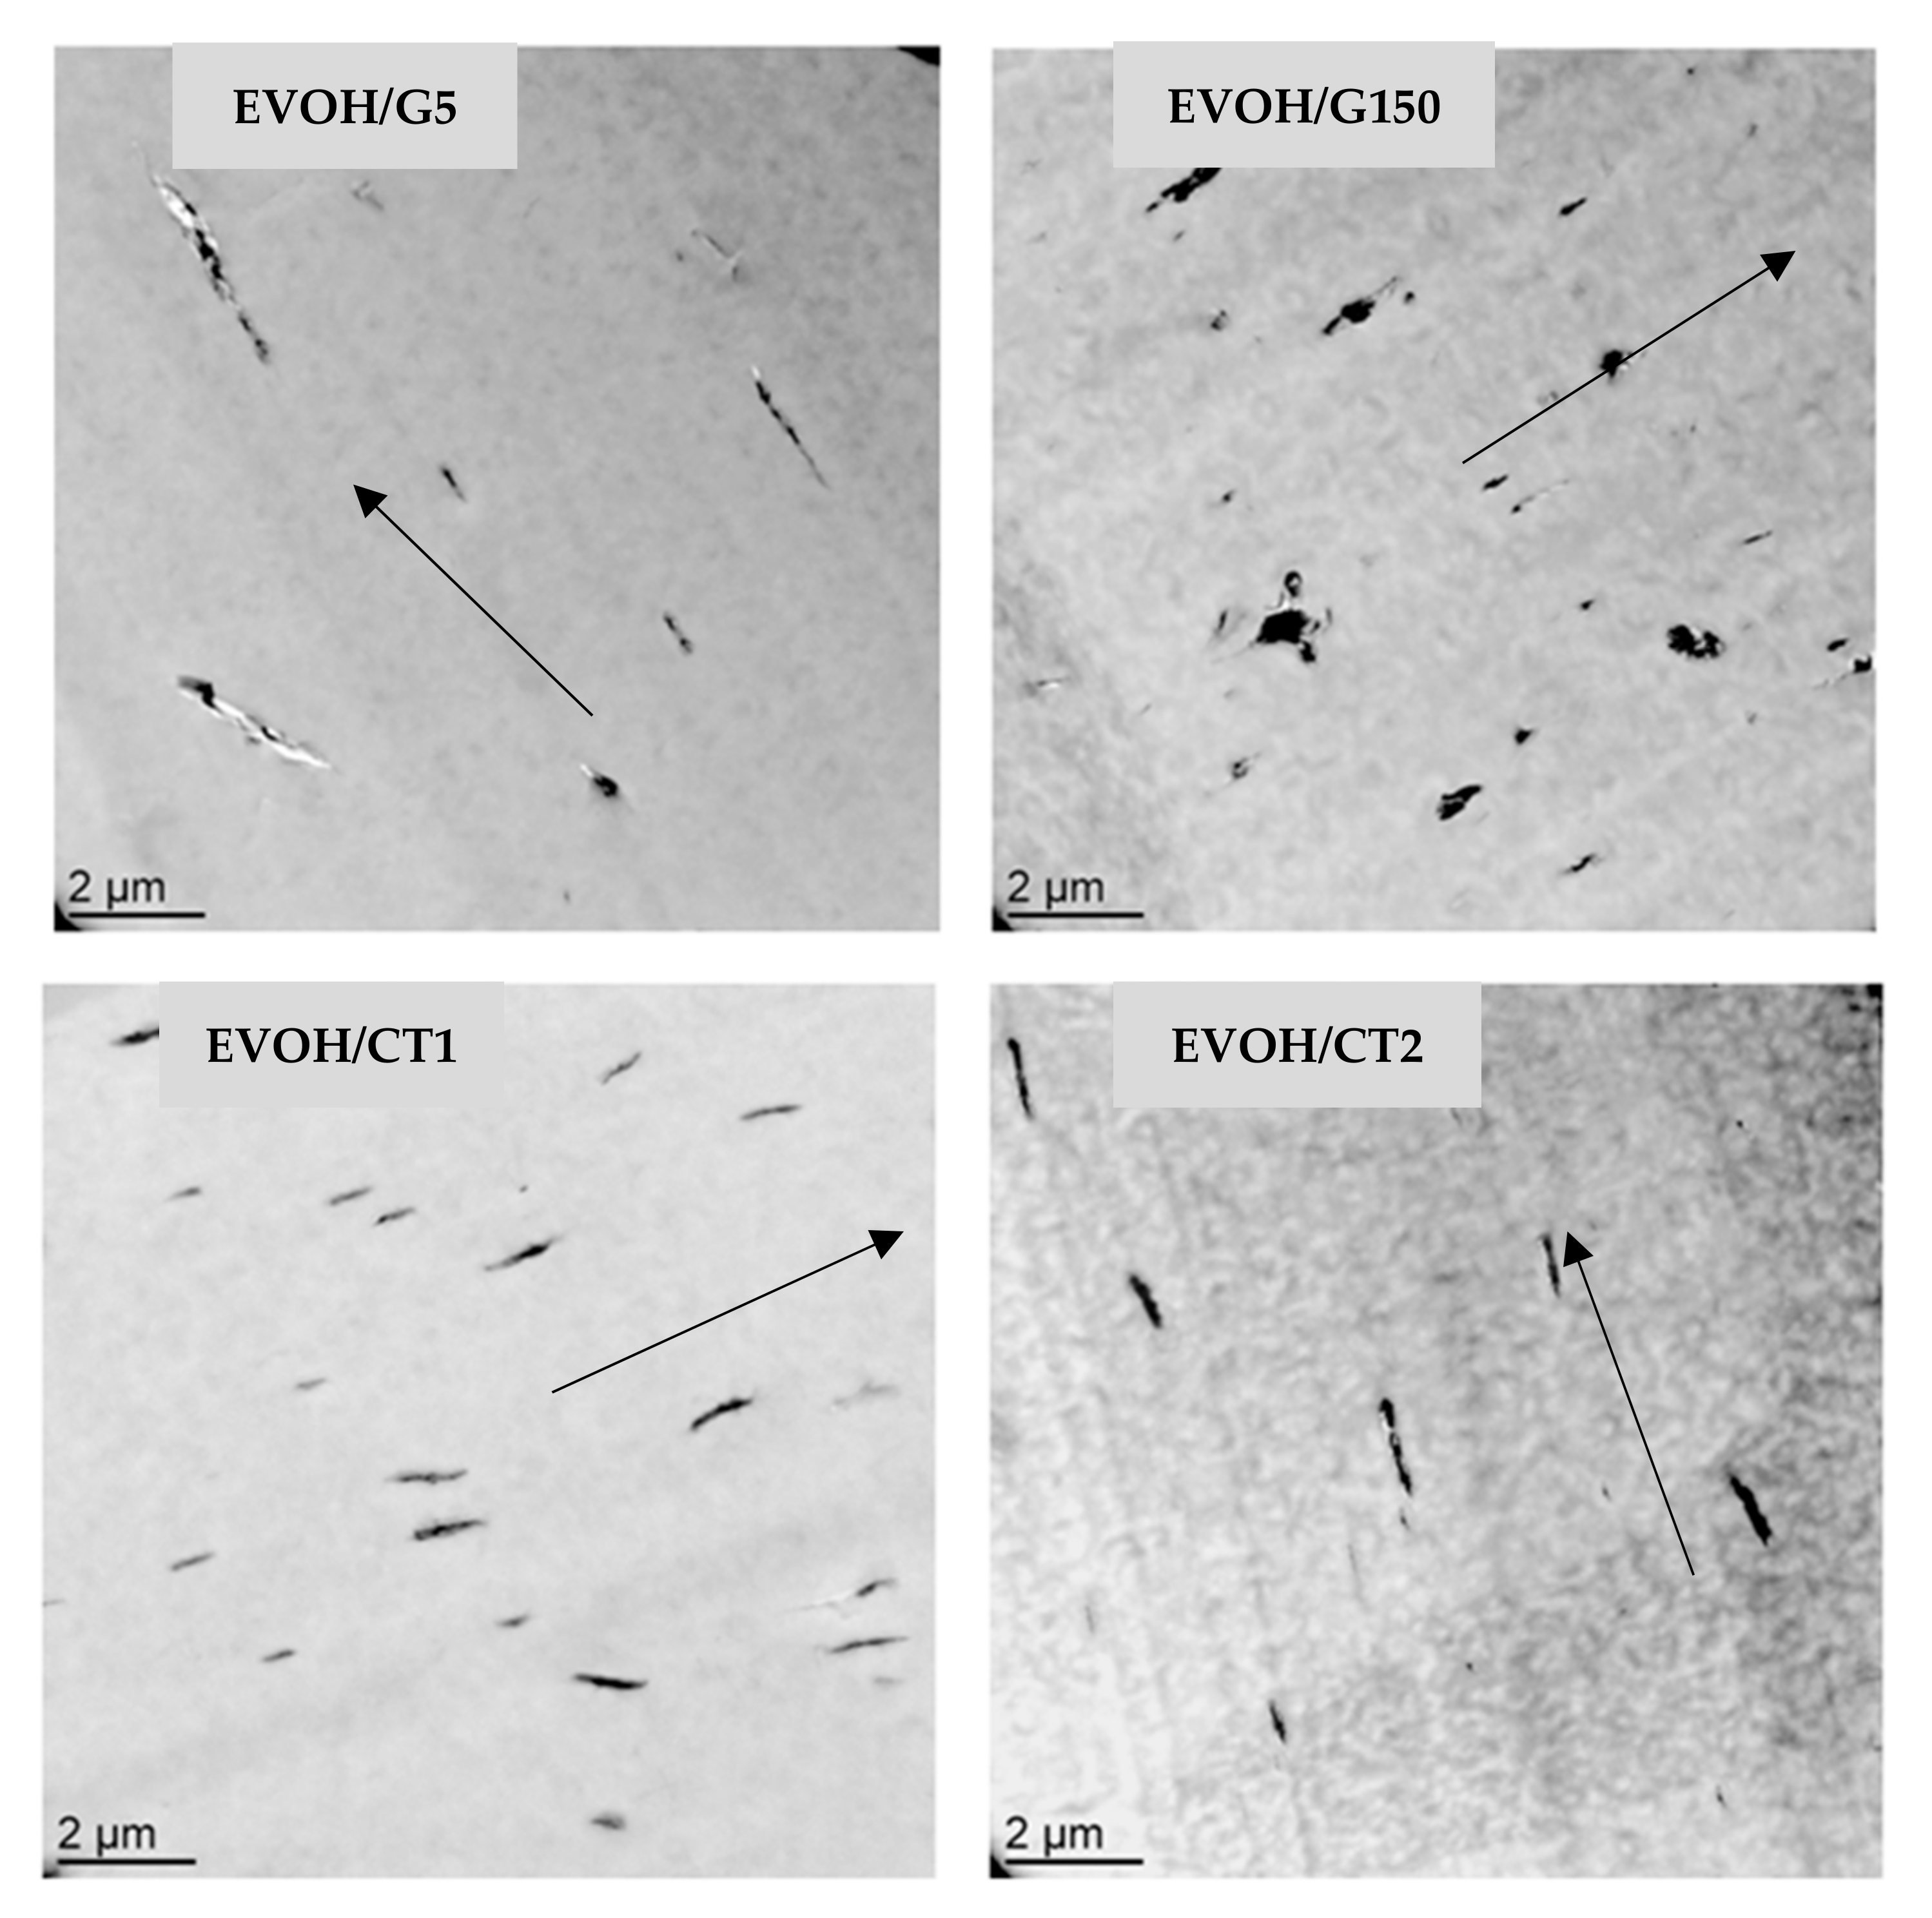
3.1. Morphology
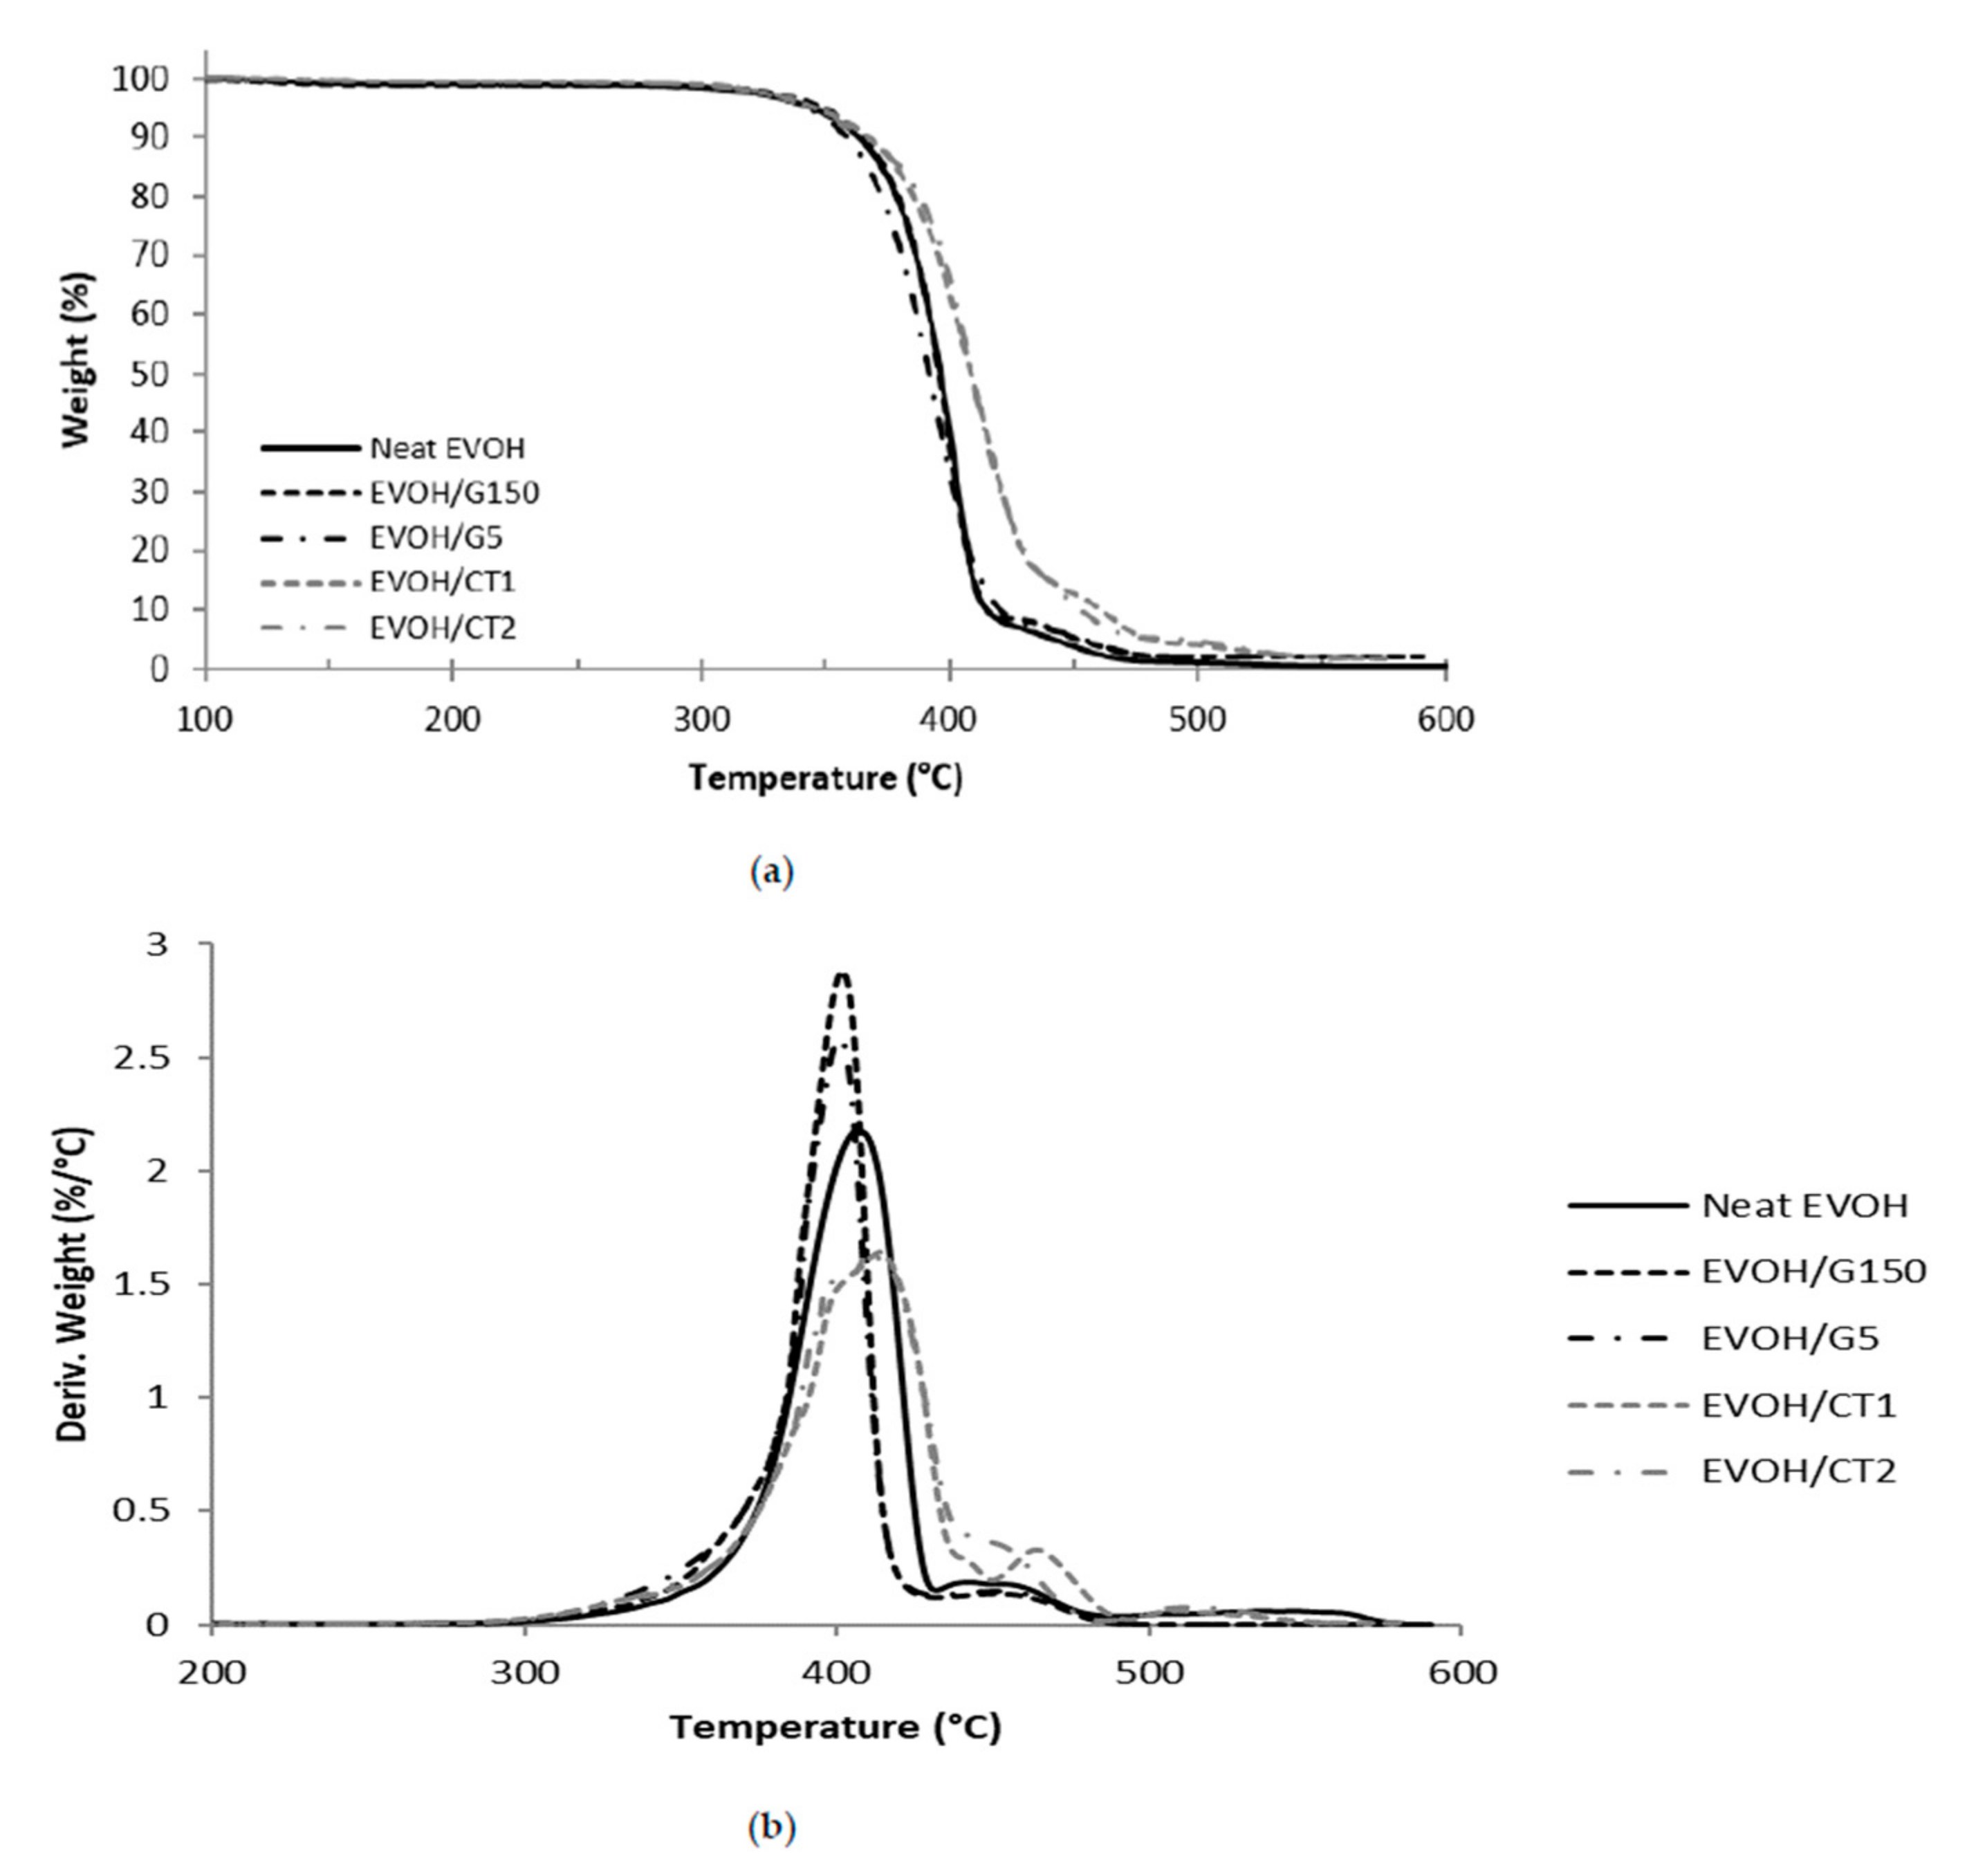
3.2. Thermal Properties
3.3. Microstructure
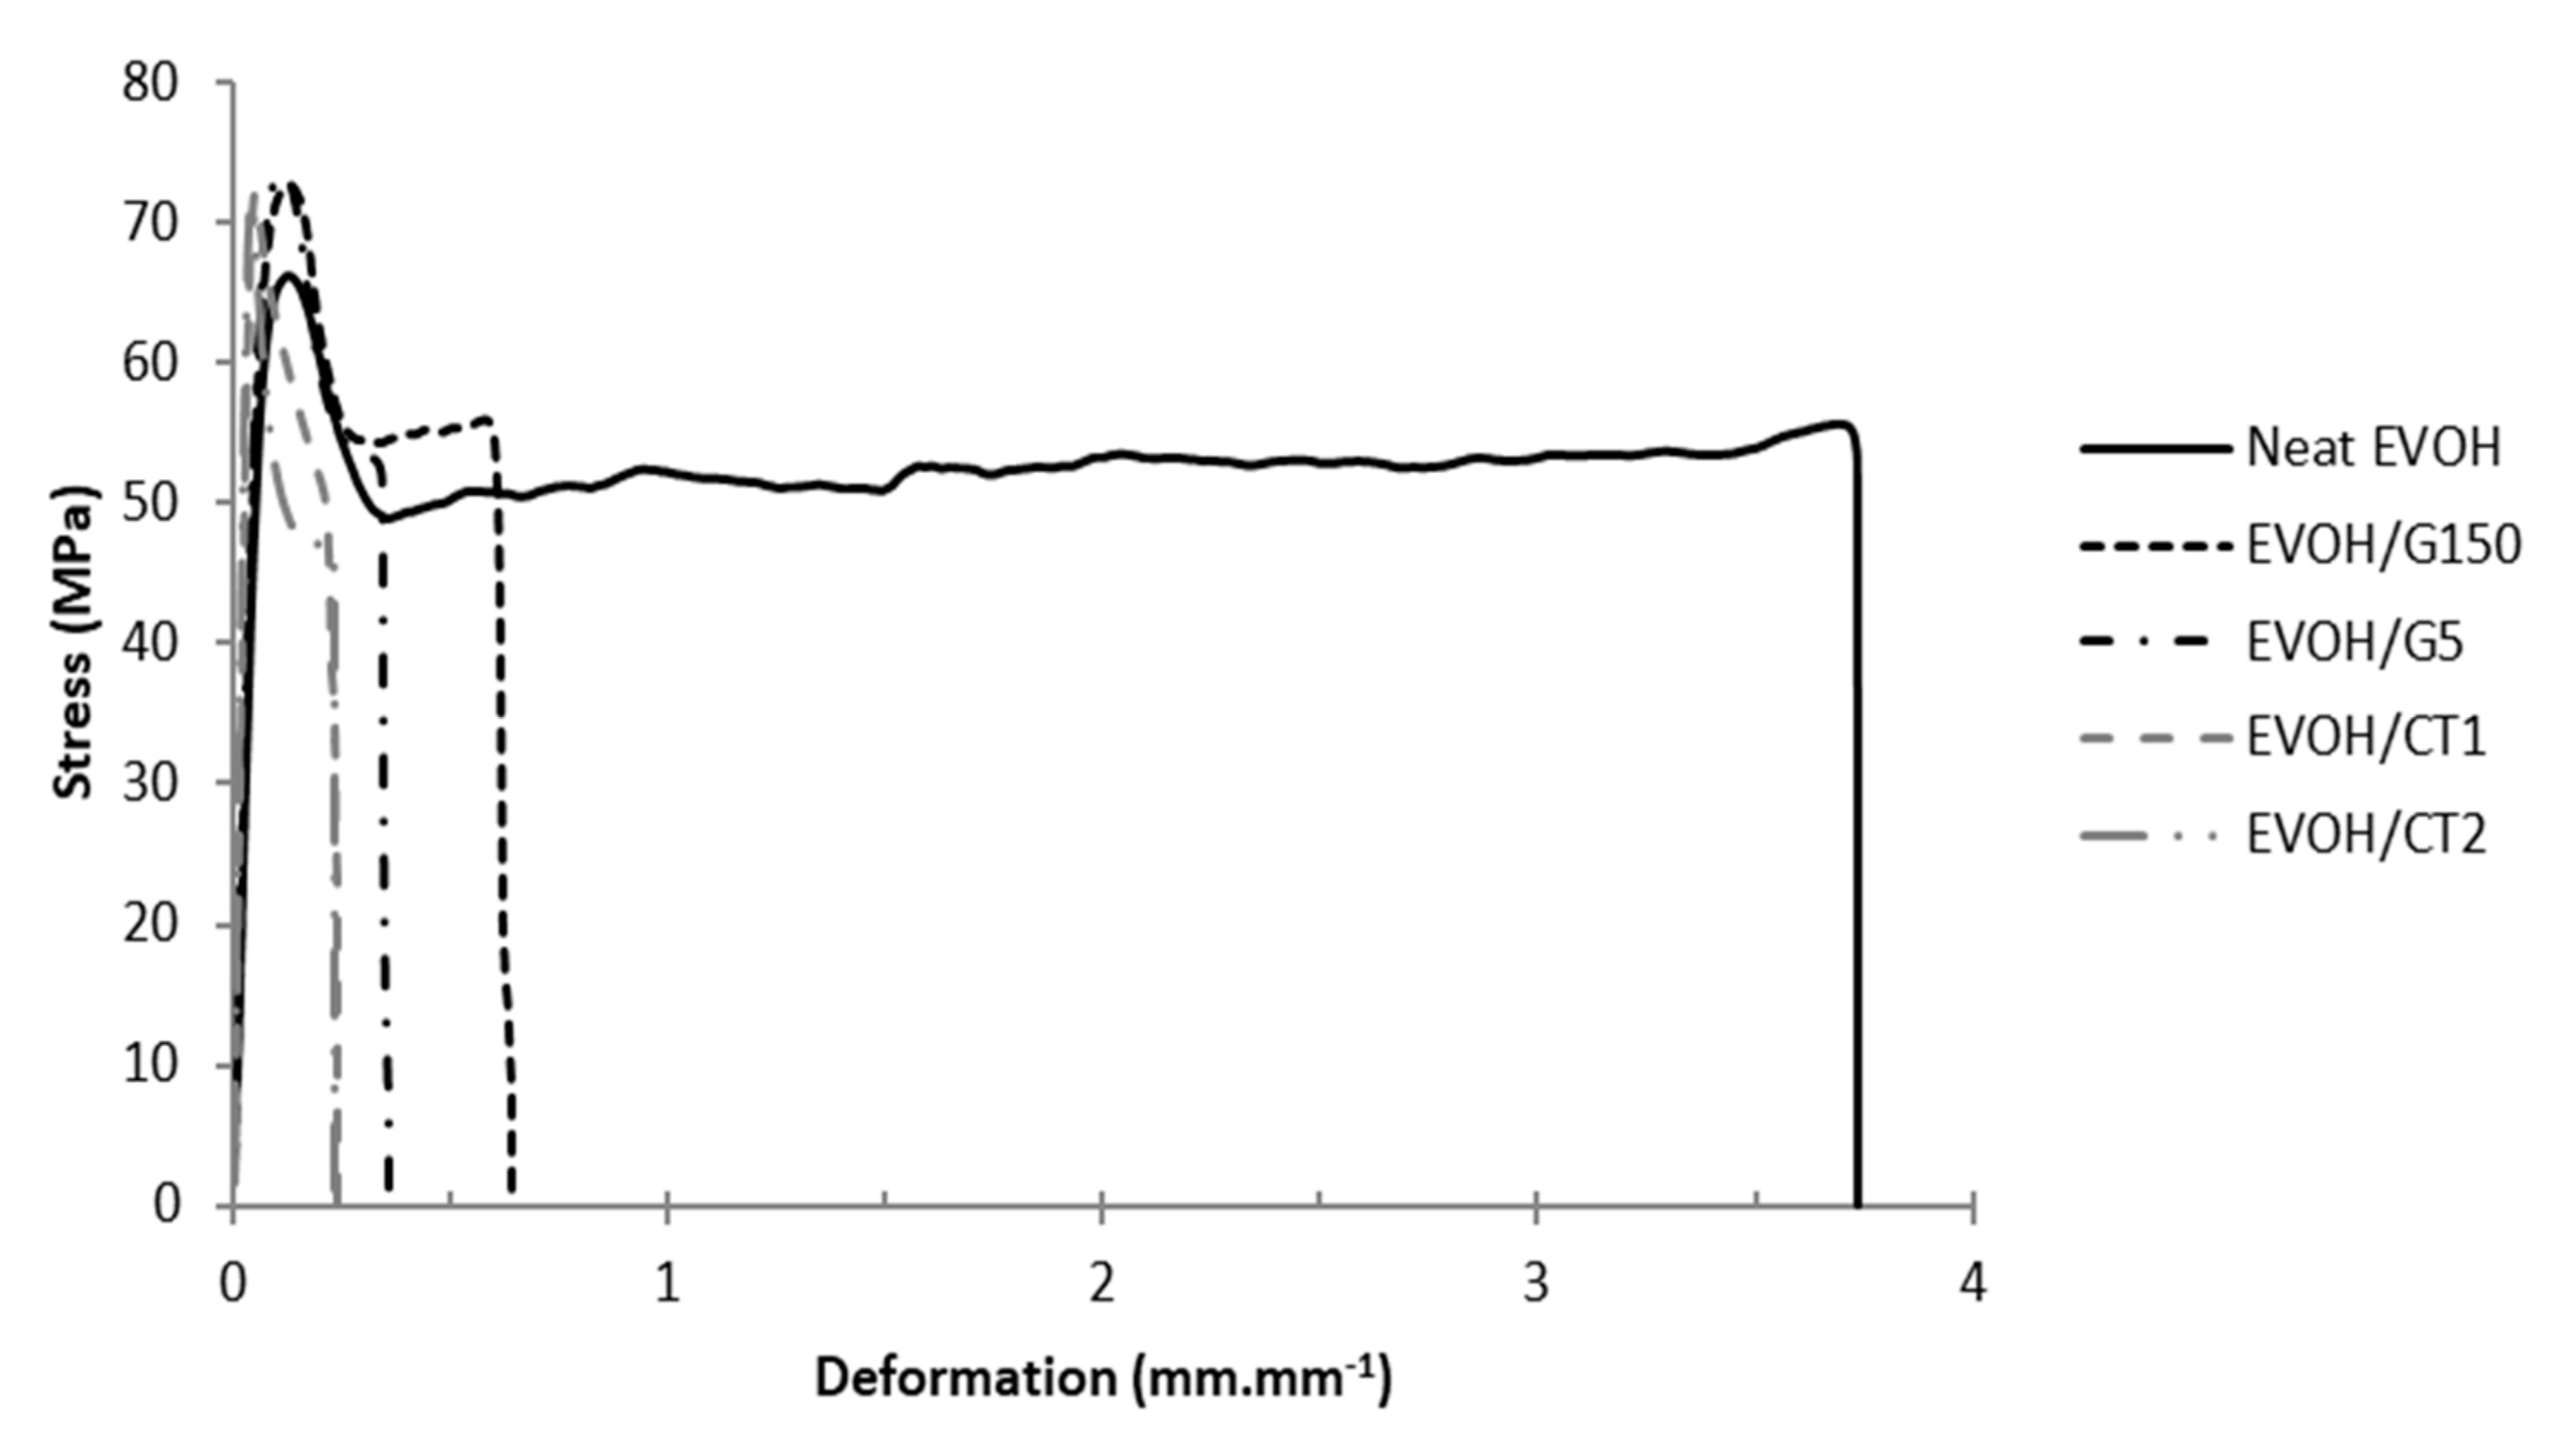
3.4. Mechanical Properties
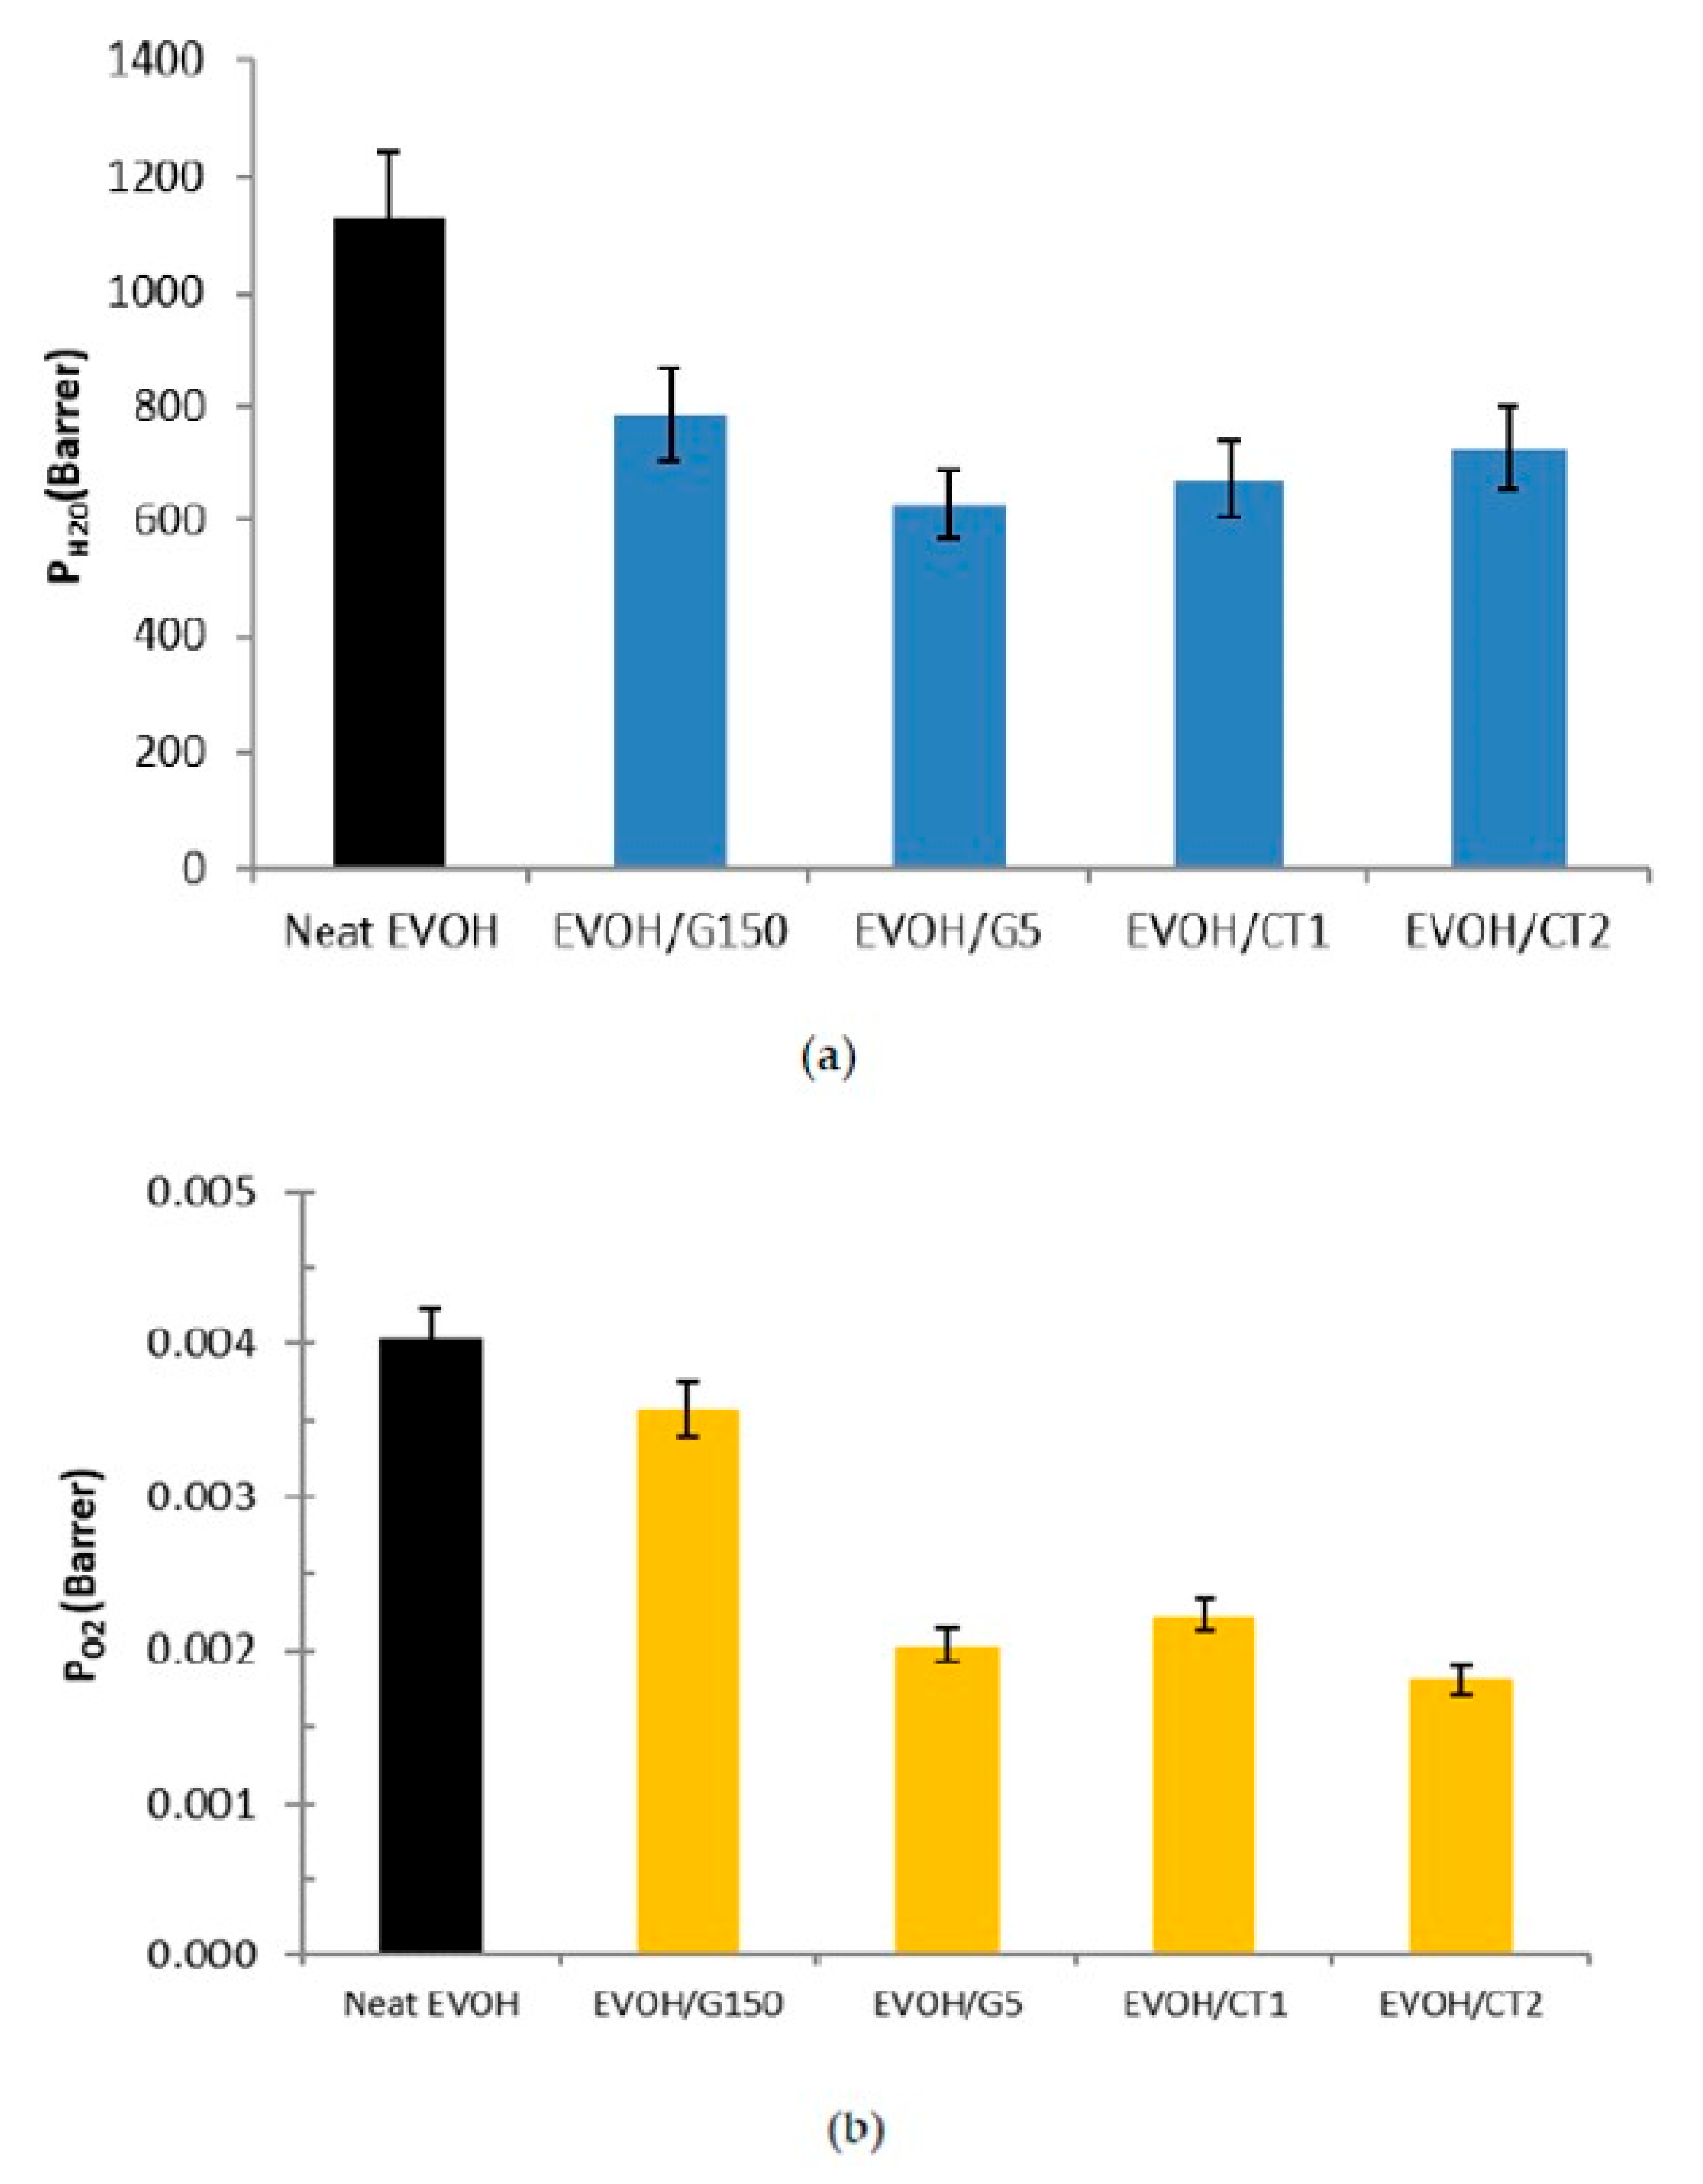
3.5. Water and Oxygen Barrier Properties
4. Conclusions
Author Contributions
Funding
Data Availability Statement
Acknowledgments
Conflicts of Interest
References
- Ge, C.; Popham, J. A Review and Evaluation of Prediction Models of Gas Permeation for a Blended Flexible Packaging Film. Packag. Technol. Sci. 2016, 29, 247–262. [Google Scholar] [CrossRef]
- Johansson, F.; Leufven, A. Food Packaging Polymer Films as Aroma Vapor Barriers at Different Relative Humidities. J. Food Sci. 1994, 59, 1328–1331. [Google Scholar] [CrossRef]
- Cerruti, P.; Laurienzo, P.; Malinconico, M.; Carfagna, C. Thermal oxidative stability and effect of water on gas transport and mechanical properties in PA6-EVOH films. J. Polym. Sci. Part. B Polym. Phys. 2007, 45, 840–849. [Google Scholar] [CrossRef]
- Maes, C.; Luyten, W.; Herremans, G.; Peeters, R.; Carleer, R.; Buntinx, M. Recent updates on the barrier properties of ethylene vinyl alcohol copolymer (EVOH): A review. Polym. Rev. 2018, 58, 209–246. [Google Scholar] [CrossRef] [Green Version]
- Rahnama, M.; Oromiehie, A.; Ahmadi, S.; Ghasemi, I. Effect of different blend compositions on properties of low-density polyethylene/ethylene vinyl alcohol/clay toward high oxygen barrier nanocomposite films. Polym. Sci. Ser. A 2017, 59, 533–542. [Google Scholar] [CrossRef]
- Martínez-Sanz, M.; Lopez-Rubio, A.; Lagaron, J.M. Nanocomposites of ethylene vinyl alcohol copolymer with thermally resistant cellulose nanowhiskers by melt compounding (I): Morphology and thermal properties. J. Appl. Polym. Sci. 2013, 128, 2666–2678. [Google Scholar] [CrossRef]
- Martínez-Sanz, M.; Olsson, R.T.; Lopez-Rubio, A.; Lagaron, J.M. Development of bacterial cellulose nanowhiskers reinforced EVOH composites by electrospinning. J. Appl. Polym. Sci. 2012, 124, 1398–1408. [Google Scholar] [CrossRef]
- Nam, J.-D.; Kim, S.W. Phase compatibility and barrier properties of ethylene/vinyl alcohol copolymer based hybrid materials. J. Appl. Polym. Sci. 2010, 115, 1663–1670. [Google Scholar] [CrossRef]
- Christoforidis, K.C.; Kubacka, A.; Ferrer, M.; Cerrada, M.L.; Fernandez-Garcia, M. Role of TiO2 morphological characteristics in EVOH–TiO2 nanocomposite films: Self-degradation and self-cleaning properties. RSC Adv. 2013, 3, 8541. [Google Scholar] [CrossRef] [Green Version]
- Lee, E.-J.; Yoon, J.-S.; Park, E.-S. Morphology, resistivity, and thermal behavior of EVOH/carbon black and EVOH/graphite composites prepared by simple saponification method. Polym. Compos. 2011, 32, 714–726. [Google Scholar] [CrossRef]
- Cabedo, L.; Villanueva, M.P.; Lagarón, J.M.; Giménez, E. Development and characterization of unmodified kaolinite/EVOH nanocomposites by melt compounding. Appl. Clay Sci. 2017, 135, 300–306. [Google Scholar] [CrossRef] [Green Version]
- Kwon, H.; Kim, D.; Seo, J. Thermal and barrier properties of EVOH/EFG nanocomposite films for packaging applications: Effect of the mixing method. Polym. Compos. 2016, 37, 1744–1753. [Google Scholar] [CrossRef]
- Luzi, F.; Di Michele, A.; Torre, L.; Puglia, D. Active role of ZnO nanorods in thermomechanical and barrier performance of poly (vinyl alcohol-co-ethylene) formulations for flexible packaging. Polymers 2019, 11, 922. [Google Scholar] [CrossRef] [PubMed] [Green Version]
- Lee, S.; Tyler, R.; Maia, J.; Schiraldi, D.A. Structural interaction and gas barrier properties of ethylene-vinyl alcohol/tin phosphate glass composite. J. Polym. Sci. Part. B Polym. Phys. 2018, 56, 989–998. [Google Scholar] [CrossRef]
- Novoselov, K.S. Electric Field Effect in Atomically Thin Carbon Films. Science 2004, 306, 666–669. [Google Scholar] [CrossRef] [PubMed] [Green Version]
- Zhu, Y.; Murali, S.; Cai, W.W.; Li, X.S.; Suk, J.W.; Potts, J.R.; Ruoff, R.S. Graphene and Graphene Oxide: Synthesis, Properties, and Applications. Adv. Mater. 2010, 22, 3906–3924. [Google Scholar] [CrossRef] [PubMed]
- Yoo, B.M.; Shin, H.J.; Yoon, H.W.; Park, H.B. Graphene and graphene oxide and their uses in barrier polymers: Review. J. Appl. Polym. Sci. 2014, 131, 39628. [Google Scholar] [CrossRef]
- Wu, H.; Drzal, L.T. Graphene nanoplatelet paper as a light-weight composite with excellent electrical and thermal conductivity and good gas barrier properties. Carbon 2012, 50, 1135–1145. [Google Scholar] [CrossRef]
- Kim, H.; Miura, Y.; Macosko, C.W. Graphene/Polyurethane Nanocomposites for Improved Gas Barrier and Electrical Conductivity. Chem. Mater. 2010, 22, 3441–3450. [Google Scholar] [CrossRef]
- Cui, Y.; Kundalwal, S.I.; Kumar, S. Gas barrier performance of graphene/polymer nanocomposites. Carbon 2016, 98, 313–333. [Google Scholar] [CrossRef] [Green Version]
- Bégin, D.; Lavoué, J.; Gérin, M. La Substitution des Solvants par le Diméthylsulfoxide; Institut de recherche Robert-Sauvé: Montreal, QC, Canada, 2002. [Google Scholar]
- Buchholz, H.; Arpe, H.-J.; Ullmann, F. Ullmann’s Encyclopedia of Industrial Chemistry; Wiley: Hoboken, NJ, USA, 1996; Volume A1–A28, B1–B8. [Google Scholar]
- Santana, J.G.; Ortiz, A.; Oliveira, R.R.; Rangari, V.K.; Guven, O.; Moura, E.A.B. Mechanical, Thermal, Morphology and Barrier Properties of Flexible Film Based on Polyethylene-Ethylene Vinyl Alcohol Blend Reinforced with Graphene Oxide. Charact. Miner. Met. Mater. 2017, 2017, 49–57. [Google Scholar]
- Barreira, D.A.S.; Lazaro, L.Y.; Santana, J.; González Ruíz, J.E.; Valenzuela-Díaz, F.; Güven, O.; Moura, E.A.B. Preparation of EVOH/Graphene oxide by blown film Extrusion-Correlation between film properties and graphene oxude addition. In Proceedings of the BCCM-3rd Brazilian Conference on Composite Materials, Gramado, Brazil, 28–31 August 2016. [Google Scholar]
- Rwei, S.-P.; Jue, Z.-F.; Chiang, W.-Y.; Chen, J.-H.; Chen, Y.-H. Characterization of melt spinnability of ethylene vinyl alcohol copolymers. Text. Res. J. 2016, 86, 1191–1201. [Google Scholar] [CrossRef]
- Kwon, H.; Kim, D.; Seo, J.; Han, H. Enhanced moisture barrier films based on EVOH/exfoliated graphite (EGn) nanocomposite films by solution blending. Macromol. Res. 2013, 21, 987–994. [Google Scholar] [CrossRef]
- Kim, D.; Kwon, H.; Seo, J. EVOH nanocomposite films with enhanced barrier properties under high humidity conditions. Polym. Compos. 2014, 35, 644–654. [Google Scholar] [CrossRef]
- Lewandowska, K. Miscibility and thermal stability of poly (vinyl alcohol)/chitosan mixtures. Thermochim. Acta 2009, 493, 42–48. [Google Scholar] [CrossRef]
- Armstrong, R. New EVAL EVOH Resins for Flexible Packaging. In Proceedings of the Tappi PLACE Division Conference, Indianopolis, IN, USA, 30 August–2 September 2004. [Google Scholar]
- Alvarez, V.A.; Ruseckaite, R.A.; Vázquez, A. Kinetic analysis of thermal degradation in poly (ethylene-vinyl alcohol) copolymers: Kinetic Analysis of Thermal Degradation in EVOH Copolymers. J. Appl. Polym. Sci. 2003, 90, 3157–3163. [Google Scholar] [CrossRef]
- George, J.J.; Bhowmick, A.K. Ethylene vinyl acetate/expanded graphite nanocomposites by solution intercalation: Preparation, characterization and properties. J. Mater. Sci. 2008, 43, 702–708. [Google Scholar] [CrossRef]
- Kuila, T.; Khanra, P.; Mishra, A.K.; Kim, N.H.; Lee, J.H. Functionalized-graphene/ethylene vinyl acetate co-polymer composites for improved mechanical and thermal properties. Polym. Test. 2012, 31, 282–289. [Google Scholar] [CrossRef]
- Kim, S.W.; Choi, H.M. Enhancement of thermal, mechanical, and barrier properties of ethylene vinyl alcohol copolymer by incorporation of graphene nanosheets: Effect of functionalization of graphene oxide. High. Perform. Polym. 2015, 27, 694–704. [Google Scholar] [CrossRef]
- Das, B.; Eswar Prasad, K.; Ramamurty, U.; Rao, C.N.R. Nano-indentation studies on polymer matrix composites reinforced by few-layer graphene. Nanotechnology 2009, 20, 125705. [Google Scholar] [CrossRef]
- Cabedo, L.; Lagarón, J.M.; Cava, D.; Saura, J.J.; Giménez, E. The effect of ethylene content on the interaction between ethylene-vinyl alcohol copolymers and water—II: Influence of water sorption on the mechanical properties of EVOH copolymers. Polym. Test. 2006, 25, 860–867. [Google Scholar] [CrossRef]
- Blanchard, A.; Gouanvé, F.; Espuche, E. Effect of humidity on mechanical, thermal and barrier properties of EVOH films. J. Membr. Sci. 2017, 540, 1–9. [Google Scholar] [CrossRef]
- Krupa, I.; Cecen, V.; Boudenne, A.; Krizanova, Z.; Vavra, I.; Srnanek, R.; Radnoczi, G. Mechanical Properties and Morphology of Composites Based on the EVA Copolymer Filled with Expanded Graphite. Polym.-Plast. Technol. Eng. 2012, 51, 1388–1393. [Google Scholar] [CrossRef]
- Yousefi, N.; Gudarzi, M.M.; Zheng, Q.B.; Lin, X.Y.; Shen, X.; Jia, J.J.; Sharif, F.; Kim, J.K. Highly aligned, ultralarge-size reduced graphene oxide/polyurethane nanocomposites: Mechanical properties and moisture permeability. Compos. Part. Appl. Sci. Manuf. 2013, 49, 42–50. [Google Scholar] [CrossRef]
- Bian, J.; Lin, H.L.; He, F.X.; Wang, L.; Wei, X.W.; Chang, I.T.; Sancaktar, E. Processing and assessment of high-performance poly (butylene terephthalate) nanocomposites reinforced with microwave exfoliated graphite oxide nanosheets. Eur. Polym. J. 2013, 49, 1406–1423. [Google Scholar] [CrossRef]
- Zhao, X.; Zhang, Q.; Chen, D.; Lu, P. Enhanced Mechanical Properties of Graphene-Based Poly (vinyl alcohol) Composites. Macromolecules 2010, 43, 2357–2363. [Google Scholar] [CrossRef]
- Yang, J.; Bai, L.; Feng, G.; Yang, X.Y.; Lv, M.J.; Zhang, C.A.; Hu, H.; Wang, X.B. Thermal Reduced Graphene Based Poly (ethylene vinyl alcohol) Nanocomposites: Enhanced Mechanical Properties, Gas Barrier, Water Resistance, and Thermal Stability. Ind. Eng. Chem. Res. 2013, 52, 16745–16754. [Google Scholar] [CrossRef]
- Kim, S.W.; Cha, S.-H. Thermal, mechanical, and gas barrier properties of ethylene-vinyl alcohol copolymer-based nanocomposites for food packaging films: Effects of nanoclay loading. J. Appl. Polym. Sci. 2014, 131, 40289. [Google Scholar] [CrossRef]
- Seethamraju, S.; Ramamurthy, P.C.; Madras, G. Flexible poly (vinyl alcohol-co-ethylene)/modified MMT moisture barrier composite for encapsulating organic devices. RSC Adv. 2013, 3, 12831. [Google Scholar] [CrossRef]
- Mokwena, K.K.; Tang, J. Ethylene Vinyl Alcohol: A Review of Barrier Properties for Packaging Shelf Stable Foods. Crit. Rev. Food Sci. Nutr. 2012, 52, 640–650. [Google Scholar] [CrossRef] [PubMed]
- Muramatsu, M.; Okura, M.; Kuboyama, K.; Ougizawa, T.; Yamamoto, T.; Nishihara, Y.; Saito, Y.; Ito, K.; Hirata, K.; Kobayashi, Y. Oxygen permeability and free volume hole size in ethylene–vinyl alcohol copolymer film: Temperature and humidity dependence. Radiat. Phys. Chem. 2003, 68, 561–564. [Google Scholar] [CrossRef]
- Kalaitzidou, K.; Fukushima, H.; Drzal, L.T. Multifunctional polypropylene composites produced by incorporation of exfoliated graphite nanoplatelets. Carbon 2007, 45, 1446–1452. [Google Scholar] [CrossRef]
- Compton, O.C.; Kim, S.; Pierre, C.; Torkelson, J.M.; Nguyen, S.T. Crumpled Graphene Nanosheets as Highly Effective Barrier Property Enhancers. Adv. Mater. 2010, 22, 4759–4763. [Google Scholar] [CrossRef] [PubMed]
- Gavgani, J.N.; Adelnia, H.; Gudarzi, M.M. Intumescent flame retardant polyurethane/reduced graphene oxide composites with improved mechanical, thermal, and barrier properties. J. Mater. Sci. 2014, 49, 243–254. [Google Scholar] [CrossRef] [Green Version]
- Kim, H.; Macosko, C.W. Processing-property relationships of polycarbonate/graphene composites. Polymer 2009, 50, 3797–3809. [Google Scholar] [CrossRef]
- Cheviron, P.; Gouanvé, F.; Espuche, E. Preparation, characterization and barrier properties of silver/montmorillonite/starch nanocomposite films. J. Membr. Sci. 2016, 497, 162–171. [Google Scholar] [CrossRef]
- Picard, E.; Gérard, J.-F.; Espuche, E. Water transport properties of polyamide 6 based nanocomposites prepared by melt blending: On the importance of the clay dispersion state on the water transport properties at high water activity. J. Membr. Sci. 2008, 313, 284–295. [Google Scholar] [CrossRef]
- Zhang, Z.; Britt, I.J.; Tung, M.A. Permeation of oxygen and water vapor through EVOH films as influenced by relative humidity. J. Appl. Polym. Sci. 2001, 82, 1866–1872. [Google Scholar] [CrossRef]
- Cerisuelo, J.P.; Gavara, R.; Hernández-Muñoz, P. Diffusion modeling in polymer–clay nanocomposites for food packaging applications through finite element analysis of TEM images. J. Membr. Sci. 2015, 482, 92–102. [Google Scholar] [CrossRef]
- Picard, E.; Espuche, E.; Fulchiron, R. Effect of an organo-modified montmorillonite on PLA crystallization and gas barrier properties. Appl. Clay Sci. 2011, 53, 58–65. [Google Scholar] [CrossRef]
- Hardy, L.; Espuche, E.; Seytre, G.; Stevenson, I. Gas transport properties of poly (ethylene-2,6-naphtalene dicarboxylate) films: Influence of crystallinity and orientation. J. Appl. Polym. Sci. 2003, 89, 1849–1857. [Google Scholar] [CrossRef]
- Maxwell, J.C. A Treatise on Electricity and Magnetism; Clarendon Press: Oxford, UK, 1873; p. 1. [Google Scholar]


| Sample | Neat EVOH | EVOH/G150 | EVOH/G5 | EVOH/CT1 | EVOH/CT2 |
|---|---|---|---|---|---|
| T5% (°C) | 344 | 344 | 349 | 346 | 346 |
| Tmax (°C) | 407 | 402 | 402 | 414 | 411 |
| Sample | Neat EVOH | EVOH/G150 | EVOH/G5 | EVOH/CT1 | EVOH/CT2 |
|---|---|---|---|---|---|
| Tg (°C) | 60 | 62 | 61 | 62 | 62 |
| Tm (°C) | 178 | 182 | 182 | 183 | 183 |
| Tc (°C) | 156 | 159 | 159 | 159 | 159 |
| Xc (%) | 39 | 43 | 45 | 49 | 50 |
| Sample | E (MPa) | σe (MPa) | εe (mm·mm−1) | σr (MPa) | εr (mm·mm−1) |
|---|---|---|---|---|---|
| Neat EVOH | 1070 ± 110 | 69 ± 7 | 0.14 ± 0.01 | 49 ± 5 | 3.77 ± 0.4 |
| EVOH/G150 | 1200 ± 120 | 72 ± 7 | 0.12 ± 0.01 | 56 ± 6 | 0.82 ± 0.08 |
| EVOH/G5 | 1200 ± 120 | 68 ± 7 | 0.11 ± 0.01 | 53 ± 5 | 0.25 ± 0.03 |
| EVOH/CT1 | 1430 ± 140 | 72 ± 7 | 0.08 ± 0.01 | 58 ± 6 | 0.16 ± 0.02 |
| EVOH/CT2 | 1370 ± 140 | 69 ± 7 | 0.07 ± 0.01 | 55 ± 6 | 0.17 ± 0.02 |
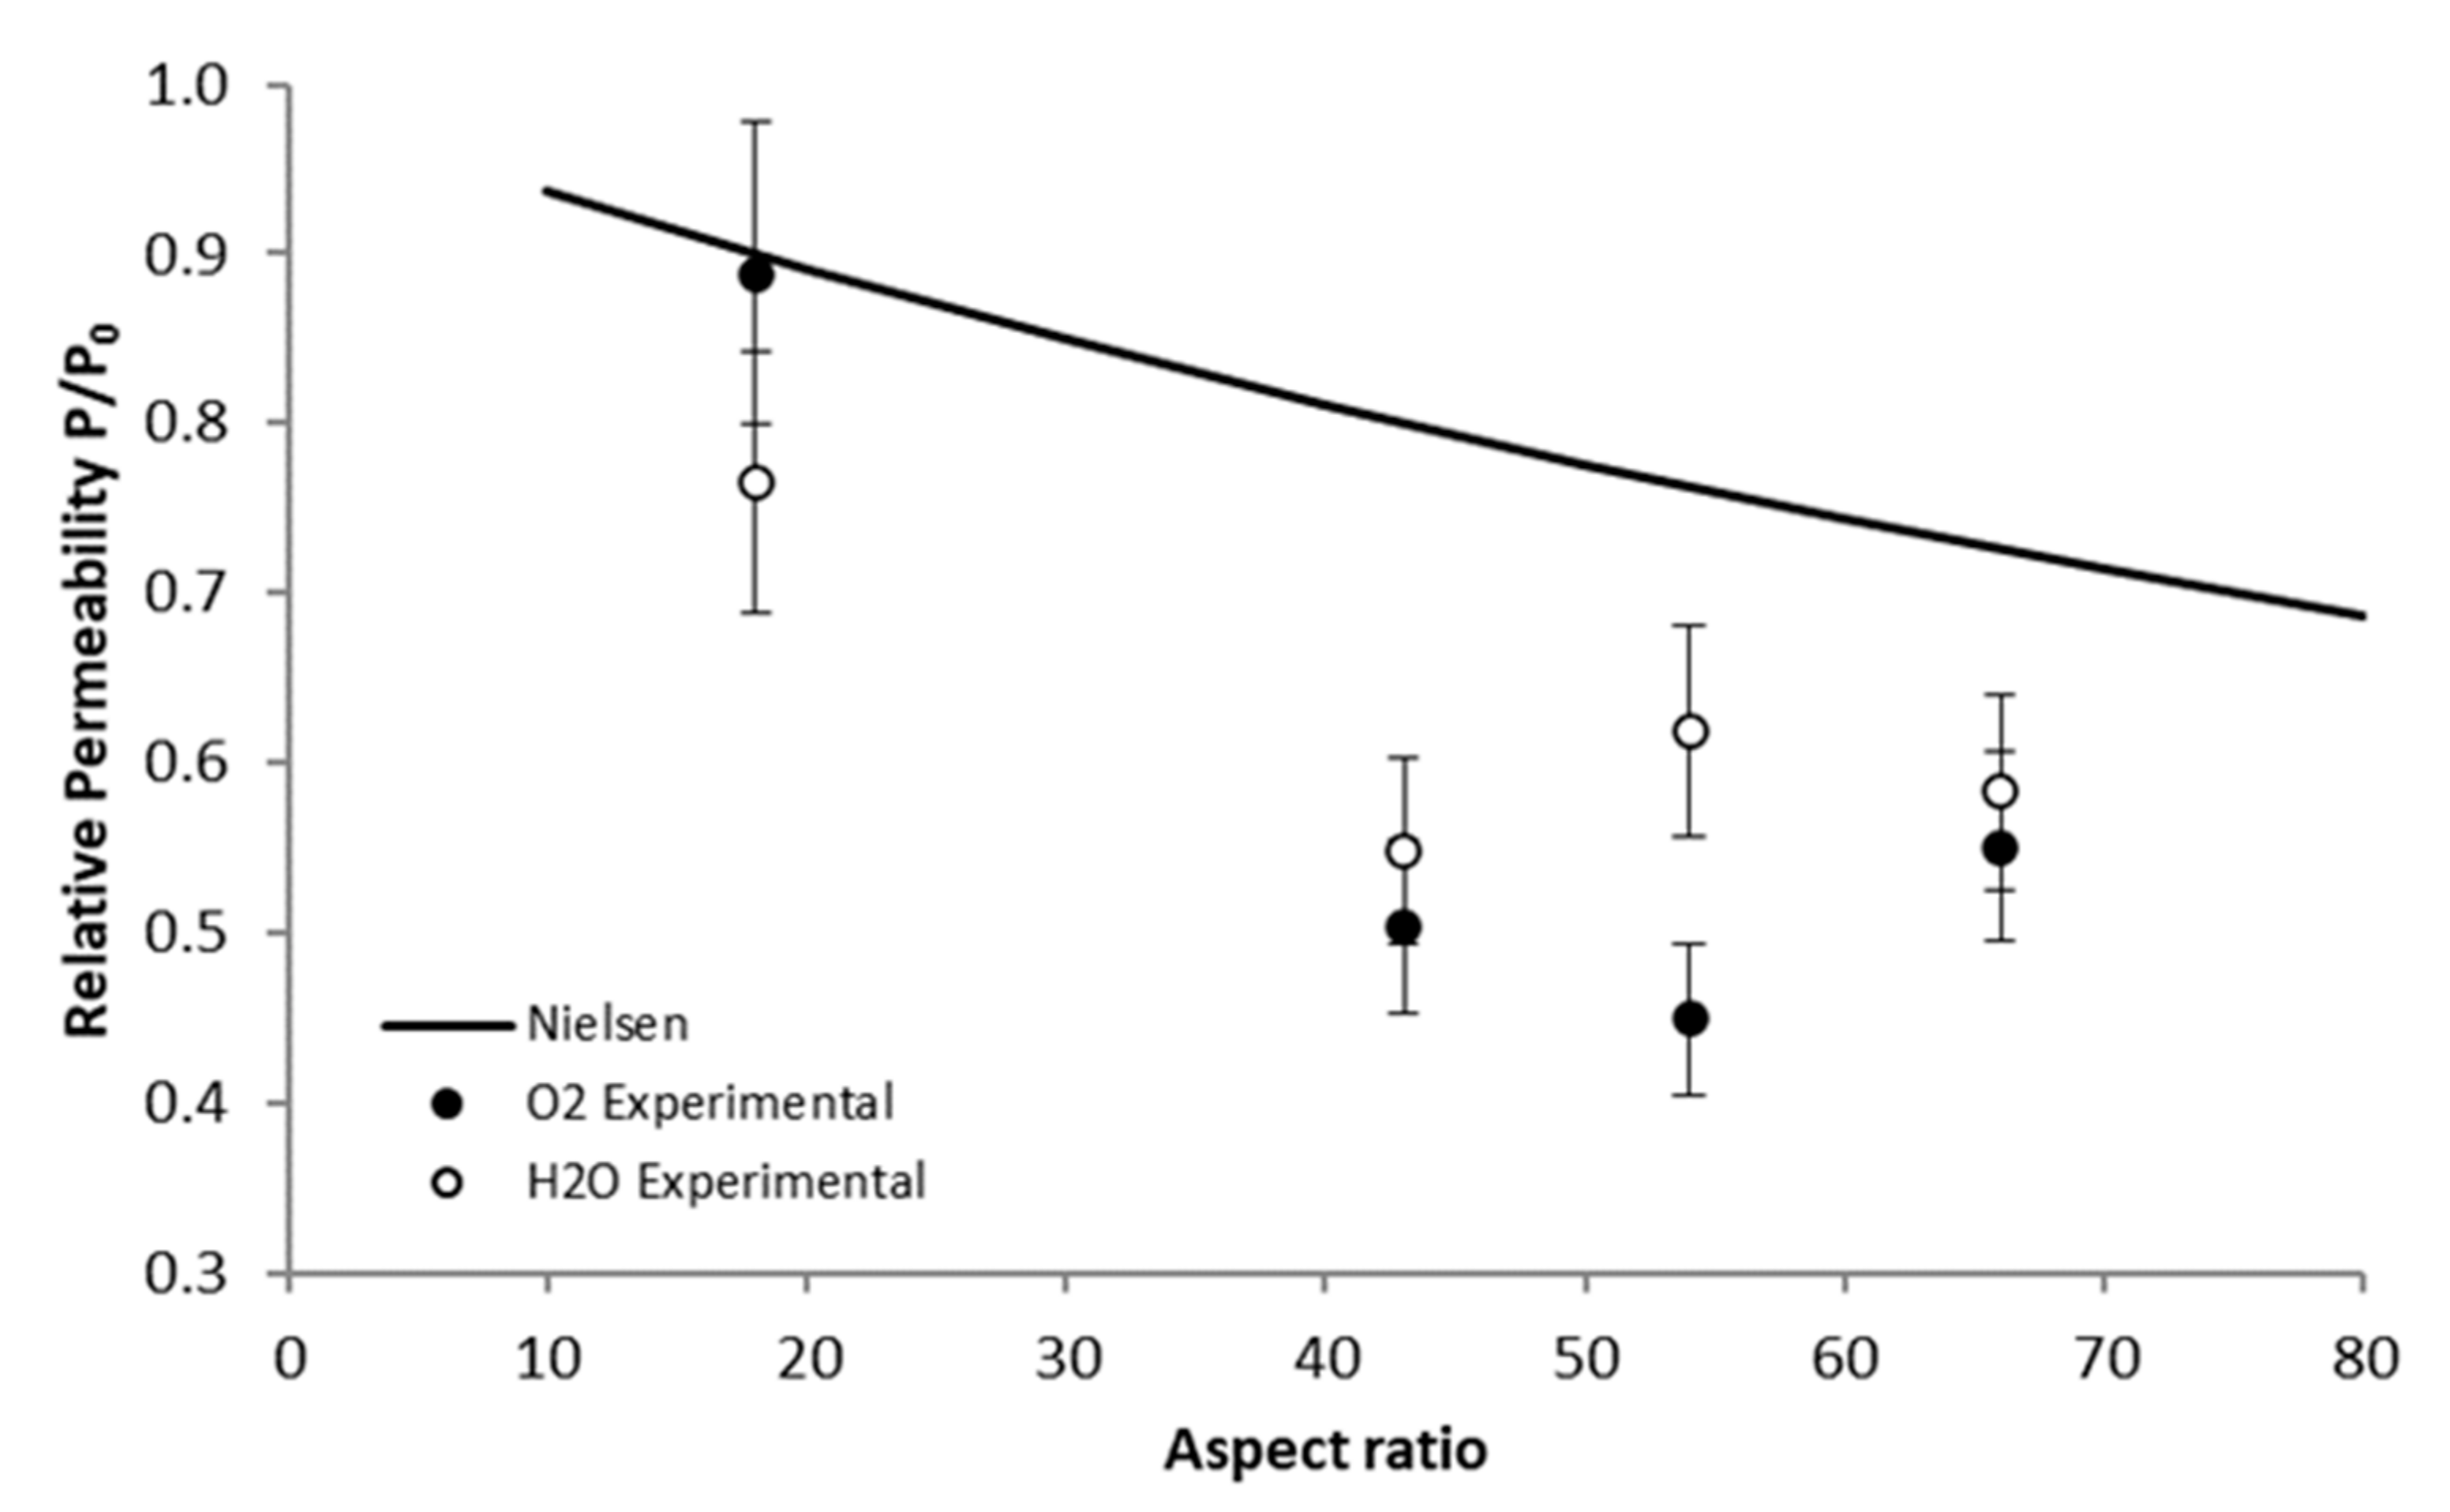
| P/P0 | EVOH/G150 | EVOH/G5 | EVOH/CT1 | EVOH/CT2 |
|---|---|---|---|---|
| Experimental | ||||
| H2O | 0.77 ± 0.08 | 0.55 ± 0.06 | 0.58 ± 0.06 | 0.62 ± 0.06 |
| O2 | 0.89 ± 0.09 | 0.50 ± 0.05 | 0.55 ± 0.06 | 0.45 ± 0.05 |
| Models | ||||
| Nielsen (Equation (4)) | 0.90 ± 0.09 | 0.80 ± 0.08 | 0.73 ± 0.07 | 0.76 ± 0.08 |
| Maxwell (Equation (5)) | 0.92 ± 0.09 | 0.90 ± 0.09 | 0.80 ± 0.08 | 0.78 ± 0.08 |
| Nielsen + Maxwell (Equation (7)) | 0.83 ± 0.08 | 0.69 ± 0.07 | 0.58 ± 0.06 | 0.60 ± 0.06 |
Publisher’s Note: MDPI stays neutral with regard to jurisdictional claims in published maps and institutional affiliations. |
© 2021 by the authors. Licensee MDPI, Basel, Switzerland. This article is an open access article distributed under the terms and conditions of the Creative Commons Attribution (CC BY) license (https://creativecommons.org/licenses/by/4.0/).
Share and Cite
Blanchard, A.; Gouanvé, F.; Espuche, E. Influence of the Graphene Filler Nature on the Morphology and Properties of Melt Blended EVOH Based Nanocomposites. Polymers 2021, 13, 3546. https://doi.org/10.3390/polym13203546
Blanchard A, Gouanvé F, Espuche E. Influence of the Graphene Filler Nature on the Morphology and Properties of Melt Blended EVOH Based Nanocomposites. Polymers. 2021; 13(20):3546. https://doi.org/10.3390/polym13203546
Chicago/Turabian StyleBlanchard, Anthony, Fabrice Gouanvé, and Eliane Espuche. 2021. "Influence of the Graphene Filler Nature on the Morphology and Properties of Melt Blended EVOH Based Nanocomposites" Polymers 13, no. 20: 3546. https://doi.org/10.3390/polym13203546