
Mechanical Behaviour of Completely Decomposed Granite Soil with Tire Rubber Granules and Fibres

Abstract
:
1. Introduction
2. Materials and Methods
3. Engineering Properties of CDG Sand and Its Mixtures with Rubber Particles
3.1. Compaction Behaviour
3.2. Permeability
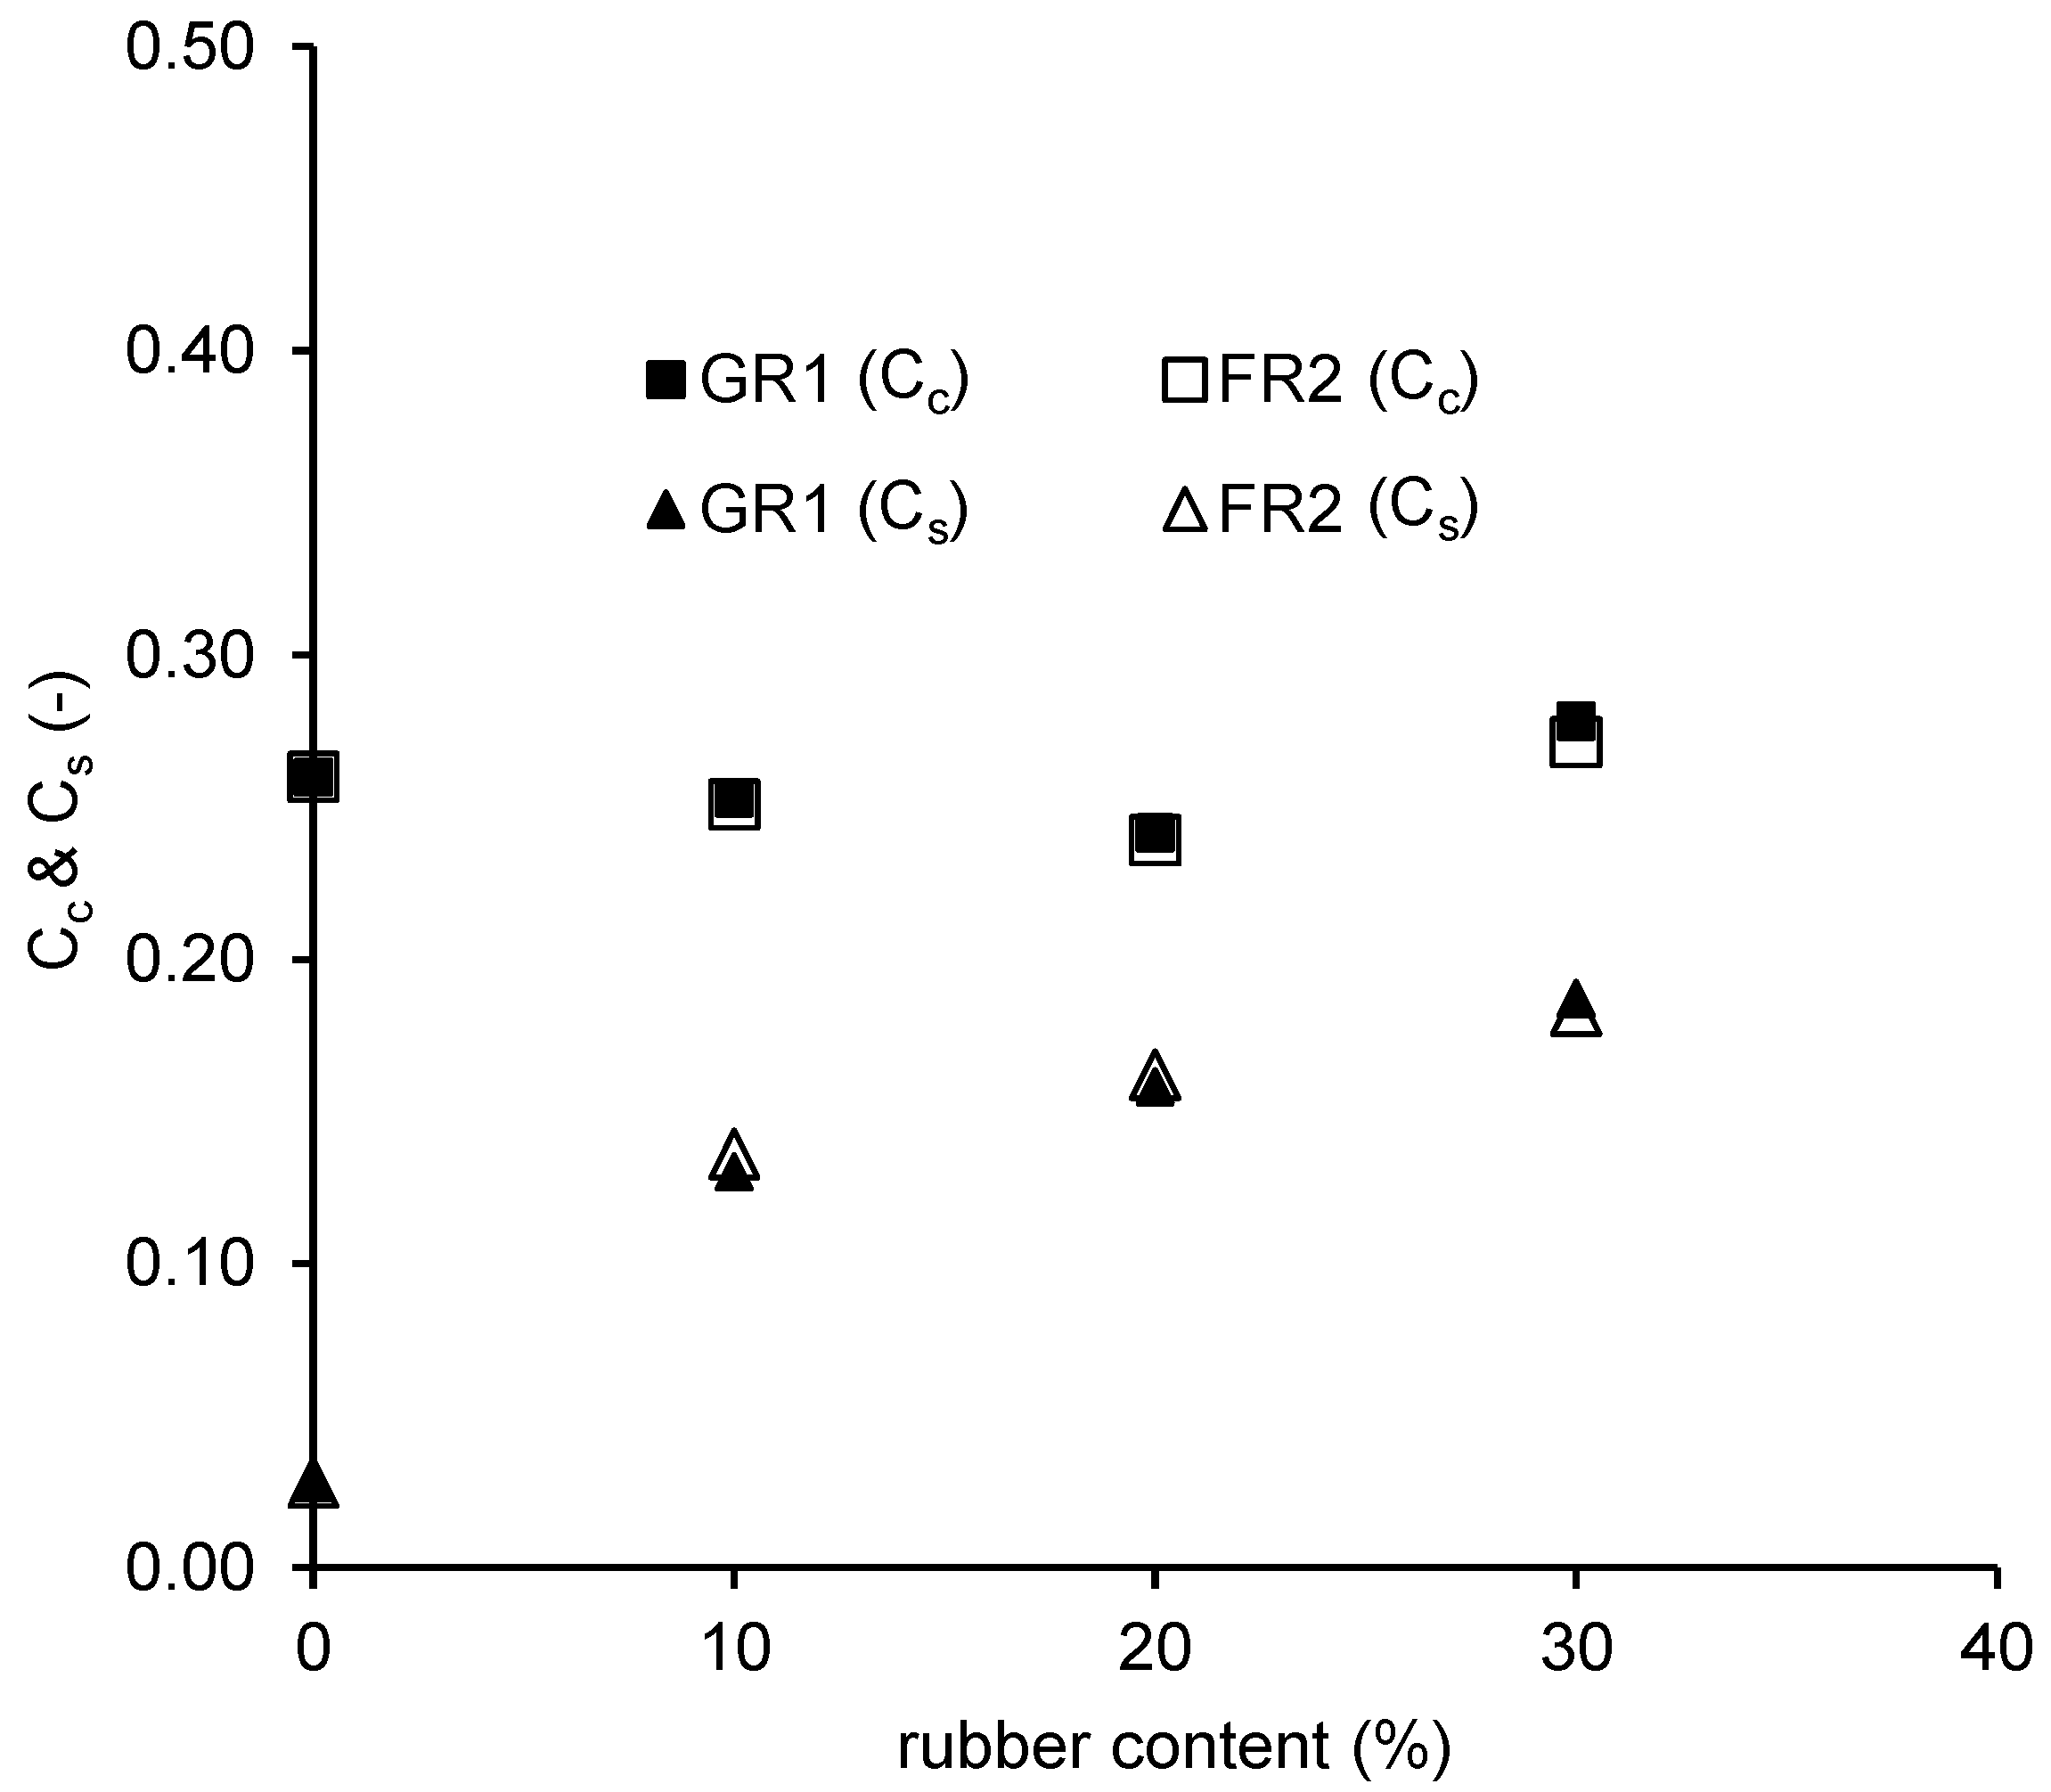
3.3. Compression Behaviour
4. Shear Behaviour of CDG Mixed with Rubber Particles
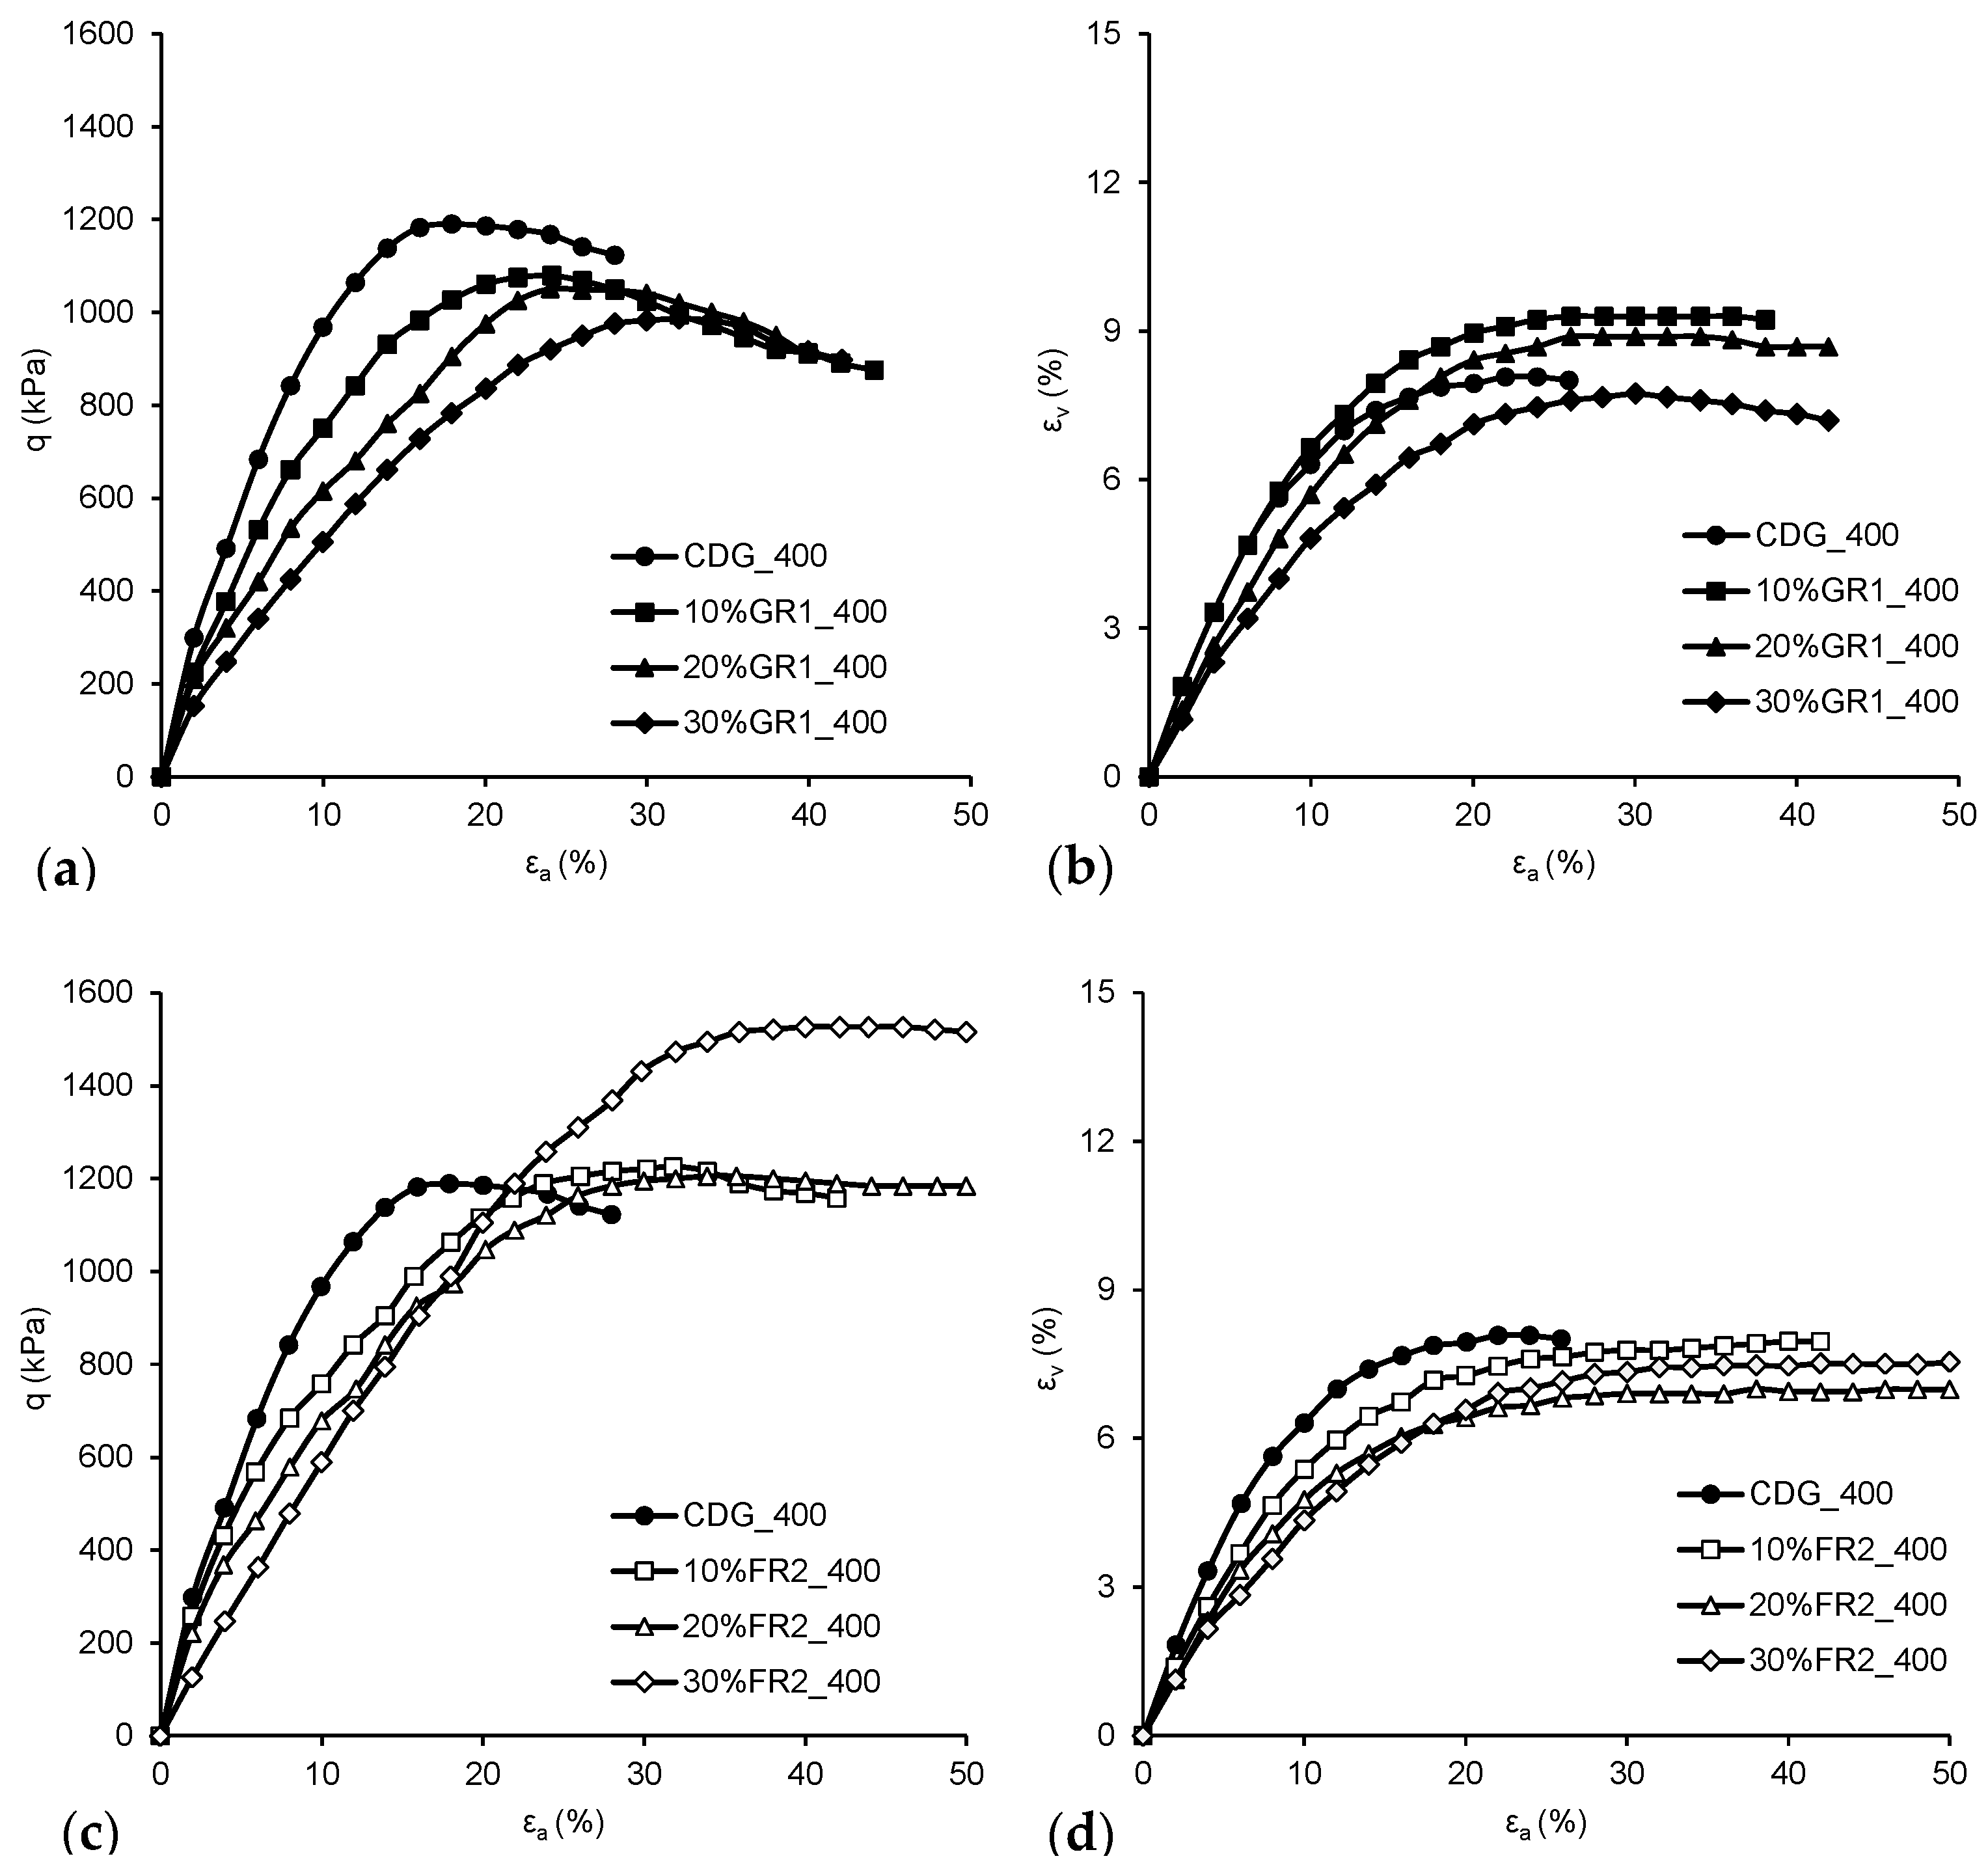
4.1. Stress–Strain Behaviour
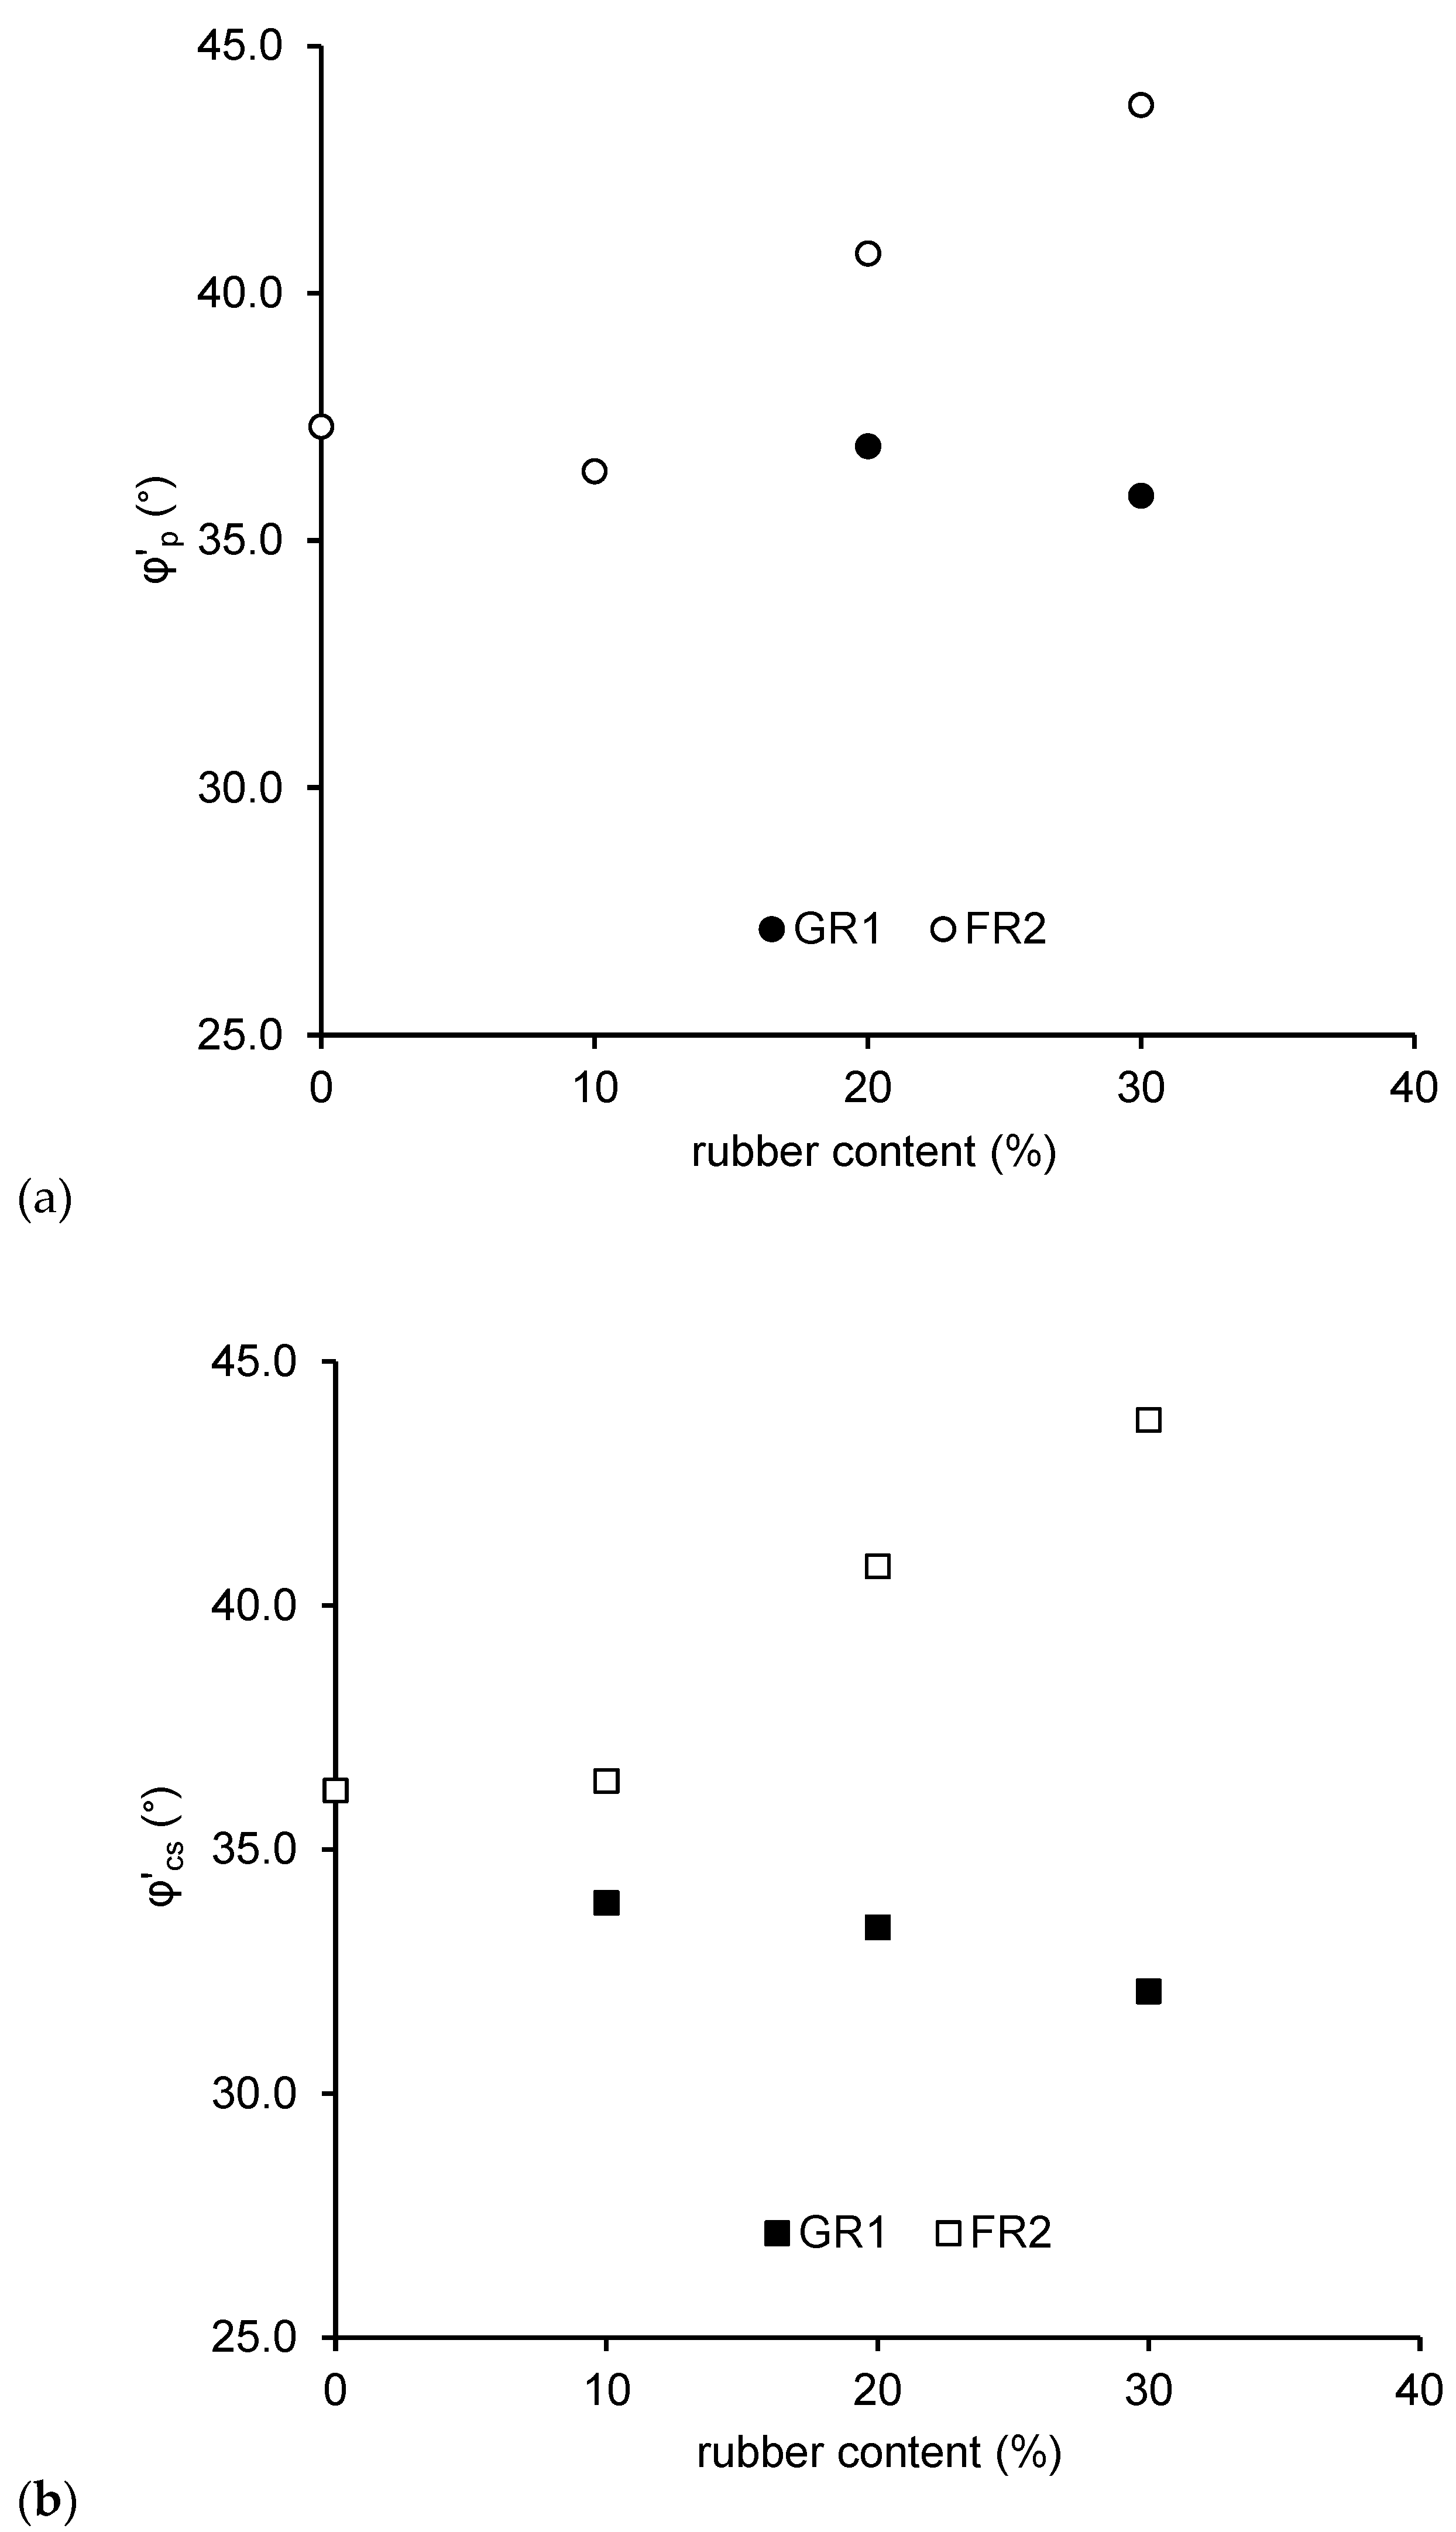
4.2. Shear Strength at the Peak and Critical States
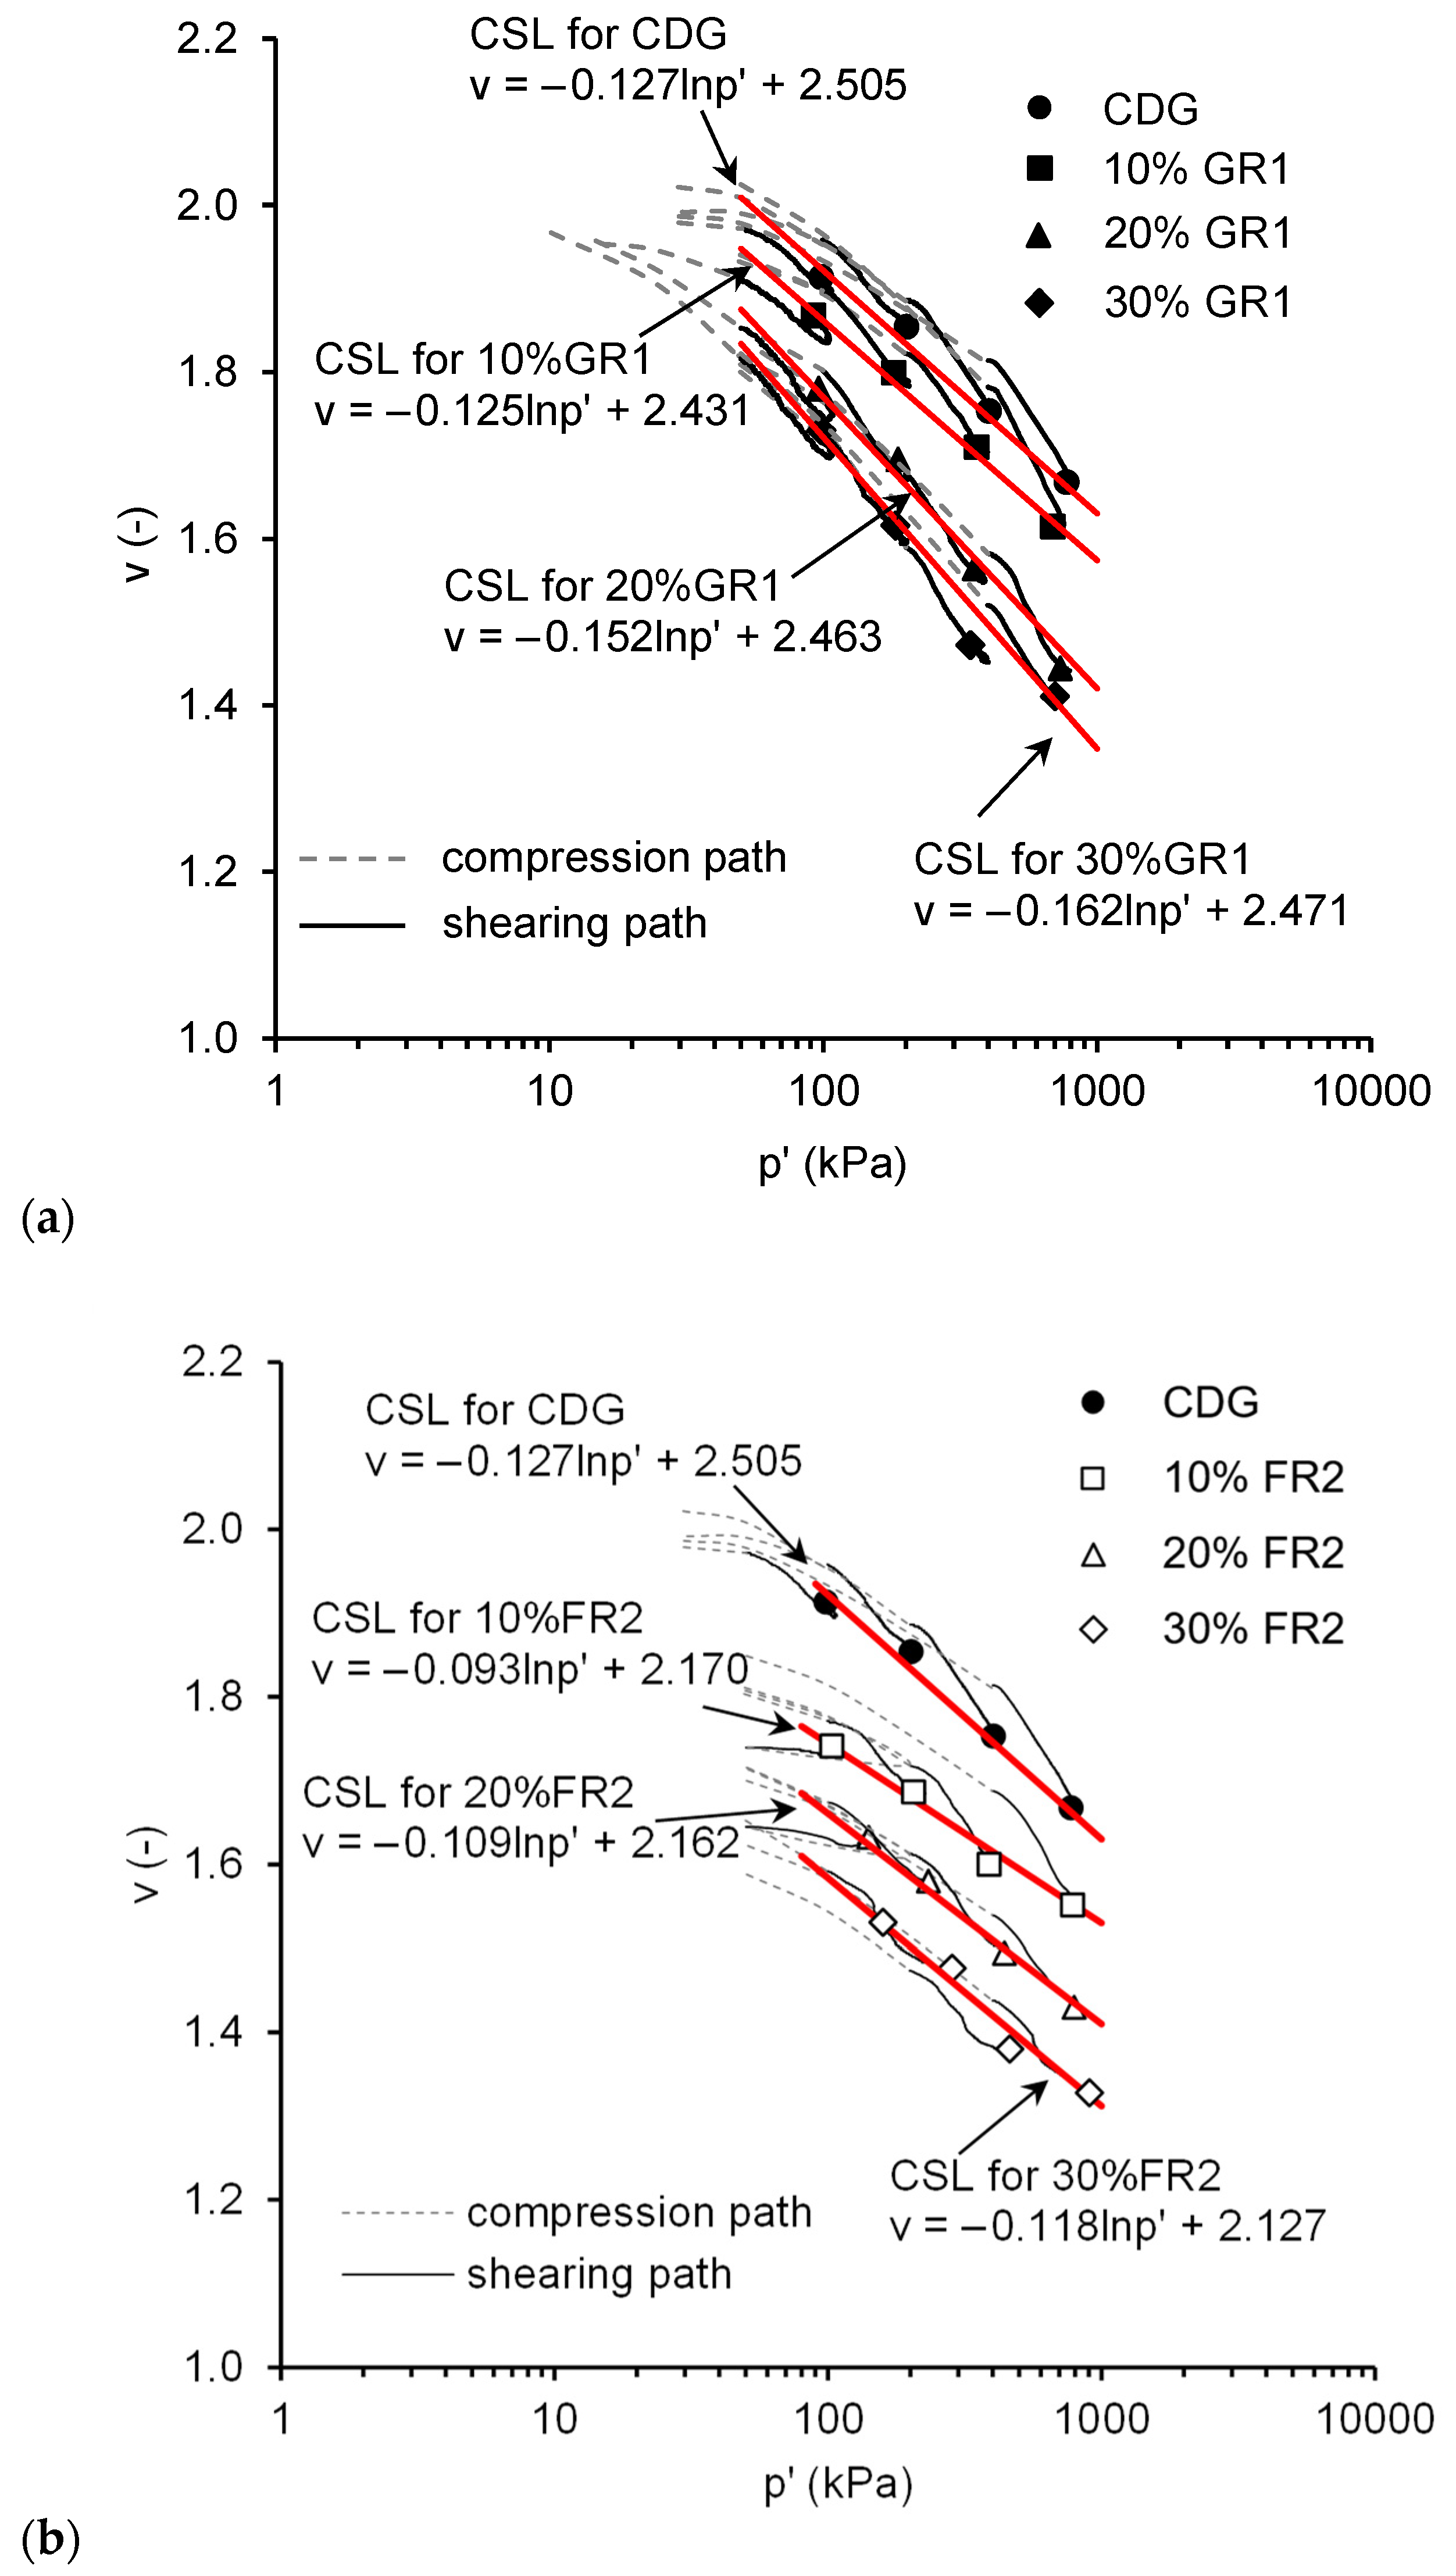
4.3. Critical State Lines in V-Lnp’ Space
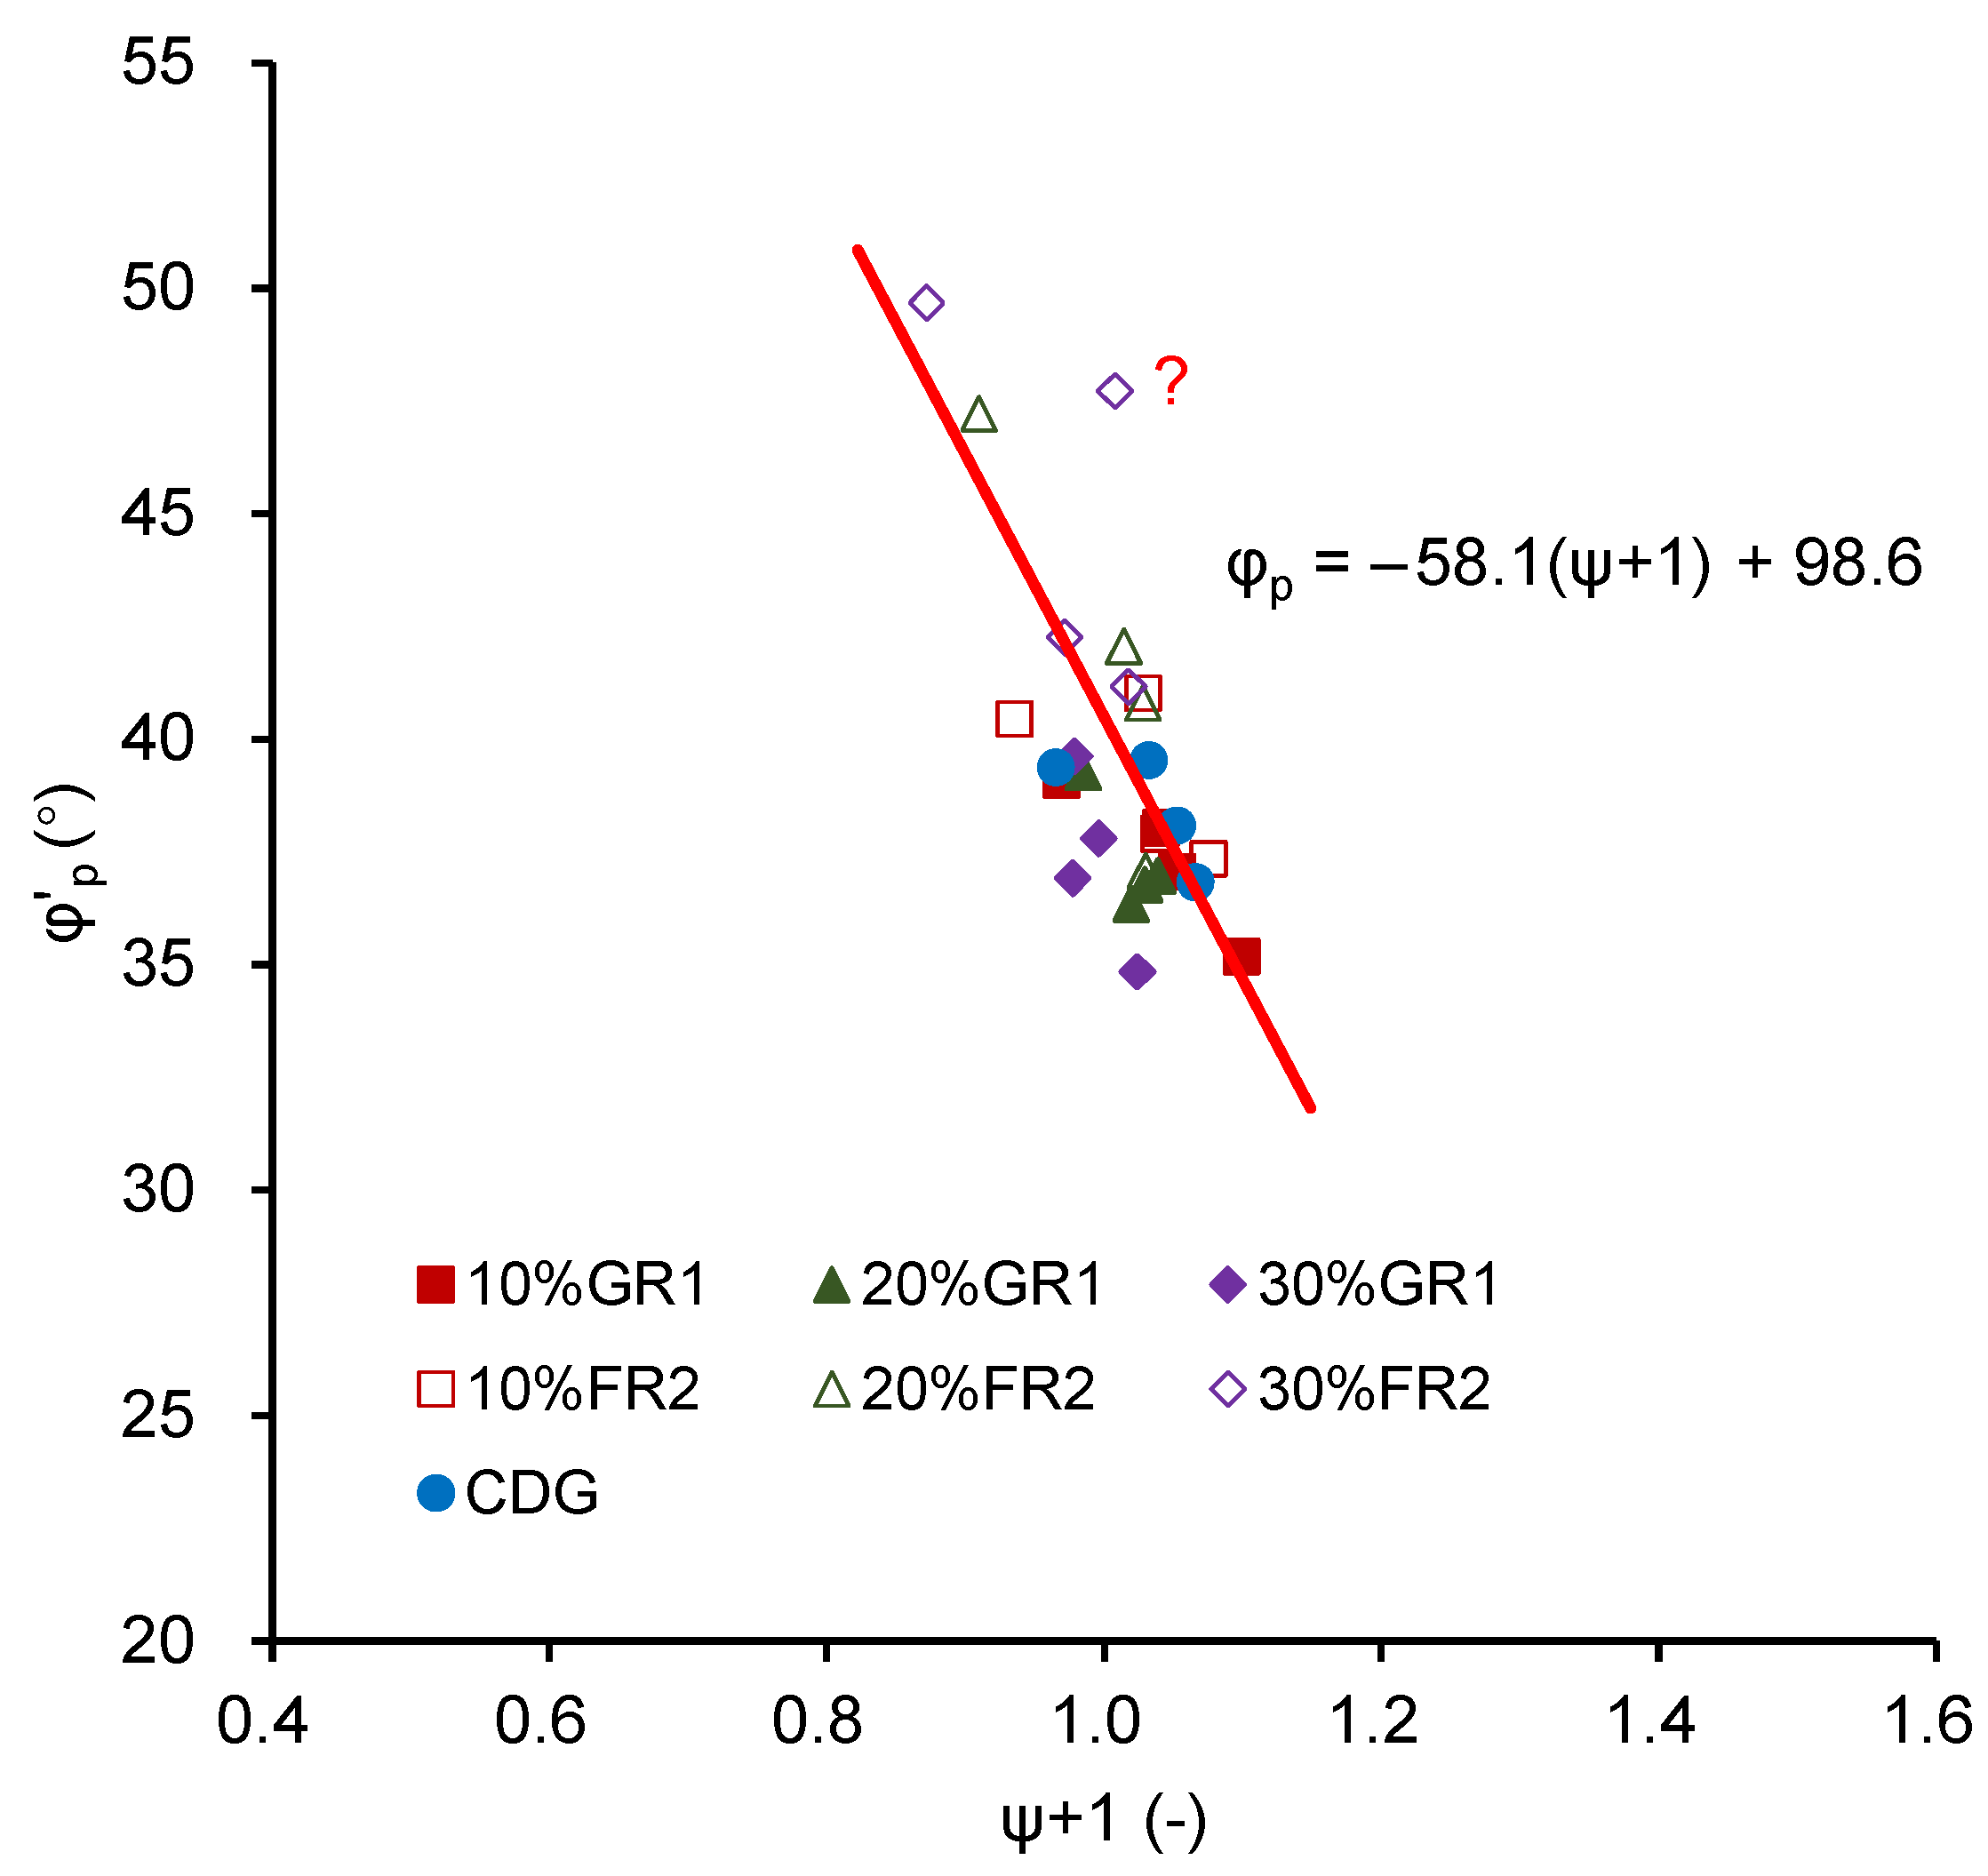
4.4. Peak Strength with Respect to the State Parameter
5. Summary and Conclusions
- (1)
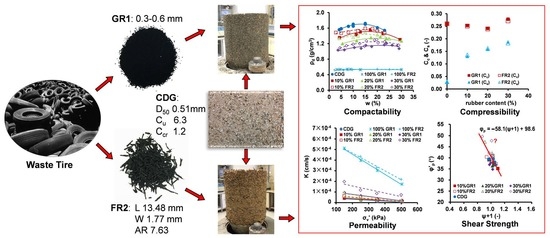
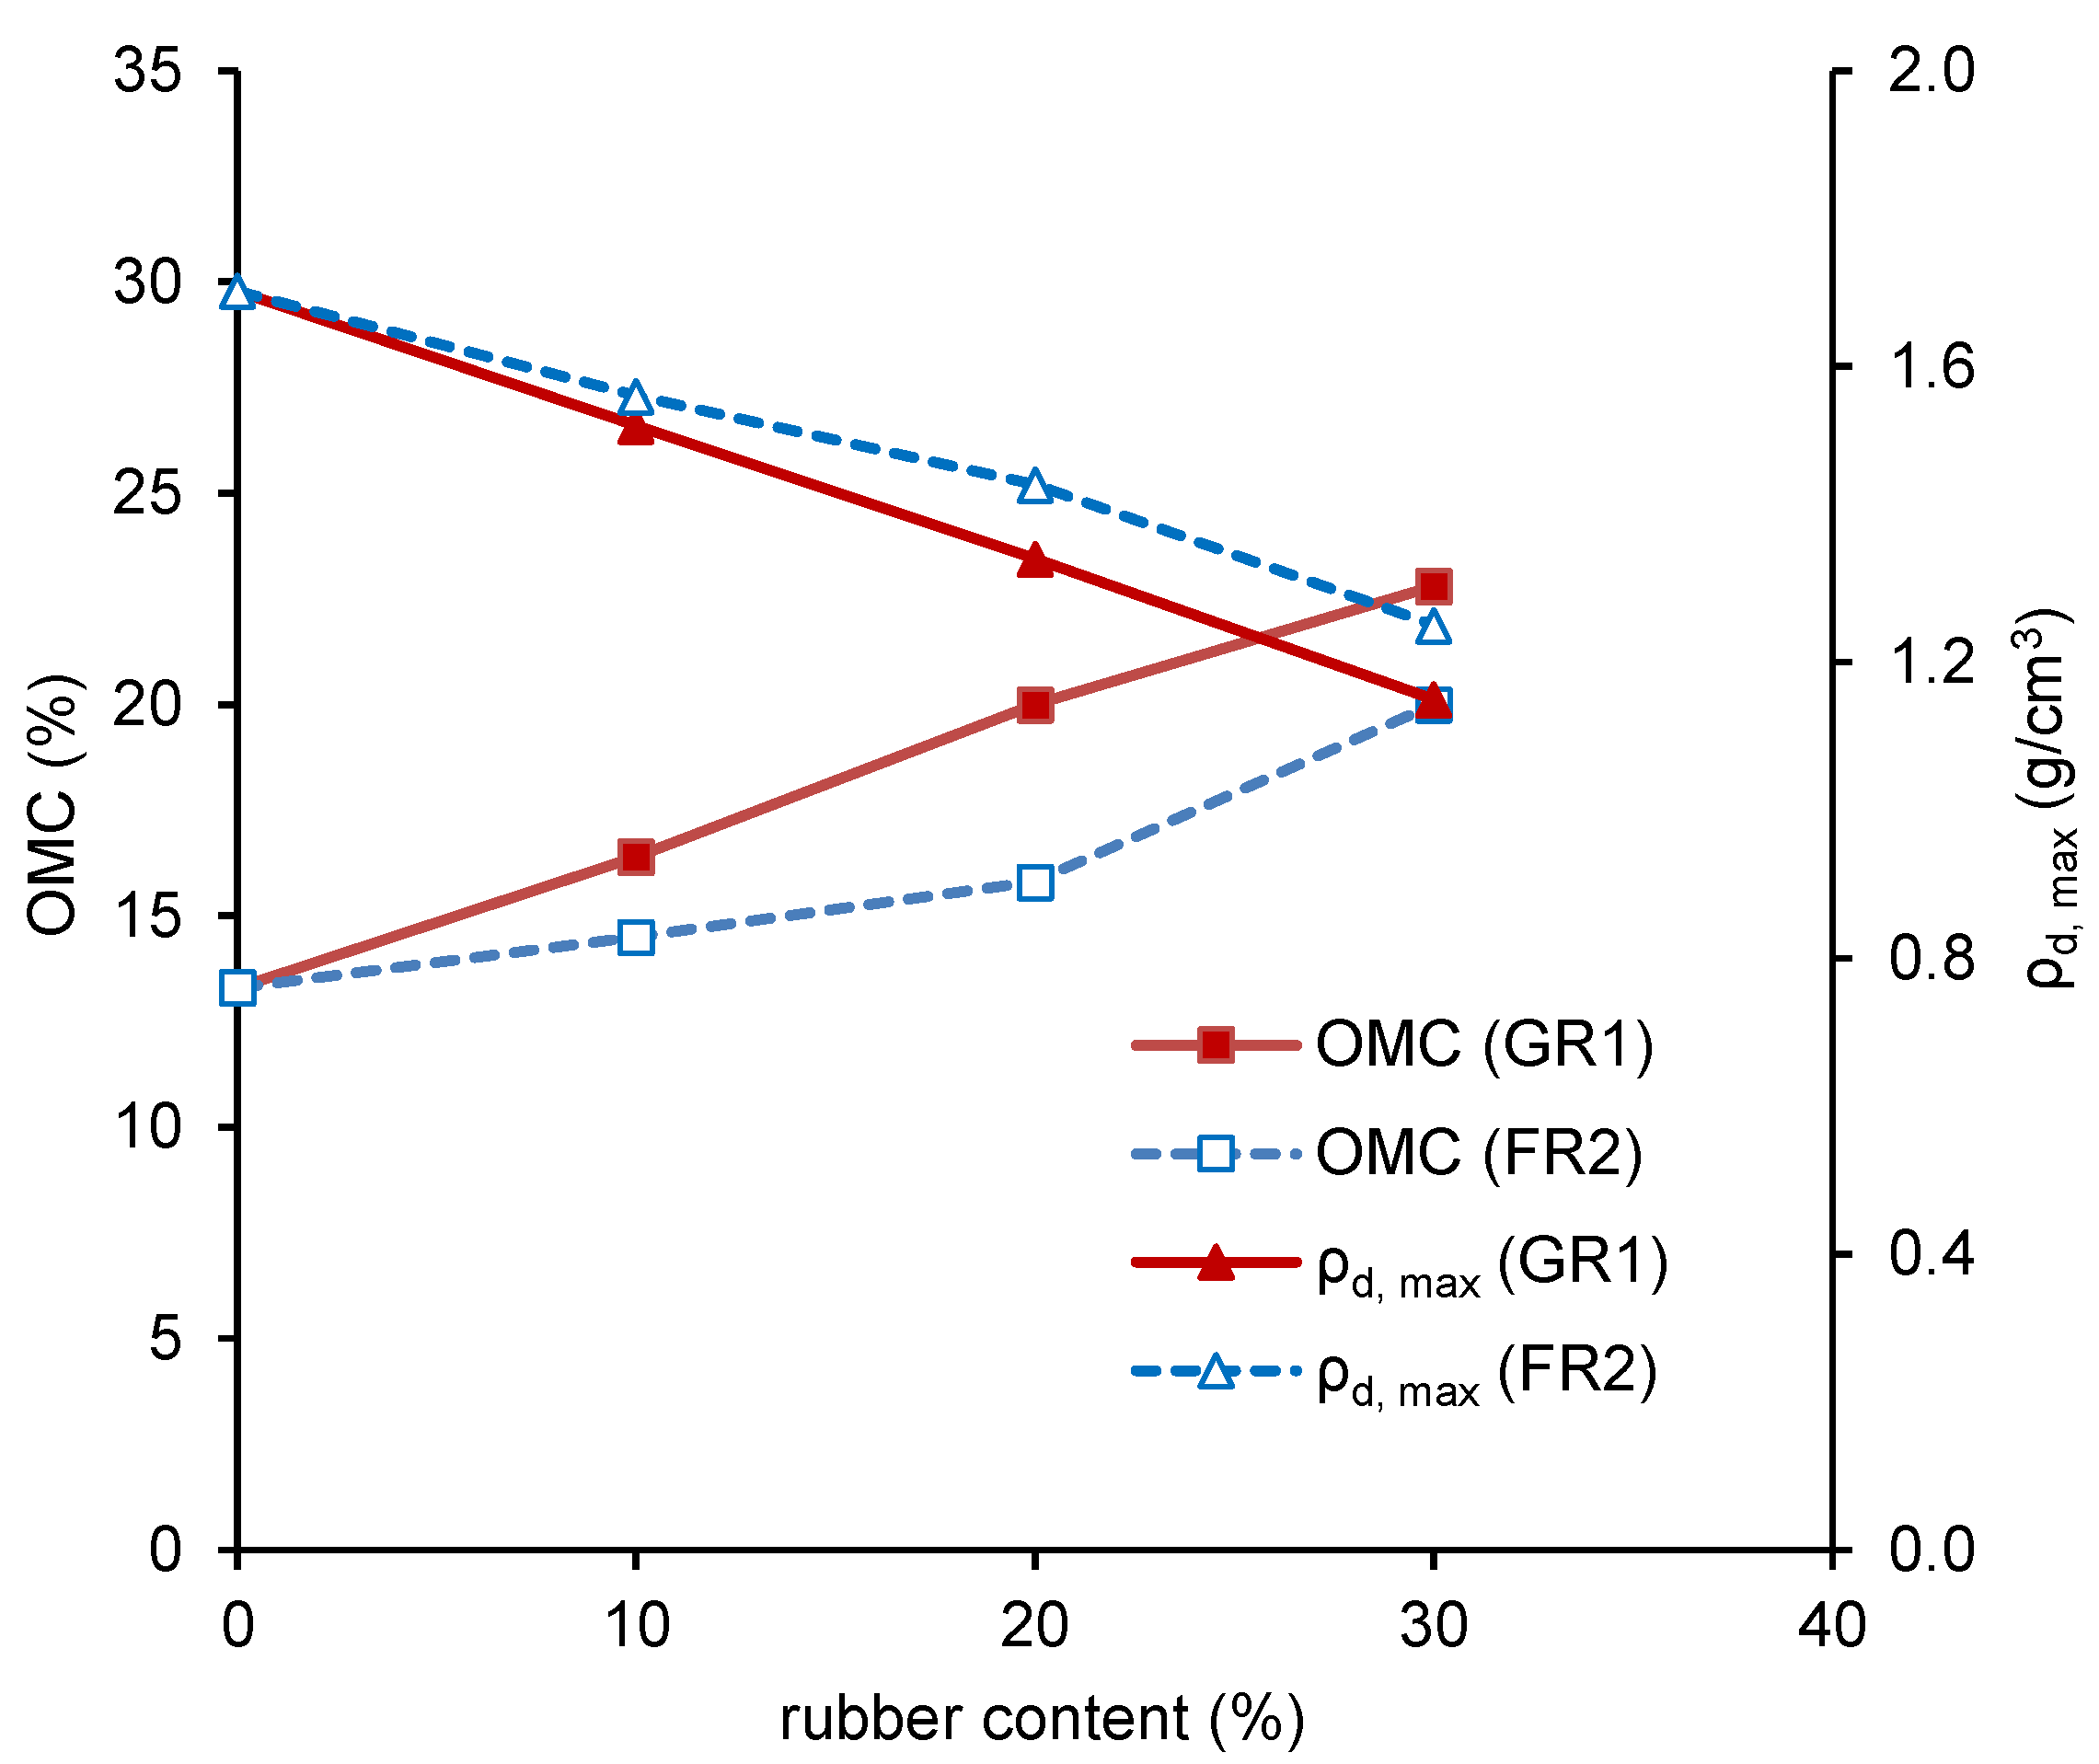
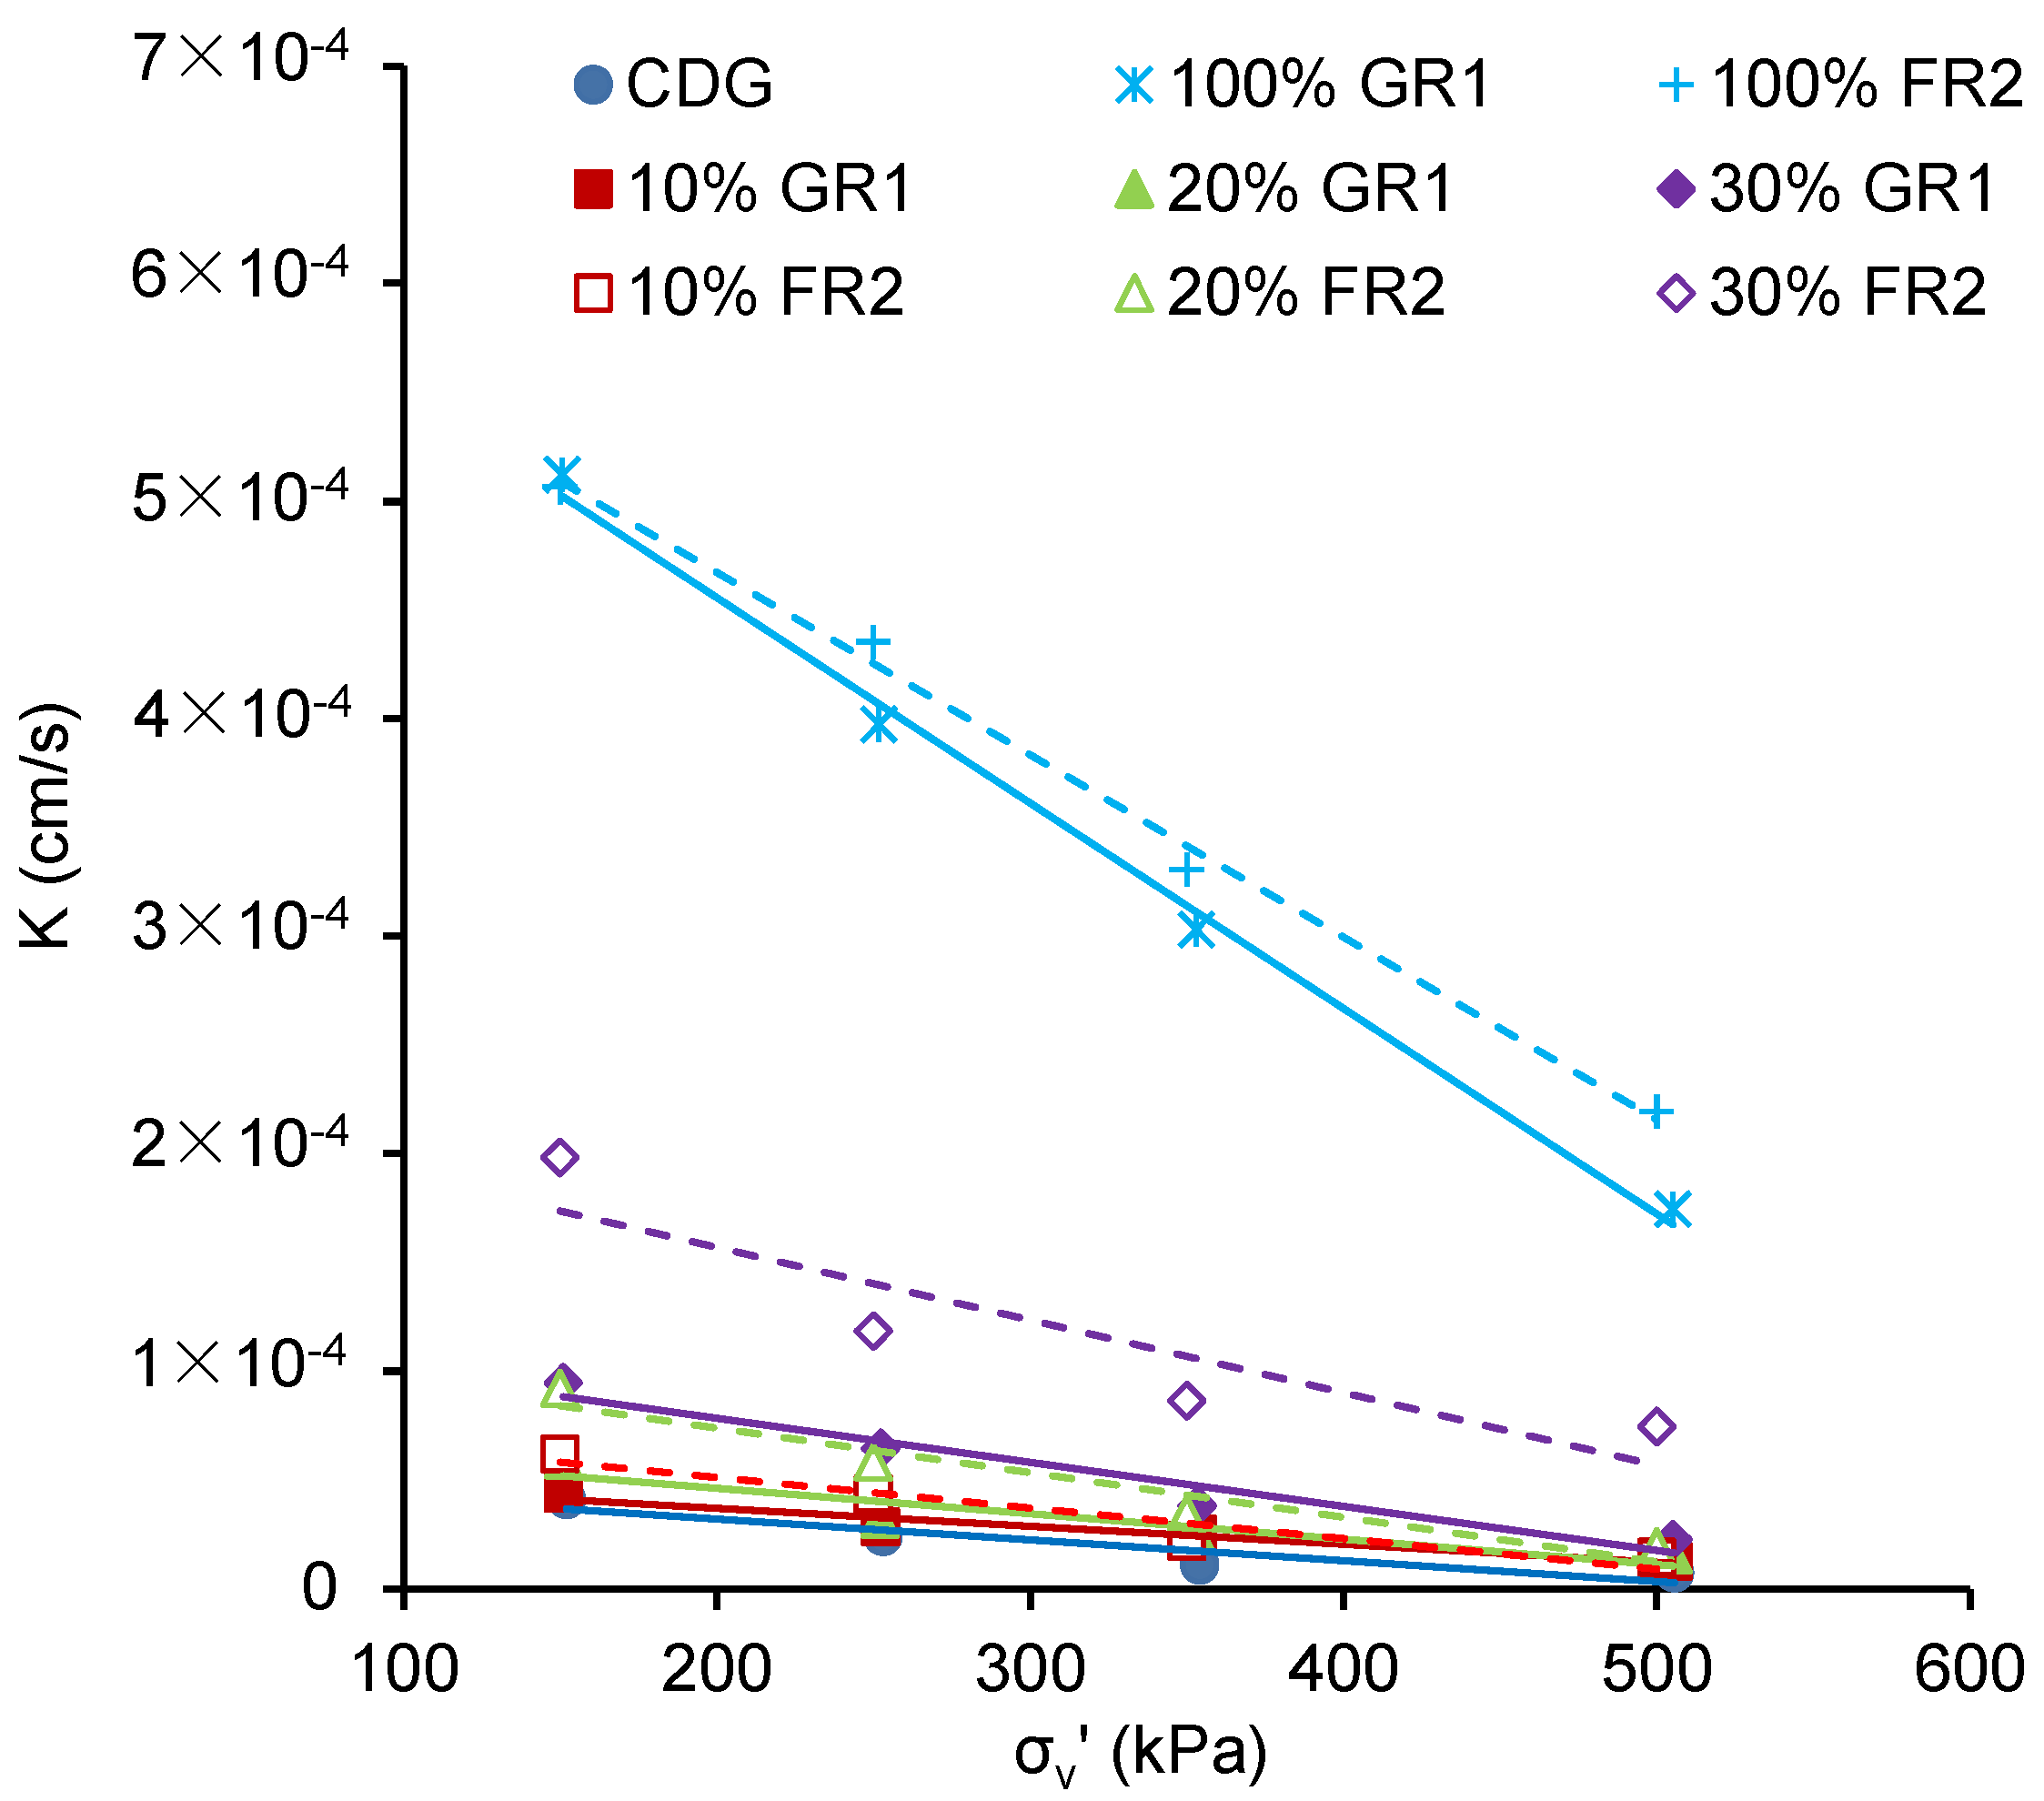
- In Proctor tests, the dry densities of pure rubber particles (both GR1 and FR2) remained constant, ranging from 0.51 g/cm3 to 0.54 g/cm3, which seems to be independent of water content. For the CDG–rubber mixture, with an increasing rubber content, the compaction curves became more rubber-like with less obvious OMC. The pure rubber particles show about 10 times higher permeability (5 × 10⁻⁴ cm/s) than that of pure CDG (4 × 10⁻⁵ cm/s) at the 150 kPa stress level. The influence on permeability becomes clearer only when the rubber content is greater than 30%. With the increasing rubber content, the mixture becomes much more sensitive to the applied pressure.
- (2)
- The inclusion of rubber shifts the compression curve downwards with the increasing rubber content. The Cc values of mixtures with 10–30% rubber content are found to be similar, except a slightly higher compression index at 30% rubber content. The effect of rubber inclusion in unloading stages is more obvious when the strains become much more recoverable with the increasing rubber content. The effects of rubber shape are found to be minimal in both compression and unloading stages.
- (3)
- For CDG–granulated rubber mixtures, the stiffness is lower than that of the pure CDG, which is more obvious with the increasing rubber content. The peak strength (φ’p) decreases slightly with the increasing rubber content. The strength at the critical state (φ’cs) decreases with the increasing rubber content, which is mainly because the inclusion of rubber leads to less strength mobilised from inter-particle friction. For CDG–rubber fibre mixtures, the stiffness is also lower than that of the pure CDG, indicating that the tensile strength of the fibre-type rubber particles is not mobilised at such low strain levels. In general, both the strengths at the peak and critical states of CDG–rubber fibre mixtures are higher than that of the pure CDG and they increase with the increasing rubber content, mainly due to the reinforcement effect of those elongated rubber fibre particles.
- (4)
- For CDG–granulated rubber mixtures, the inclusion of rubber does not change the state parameters much, so the change of peak strength of those materials is not significant. For CDG–rubber fibre mixtures, the state parameters are clearly reduced resulting in much higher peak strength. For mixtures with a higher percentage of elongated rubber particles, the reinforcement effect will become dominant rather than the change in particle packing as happened in those of CDG–GR1 mixtures.
- (5)
- All the above findings prove the suitability of adding rubber particles to CDG soil as fill materials for various kinds of geotechnical engineering projects, including lightweight fill materials for embankments, drainage layers for roads, landfills and other applications, and reinforced fill materials for retaining walls, which could not only reduce tire waste but also enhance the mechanical behaviour of CDG soil.
Author Contributions
Funding
Institutional Review Board Statement
Informed Consent Statement
Data Availability Statement
Conflicts of Interest
List of Abbreviations
| Cc | compression index |
| Ccr | coefficient of curvature |
| CDG | completely decomposed granite |
| Cs | swelling index |
| Cu | coefficient of uniformity |
| D50 | mean particle size |
| FR | rubber fibre |
| GR | rubber granules |
| Gs | specific gravity of soil grains |
| OMC | optimum moisture content |
| p’ | mean effective stress |
| q | deviatoric stress |
| v | specific volume |
| λ | slope of normal consolidation line |
| ρd | dry density |
| ρd,max | maximum dry density |
| φ’cs | friction angle at the critical state |
| φ’p | friction angle at the peak |
| ψ | state parameter |
| Г | specific volume of soil at critical state with p’ = 1.0 kN/m2 |
References
- WBCSD—World Business Council for Sustainable Development. Global ELT management—A Global State of Knowledge on Regulation, Management Systems, Impacts of Recovery and Technologies. 2019. Available online: https://docs.wbcsd.org/2019/12/Global_ELT_Management%E2%80%93A_global_state_of_knowledge_on_regulation_management_systems_impacts_of_recovery_and_technologies.pdf (accessed on 10 June 2020).
- Sienkiewicz, M.; Kucinska-Lipka, J.; Janik, H.; Balas, A. Progress in used tyres management in the European Union: A review. Waste Manag. 2012, 32, 1742–1751. [Google Scholar] [CrossRef]
- Edinçliler, A.; Baykal, G.; Saygılı, A. Influence of different processing techniques on the mechanical properties of used tires in embankment construction. Waste Manag. 2010, 30, 1073–1080. [Google Scholar] [CrossRef] [PubMed]
- Soleimanbeigi, A.; Edil, T.B. Compressibility of recycled materials for use as highway embankment fill. J. Geotech. Geoenvironmental Eng. 2015, 141, 04015011. [Google Scholar] [CrossRef]
- Ahn, I.-S.; Cheng, L. Tire derived aggregate for retaining wall backfill under earthquake loading. Constr. Build. Mater. 2014, 57, 105–116. [Google Scholar] [CrossRef]
- Reddy, S.B.; Krishna, A.M. Recycled tire chips mixed with sand as lightweight backfill material in retaining wall applications: An experimental investigation. Int. J. Geosynth. Ground. Eng. 2015, 1, 1–11. [Google Scholar] [CrossRef] [Green Version]
- Narejo, D.; Shettima, M. Use of recycled automobile tires to design landfill components. Geosynth. Int. 1995, 2, 619–625. [Google Scholar] [CrossRef]
- Hudson, A.P.; Beaven, R.P.; Powrie, W.; Parkes, D. Hydraulic conductivity of tyres in landfill drainage systems. Proc. Inst. Civ. Eng. Waste Resour. Manag. 2017, 160, 63–70. [Google Scholar] [CrossRef]
- Reddy, K.; Stark, T.D.; Marella, A. Clogging potential of tire-shred drainage layer in landfill cover systems. Int. J. Geotech. Eng. 2008, 2, 407–418. [Google Scholar] [CrossRef]
- Taylor, A.W.; Igusa, T. Primer on Seismic Isolation; ASCE Publications: Reston, VI, USA, 2004. [Google Scholar]
- Tsang, H.-H. Seismic isolation by rubber–soil mixtures for developing countries. Earthq. Eng. Struct. Dyn. 2008, 37, 283–303. [Google Scholar] [CrossRef]
- Hazarika, H.; Kohama, E.; Sugano, T. Underwater Shake Table Tests on Waterfront Structures Protected with Tire Chips Cushion. J. Geotech. Geoenvironmental Eng. 2008, 134, 1706–1719. [Google Scholar] [CrossRef]
- Pitilakis, K.; Trevlopoulos, K.; Anastasiadis, A.; Senetakis, K. Seismic response of structures on improved soil. In Proceedings of the 8th International Conference on Structural Dynamics, Leuven, Belgium, 4–6 July 2011; pp. 72–81. [Google Scholar]
- Tsang, H.H.; Lo, S.H.; Xu, X.; Neaz Sheikh, M. Seismic isolation for low-to-medium-rise buildings using granulated rub-ber-soil mixtures: Numerical study. Earthq. Eng. Struct. Dyn. 2012, 41, 2009–2024. [Google Scholar] [CrossRef]
- Tafreshi, S.M.; Khalaj, O.; Dawson, A. Repeated loading of soil containing granulated rubber and multiple geocell layers. Geotext. Geomembranes 2014, 42, 25–38. [Google Scholar] [CrossRef]
- Humphrey, D.N.; Swett, M. Literature Review of the Water Quality Effects of Tire Derived Aggregate and Rubber Modified Asphalt Pavement; US EPA: Orono, ME, USA, 2006. [Google Scholar]
- Ahmed, I. Laboratory Study on Properties of Rubber-Soils. Joint Highway Research Project, Report No. FHWA/IN/JHRP-93/4; Indiana Dept. of Transportation-Dept. of Civil Engineering, Purdue University: West Lafayette, IN, USA, 1993. [Google Scholar]
- Humphrey, D.; Sandford, T. Tire chips as lightweight subgrade fill and retaining wall backfill. In Proceedings of the Symposium on Recovery and Effective Reuse of Discarded Materials and By-Products for Construction of Highway Facilities, Denver, CO, USA, 19–22 October 1993; pp. 19–22. [Google Scholar]
- Pincus, H.; Edil, T.; Bosscher, P. Engineering Properties of Tire Chips and Soil Mixtures. Geotech. Test. J. 1994, 17, 453–464. [Google Scholar] [CrossRef]
- Chaney, R.; Demars, K.; Masad, E.; Taha, R.; Ho, C.; Papagiannakis, T. Engineering Properties of Tire/Soil Mixtures as a Lightweight Fill Material. Geotech. Test. J. 1996, 19, 297–304. [Google Scholar] [CrossRef]
- Reddy, K.R.; Saichek, R.E. Characterization and performance assessment of shredded scrap tires as leachate drainage material in landfills. In Proceedings of the 14th International Conference on Solid Waste Technology and Management, Philadelphia, PA, USA, 1–4 November 1998; pp. 407–416. [Google Scholar]
- Lee, J.S.; Dodds, J.; Santamarina, J.C. Behavior of rigid–soft particle mixtures. J. Mater. Civ. Eng. 2007, 19, 179–184. [Google Scholar] [CrossRef] [Green Version]
- Kim, H.-K.; Santamarina, J.C. Sand–rubber mixtures (large rubber chips). Can. Geotech. J. 2008, 45, 1457–1466. [Google Scholar] [CrossRef] [Green Version]
- Lee, C.; Shin, H.; Lee, J. Behaviour of sand-rubber particle mixture: Experimental observations and numerical simulations. Int. J. Numer. Anal. Methods Geomech. 2014, 38, 1651–1663. [Google Scholar] [CrossRef]
- Fu, R.; Coop, M.R.; Li, X.Q. The mechanics of a compressive sand mixed with tyre rubber. Geotech. Lett. 2014, 4, 238–243. [Google Scholar] [CrossRef]
- Fu, R.; Coop, M.R.; Li, X.Q. Influence of Particle Type on the Mechanics of Sand–Rubber Mixtures. J. Geotech. Geoenvironmental Eng. 2017, 143, 04017059. [Google Scholar] [CrossRef] [Green Version]
- Youwai, S.; Bergado, D.T. Strength and deformation characteristics of shredded rubber tire—Sand mixtures. Can. Geotech. J. 2003, 40, 254–264. [Google Scholar] [CrossRef]
- Neaz Sheikh, M.; Tsang, H.H.; Yaghmaei-Sabegh, S.; Anbazhagan, P. Evaluation of damping modification factors for seismic response spectra. In Proceedings of the Australian Earthquake Engineering Society Conference, Hobart, TAS, Australia, 15–17 November 2013; pp. 1–13. [Google Scholar]
- Noorzad, R.; Raveshi, M. Mechanical Behavior of Waste Tire Crumbs–Sand Mixtures Determined by Triaxial Tests. Geotech. Geol. Eng. 2017, 35, 1793–1802. [Google Scholar] [CrossRef]
- Ghazavi, M. Shear strength characteristics of sand-mixed with granular rubber. Geotech. Geol. Eng. 2004, 22, 401–416. [Google Scholar] [CrossRef]
- Attom, M.F. The use of shredded waste tires to improve the geotechnical engineering properties of sands. Environ. Geol. 2006, 49, 497–503. [Google Scholar] [CrossRef]
- Anbazhagan, P.; Manohar, D.R.; Neaz Sheikh, M. Response surface analysis for engineering behavior of sand-tire crumb mixtures. In Proceedings of the 2nd International Conference on Information Technology in Geo-Engineering, Durham, UK, 21–22 July 2014; pp. 260–265. [Google Scholar]
- Anbazhagan, P.; Manohar, D.R.; Rohit, D. Influence of size of granulated rubber and tyre chips on the shear strength characteristics of sand–rubber mix. Géoméch. Geoengin. 2017, 12, 266–278. [Google Scholar] [CrossRef]
- ASTM D854. Standard Test Methods for Specific Gravity of soil Solids by Water Pycnometer. Annual Book of ASTM Standards; American Society for Testing and Materials: West Conshohocken, PA, USA, 2002. [Google Scholar]
- BSI. Methods of Test for Soils for Civil Engineering Purposes. BS1377; British Standards Institution: London, UK, 1990. [Google Scholar]
- Perez, J.L.; Kwok, C.; Senetakis, K. Effect of rubber size on the behaviour of sand-rubber mixtures: A numerical investigation. Comput. Geotech. 2016, 80, 199–214. [Google Scholar] [CrossRef]
- Perez, J.L.; Kwok, C.; Senetakis, K. Micromechanical analyses of the effect of rubber size and content on sand-rubber mixtures at the critical state. Geotext. Geomembranes 2017, 45, 81–97. [Google Scholar] [CrossRef]
- Li, W.; Kwok, C.; Sandeep, C.S.; Senetakis, K. Sand type effect on the behaviour of sand-granulated rubber mixtures: Integrated study from micro- to macro-scales. Powder Technol. 2019, 342, 907–916. [Google Scholar] [CrossRef]
- Been, K.; Jefferies, M.G. A state parameter for sands. Géotechnique 1985, 35, 99–112. [Google Scholar] [CrossRef]


| Material Type | Compaction Type | OMC (%) | ρd,max (g/cm3) |
|---|---|---|---|
| Pure CDG | Standard Proctor test | 13.3 | 1.70 |
| 10% GR1 | 16.4 | 1.52 | |
| 20% GR1 | 20.0 | 1.34 | |
| 30% GR1 | 22.8 | 1.15 | |
| 100% GR1 | - | 0.53 | |
| 10% FR2 | 14.5 | 1.56 | |
| 20% FR2 | 15.8 | 1.44 | |
| 30% FR2 | 20.0 | 1.25 | |
| 100% FR2 | - | 0.53 |
| Test No. | Sand Type | Rubber Type | Rubber Content (%) | Compaction Degree (-) | Vertical Load (kPa) |
|---|---|---|---|---|---|
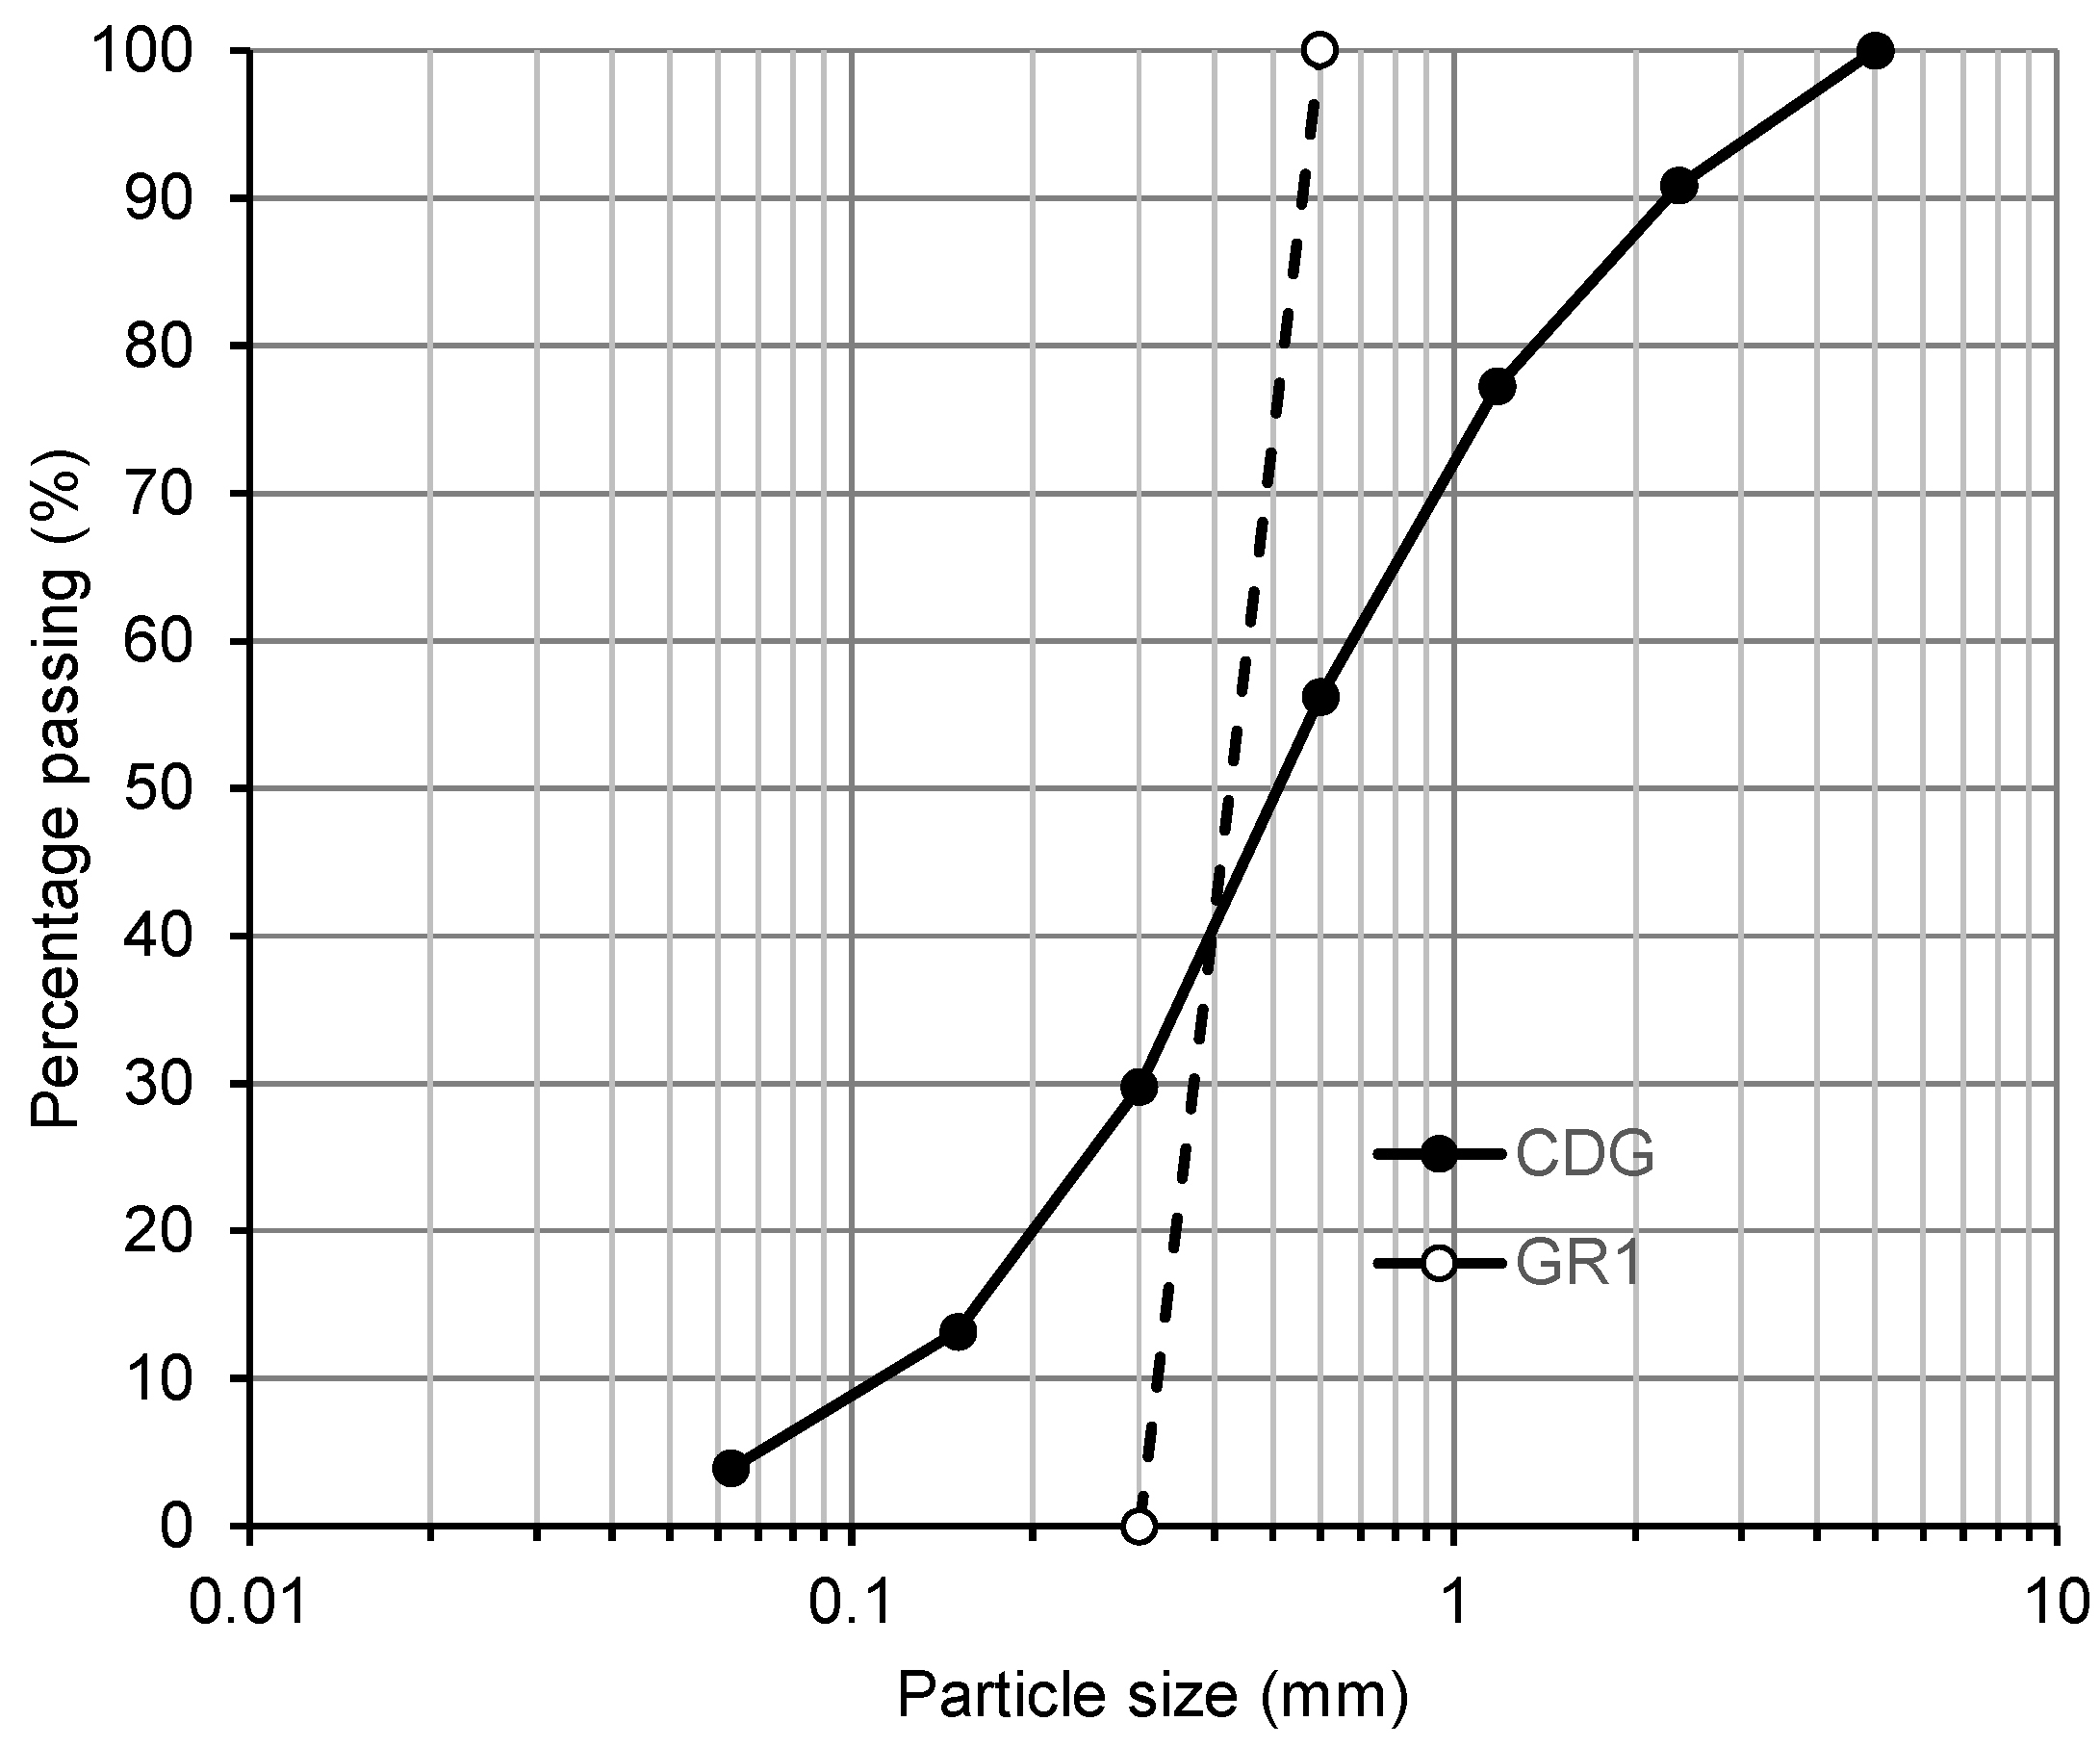
| 1 | CDG (D50 = 0.51 mm, Cu = 6.3, Ccr = 1.2) | - | 0 | 0.9 | 50, 150, 250, 350, 500 |
| 2 | GR1 | 10 | 0.9 | ||
| 3 | GR1 | 20 | 0.9 | ||
| 4 | GR1 | 30 | 0.9 | ||
| 5 | GR1 | 100 | 0.9 | ||
| 6 | FR2 | 10 | 0.9 | ||
| 7 | FR2 | 20 | 0.9 | ||
| 8 | FR2 | 30 | 0.9 | ||
| 9 | FR2 | 100 | 0.9 |
| Material Type | Initial Specific Volume (-) | Maximum Vertical Stress (kPa) |
|---|---|---|
| Pure CDG | 2.160 | 7000 |
| 10% GR1 | 1.944 | 7000 |
| 20% GR1 | 1.932 | 7000 |
| 30% GR1 | 1.840 | 7000 |
| 10% FR2 | 2.051 | 7000 |
| 20% FR2 | 1.957 | 7000 |
| 30% FR2 | 2.086 | 7000 |
| Sand Type | Rubber Type | Characteristics | Rubber Content (%) | Confining Pressure (kPa) |
|---|---|---|---|---|
| CDG (D50 = 0.51 mm, Cu = 6.3, Ccr = 1.2) | GR1 | D50 (0.45 mm) | 0, 10, 20, 30 | 50, 100, 200, 400 |
| FR2 | L (13.48 mm) W (1.77 mm) AR (7.62) | 10, 20, 30 | 50, 100, 200, 400 |
Publisher’s Note: MDPI stays neutral with regard to jurisdictional claims in published maps and institutional affiliations. |
© 2021 by the authors. Licensee MDPI, Basel, Switzerland. This article is an open access article distributed under the terms and conditions of the Creative Commons Attribution (CC BY) license (https://creativecommons.org/licenses/by/4.0/).
Share and Cite
Fu, R.; Li, W. Mechanical Behaviour of Completely Decomposed Granite Soil with Tire Rubber Granules and Fibres. Polymers 2021, 13, 4261. https://doi.org/10.3390/polym13234261
Fu R, Li W. Mechanical Behaviour of Completely Decomposed Granite Soil with Tire Rubber Granules and Fibres. Polymers. 2021; 13(23):4261. https://doi.org/10.3390/polym13234261
Chicago/Turabian StyleFu, Ru, and Wei Li. 2021. "Mechanical Behaviour of Completely Decomposed Granite Soil with Tire Rubber Granules and Fibres" Polymers 13, no. 23: 4261. https://doi.org/10.3390/polym13234261
APA StyleFu, R., & Li, W. (2021). Mechanical Behaviour of Completely Decomposed Granite Soil with Tire Rubber Granules and Fibres. Polymers, 13(23), 4261. https://doi.org/10.3390/polym13234261