
Design Rule for Constructing Buckling-Free Polymeric Stencil with Microdot Apertures


Abstract
:
1. Introduction
2. Materials and Methods
2.1. Materials
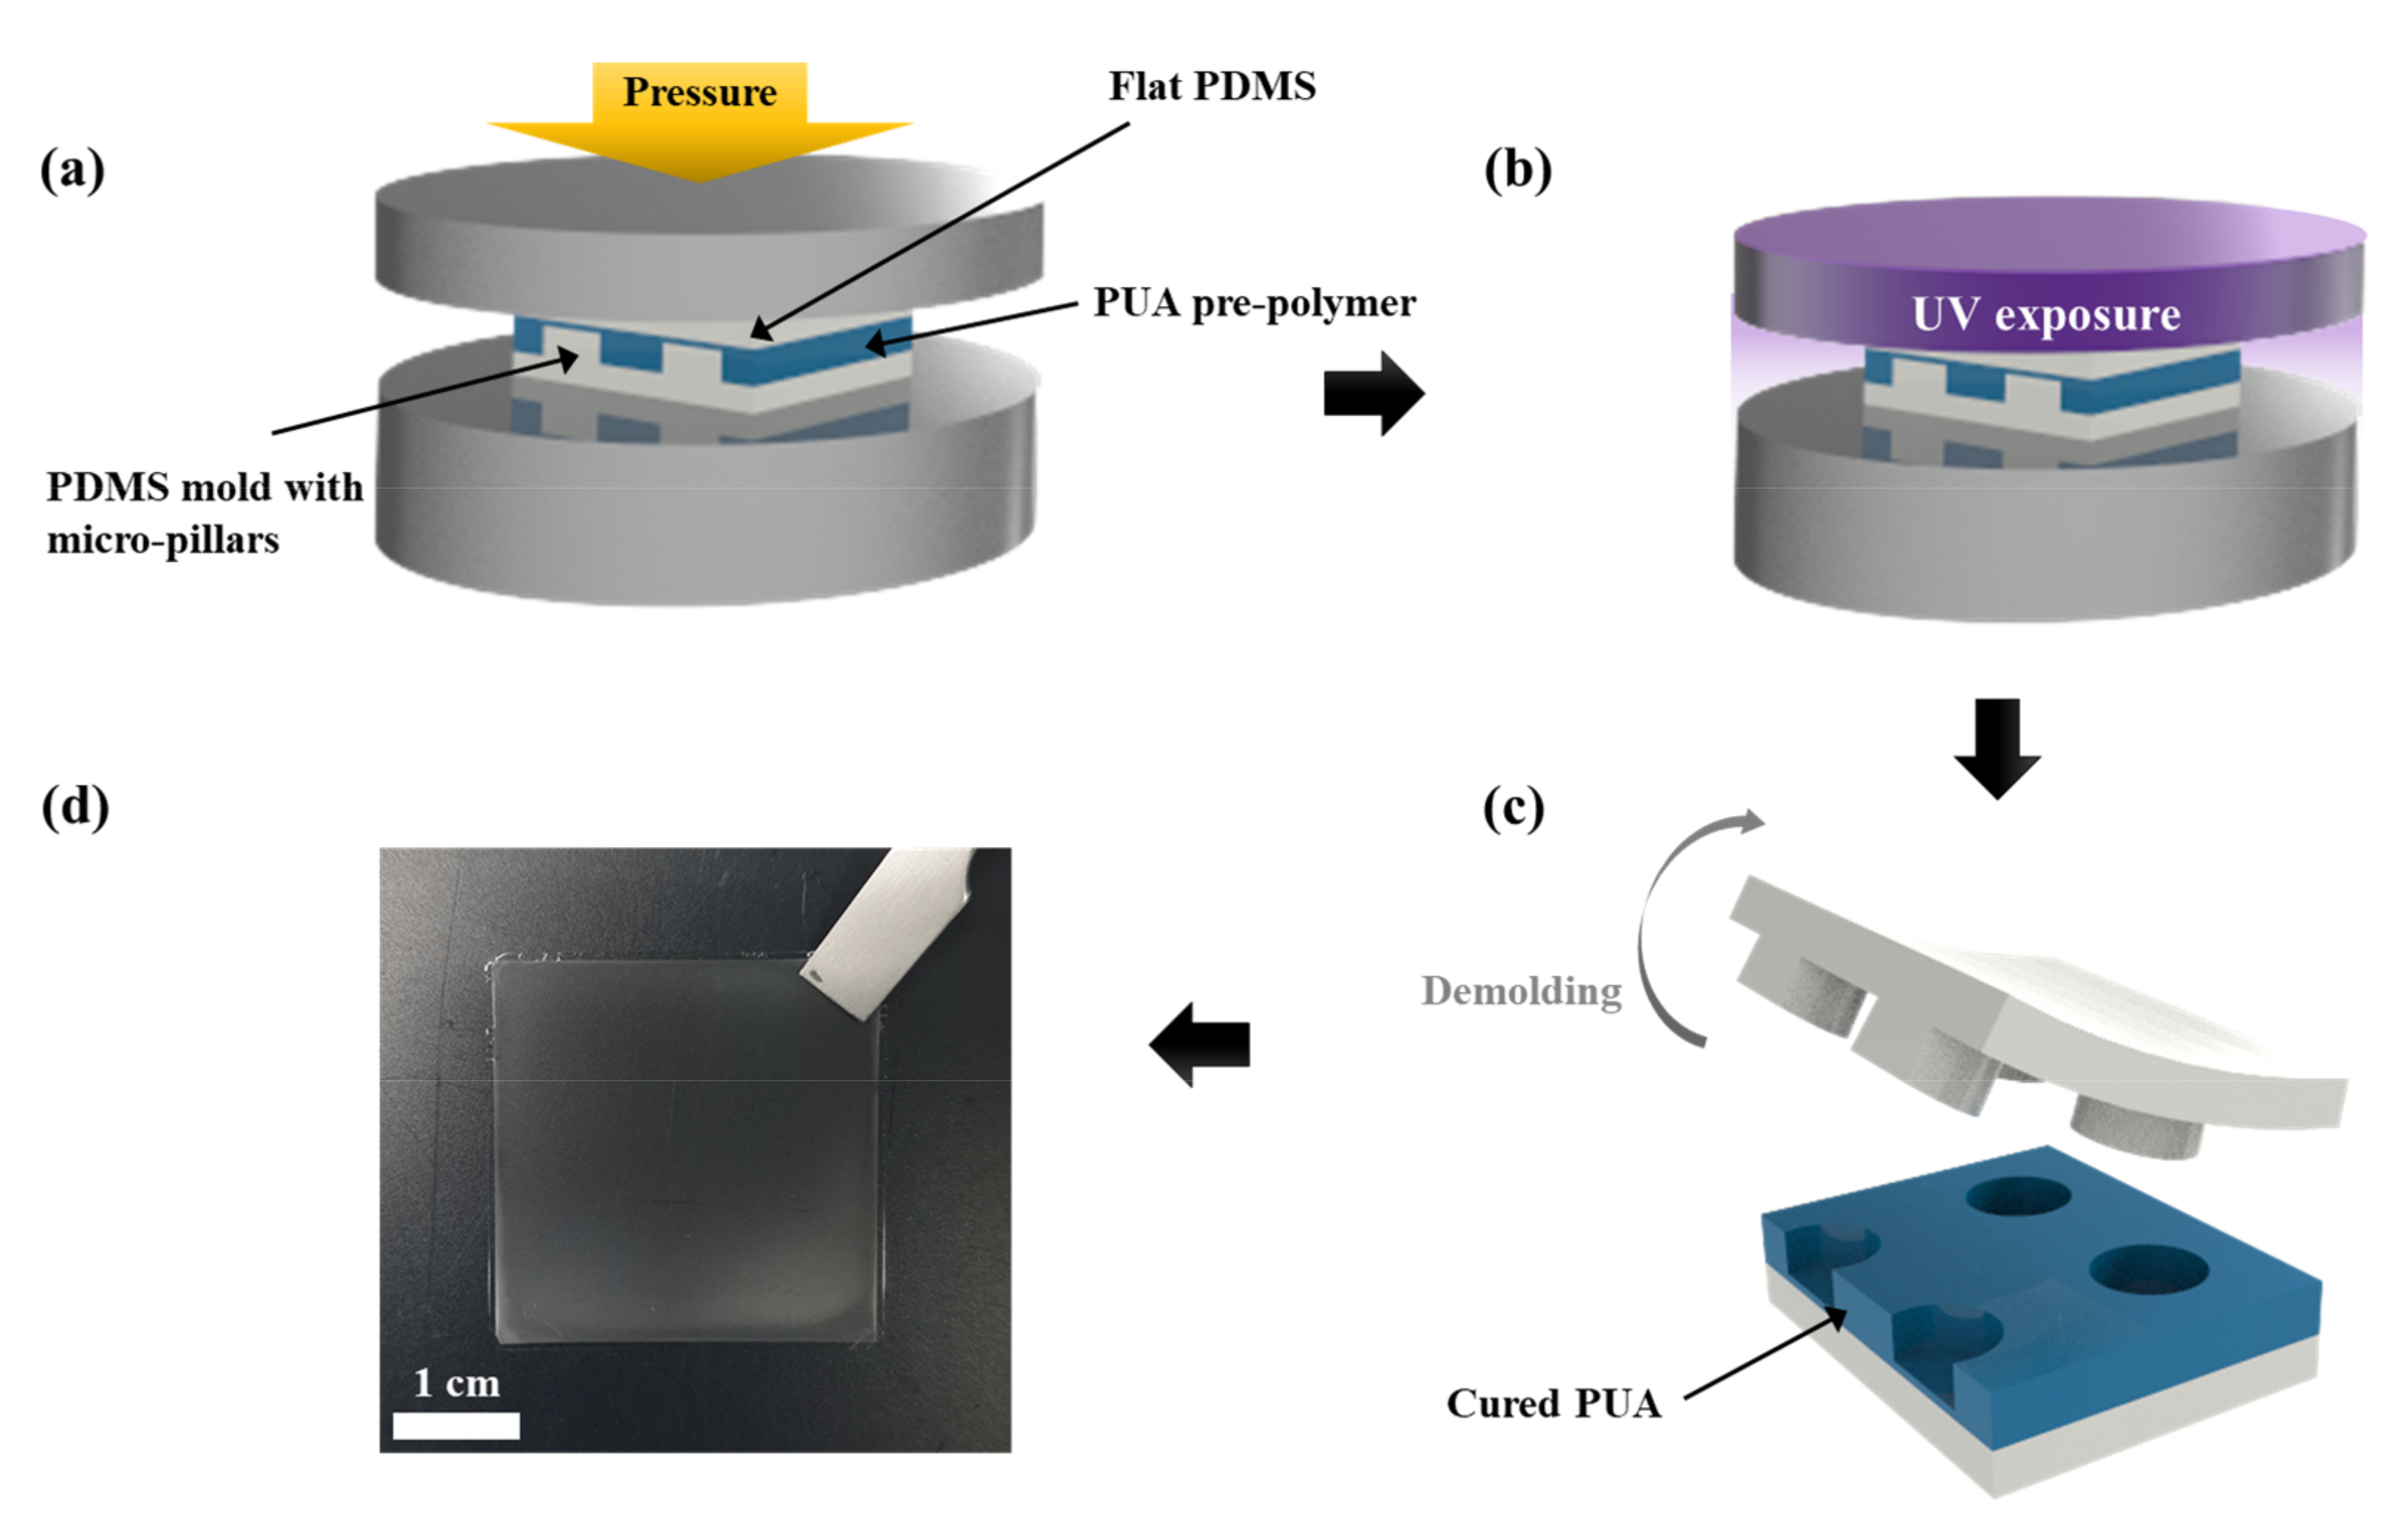
2.2. Preparation of Polydimethylsiloxane (PDMS) Patterned Array Mold
2.3. Fabrication of Polymeric Stencil with Microdot Apertures
2.4. Physical Analysis
3. Results and Discussion
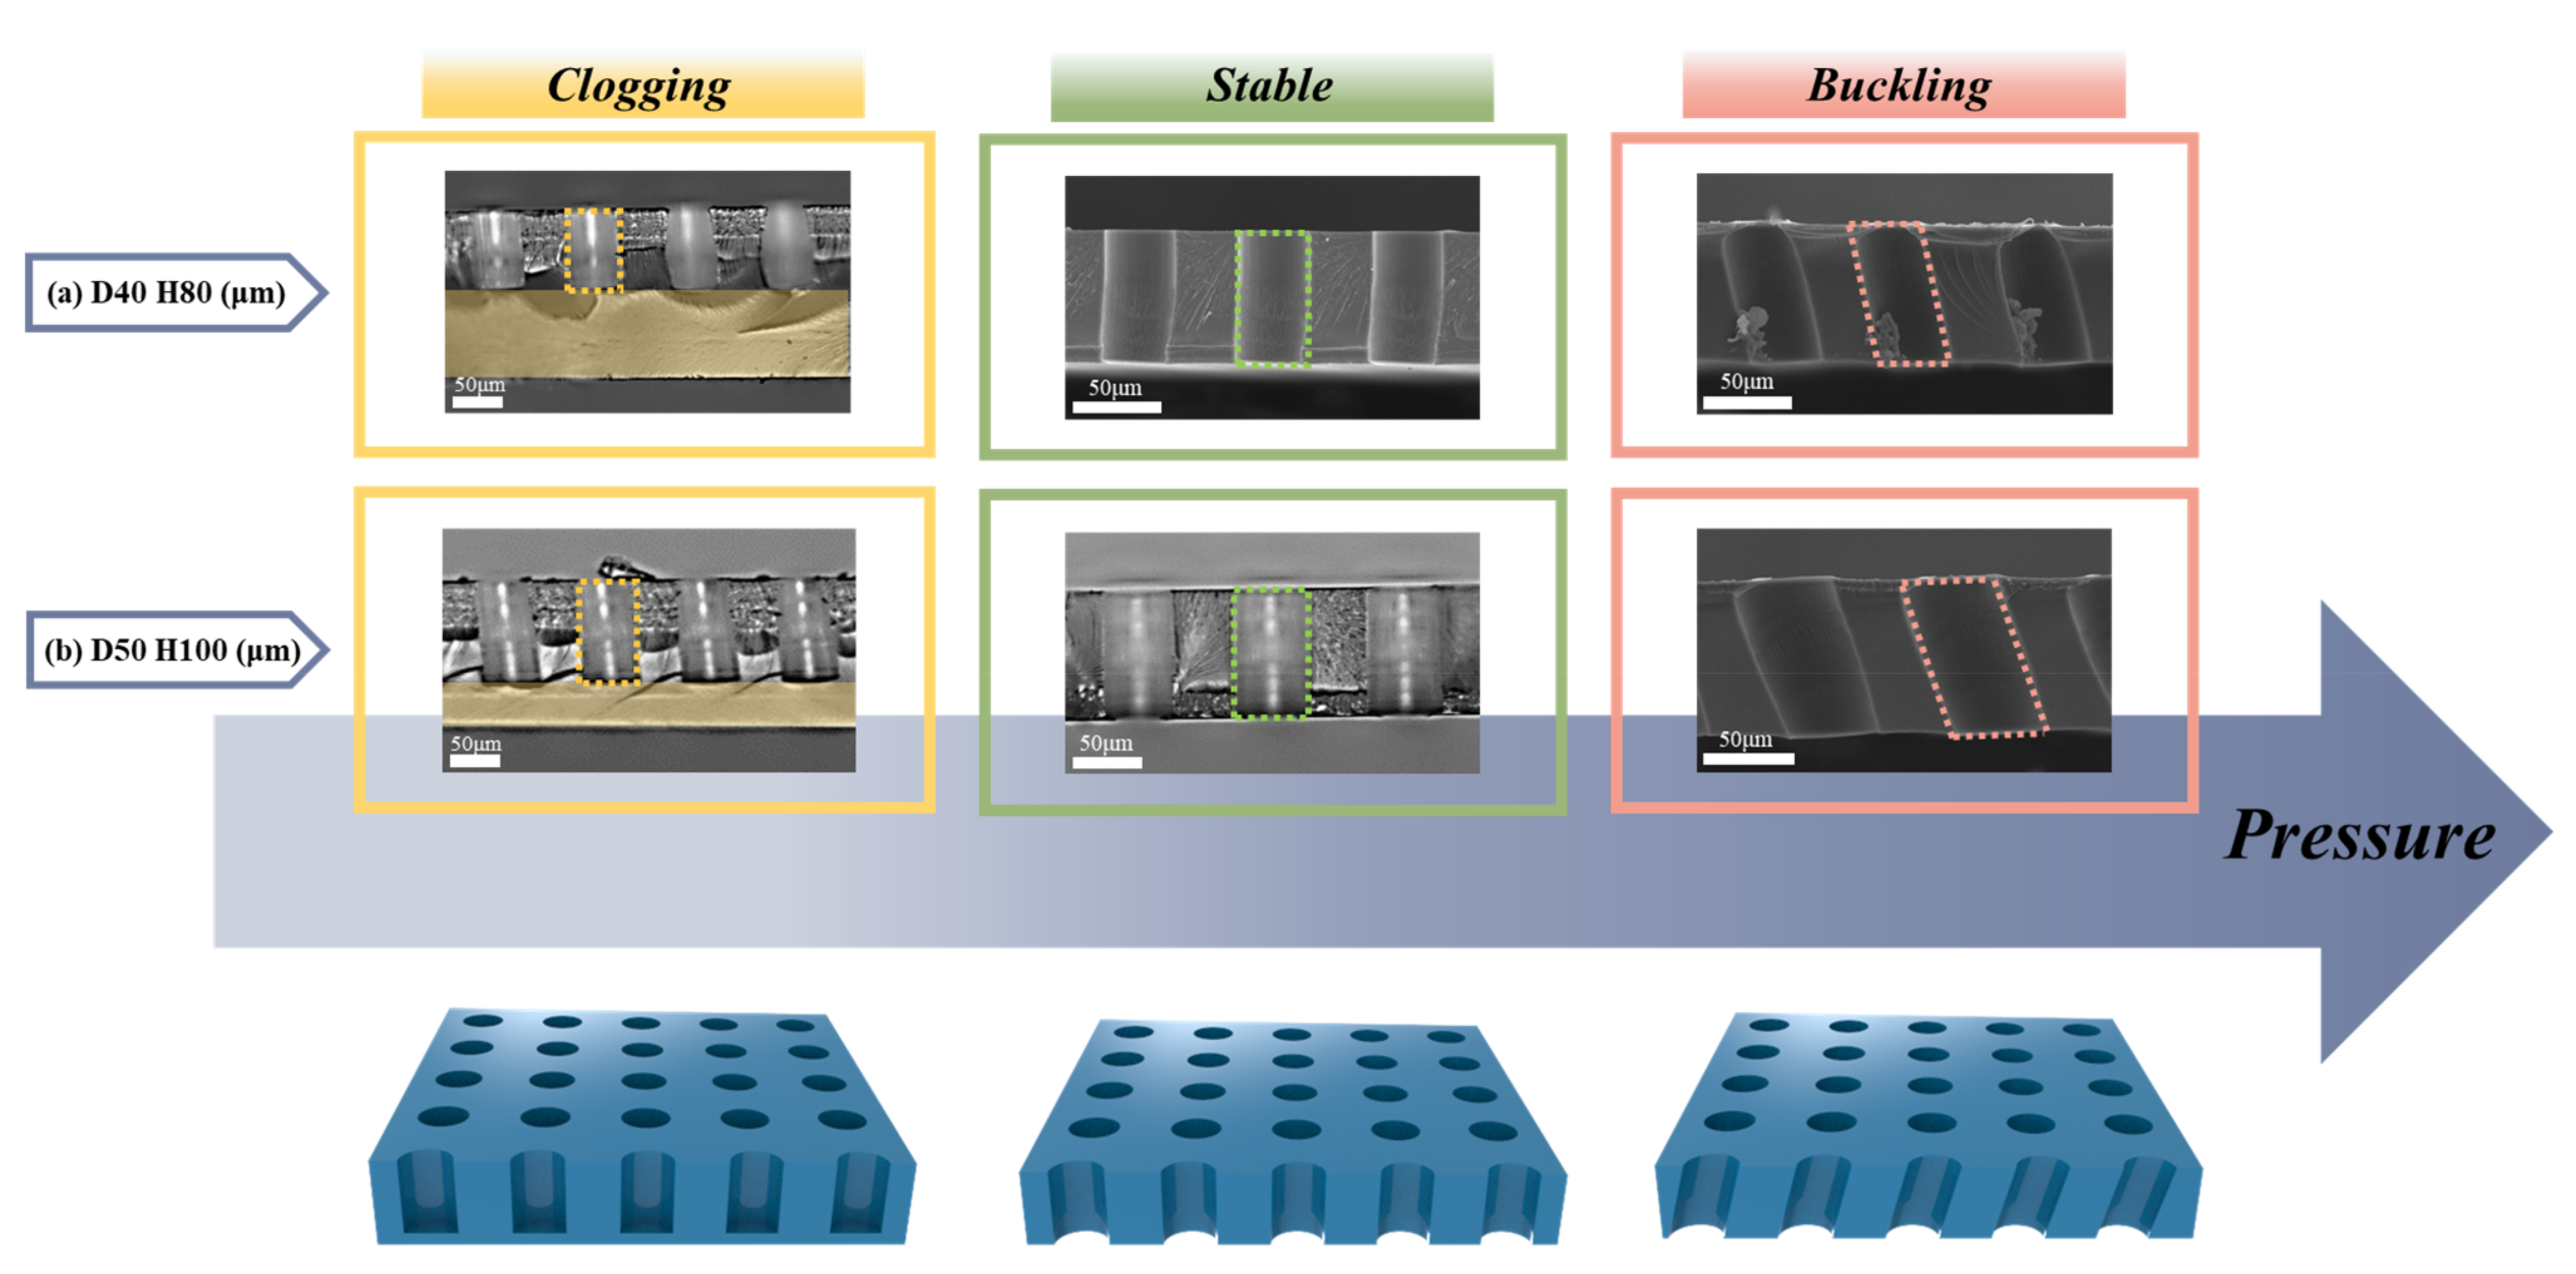
3.1. Fabrication of the Polymeric Stencil with Microdot Apertures with the Variation of Structural Aspect Ratio
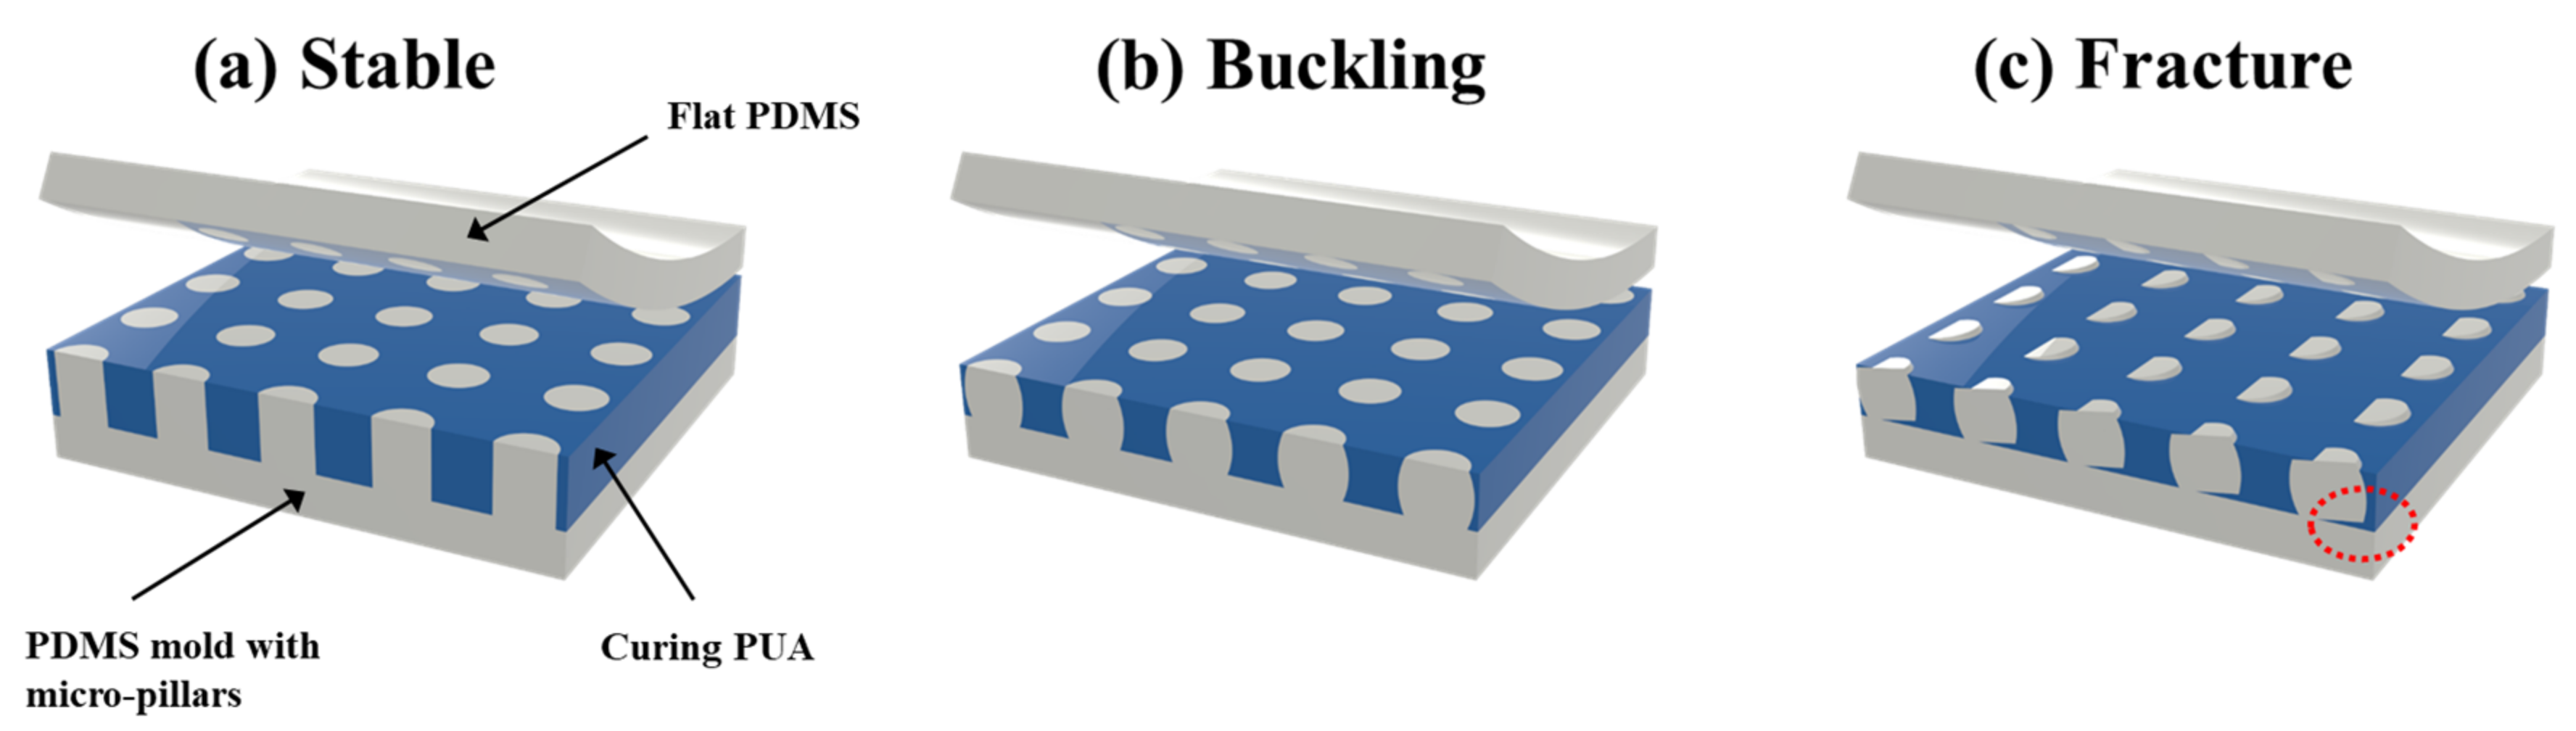
3.2. Buckling Phenomena of the Microdot Apertures in Stencils Depending on Aspect Ratio
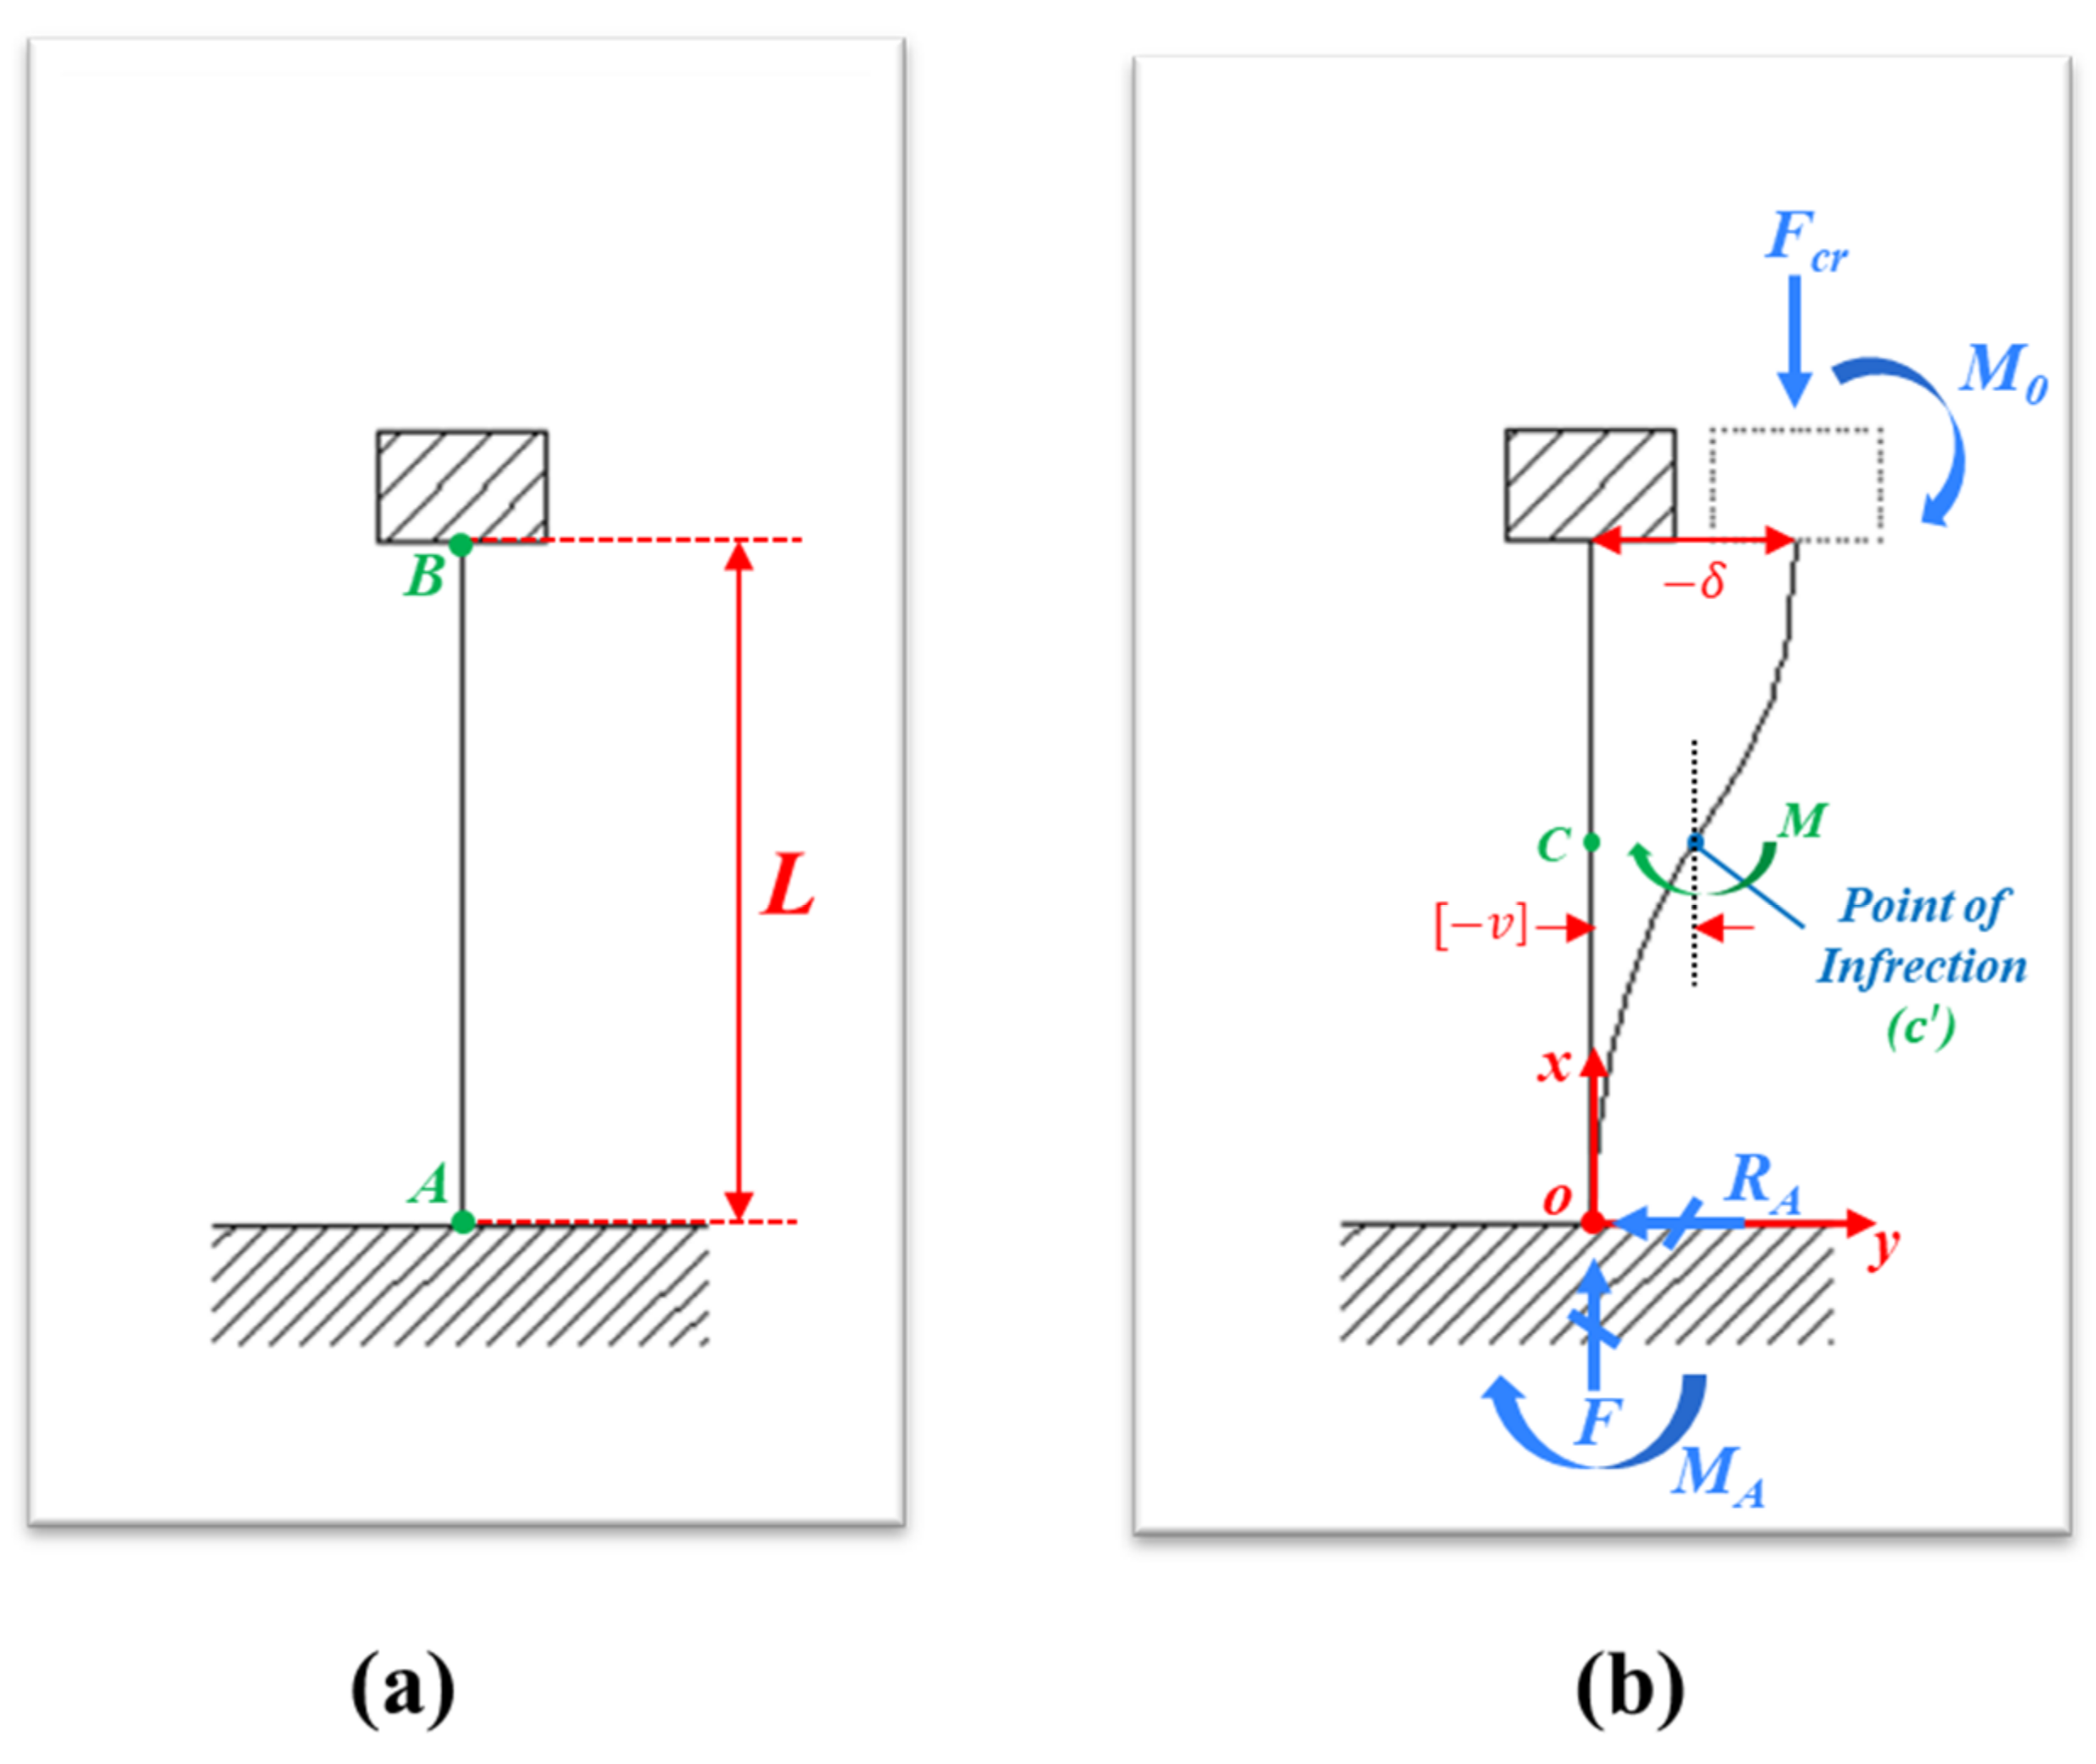
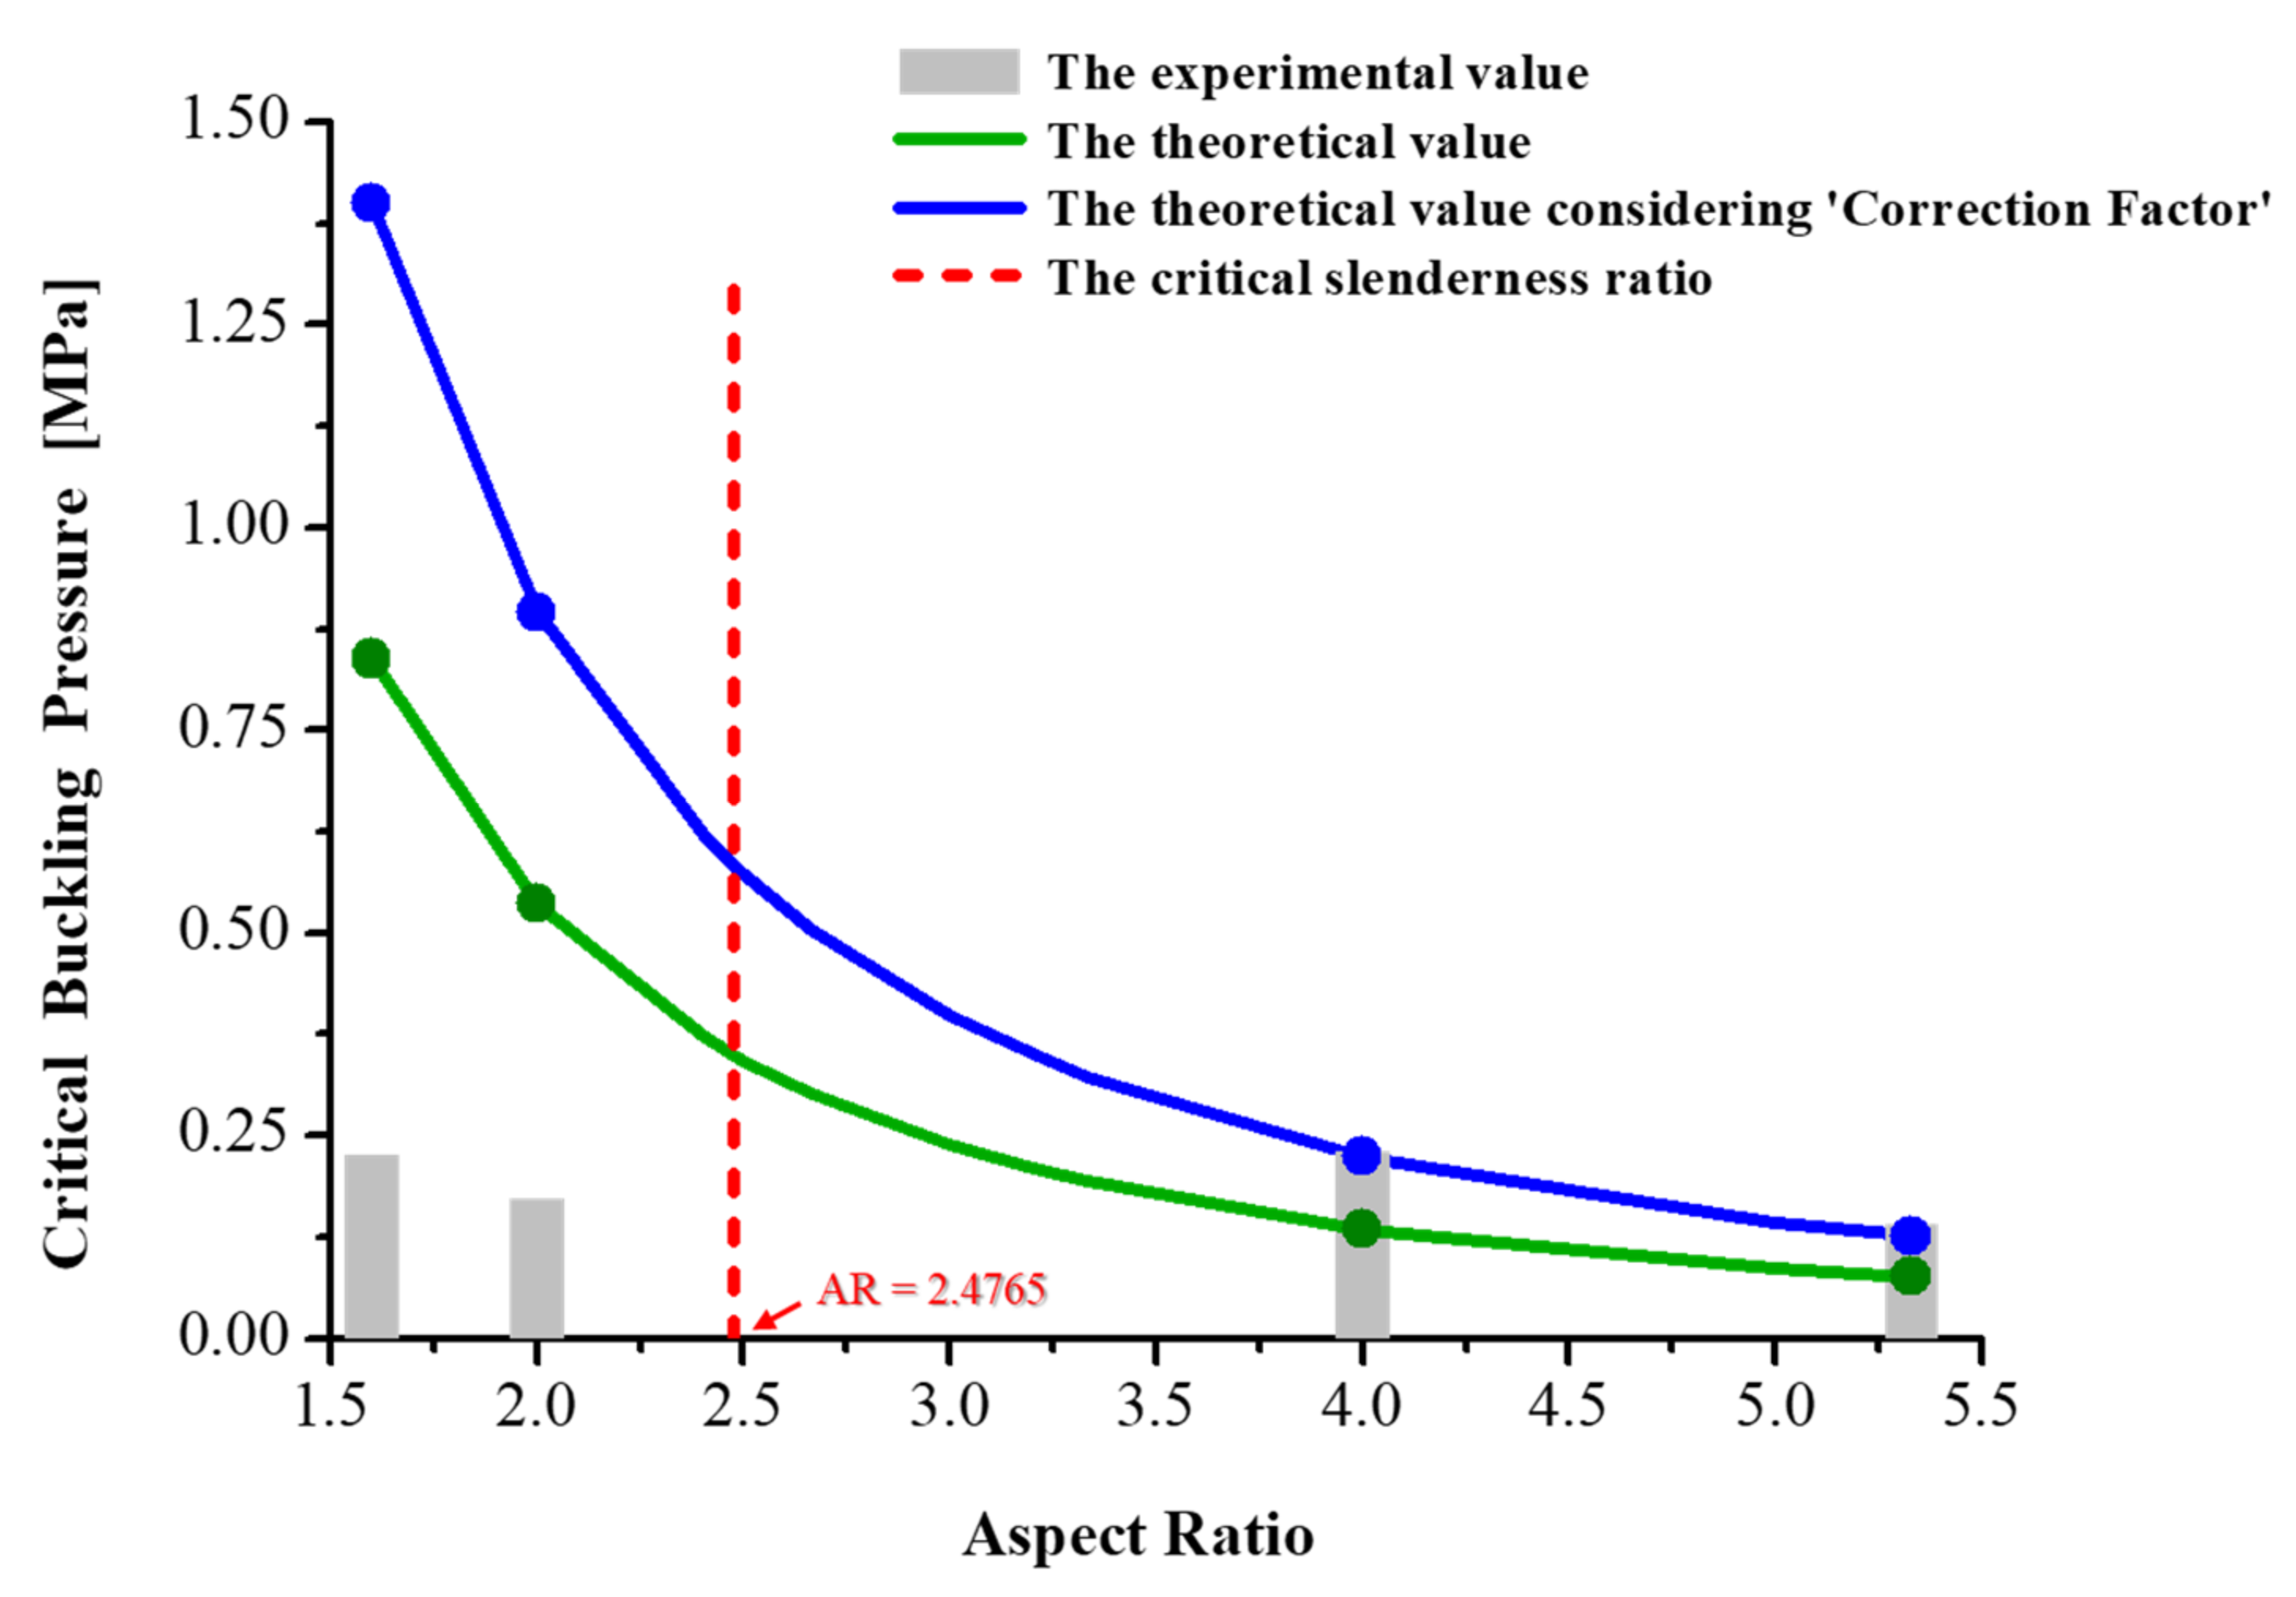
3.3. Theoretical Approach to Determine the Critical Buckling Pressure
- Inhomogeneity due to the inherent non-uniformity of the material and imperfect mixing process of PDMS base and curing agent of PDMS.
- The imperfect flatness of the UV-imprinting machine used in the experiment.
- Slightly different distances from the substrate to the top surface of each pillar due to the finely inclined PDMS mold.
4. Conclusions
Supplementary Materials
Author Contributions
Funding
Institutional Review Board Statement
Informed Consent Statement
Data Availability Statement
Conflicts of Interest
References
- Seol, C.; Jang, S.; Lee, J.; Nam, L.V.; Pham, T.A.; Koo, S.; Kim, K.; Jang, J.-H.; Kim, S.M.; Yoo, S.J. High-Performance Fuel Cells with a Plasma-Etched Polymer Electrolyte Membrane with Microhole Arrays. ACS Sustain. Chem. Eng. 2021, 9, 5884–5894. [Google Scholar] [CrossRef]
- Ahn, J.; Ahn, J.; Park, J. 3D-ordered porous composite microparticles formed via substrate-free optical 3D lithography. Funct. Compos. Struct. 2020, 2, 045007. [Google Scholar] [CrossRef]
- Grover, W.H.; Skelley, A.M.; Liu, C.N.; Lagally, E.T.; Mathies, R.A. Monolithic membrane valves and diaphragm pumps for practical large-scale integration into glass microfluidic devices. Sens. Actuators B Chem. 2003, 89, 315–323. [Google Scholar] [CrossRef]
- Grilli, S.; Coppola, S.; Vespini, V.; Pagliarulo, V.; Nasti, G.; Carfagna, C.; Ferraro, P. One-step fabrication of free-standing flexible membranes reinforced with self-assembled arrays of carbon nanotubes. Appl. Phys. Lett. 2014, 105, 153101. [Google Scholar] [CrossRef] [Green Version]
- Park, H.; Cho, H.; Kim, J.; Bang, J.W.; Seo, S.; Rahmawan, Y.; Lee, D.Y.; Suh, K.Y. Multiscale transfer printing into recessed microwells and on curved surfaces via hierarchical perfluoropolyether stamps. Small 2014, 10, 52–59. [Google Scholar] [CrossRef] [PubMed]
- Thangawng, A.L.; Ruoff, R.S.; Swartz, M.A.; Glucksberg, M.R. An ultra-thin PDMS membrane as a bio/micro–nano interface: Fabrication and characterization. Biomed. Microdev. 2007, 9, 587–595. [Google Scholar] [CrossRef]
- Striemer, C.C.; Gaborski, T.R.; McGrath, J.L.; Fauchet, P.M. Charge-and size-based separation of macromolecules using ultrathin silicon membranes. Nature 2007, 445, 749–753. [Google Scholar] [CrossRef]
- Mueggenburg, K.E.; Lin, X.-M.; Goldsmith, R.H.; Jaeger, H.M. Elastic membranes of close-packed nanoparticle arrays. Nat. Mater. 2007, 6, 656–660. [Google Scholar] [CrossRef]
- Cho, H.; Kim, S.M.; Kang, Y.S.; Kim, J.; Jang, S.; Kim, M.; Park, H.; Bang, J.W.; Seo, S.; Suh, K.-Y. Multiplex lithography for multilevel multiscale architectures and its application to polymer electrolyte membrane fuel cell. Nat. Commun. 2015, 6, 8484. [Google Scholar] [CrossRef] [PubMed] [Green Version]
- Lee, J.; Seol, C.; Nam, L.V.; Jang, S.; Kim, J.; Kim, I.; Ryu, Y.-S.; Kim, S.M. Investigation of Structural Stability for Monolithic Nano Bridges on Micro Apertures. Appl. Sci. 2020, 10, 2922. [Google Scholar] [CrossRef]
- Ding, Y.; Xu, G.-K.; Wang, G.-F. On the determination of elastic moduli of cells by AFM based indentation. Sci. Rep. 2017, 7, 45575. [Google Scholar] [CrossRef] [PubMed] [Green Version]
- Grotte, M.; Duprat, F.; Piétri, E.; Loonis, D. Young’s modulus, Poisson’s ratio, and Lame’s coefficients of golden delicious apple. Int. J. Food Prop. 2002, 5, 333–349. [Google Scholar] [CrossRef]
- Tovstik, P.E.; Tovstik, T.P. Applied theory of shallow multilayered or functionally graded shells. In Shell Structures: Theory and Applications; CRC Press: Boca Raton, FL, USA, 2017; Volume 4, pp. 181–184. [Google Scholar]
- Johnston, I.; McCluskey, D.; Tan, C.; Tracey, M. Mechanical characterization of bulk Sylgard 184 for microfluidics and microengineering. J. Micromech. Microeng. 2014, 24, 035017. [Google Scholar] [CrossRef]
- Müller, A.; Wapler, M.C.; Wallrabe, U. A quick and accurate method to determine the Poisson’s ratio and the coefficient of thermal expansion of PDMS. Soft Matter 2019, 15, 779–784. [Google Scholar] [CrossRef] [PubMed] [Green Version]
- Goodno, B.J.; Gere, J. Statics and Mechanics of Materials; Cengage Learning: Boston, MA, USA, 2018. [Google Scholar]
- Hibbeler, R.C. Statics and Mechanics of Materials; Pearson Higher Education: Harlow, UK, 2018. [Google Scholar]
- Ochshorn, J. Structural Elements for Architects and Builders; Elsevier: Burlington, NJ, USA, 2009. [Google Scholar]
- Kim, H.-K. Fatigue strength evaluation of the clinched lap joints of a cold rolled mild steel sheet. J. Mater. Eng. Perform. 2013, 22, 294–299. [Google Scholar] [CrossRef]
- Félix, A.S.C.; Santiago-Alvarado, A.; Iturbide-Jiménez, F.; Licona-Morán, B. Physical-chemical properties of PDMS samples used in tunable lenses. Int. J. Eng. Sci. Innov. Technol. 2014, 3, 563–571. [Google Scholar]
- Wang, Z.; Volinsky, A.A.; Gallant, N.D. Crosslinking effect on polydimethylsiloxane elastic modulus measured by custom-built compression instrument. J. Appl. Polym. Sci. 2014, 131, 41050. [Google Scholar] [CrossRef] [Green Version]
- Budynas, R.G.; Nisbett, J.K. Shigley’s Mechanical Engineering Design; McGraw-Hill: New York, NY, USA, 2011; Volume 9. [Google Scholar]
- Khurmi, R.; Gupta, J. A Textbook of Machine Design; S. Chand Publishing: New Delhi, India, 2005. [Google Scholar]


| Sample/Case | Clogging (MPa) | Stable (MPa) | Buckling (MPa) |
|---|---|---|---|
| H80 D40 (μm) | 0 | 0.091 | 0.171 |
| H100 D50 (μm) | 0 | 0.091 | 0.175 |
| Sample/Case | Clogging (MPa) | Stable (MPa) | Buckling (MPa) |
|---|---|---|---|
| H120 D30 (μm) | 0 | 0.175 | 0.229 |
| H160 D40 (μm) | 0 | 0.168 | 0.229 |
| Aspect Ratio | 1.6 | 2.0 | 4.0 | 5.3 |
|---|---|---|---|---|
| Pressure (MPa) | 0.225 | 0.171 | 0.229 | 0.140 |
Publisher’s Note: MDPI stays neutral with regard to jurisdictional claims in published maps and institutional affiliations. |
© 2021 by the authors. Licensee MDPI, Basel, Switzerland. This article is an open access article distributed under the terms and conditions of the Creative Commons Attribution (CC BY) license (https://creativecommons.org/licenses/by/4.0/).
Share and Cite
Kim, M.; Lee, J.; Kim, J.; Jang, S.; Kim, S.M. Design Rule for Constructing Buckling-Free Polymeric Stencil with Microdot Apertures. Polymers 2021, 13, 4361. https://doi.org/10.3390/polym13244361
Kim M, Lee J, Kim J, Jang S, Kim SM. Design Rule for Constructing Buckling-Free Polymeric Stencil with Microdot Apertures. Polymers. 2021; 13(24):4361. https://doi.org/10.3390/polym13244361
Chicago/Turabian StyleKim, Minju, Jinwon Lee, Junsoo Kim, Segeun Jang, and Sang Moon Kim. 2021. "Design Rule for Constructing Buckling-Free Polymeric Stencil with Microdot Apertures" Polymers 13, no. 24: 4361. https://doi.org/10.3390/polym13244361
APA StyleKim, M., Lee, J., Kim, J., Jang, S., & Kim, S. M. (2021). Design Rule for Constructing Buckling-Free Polymeric Stencil with Microdot Apertures. Polymers, 13(24), 4361. https://doi.org/10.3390/polym13244361