1. Introduction
Injection molding of rubber has become a very powerful manufacturing method to obtain dozens of products like sealings, housings, dampings, and other technically sophisticated parts in a rather short processing times compared to other techniques, such as compression or transfer molding. However, the rubber injection molding (IM) process is quite sensitive, and its success depends on numerous aspects related to the rubber compound and the process settings. For this reason, many people put a lot of effort into developing various improvements for simulation software, such as SIGMASOFT
® from SIGMA Engineering GmbH (Aachen, Germany), to visualize the entire process [
1,
2,
3,
4]. One of the most challenging aspects is the flow behavior of rubber compounds, which is different to that of their thermoplastic relatives. While thermoplastics are usually injected around the melt temperature of the polymer to obtain the required flow of the material through a hot runner system [
5], rubber compounds only admit temperatures between 70 –110 °C [
6], since a premature start of the curative reaction in the formulations must be strictly avoided. In this phase of the process, rubber compounds exhibit a higher flow resistance, indicating a higher viscosity of the formulation compared to that of their thermoplastic counterparts. This illustrates the importance of understanding the complex characteristics of rubber compounds and the physical correlations between material flow and viscosity.
Both thermoplastic and elastomer material groups with pure molten, unfilled polymers, and a high molecular weight typically show a Newtonian plateau at small deformation rates. The plateau corresponds to the linear viscoelastic region of the polymer, which is shifted to even smaller deformation rates with increasing presence of fillers [
7,
8]. This behavior is similar to that of the complex composition of rubber compounds, which generally contain one or more polymers on either a synthetic or natural base; carbon black or silica-based materials as reinforcing fillers; several additives with different functions, such as increasing the resistance to aging; and a curative system, usually of sulfuric or peroxidic origin, which provides the formation of chemically cross-linked parts [
9]. In view of the wide variety of possible rubber formulations, physical interactions of the constituents play an important role in material flow. Branched polymers with high molecular weights, for example, show a higher flow resistance than do polymers with short chains as a result of a higher degree of entanglement. Styrene butadiene rubber (SBR) is a particularly good example of this, as different macrostructures can be obtained depending on the polymerization method used. Cold emulsion polymerization at 5 °C leads to a branched but comparatively linear polymer, whereas the same polymerization in tempered media (between 40–50 °C) tends to form branched chains. For this reason, plasticizers are added to reduce the viscosity of the compound [
9]. Another physical effect influencing the material flow is the reinforcement by filler particles, often referred to as the “Payne effect” [
10]. Froehlich et al. [
11] ascribed the reason to the primary particle size, the specific surface area and its degree of irregularity, and the surface activity of the filler, thus leading to more or less interaction of the fillers with the other contents of the rubber compound.
Apart from the morphology of a rubber compound, the viscosity of the material is strongly dependent on the bulk temperature. In rubber processing, however, this temperature is not only the result of externally applied heat, but also of heat dissipation, which occurs due to shear and elongational heating and viscoelastic effects during the flow through a die or a runner system. Consequently, the mass temperature of the rubber during processing is less of a homogeneous field and more of a non-uniform and time-varying field leading to a unique profile that affects the whole cycle [
4]. Perko et al. [
12,
13] focused their work on targeted exploitation of heat dissipation with the aim of reducing the cycle time in rubber injection molding. Their approach is that the required time for vulcanization is reduced if the bulk temperature is increased simultaneously during dosing and/or filling. Therefore, they developed a new viscous model by means of the energy conservation equation for the prediction of temperature changes in rubber compounds flowing through conical dies. For each section of a discretized die, the calculations not only consider the shear heating effect, but also elongational viscosity in the r-, φ- and z-directions of a polar system. Based on that, predictions of the bulk temperature with an average error <5% were obtained with the reference point being defined as the core of the material string ejected to the atmosphere [
12]. Fasching et al. [
14,
15] showed in subsequent research the importance of correct determination of the mass temperature profile after dosing. Direct measurement of this temperature in the plasticizing cylinder is technically not possible, which is why the initial mass temperature in simulations often equals the set (constant) temperature of the plasticizing cylinder defined at the injection molding machine [
16]. Therefore, Fasching proposed a higher initial set temperature for the rubber compound applied in simulation. Consequently, he succeeded in reducing the deviation between simulated temperature curves of an injection molding process and the actual temperature of the rubber compound during processing. Pioneering work for the determination of the transient mass temperature profile during the dosing process was carried out by Kerschbaumer et al. [
17,
18]. Using an engineering approach, they designed a test stand consisting of a plasticizing cylinder equipped with pressure sensors, a throttle valve for back pressure adjustment, and a measurement bar containing thermocouples for the determination of the actual state of the mass temperature. Based on this new method, the group provided evidence of the well-known dependency of the compound temperature on the settings of the dosing step [
9], which is attributed to the screw rotational speed and the back pressure.
The present work aimed at combining the results of the above mentioned research of Perko et al. [
12,
13], Fasching et al. [
14,
15], and Kerschbaumer et al. [
17,
18], and intends to reveal the advantage of considering the actual state of the mass temperature profile in process simulations, which consequently improves virtually obtained results.The target value for the comparison of the simulated and the real processes is defined in this work as the temperature measured in the mold during injection. In addition, the numerically calculated relative degree of cure was contrasted with the mechanically determined reaction progress by means of a compression set (CS) and dynamic-mechanical analysis (DMA) in order to demonstrate the effect of considering the temperature profile in injection molding simulations.
3. Results and Discussion
The common practice of setting up an injection molding simulation revealed that the initial mass temperature is often assumed to equal the set temperature of the plasticizing cylinder of an injection molding machine. Ramorino et al. [
16] recently compared results from a real manufacturing process and simulation using an acrylonitrile butadiene rubber (NBR) and they hypothesized that the initial mass temperature had negligible effects on the results of the numerical calculations. Contrary findings were obtained in this work by measuring the actual state of the mass temperature profile with the previously described test stand. An illustration of the result is given in
Figure 5, which shows the relevant temperature profile for the present work at a screw rotational speed of 90 min
−1. As a result of the movement of the rubber compound through the plasticizing cylinder induced by the screw rotation and the simultaneous heat dissipation, the material continuously gains heat until dosing is finished at a defined volume. The amount of heat gained by the system is obviously related to the screw rotational speed, which is underlined by the depiction of additional temperature profiles measured at 60 and 120 min
−1. Consequently, the significance of the actual mass temperature after dosing for the purposes of reliable process simulation is made evident.
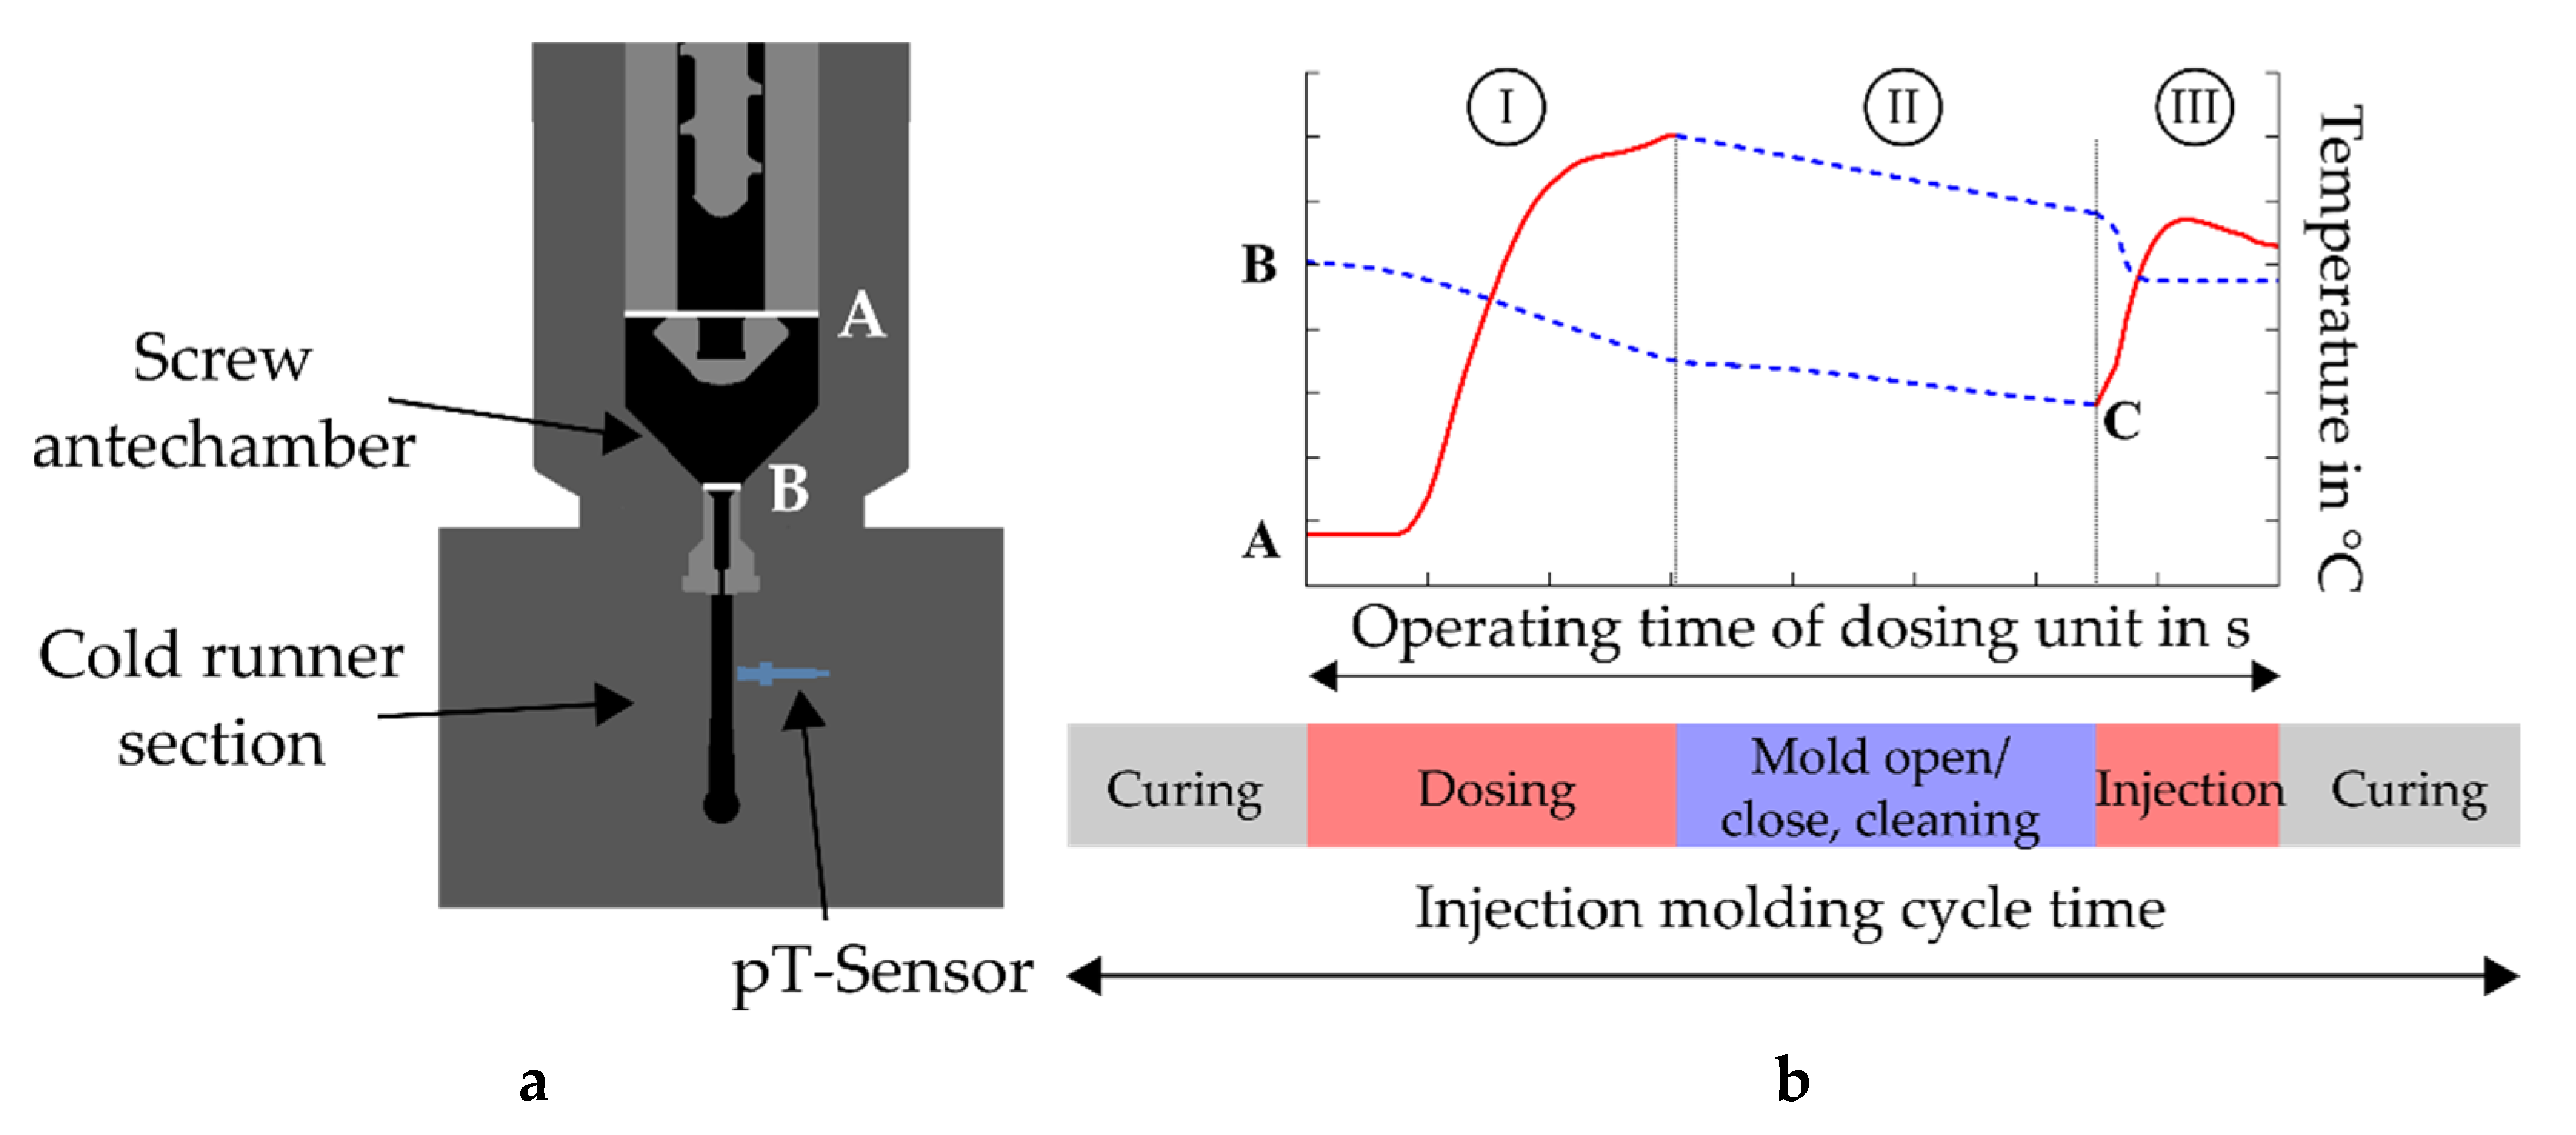
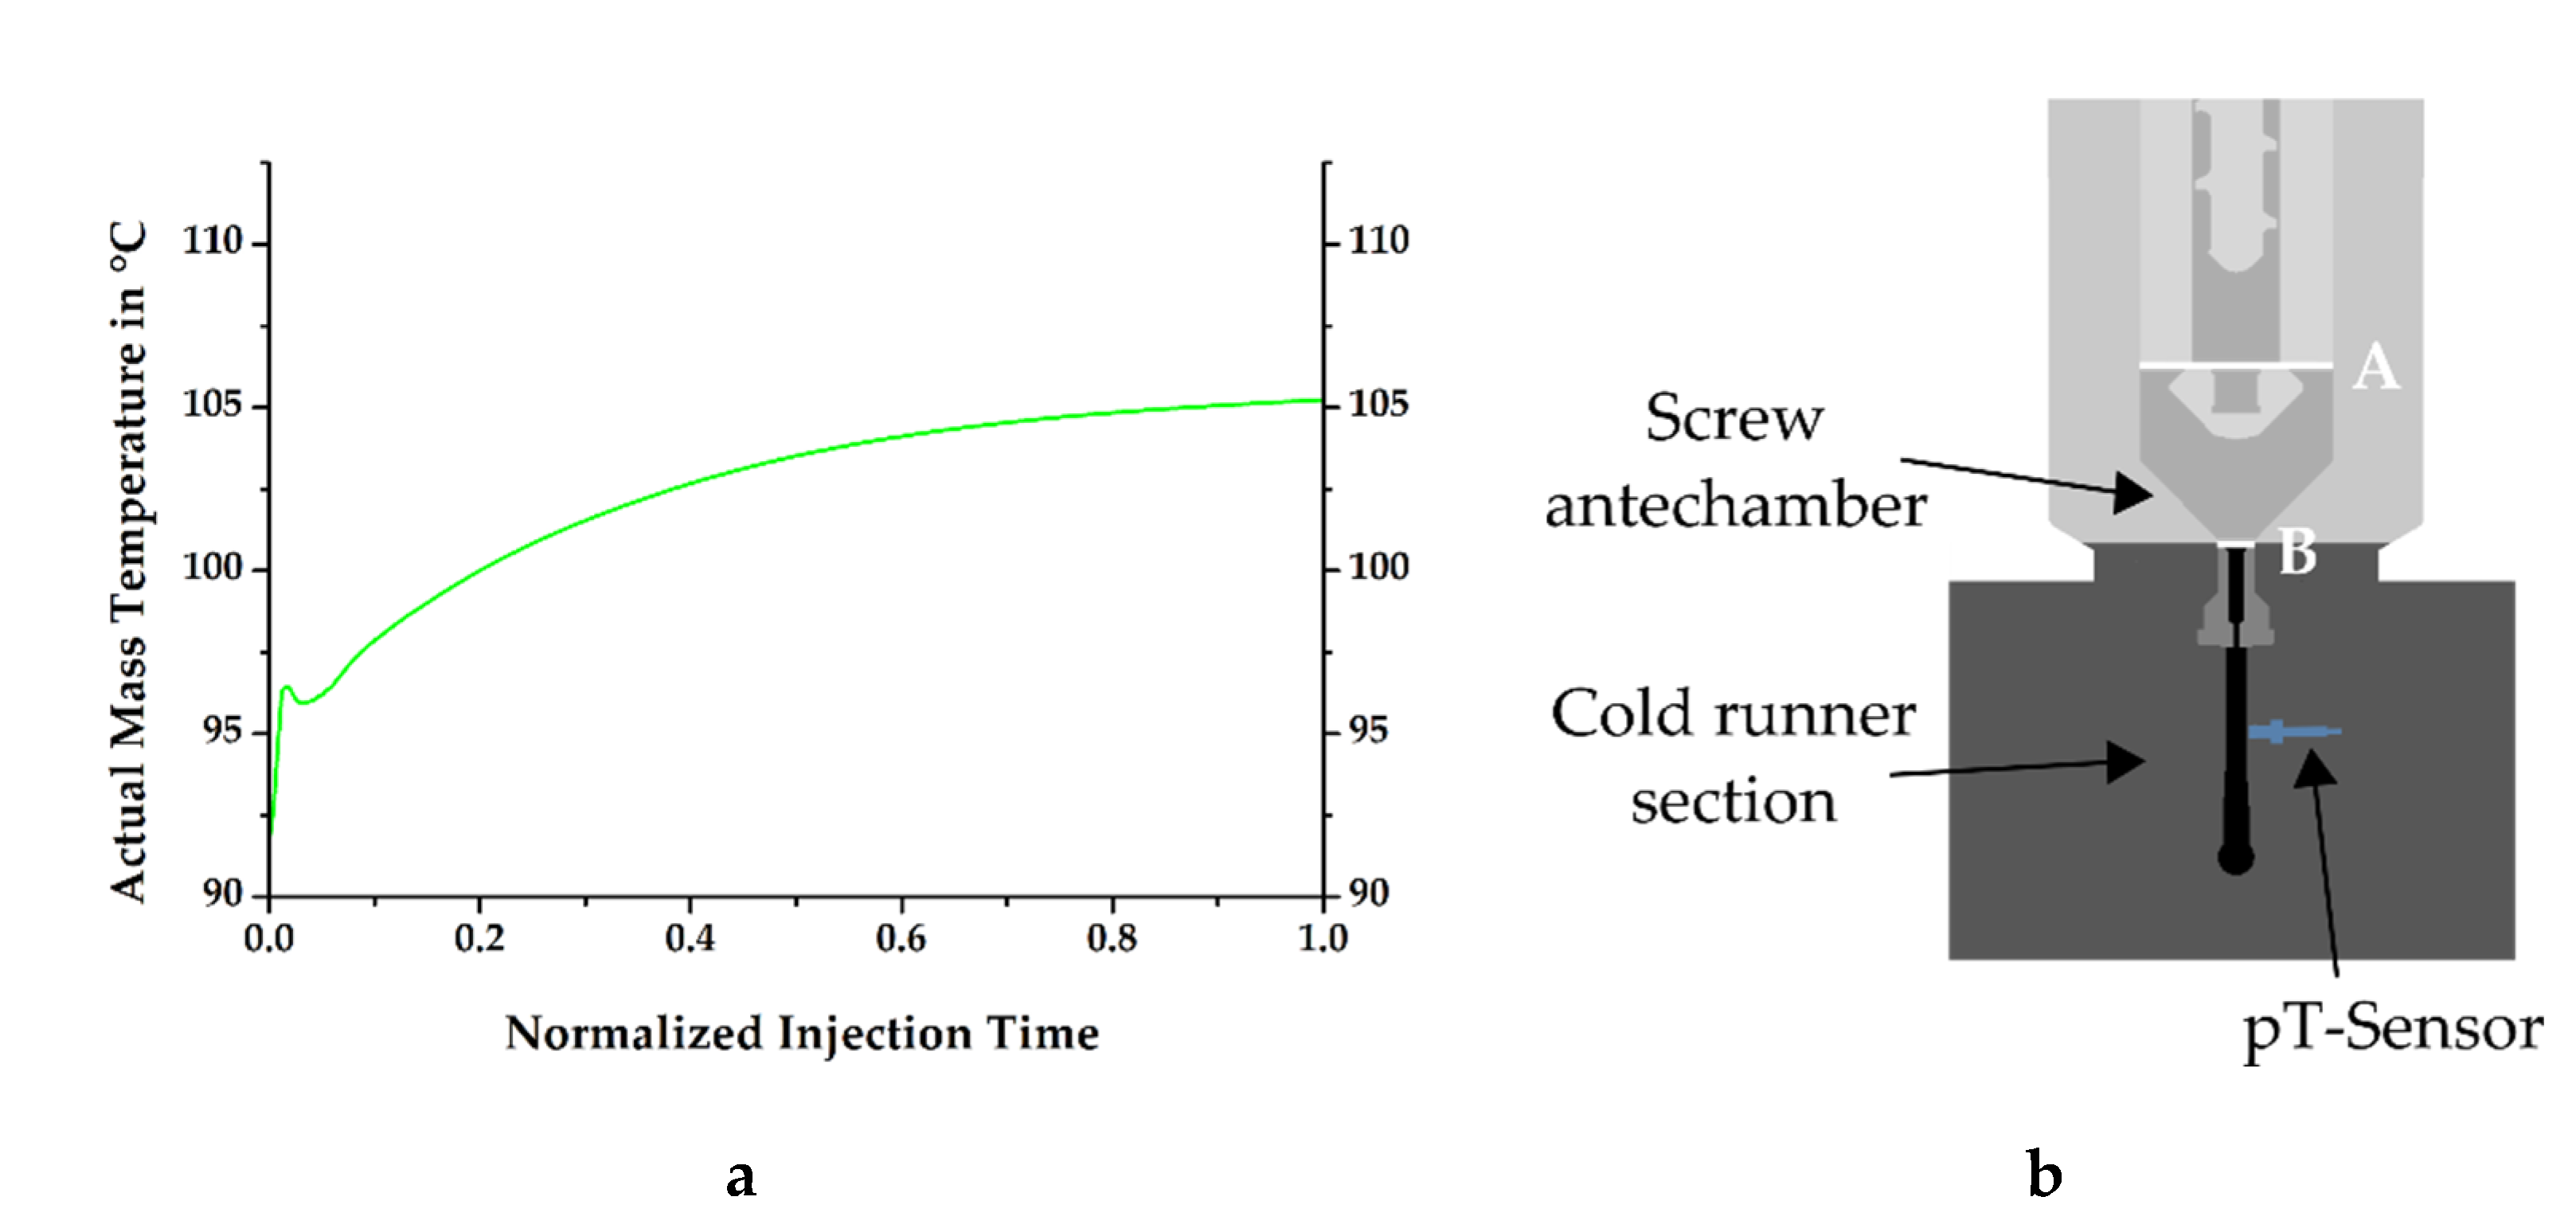
At the injection molding machine, the process is defined such that a retention time follows the dosing step, during which no material movement is seen, but heat transfer is observed from the rubber compound to the dosing unit. This reduction of temperature in the material must be quantified for process simulation, as it defines the initial mass temperature at the inlet of the mold. However, a direct measurement of this temperature is not feasible due to the technical design of the test stand and can only be calculated. Therefore, the determination was carried out with the help of simulation software, resulting in a temperature curve as shown in
Figure 6a, which indicates the thermal conditions during injection at the previously described plane B (see
Figure 6b). Even though the temperature of the dosing unit was set to 80 °C at this position, it can be clearly seen that the mass temperature was considerably higher, confirming the hypothesis of Fasching concerning the simulation definitions of the considered material at the inlet [
14].
Based on these findings, it becomes evident that the consideration of a temperature profile has significant effect on the further thermal history of the rubber compound in the mold, regardless of which injection molding process is to be validated numerically. Moreover, the simulations conducted in this work have shown that it is also not sufficient to define an inlet temperature of the material that is higher than the set temperature of the dosing unit.
Figure 7 compares the mass temperatures obtained in the simulations during filling with the real process data at the surface area of the pT-sensor in the cold runner. The purple curve with star-like marks in the graph, resulting from the simulation run, where the inlet temperature of the mass equals the nominal temperature of the dosing unit, shows once more that the further thermal history of the material in the given situation is far from being comparable with the real data. Apparently, this is the result of neglecting the shear-induced temperature increase in the dosing phase. This difference has significant effects on the state of cure in the molded part, as will be shown later.
For the subsequent process simulations, the starting temperature at the inlet was increased to 105 °C in 5 K steps. The results show a stepwise approach of the simulated temperature to the real measurements. Nevertheless, none of the calculated runs enabled an entire match between simulation and process data. On the one hand, the curve contributing to an initial mass temperature of 100 °C fits well in the first phase of the filling process, where the system moves towards a constant mass flow, but slightly deviates in the remaining filling time. On the other hand, the plateau region of the temperature curves, which is associated with continuous flow conditions, is approximately consistent with the real data when the material enters the mold with a constant temperature of 105 °C. In this case, however, the initial temperature rise significantly mismatches the measured values. The only run with satisfactory compliance in both phases of the filling process was obtained when the axial mass temperature profile during filling, determined from a previous run and derived from the experiments at the test stand, was included.
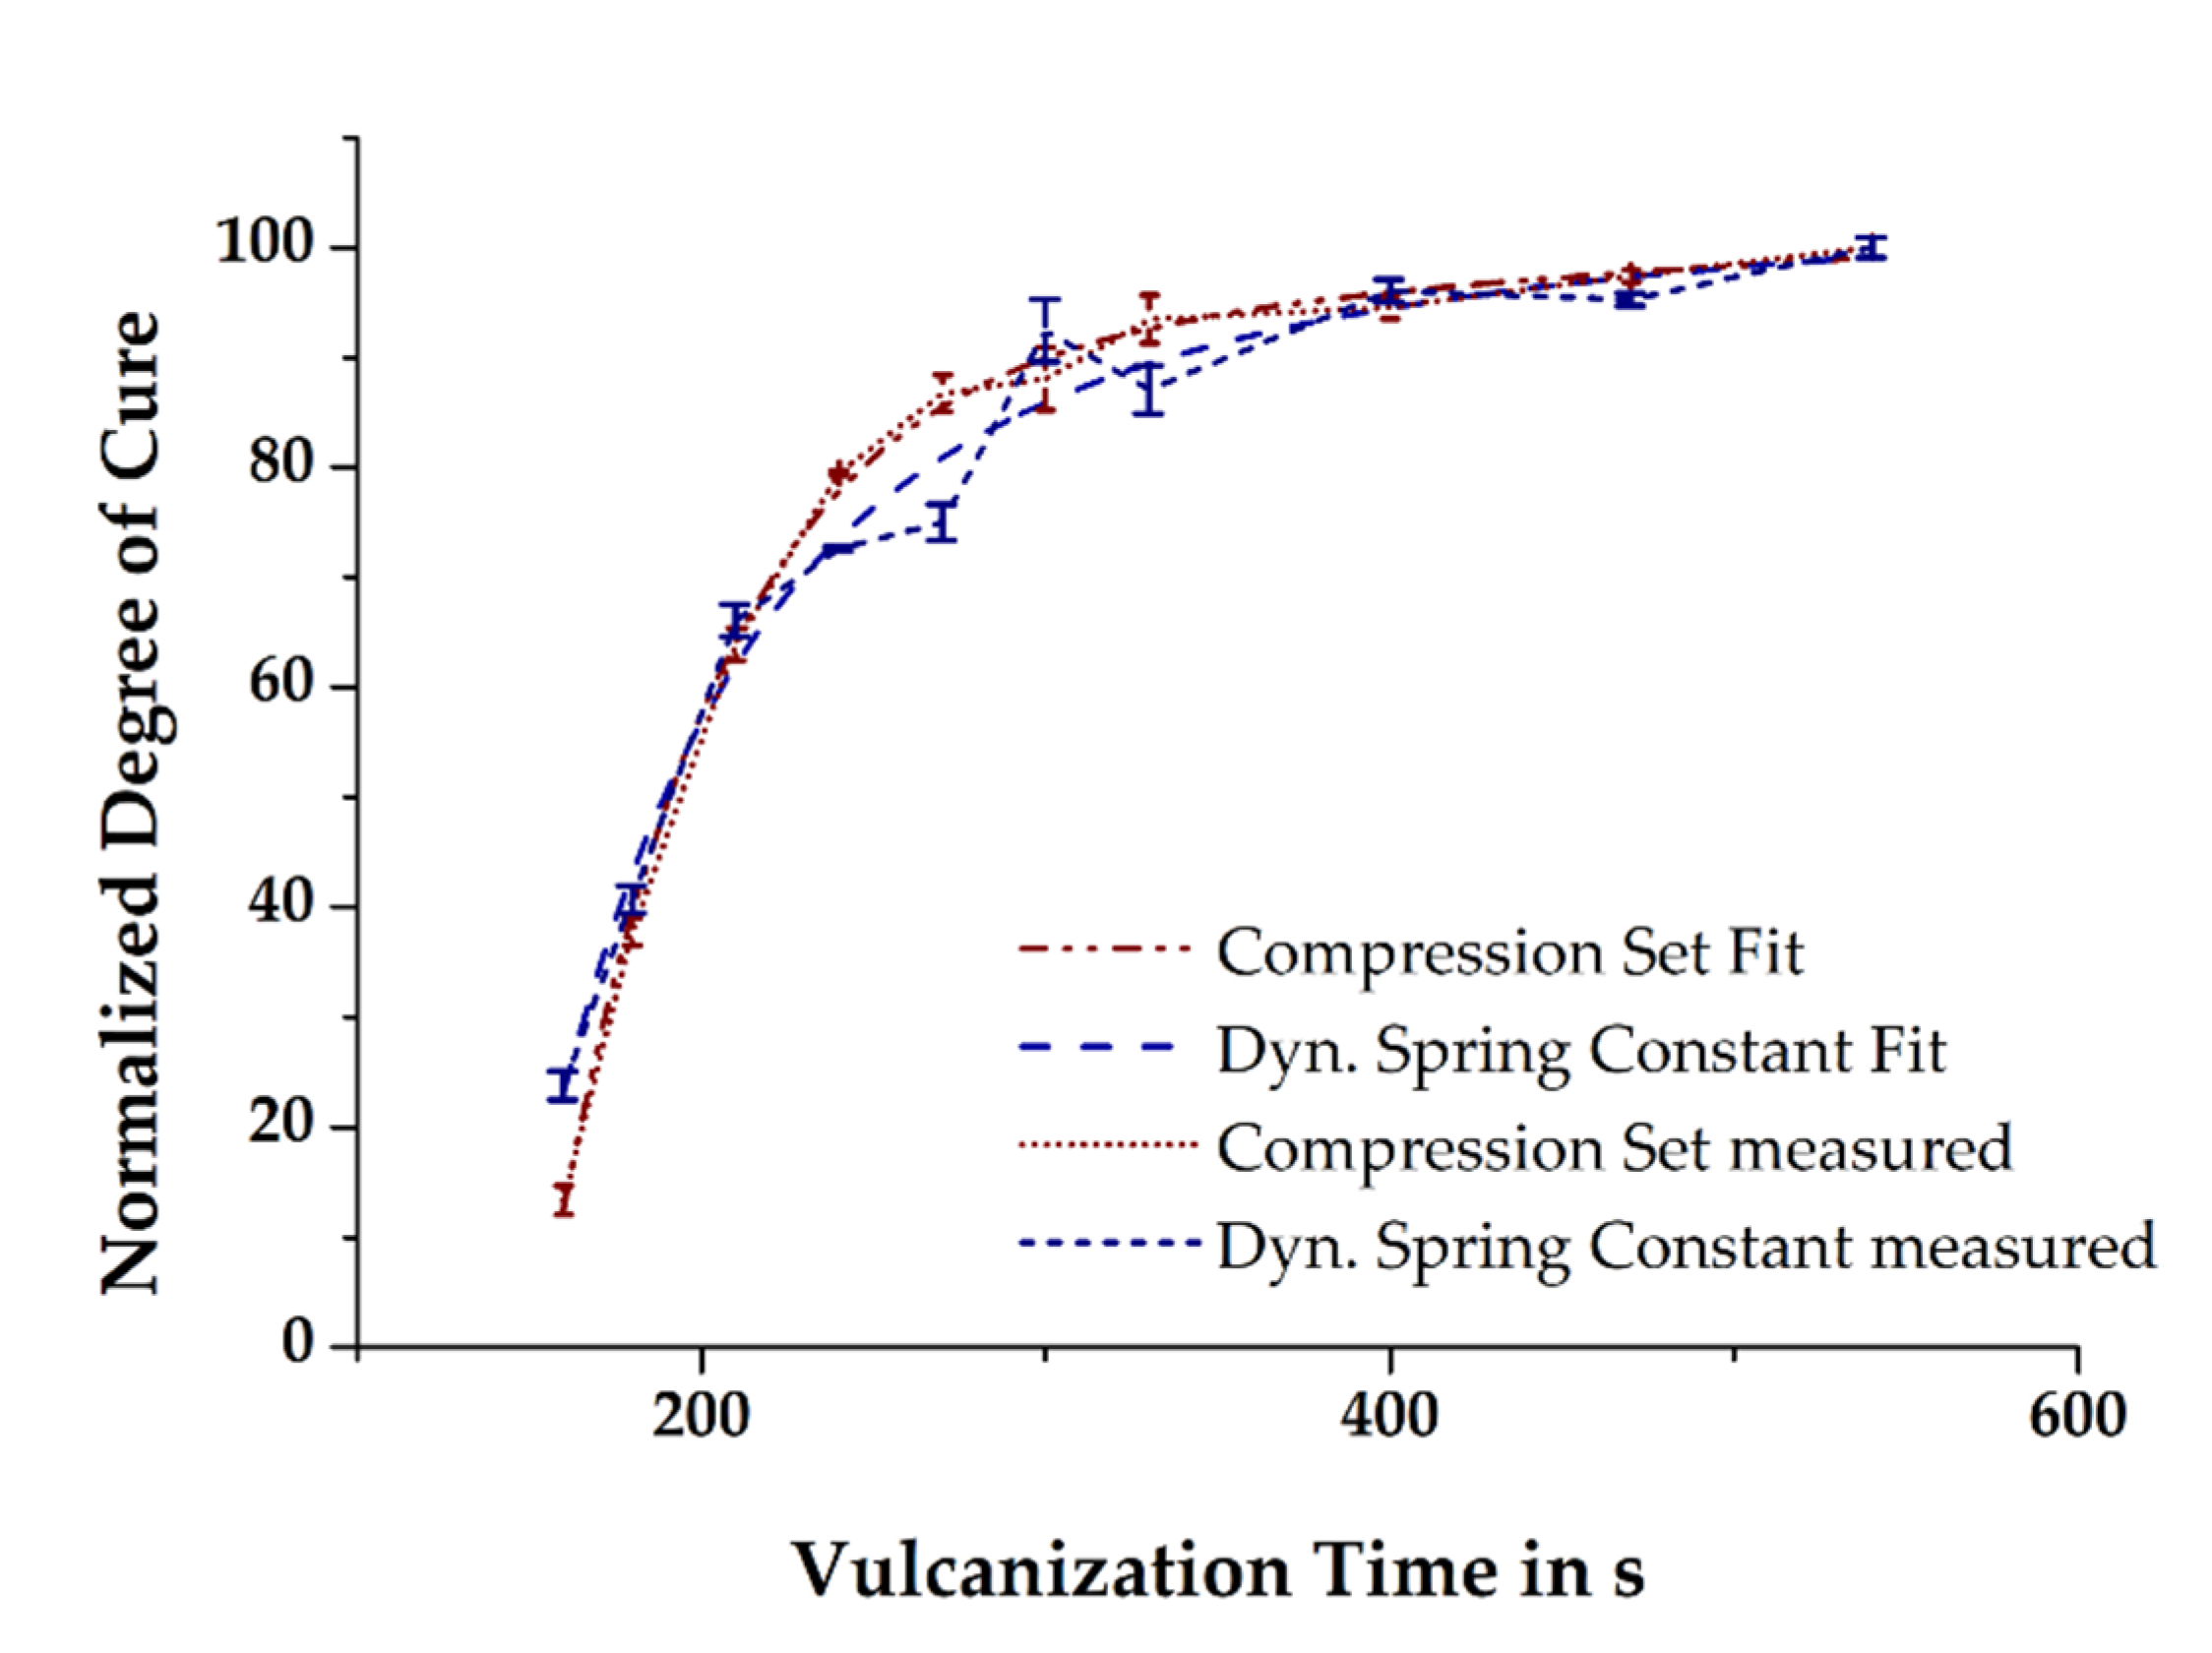
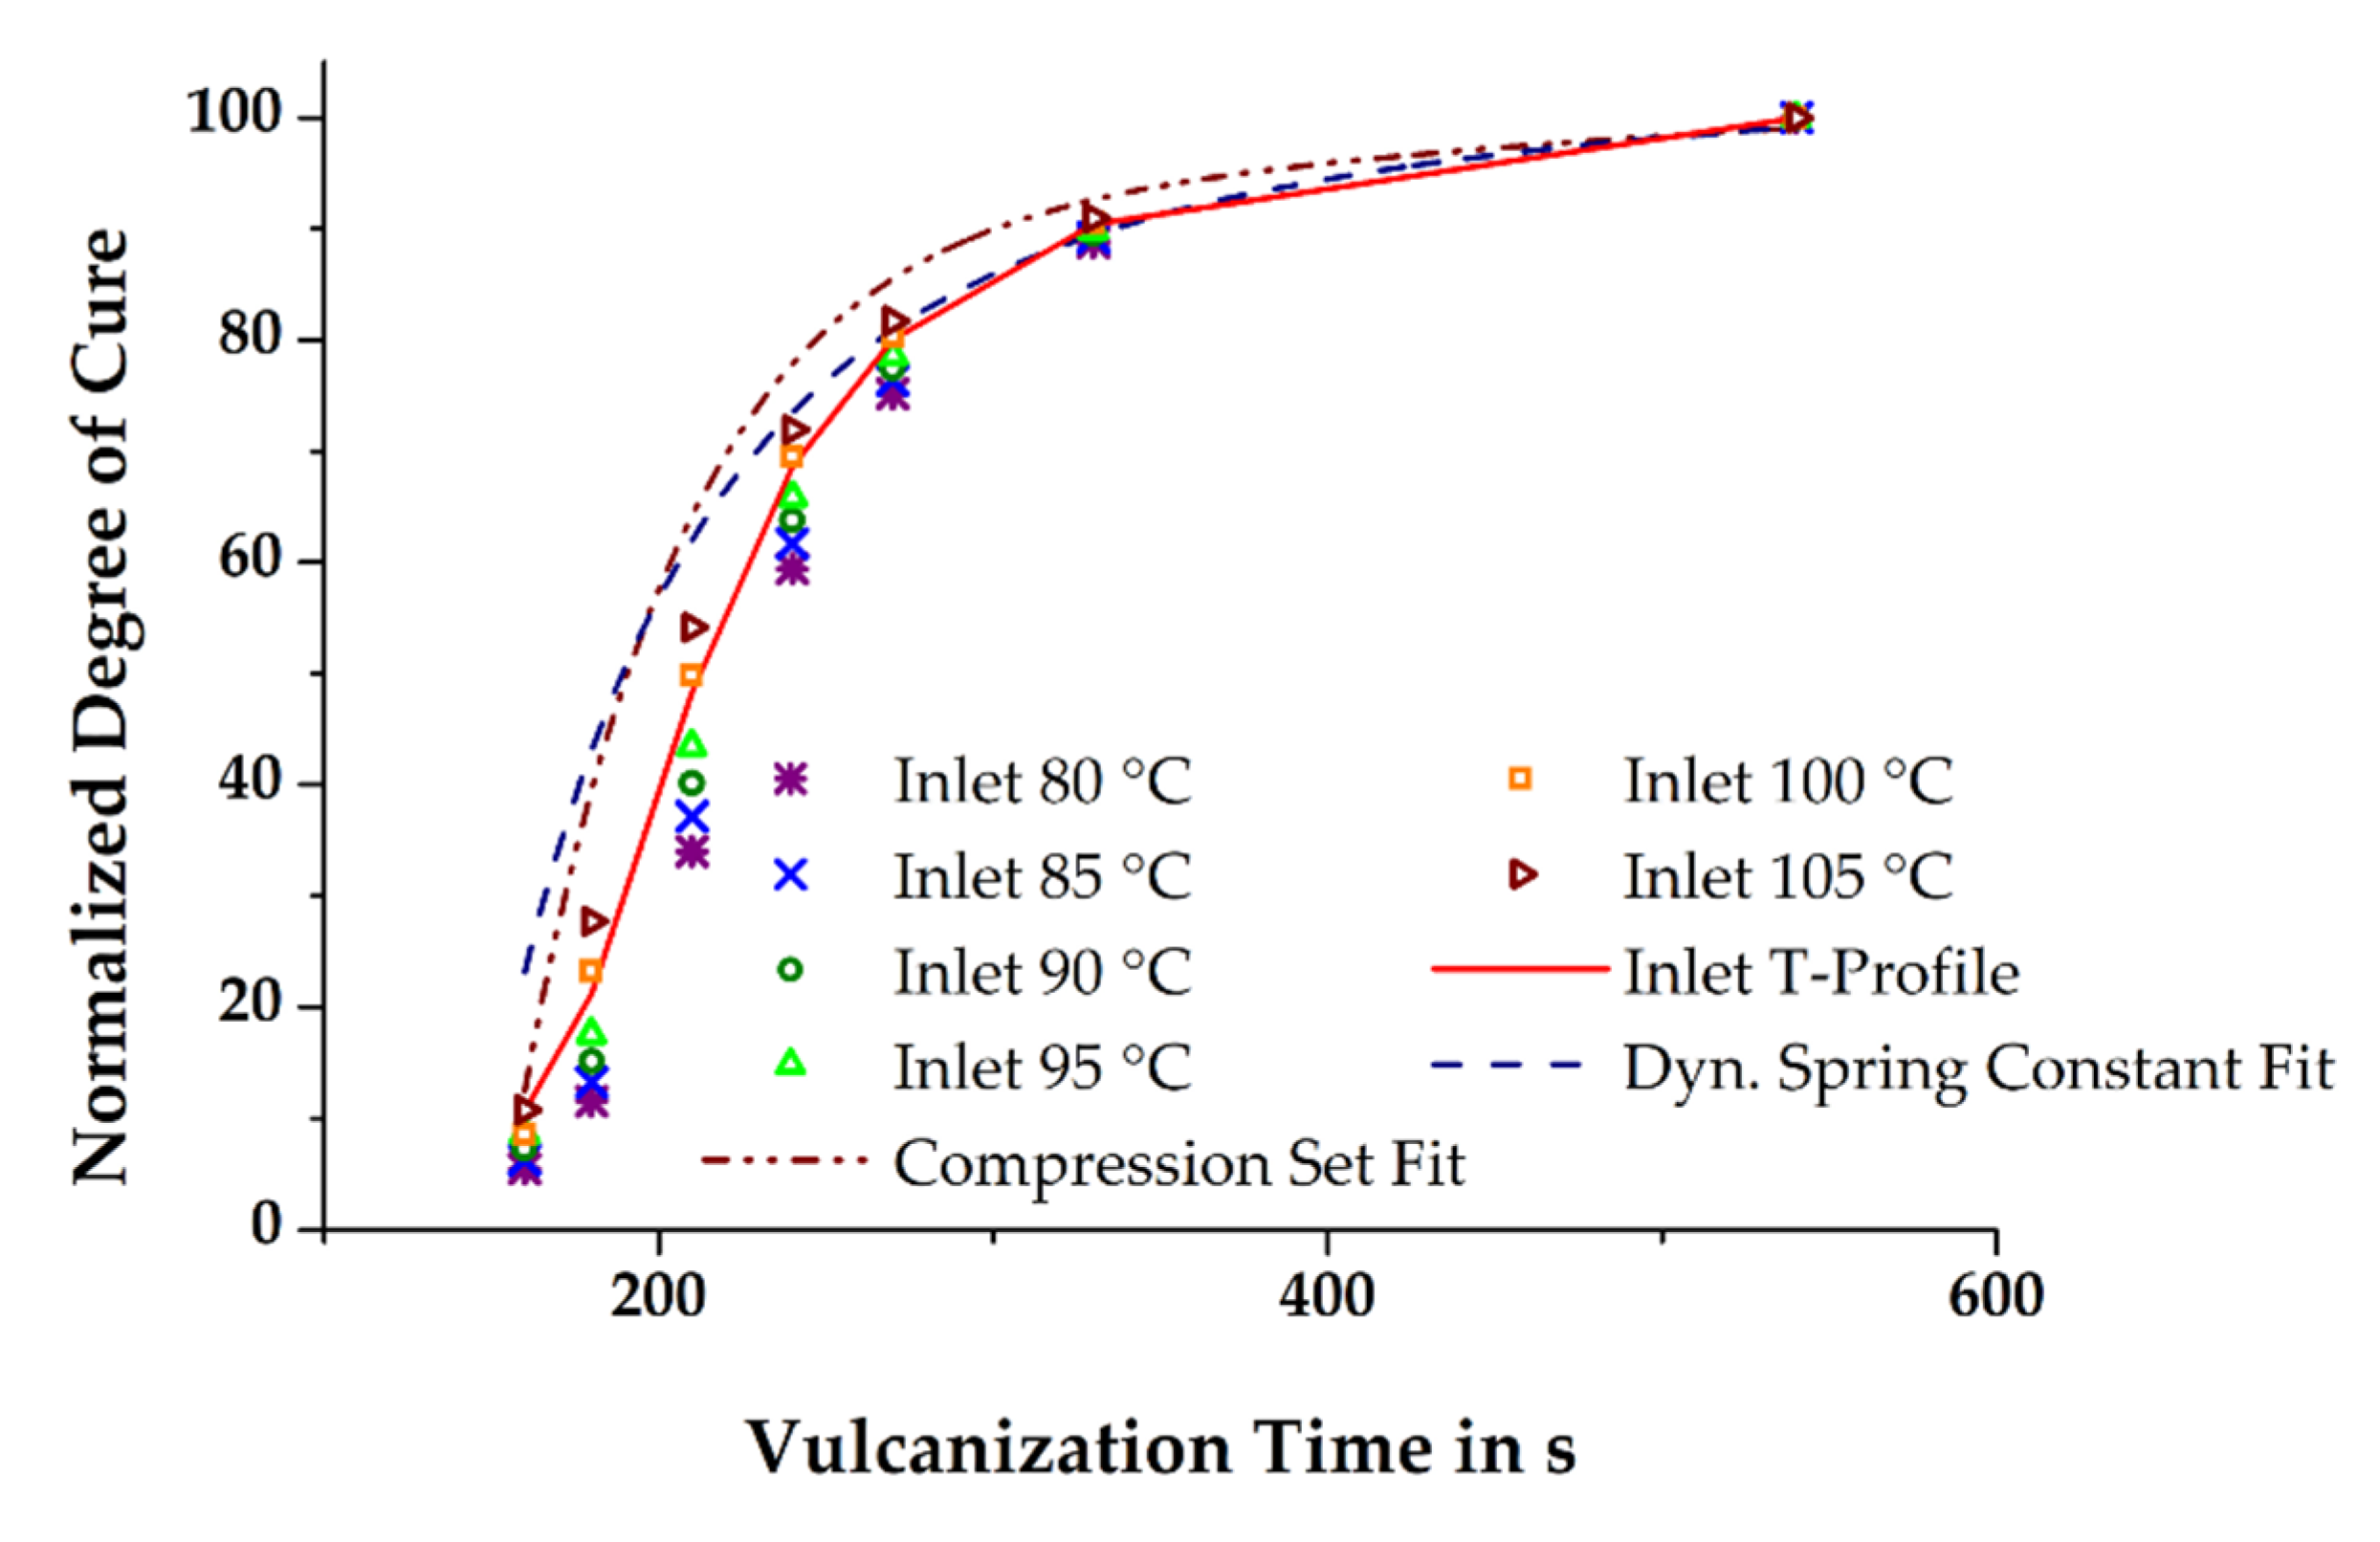
In the previous section, it was briefly mentioned that the simulated state of cure in the molded part depends on the initial mass temperature, among other factors. Thus, it is hypothesized that the more accurate is the prediction of the relative degree of cure in the simulation compared to that of the measured relative degree of cure in injection-molded rubber parts, the better is the temperature profiles of the simulated and the real process match. The relative degree of cure of the moldings vulcanized at 160 °C and in the time range 160–540 s was determined by means of CS and the dynamic spring constant was derived from DMA. Assuming the vulcanization reaction to be completed within the given maximum time, the results obtained were normalized by taking into account the time dependency. Ultimately, curve fitting of the normalized data demonstrates the excellent comparability of the two different analytical methods (see
Figure 8) and thus provides the opportunity for a direct correlation of the measured mechanical properties with the simulated relative degree of cure.
The corresponding progress of the vulcanization reaction in the simulation was calculated with the SIGMASOFT
®-specific function “Evaluation Area”, which determines the mean values of a desired part, e.g., the relative degree of cure, at a preliminary defined time and volume. For this work, the volume was the size of a CS-sample.
Figure 9 depicts the calculated normalized degree of cure of the conducted numerical experiments and compares simulation and mechanical characterization. Firstly, it is evident that the reliability of the numerically-determined results is significantly improved when the thermal history of a rubber compound related to the dosing phase is considered in injection molding simulation. Significant deviation of the relative degree of cure is obtained if the initial set temperature of the rubber compound equals the definitions in the dosing unit of the machine. Due to the missing inclusion of the additional, shear-induced heating of the rubber compound during the dosing phase, the progress of the vulcanization reaction is substantially slower. By increasing the temperature of the material at the entry in steps of 5 K, thus approaching the actual shear-affected mass temperature in steps, the numerically-determined relative degree of cure and the measured results consequently converge. Similar to the previously shown results of the mass temperature passing the sensor point in the cold runner section, the best coherence of the relative degree of cure for a simulation run with a constant inlet temperature of the mass with the run, considering the measured axial mass temperature profile, is obtained at a set temperature of 100 °C. However, this is not simultaneously valid for the comparison of simulation and real process data. Interestingly, the best match was observed with the simulation having a constant initial mass temperature of 105 °C, especially at short vulcanization times, even though the virtual process with the considered axial mass temperature profile is expected to fit best. A conclusive explanation for this is not readily apparent.

 ,
, 


