1. Introduction
Microfluidics is a maturing field with broad applications ranging from chemical detection [
1] to drug discovery [
2]. Microfluidics has also made important contributions to biomedical research [
3] such that biomedical microfluidics is an important tool for applications such as monitoring the extracellular environment [
4], generating resource gradients [
5], and many strategies for single cell analysis [
6,
7]. Many microfluidic techniques employ the optical properties of the fabrication material such as optical trapping [
8], optical chemical sensing [
9], or studying drug delivery in the tumor microenvironment [
10].
Traditional materials used in the fabrication of microfluidic devices, such as glass or polydimethysiloxane (PDMS). The use of PDMS is especially common because the fabrication and assembly protocols are well developed, and for the two most common PDMS products, Sylgard 184 by Dow Corning and RTV 615 by Bayer Silicones, the physical properties are well characterized [
11]. PDMS is also compatible with most soft lithography techniques and uses reagents and processes that are readily available to most labs. One important drawback to these materials is their high refractive index relative to water, resulting in artifacts at the interface between microfabricated structures and aqueous solutions. This causes ambiguity in measurements made near material interfaces using quantitative microscopy techniques such as localizing fluorescent signals or quantitative phase imaging (QPI) [
12].
QPI is a technique that measures the phase shift of light as it passes through a transparent sample such as a microchannel structure or live cells. The measured phase shift is linearly related to the mass of a cell, making it highly relevant for studying cell growth in response to biological perturbations in the context of drug discovery or disease diagnosis [
13,
14]. By measuring the phase shift of light as it passes through structures in the field of view, QPI measures the integrated difference in refractive index between the different materials through the optical path. This quantity is called the optical path length. If the difference in optical path length is large (such as in the case of typical depth PDMS channels and aqueous media), then this results in a phase shift that is larger than a wavelength of light, causing ambiguities in the measurement due to the periodicity of light. This limits the applicability of microfluidics to QPI due to the importance of water as a solvent for many microfluidic applications, including biomedical microfluidics.
One solution is to increase the refractive index of the aqueous medium by tuning with an additive such as a high mass polysaccharide, increasing the refractive index of the solution [
7]. However, this comes at the cost of changing the composition of cell culture medium optimized for the growth of cells in culture and is less ideal for live cell imaging during long experiments. Alternatively, fluorinated polymers with a similar refractive index matched to that of water have been shown to eliminate artifacts arising from optical measurements in aqueous media in the presence of microfabricated structures, such as microchannels and microwells [
12,
15,
16,
17,
18]. However, the most important challenge for using low refractive index polymers for microfabrication is that fluorination creates materials that are notoriously nonadherent and chemically stable. This makes it challenging to seal index-matched microfluidic devices to a substrate in order to establish steady fluid flow through the device. Typical device operation reported previously requires clamps, increasing the likelihood of breaking the substrate or using an ultraviolet (UV)-curable adhesive layer, which if applied incorrectly can clog the channel during the fabrication process [
15].
Previous studies of UV-curable adhesives made by a specialty manufacturer, Norland Optical Adhesives (NOA), have demonstrated the usefulness of UV-curable polymers for microfluidics and nanofluidics. For example, molds made using NOA63 were shown to be readily fabricated using a UV oven, and they could readily reproduce high aspect ratio nanofluidic channels with high precision [
16,
19]. This material can also be readily hydrophilized for use with aqueous solutions in microfluidics [
19,
20,
21]. Such devices allow for flow using only capillary action without the need for an external energy source to drive flow [
20,
21].
Another UV curable polymer that has been shown to have important applications is NOA81, which has useful applications for creating films with microfluidic channels called microfluidic stickers. This process was used to bond microchannels to a glass substrate [
22]. This technique takes advantage of the porosity of PDMS to allow oxygen to inhibit the polymerization on the surface of the material, creating a thin layer of uncured polymer. After pressing the microchannel against a glass substrate, the uncured polymer is cured in an anaerobic environment, causing the film to adhere to the glass substrate [
22]. It has been shown that the surface properties of this material can also be readily modified so that it can have a wide degree of applications to both hydrophilic and hydrophobic solutions [
23], as well as being compatible with electrowetting for carefully controlling aqueous wettability while maintaining a hydrophobic surface for digital microfluidics [
24]. NOA81 also readily adheres to wet substrates such as glass slides or cover slips, such that live adherent cells can be studied in a millifluidic environment without having to seed and grow the cells in the channel, preserving the tissue organization for studying multicellular systems [
25]. This approach omits the use of mechanical force, allowing the technique to be applied to thin substrates such as coverslips, making this approach compatible with high numerical aperture (NA) objective lenses, which are often limited in application due to the short working distance characteristic of high NA objectives.
Here, we demonstrate the assembly of an NOA1348 microfluidic sticker that can be laminated to a glass substrate. NOA1348 is a fluorinated polymer with a low polarizability, resulting in a low refractive index similar to that of water (
n = 1.33). Previous work with this material has demonstrated that it can be used as a low refractive index medium for constructing endoscopic probes for deep tissue imaging for disease diagnosis in the brain, esophagus, or the coronary artery [
26]. Here, we show that NOA1348 is compatible with soft lithography techniques and is curable in a UV oven, making it readily integrated into existing microfluidic fabrication workflows. Therefore, this method provides a reproducible and biocompatible method to fabricate microfluidic devices with the refractive index matched between the substrate and aqueous cell culture media. We describe the fabrication method and demonstrate its application to single cell trapping structures. Finally, we show that NOA1348 devices constructed using our method have 1.8% temporal and 4.2% spatial repeatability. This enables applications of this device and fabrication method to applications requiring high-precision optical measurements.
2. Materials and Methods
2.1. Master Mold Fabrication
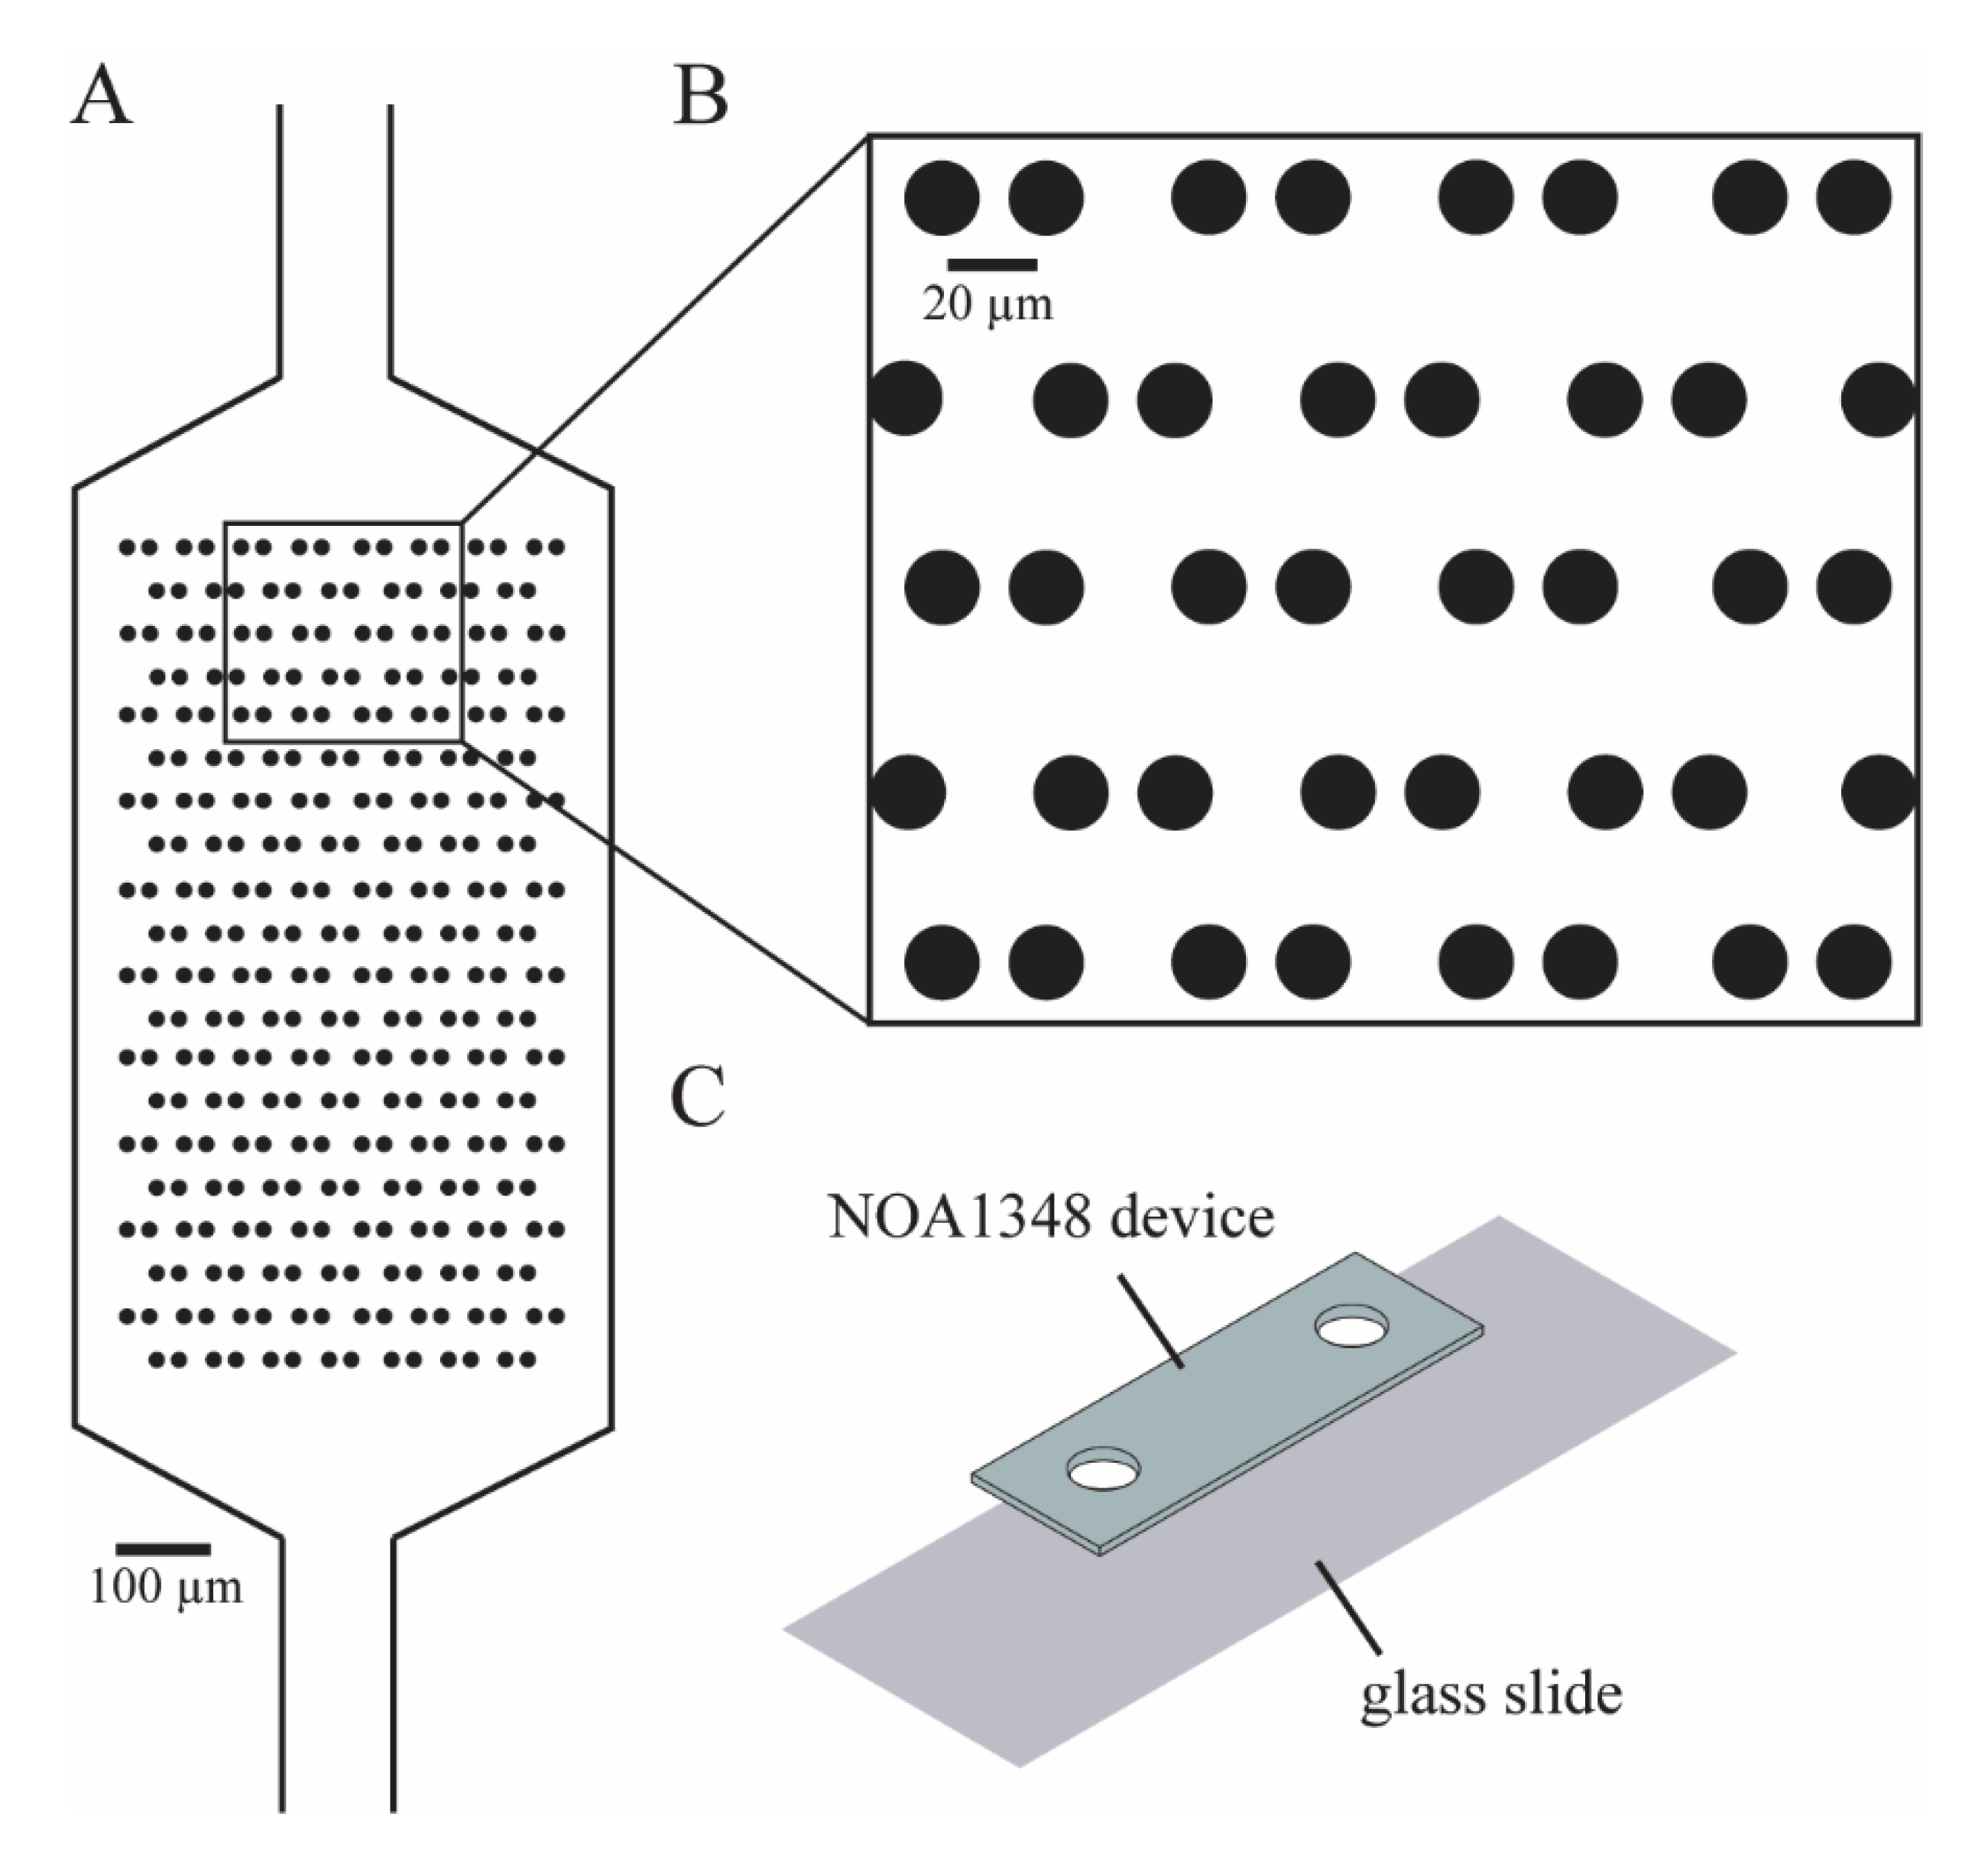
We designed our microfluidic devices using Autocad (Autodesk, San Rafael, CA, USA) as shown in
Figure 1A, such that we could maximize the number of cells caught in the cell trap array. The enlarged traps in
Figure 1B shows that each trap consists of two identical cylinders (circular cross-section shown), with a small gap in between them to allow flow to direct cells toward the empty traps. We imported the Autocad design (see
Supplementary Materials) into a high-resolution photolithography mask pattern generator (Heidelberg 101, Heidelberg Instruments, Heidelberg, Germany) in the University of Utah Nanofab in order to directly write the pattern for the microchannels onto the photoresist, which was then developed to make a mask. To make the SU-8 master molds on a 4-inch silicon wafer, we first diluted SU-8 50-100 negative photoresist (MicroChem Laboratories, Round Rock, TX, USA) with a 20:1 mass ratio of photoresist to cyclopentanone to thin out the SU-8. We spinned the photoresist onto the wafer at 2500 RPM for 1 min to create a film of 10 μm nominal (9.8 μm measured) thickness. Then, we used contact lithography to expose the photoresist with 280 mJ/cm
2 of UV light, prior to developing the SU-8. Then, the thickness of the film was confirmed using a confocal scanning microscope (Olympus Corporation, Shinjuku, Japan). Finally, the SU-8 master was treated with trichloro(1
H,1
H,2
H,2
H-perfluorooctyl)silane (PFOTS) (Sigma-Aldrich, St. Louis, MO, USA) to facilitate the release of molded PDMS from the fine trap structures.
2.2. Validation of Microchannel SU-8 Mold Dimensions
To validate the height of the microchannel, we used a commercially available Olympus LEXT confocal laser scanning microscope (Olympus Corporation, Shinjuku, Japan) to measure the step height from the silicon wafer to the top of the fabricated SU-8 master mold. This microscope measures step height by finely moving the objective lens in the z-direction (as small as 10 nm), in order to determine the height at which it achieves the highest intensity at each pixel. By recording the height at which the maximum intensity was measured at each pixel, the microscope measures the step height of the microchannel. This tool also measures the lateral dimensions of the microchannel features by measuring the pixel distance between the step measurements on each side of the microchannel.
2.3. Validation of PDMS and NOA Dimensions Using Brightfield Microscopy
We validated final PDMS and NOA1348 device dimensions using brightfield imaging after calibrating the distance per pixel with a stage micrometer (1 mm with 10 μm divisions).
2.4. PDMS Mold Fabrication
We used the SU-8 master to make a PDMS mold from which many NOA1348 devices could be made. To make our PDMS molds, we first molded the PDMS (Sylgard 184) on the SU-8 master to make a negative of the master. This negative is a replicate of the microchannel and can be used to make a mold for the microchannel. We trim the negative and treat it with PFOTS overnight before casting the mold. To make the mold, we first make a PDMS square that is 50 mm × 50 mm × 1.5 mm and cut a 10 mm × 20 mm rectangle out of the center of it. We place this over the negative so that the microchannel is centered in the cut-out rectangle and fill it with PDMS. Then, we pressed a slide on it to flatten it and cure it in a 65 °C oven for 3 h to cure.
2.5. Device Fabrication
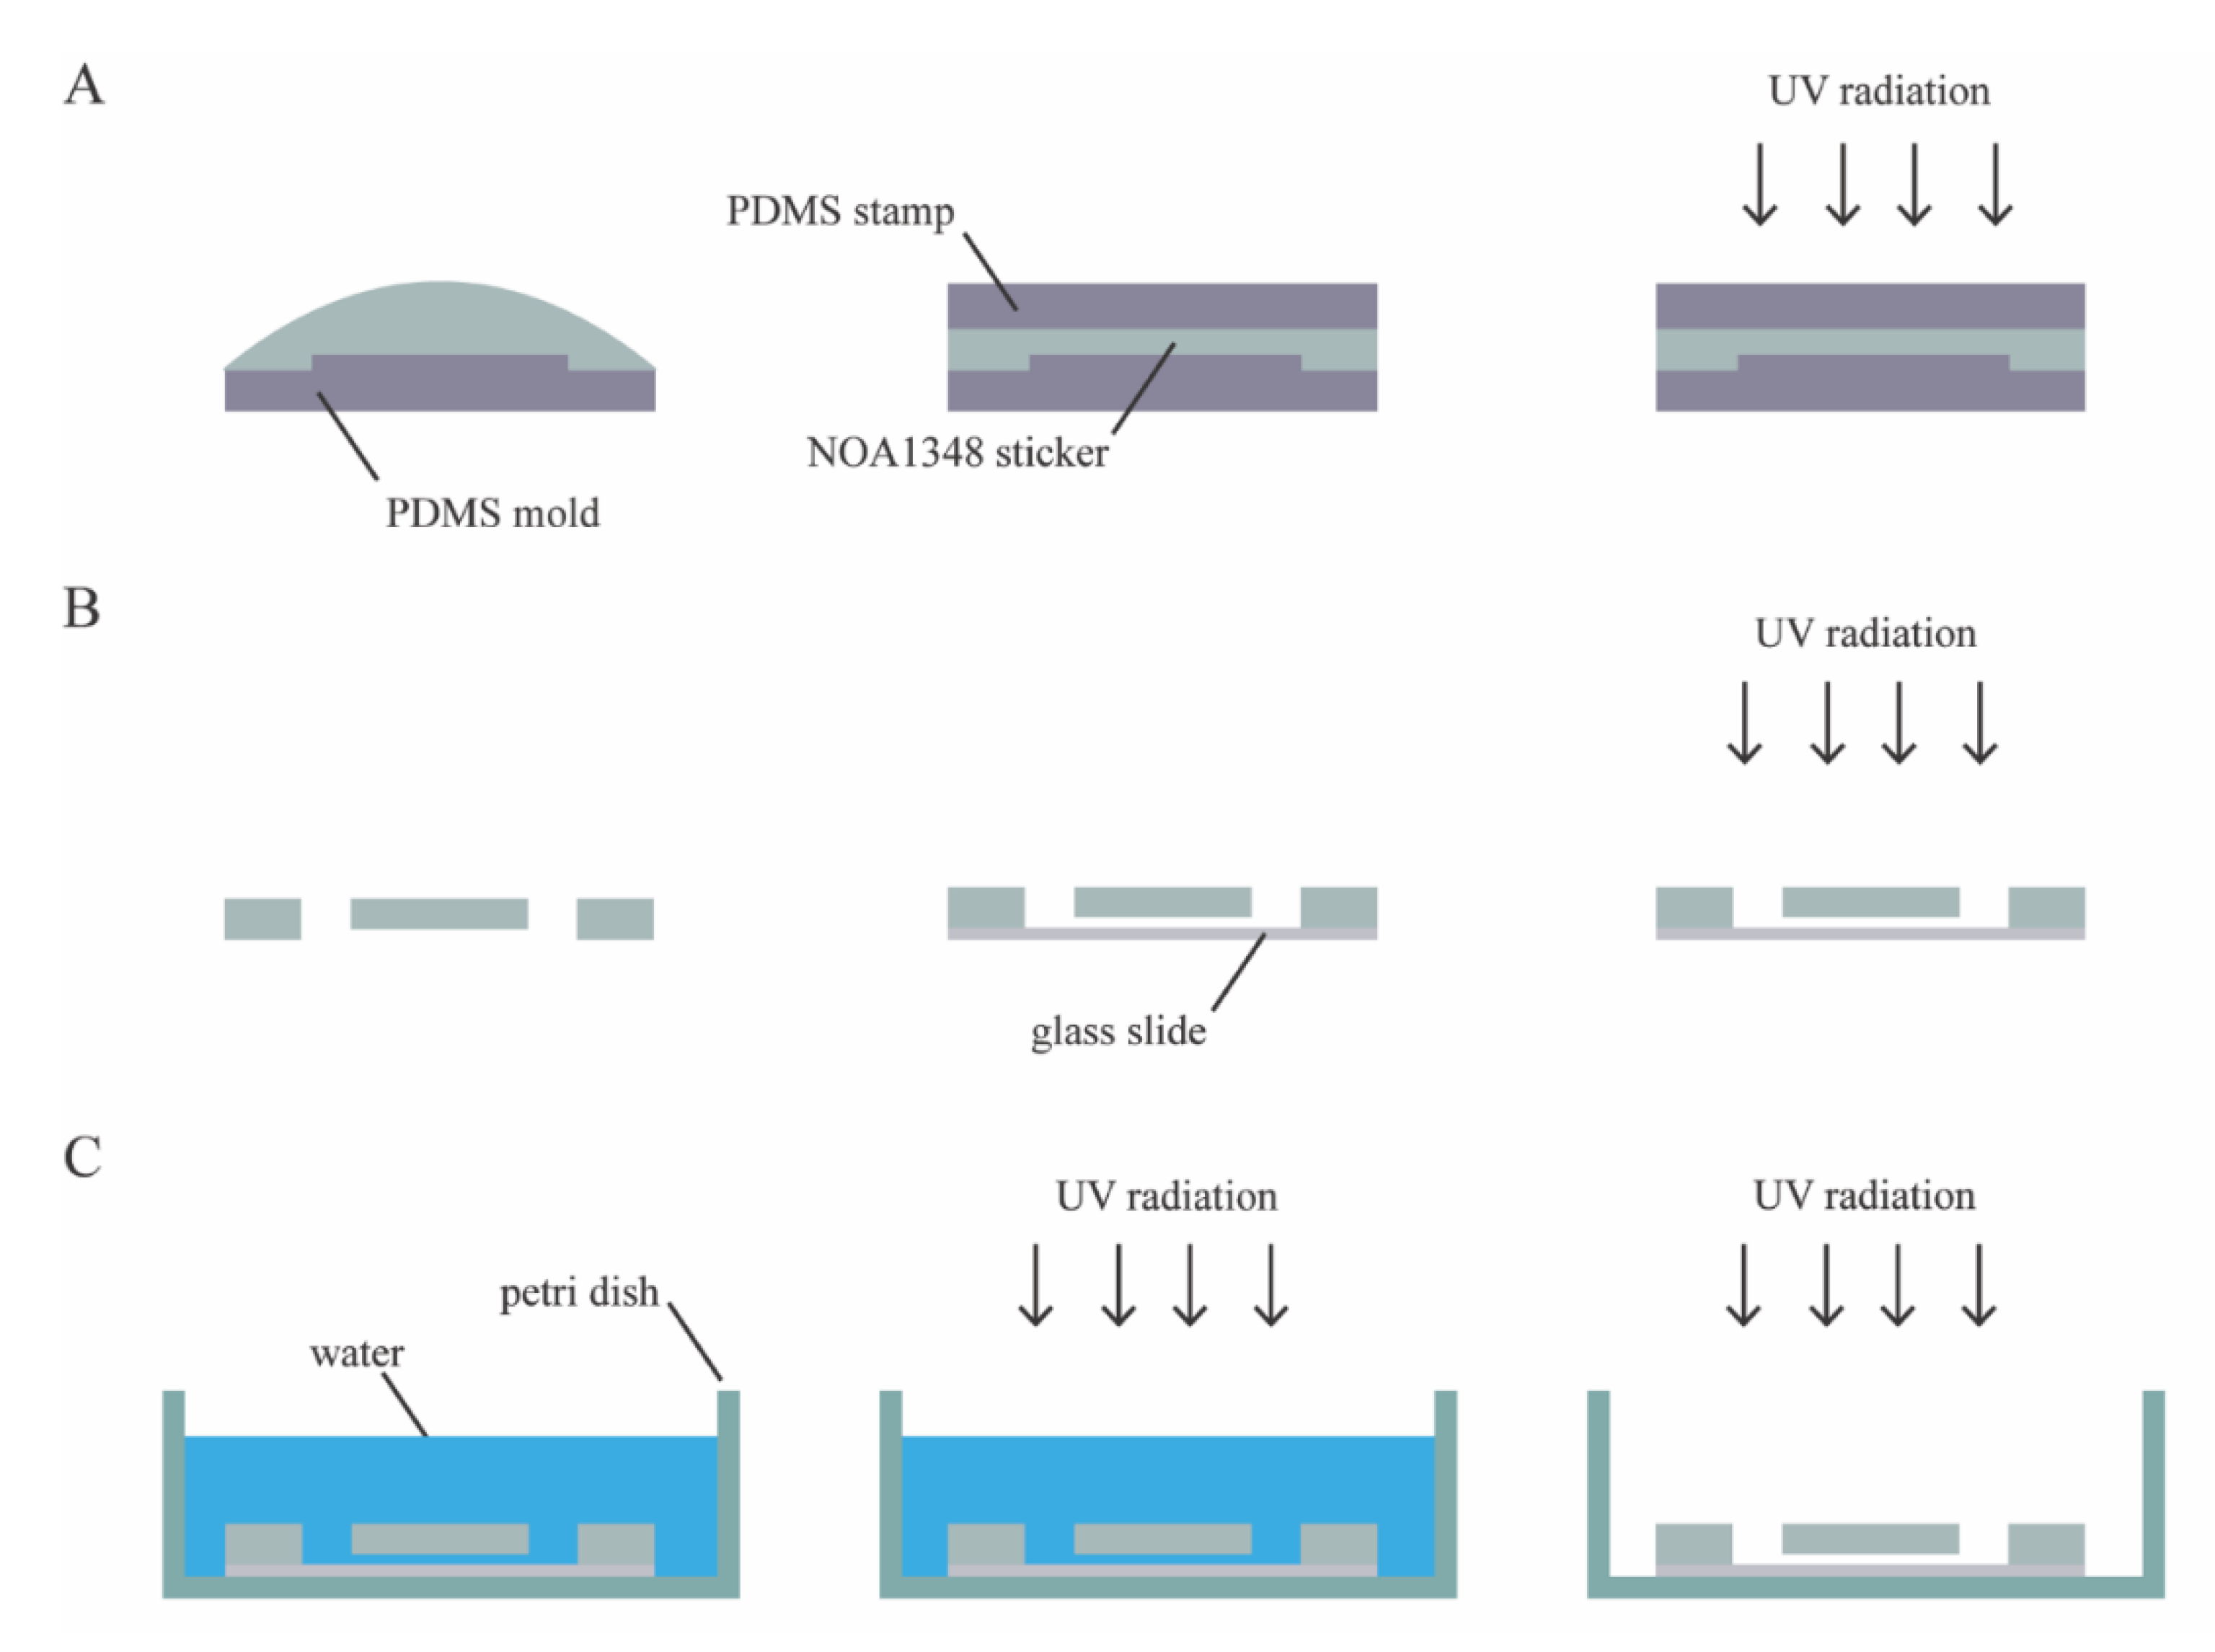
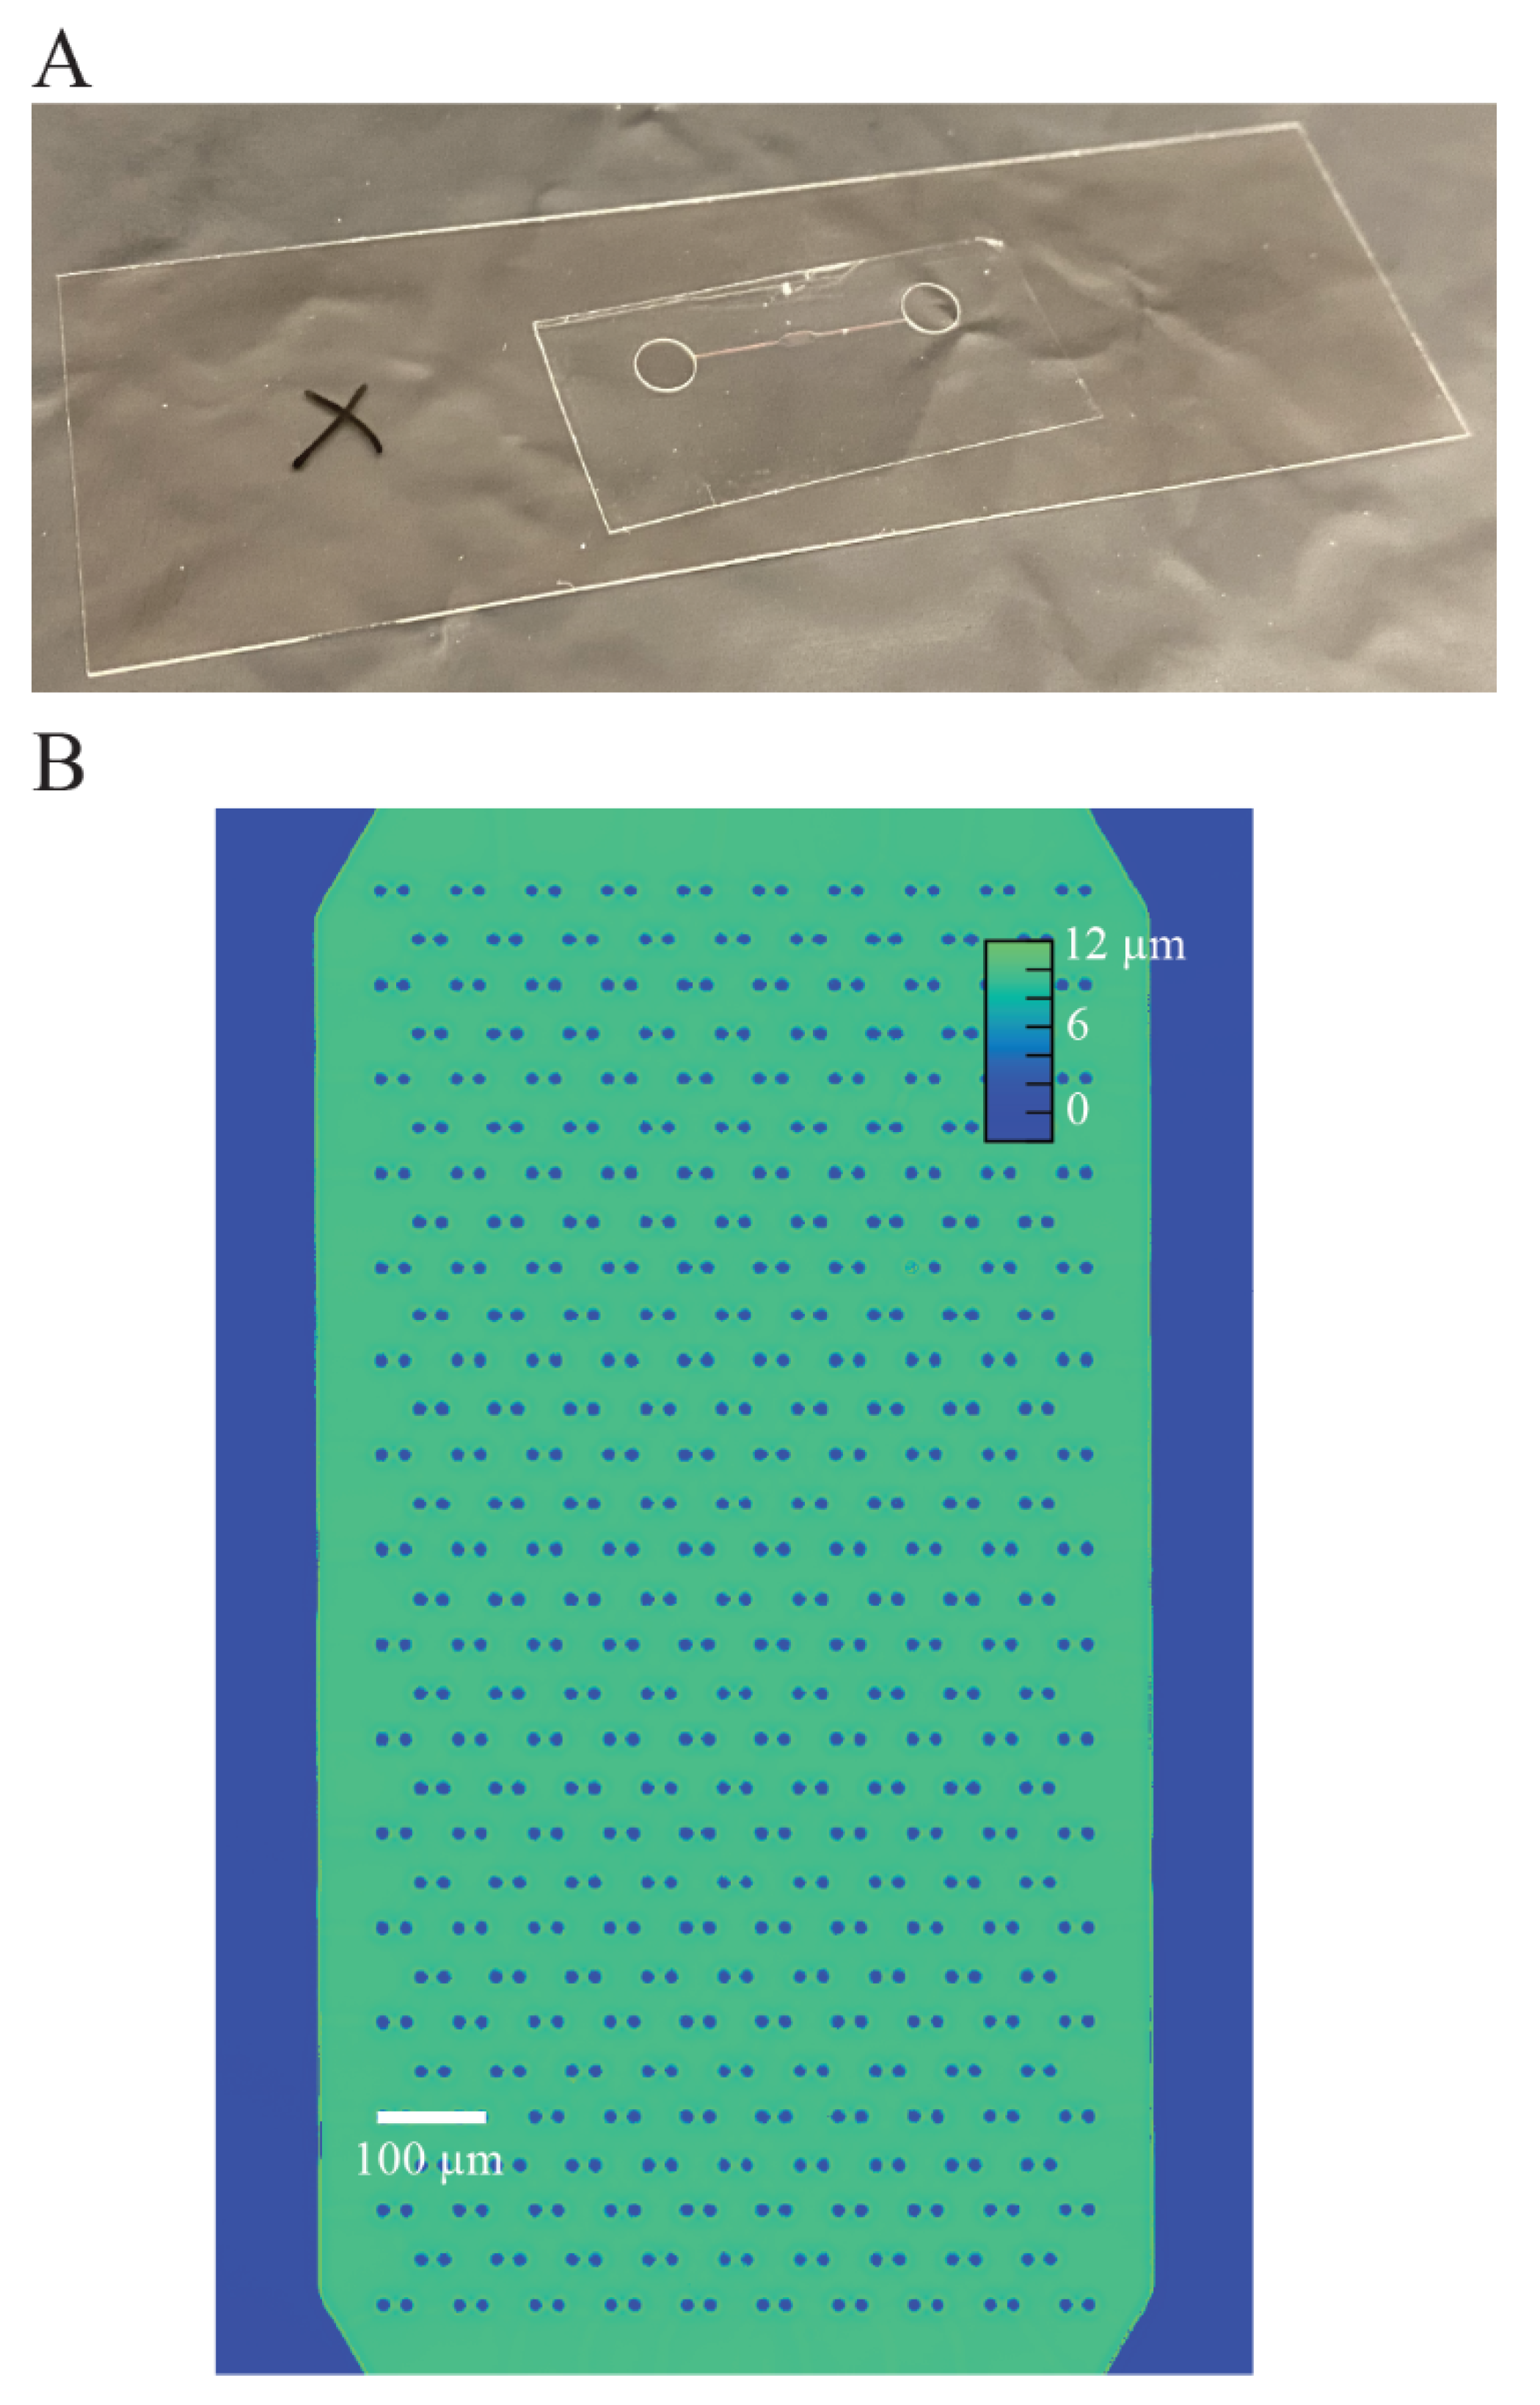
The microfluidic device consists of a single layer of NOA1348 (Norland Optical Adhesives, Cranbury, NJ, USA) bonded to a glass slide, as shown in
Figure 1C. To make the microchannel, we pipetted 100 μL of NOA1348 directly onto the PDMS mold, as shown in
Figure 2A. Then, the NOA1348 is degassed for approximately 20 min until there are no bubbles left to ensure that the traps fully develop when cured. We used a clean piece of PDMS to stamp the NOA1348 while not introducing any bubbles. After flattening the uncured material, we put the mold in the UV oven (Uvitron International, West Springfield, MA, USA), set the power to 200 W, and cure for only 10 s. This allowed the traps to develop fully, while simultaneously leaving behind a thin uncured polymer layer similar to a previously described technique [
12,
22]. After this short curing step, we peeled the flat piece of PDMS off of the NOA1348 prior to removing the sticker from the mold. Then, we assembled the device, as shown in
Figure 2B. We placed the sticker on a self-healing mat and punched holes for reservoirs using a biopsy punch to make holes for reservoirs. We placed the sticker on a glass slide cleaned with acetone with the channel side facing down. We pressed hard on the microchannel to make sure there are no air gaps between the device and the glass substrate and then placed it back in the UV oven to cure for 100 s at 200 W.
Figure 2C shows the final curing step and sterilization of the device. To finish curing, we submerged the assembled microchannel in water to prevent any inhibition of the polymerization reaction due to oxygen [
22] and then cured the submerged microchannel for 100 s. To prepare the device for cell culture, we put the microchannel in a cell culture dish and wrapped it in parafilm to seal it. Then, we put it back in the UV oven for 3 h, at 400 W, to completely sterilize the microchannel. This step served the dual purpose of sterilizing the microchannel and modifying the surface chemistry of the NOA1348 to make it more hydrophilic so that water fully wets the features inside the microchannel.
2.6. Imaging Method
After filling the microchannel with cell culture media, we used differential phase contrast (DPC) QPI to measure the optical volume of the traps every 5 min for 2 h. DPC QPI is a technique that uses asymmetric illumination to capture the phase gradient of a transparent sample [
27,
28]. This was implemented on a standard compound microscope by removing the illumination source and replacing it with a programmable 8 × 8 red LED array (Adafruit, New York City, NY, USA) driven by an Arduino Metro M4 (Adafruit, New York City, NY, USA). We illuminated the sample using opposite halves a circle to obtain two images, from which the phase gradient can be determined using the equation [
28,
29]:
This was repeated for both orthogonal directions from which the phase shift can be determined to measure the phase shift of light as it passes through transparent materials such as the microchannel structures or through cells.
2.7. Optical Volume and Mass Determination Using DPC
The measured phase shift represents the optical thickness of the transparent material. This was used to measure the optical volume by integrating over the area of the object [
13]:
where
ϕ is phase shift as a fraction of a wavelength,
λ is wavelength, and
A is the area of the object. We validated this approach by comparing it to the theoretical optical volume of the cylindrical cell traps, which can be determined using the equation:
such that
r is the radius of the cylinder,
h is the height of the trap, and
is the difference between the refractive index of the material and the refractive index of solution in the microchannel. The cell mass was measured likewise by integrating the phase shift over the area of the cell and multiplying by the known relationship between the measured phase shift and cell mass as previously described [
13]:
The conversion factor,
is known as the specific refractive increment, and it is the slope of the linear relationship between the refractive index and biomolecule concentration inside a cell, d
n/d
c, which is accurate within about 5% for most cells [
13]. The value of
used in this study is
m
3/kg, and the wavelength of the LED array we used is
m.
2.8. Refractive Index Measurement Using Abbe Refractometer
To validate the refractive index for our particular lot of NOA1348, we aliquoted a small amount onto the refractive prism of an Abbe refractometer. The refractometer uses an illuminating prism with a coarse edge to illuminate the sample from all angles ranging from 0 to 90 degrees. This allows the refractive prism to collect all the light over the range of illumination angles. The measurement was made by tuning the refractometer to find the critical angle at which total internal reflection occurs inside the refractive prism [
30]. This measurement was used in order to determine the refractive index of the sample relative to that of the refractive prism.
2.9. Refractive Index Measurement Using DPC
To validate the difference in refractive index between the microchannel fabrication material and the aqueous solution inside the channel, we fabricated a microchannel using the procedure described in
Figure 2. Then, we filled the device using negative pressure applied to the outlet to pull water into the microchannel, and then measured the phase shift using the imaging method described above. The measured phase shift is directly related to the refractive index of the material using the equation [
13]:
such that
ϕ is the measured phase shift as a fraction of a wavelength,
λ is wavelength, and
is the height of the microchannel. We used this measurement to validate that the measured phase shift is consistent with the refractive index of the material measured using the Abbe refractometer.
2.10. Image Processing
To process the images, we constructed a periodic mask outlining trap locations. This mask was computed by measuring the location of three traps in the array to account for any rotation of the microchannel and the known distance between the traps, then creating a repeating diamond pattern of areas in which phase shift (and cell mass) are computed. We used the computed mask to measure the optical volume of the empty trap locations to compute the mean optical volume of the traps in the array. We subtracted the mean optical volume of empty traps from the trap locations containing cells to obtain the optical volume of the cells. We used the optical volume of each cell to compute its mass using the specific refractive increment, which is the known relationship between a cell’s refractive index and its density [
13,
31].
2.11. Cell Culture
We cultured MCF7 cells (ATCC, USA) using Dulbecco’s Modified Eagle Medium (DMEM) (ThermoFisher, Waltham, MA, USA) supplemented with 10% fetal bovine serum (Omega Scientific, Tarzana, CA, USA) and 5% penicillin/streptomycin antibiotic supplement (ThermoFisher, Waltham, MA, USA). To prepare the microchannel for cell culture, we first sterilized it using UV radiation for 3 h with the power set to 400 W. After sterilizing, the microchannel was first filled with a 70% ethanol–water solution to eliminate bubbles from the microchannel. The ethanol–water solution in the reservoir was slowly diluted with sterile water before being flushed entirely with water to clean the ethanol out of the microchannel. Then, the water was flushed out of the microchannel using Dulbecco’s Phosphate Buffered Saline (DPBS) before injecting a 0.01% solution of poly-l-lysine into the channel. We allowed the microchannel to incubate with the poly-l-lysine for 1 h at 37 °C before seeding cells. Cells were washed with DPBS (ThermoFisher, Waltham, MA, USA), tryspsinized to remove them from the plate, counted, and diluted to a final volume of 10,000 cells/mL prior to injecting them into the microchannel device at a flow rate of 1 μL/min.
2.12. Biocompatibility Assay
We cured 30 μL of NOA1348 in cell culture treated 6-well plates and then washed them with 100% ethanol. Then, we washed out the ethanol with deionized water and rinsed with DPBS prior to seeding cells. For the poly-l-lysine condition, we incubated the poly-l-lysine in the appropriate wells for 1 h at 37 °C to immobilize on the substrate. Then, we seeded cells in each well and allowed them to adhere for 24 h prior to counting. Then, we counted 3 wells of each condition every 24 h to measure proliferation each over 4 days, after which cells became confluent in each well.
2.13. Statistics
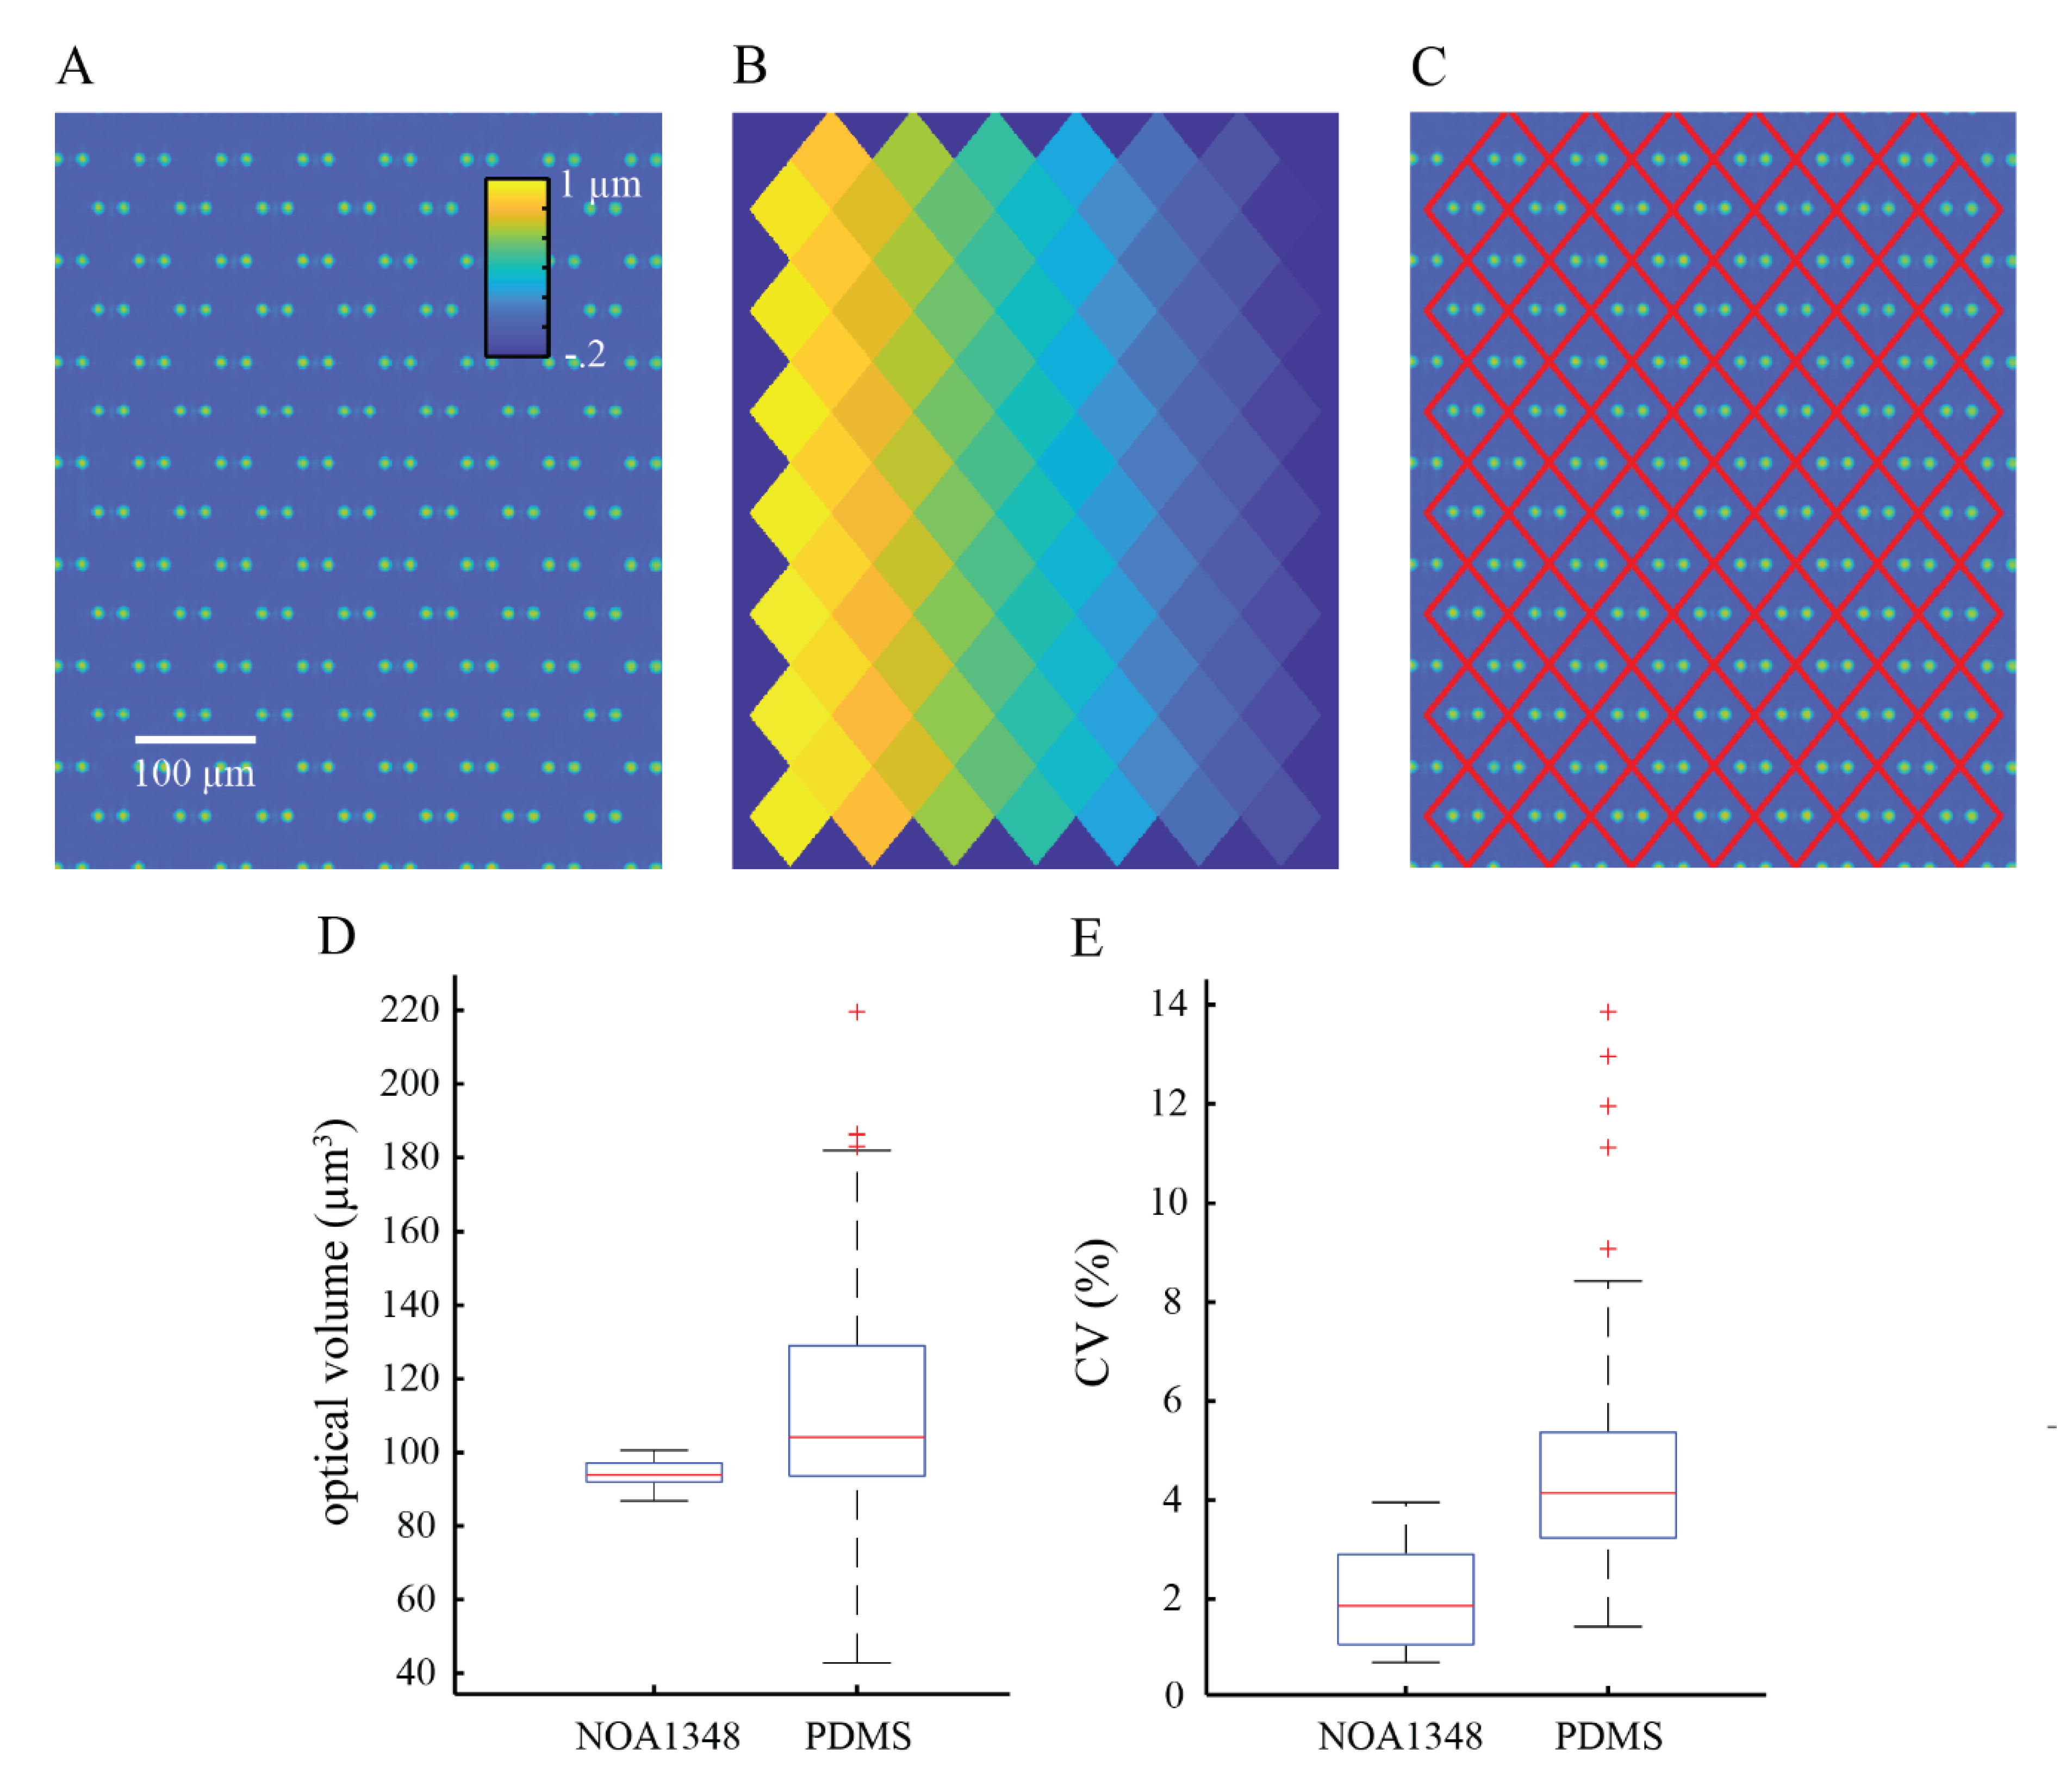
We used box and whisker plots generated in Matlab (Mathworks, Natick, MA, USA) to show the distribution of the raw data collected in this study. The red line shown in the boxplots shows the median of the data, and the blue box shows the data that falls within the interquartile range, such that the middle 50% of the data is contained inside the blue boxes. The 75th percentile is at the top of the box, and the 25th percentile is shown as the bottom of the box. The whiskers show the maximum and minimum data points that are not considered outliers. Outliers are defined as data points that are greater than 1.5 times the interquartile range either above the 75th percentile or below the 25th percentile data points. Outliers are represented by red ‘+’ symbols on the plots.
To summarize the data, we used a measure called the coefficient of variation (CV). The CV is defined as the standard deviation divided by the mean and is used to summarize data spread relative to the mean. The CV is expressed as a percentage such that a low CV represents closely grouped together data points and a high CV represents data that is more spread out.
4. Discussion
We have shown that NOA1348 (n = 1.352) can be used as a viable alternative to traditional microfluidic fabrication materials such as glass, silicon, or PDMS. NOA1348 is a UV-curable polymer that is compatible with most soft lithography techniques, making it readily integrated into the microfabrication workflows currently employed in most laboratories. The most important feature of this material is its ability to enhance the precision of optical readouts in microfluidics applications, employing the use of aqueous solutions (n = 1.33) due to its low refractive index relative to traditional materials such as PDMS (n = 1.43). This becomes especially important when objects inside the microchannel are in close proximity to microchannel structures such as cell traps. We demonstrated the utility of this material for this application using cells in aqueous cell culture media.
In this work, we demonstrated an improved method to fabricate NOA1348 devices by directly bonding to a glass substrate to attach the microchannels to a glass slide. This is an important advantage over existing techniques for working with fluorinated polymers, which often require the use of mechanical force, often creating pressure points for the glass to break [
17,
18]. This made these techniques incompatible with glass coverslips, which readily break under even small amounts of stress. We tested the technique demonstrated here on both glass microscope slides and #1.5 cover glass to demonstrate the wide compatibility of this approach with brittle substrates such as these because it readily adheres directly to a glass substrate.
Another important alternative approach is to use a UV-curable glue to laminate the microfluidic device to a glass substrate [
15]. One important drawback to using a UV-curable adhesive to laminate the microchannel is the risk of clogging the microchannel if the adhesive is improperly applied. A microchannel that is too short or an adhesive layer that is too thick increases the likelihood of clogging to occur. Our approach mitigates this problem by using a thin layer of uncured polymer that readily adheres to a glass slide during a final cure step.
To obtain the best results using this approach, we recommend closely matching the optical path length through the microchannel and the aqueous solution. Since the optical path length difference is the product to both the refractive index difference and the height of the microchannel, we recommend the minimum microchannel height that does not obstruct the flow through the microchannel. This not only reduces artifacts near the interface between the microfabricated structures and objects inside the microchannel but also increases the precision of optical volume measurements in the microfluidic device.
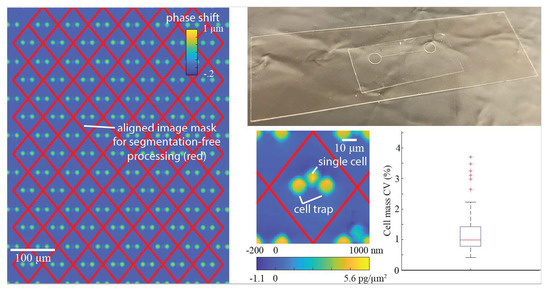
We validated the performance of our index-matched cell trapping device (
Figure 6) using a DPC QPI microscope, which measures the phase shift as light passes through a sample using many angles of illumination [
28,
40]. This gives strong evidence that our fabrication approach should be compatible with other microscopy techniques using wide angles of illumination such as Fourier ptychography, which uses illumination outside the range of the numerical aperture of the objective lens in order to increase spatial resolution and obtain 3D phase information [
41].
This approach can be more broadly applied to microfluidics applications than just aqueous applications. Specialty manufacturers develop a wide range of polymers with varying optical properties, allowing them to be useful for applications requiring a wide range of common refractive indices. For example, Norland Optical Adhesives also makes a polymer that would be ideal for dimethylsulfoxide based applications (Δn = 0.019) such as for the formation of doxorubicin-loaded nanoparticles for controlled drug delivery [
42]. Previous work has demonstrated how some of these materials can be permanently bonded to a glass substrate [
12,
22]; however, our work is the first to demonstrate a reliable fabrication method for the use of NOA1348. Furthermore, the unique optical properties of this material allow us to employ a novel image processing approach that would otherwise be difficult to implement.
An important source of error when measuring optical readouts originating from cells is properly segmenting cells and tracking the cells over time [
34]. The errors here originate from the amorphous morphology of cells, making them difficult to segment. This is further complicated due to the fact that cells are constantly moving, making it difficult to track cells from frame to frame especially when the temporal resolution between frames is low. Here, we position each cell using a cell trap array, such that cells caught in traps do not move throughout the experiment, eliminating the need to track individual cells throughout the experiment. Since the locations of cells are tied to the trap and the traps have highly spatiotemporal repeatability in measured optical volume, we are able to subtract the known optical volume of the traps from the measured optical volume of the combined cell and trap such that we can isolate the optical volume of the cell and repeatably measure its mass throughout an experiment.
Here, we have demonstrated the use of this device for repeatably measuring the mass of cells, and when used for longer imaging experiments, it can readily be used to measure cell growth. Cell traps are important for single cell analysis by separating cells from each other, making segmentation easier. This approach uses a polymer, whose optical properties provides an opportunity to remove cell segmentation from the image processing workflow eliminating errors that are often introduced by it. It also facilitates tracking the cells from frame to frame, because the cell trap array isolates single cells and the temporal stability of the trap optical volume makes it a quantity that can readily be subtracted from the optical measurements of the cells. We demonstrated this image processing approach as a highly precise way to measure cell mass over time.


