
Novel Analytical Method for Mix Design and Performance Prediction of High Calcium Fly Ash Geopolymer Concrete


Abstract
1. Introduction
2. Significance of Research
3. Geopolymer Concrete Database
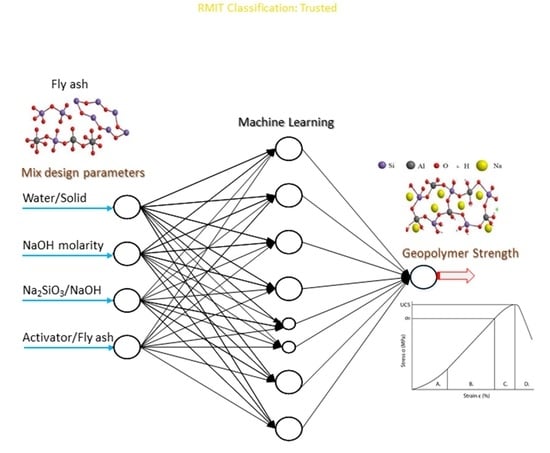
Artificial Neural Network Model
4. Geopolymer Concrete Design
4.1. Contour Plots
4.2. Mix Design Calculation
- (a)
- Alkaline activator content:After solving: Na2SiO3 = 307.8 kg; NaOH = 83.2 kg.
- (b)
- Added water content:After solving: Added water (w) = 2.82 kg (Table 3).
- (c)
- Aggregate content:After solving: 467 kg and 919.3 kg.
4.3. Experimental Procedure
5. Experimental Results and Model Validation
Relationship between Mechanical Properties
6. Summary and Conclusions
- The algorithm for the predictive model for high calcium fly ash geopolymer concrete mix design was developed using artificial neural networks in order to determine the relationship between the four key parameters identified, namely water/solid ratio, alkaline activator/binder ratio, Na2SiO3/NaOH ratio and NaOH molarity, and the 28-day compressive strength of geopolymer concrete.
- A new standard mix design procedure was developed for high calcium fly ash geopolymer concrete using contour plots generated in the MATLAB programming environment, and demonstrated through detailed calculation to ascertain the mix proportions for 45 MPa target compressive strength at 28 days.
- Good correlation between the experimental results and the compressive strengths calculated from contour plots validated the developed novel mix design method for high calcium fly ash geopolymer concrete. Thus, the proposed method is suitable for calculating mix proportions with confidence for a target compressive strength at 28 days in the range of 25–45 MPa.
- A statistical regression model was developed using the database to provide new design equations to predict tensile strength and elastic modulus of high calcium fly ash geopolymer concrete based on the 28-day compressive strengths obtained.
- The design equations available in AS 3600 and ACI 318 standards for Portland cement concrete provide a conservative design for tensile strength in high calcium fly ash geopolymer concrete. However, AS 3600 design equation overestimates the elastic modulus for geopolymer concrete.
- The present study suggests preliminary amendments to the available design standards for Portland cement concrete to design high calcium fly ash geopolymer concrete structural elements with better serviceability performance. However, further investigations are required prior to implementing them in the standards/codes.
Author Contributions
Funding
Institutional Review Board Statement
Informed Consent Statement
Data Availability Statement
Acknowledgments
Conflicts of Interest
References
- Aitcin, P.C. Cements of yesterday and today—Concrete of tomorrow. Cem. Concr. Res. 2000, 30, 1349–1359. [Google Scholar] [CrossRef]
- Harper, G.G. Cement Industry Initiative Releases Technology Roadmap to Cut CO2 Emissions 24% by 2050. Available online: https://sdg.iisd.org/news/cement-industry-initiative-releases-technology-roadmap-to-cut-co2-emissions-24-by-2050/ (accessed on 15 March 2020).
- Bernhardt, D.; Reilly, J.F., II. Mineral Commodity Summaries (2019); Government Printing Office, US Geological Survey: Reston, VA, USA, 2019.
- Peng, J.X.; Huang, L.; Zhao, Y.B.; Chen, P.; Zeng, L. Modeling of carbon dioxide measurement on cement plants. Adv. Mater. Res. 2013, 610–613, 2120–2128. [Google Scholar] [CrossRef]
- Li, C.; Gong, X.Z.; Cui, S.P.; Wang, Z.H.; Zheng, Y.; Chi, B.C. CO2 emissions due to cement manufacture. Mater. Sci. Forum 2011, 685, 181–187. [Google Scholar] [CrossRef]
- Huntzinger, D.N.; Eatmon, T.D. A life-cycle assessment of Portland cement manufacturing: Comparing the traditional process with alternative technologies. J. Clean. Prod. 2009, 17, 668–675. [Google Scholar] [CrossRef]
- Meyer, C. The greening of the concrete industry. Cem. Concr. Compos. 2009, 31, 601–605. [Google Scholar] [CrossRef]
- Chen, C.; Habert, G.; Bouzidi, Y.; Jullien, A. Environmental impact of cement production: Detail of the different processes and cement plant variability evaluation. J. Clean. Prod. 2010, 18, 478–485. [Google Scholar] [CrossRef]
- Hasanbeigi, A.; Price, L.; Lin, E. Emerging energy-efficiency and CO2 emission-reduction technologies for cement and concrete production: A technical review. Renew. Sustain. Energy Rev. 2012, 16, 6220–6238. [Google Scholar] [CrossRef]
- Shanks, W.; Dunant, C.F.; Drewniok, M.P.; Lupton, R.C.; Serrenho, A.; Allwood, J.M. How much cement can we do without? Lessons from cement material flows in the UK. Resour. Conserv. Recycl. 2019, 141, 441–454. [Google Scholar] [CrossRef]
- Sandanayake, M.; Gunasekara, C.; Law, D.; Zhang, G.; Setunge, S.; Wanijuru, D. Sustainable criterion selection framework for green building materials—An optimisation based study of fly-ash Geopolymer concrete. Sustain. Mater. Technol. 2020, 25, e00178. [Google Scholar]
- Gunasekara, C.; Sandanayake, M.; Zhou, Z.; Law, D.W.; Setunge, S. Effect of nano-silica addition into high volume fly ash–hydrated lime blended concrete. Constr. Build. Mater. 2020, 253, 119205. [Google Scholar] [CrossRef]
- Gunasekara, C.; Law, D.W.; Setunge, S.; Burgar, I.; Brkljaca, R. Effect of Element Distribution on Strength in Fly Ash Geopolymers. ACI Mater. J. 2017, 144, 795. [Google Scholar] [CrossRef]
- Turner, L.K.; Collins, F.G. Carbon dioxide equivalent (CO2-e) emissions: A comparison between geopolymer and OPC cement concrete. Constr. Build. Mater. 2013, 43, 125–130. [Google Scholar] [CrossRef]
- Nuaklong, P.; Sata, V.; Chindaprasirt, P. Influence of recycled aggregate on fly ash geopolymer concrete properties. J. Clean. Prod. 2016, 112, 2300–2307. [Google Scholar] [CrossRef]
- Topark-Ngarm, P.; Chindaprasirt, P.; Sata, V. Setting time, strength, and bond of high-calcium fly ash geopolymer concrete. J. Mater. Civ. Eng. 2015, 27, 04014198. [Google Scholar] [CrossRef]
- Feuerborn, H.-J. Calcareous ash in Europe-a reflection on technical and legal issues. In Proceedings of the 2nd Hellenic Conference on Utilisation of Industrial By-Products in Construction, Aiani Kozani, Greece, 1 June 2009. [Google Scholar]
- Hanjitsuwan, S.; Hunpratub, S.; Thongbai, P.; Maensiri, S.; Sata, V.; Chindaprasirt, P. Effects of NaOH concentrations on physical and electrical properties of high calcium fly ash geopolymer paste. Cem. Concr. Compos. 2014, 45, 9–14. [Google Scholar] [CrossRef]
- Nuaklong, P.; Jongvivatsakul, P.; Pothisiri, T.; Sata, V.; Chindaprasirt, P. Influence of rice husk ash on mechanical properties and fire resistance of recycled aggregate high-calcium fly ash geopolymer concrete. J. Clean. Prod. 2020, 252, 119797. [Google Scholar] [CrossRef]
- Wongsa, A.; Wongkvanklom, A.; Tanangteerapong, D.; Chindaprasirt, P. Comparative study of fire-resistant behaviors of high-calcium fly ash geopolymer mortar containing zeolite and mullite. J. Sustain. Cem. Based Mater. 2020, 9, 307–321. [Google Scholar] [CrossRef]
- Wong, C.L.; Mo, K.H.; Alengaram, U.J.; Yap, S.P. Mechanical strength and permeation properties of high calcium fly ash-based geopolymer containing recycled brick powder. J. Build. Eng. 2020, 32, 101655. [Google Scholar] [CrossRef]
- Ling, Y.; Wang, K.; Wang, X.; Hua, S. Effects of mix design parameters on heat of geopolymerization, set time, and compressive strength of high calcium fly ash geopolymer. Constr. Build. Mater. 2019, 228, 116763. [Google Scholar] [CrossRef]
- Zhang, J.; Feng, Q. The making of Class C fly ash as high-strength precast construction material through geopolymerization. Min. Metall. Explor. 2020, 37, 1603–1616. [Google Scholar] [CrossRef]
- Abdullah, M.M.A.B.; Kamarudin, H.; Bnhussain, M.; Khairul Nizar, I.; Rafiza, A.R.; Zarina, Y. The relationship of NaOH molarity, Na2SiO3/NaOH ratio, fly ash/alkaline activator ratio, and curing temperature to the strength of fly ash-based geopolymer. In Advanced Materials Research; Trans Tech Publications Ltd: Geneva, Switzerland, 2011. [Google Scholar]
- Palomo, A.; Grutzeck, M.; Blanco, M. Alkali-activated fly ashes: A cement for the future. Cem. Concr. Res. 1999, 29, 1323–1329. [Google Scholar] [CrossRef]
- Swanepoel, J.; Strydom, C. Utilisation of fly ash in a geopolymeric material. Appl. Geochem. 2002, 17, 1143–1148. [Google Scholar] [CrossRef]
- Sathonsaowaphak, A.; Chindaprasirt, P.; Pimraksa, K. Workability and strength of lignite bottom ash geopolymer mortar. J. Hazard. Mater. 2009, 168, 44–50. [Google Scholar] [CrossRef]
- Rattanasak, U.; Chindaprasirt, P. Influence of NaOH solution on the synthesis of fly ash geopolymer. Miner. Eng. 2009, 22, 1073–1078. [Google Scholar] [CrossRef]
- Hardjito, D.; Wallah, S.E. On the development of fly ash-based geopolymer concrete. Mater. J. 2004, 101, 467–472. [Google Scholar]
- Mishra, A.; Choudhary, D.; Jain, N.; Kumar, M.; Sharda, N.; Dutt, D. Effect of concentration of alkaline liquid and curing time on strength and water absorption of geopolymer concrete. ARPN J. Eng. Appl. Sci. 2008, 3, 14–18. [Google Scholar]
- Lim, C.-H.; Yoon, Y.-S.; Kim, J.-H. Genetic algorithm in mix proportioning of high-performance concrete. Cem. Concr. Res. 2004, 34, 409–420. [Google Scholar] [CrossRef]
- Camp, C.V.; Pezeshk, S.; Hansson, H. Flexural design of reinforced concrete frames using a genetic algorithm. J. Struct. Eng. 2003, 129, 105–115. [Google Scholar] [CrossRef]
- Topcu, I.B.; Sarıdemir, M. Prediction of compressive strength of concrete containing fly ash using artificial neural networks and fuzzy logic. Comput. Mater. Sci. 2008, 41, 305–311. [Google Scholar] [CrossRef]
- Lahoti, M.; Narang, P.; Tan, K.H.; Yang, E.H. Mix design factors and strength prediction of metakaolin-based geopolymer. Ceram. Int. 2017, 43, 11433–11441. [Google Scholar] [CrossRef]
- Nazari, A.; Torgal, F.P. Predicting compressive strength of different geopolymers by artificial neural networks. Ceram. Int. 2013, 39, 2247–2257. [Google Scholar] [CrossRef]
- Özcan, F.; Atiş, C.D.; Karahan, O.; Uncuoğlu, E.; Tanyildizi, H. Comparison of artificial neural network and fuzzy logic models for prediction of long-term compressive strength of silica fume concrete. Adv. Eng. Softw. 2009, 40, 856–863. [Google Scholar] [CrossRef]
- Yaprak, H.; Karacı, A.; Demir, I. Prediction of the effect of varying cure conditions and w/c ratio on the compressive strength of concrete using artificial neural networks. Neural Comput. Appl. 2013, 22, 133–141. [Google Scholar] [CrossRef]
- Bondar, D. Use of a Neural Network to Predict Strength and Optimum Compositions of Natural Alumina-Silica-Based Geopolymers. J. Mater. Civ. Eng. 2013, 26, 499–503. [Google Scholar] [CrossRef]
- Phoo-Ngernkham, T.; Phiangphimai, C.; Damrongwiriyanupap, N.; Hanjitsuwan, S.; Thumrongvut, J.; Chindaprasirt, P. A mix design procedure for alkali-activated high-calcium fly ash concrete cured at ambient temperature. Adv. Mater. Sci. Eng. 2018, 2018, 2460403. [Google Scholar] [CrossRef]
- Chindaprasirt, P.; Chalee, W. Effect of sodium hydroxide concentration on chloride penetration and steel corrosion of fly ash-based geopolymer concrete under marine site. Constr. Build. Mater. 2014, 63, 303–310. [Google Scholar] [CrossRef]
- Muthadhi, A.; Dhivya, V. Investigating Strength Properties of Geopolymer Concrete with Quarry Dust. ACI Mater. J. 2017, 114, 355. [Google Scholar] [CrossRef]
- Diaz-Loya, E.I.; Allouche, E.N.; Vaidya, S. Mechanical Properties of Fly-Ash-Based Geopolymer Concrete. ACI Mater. J. 2011, 108, 300–306. [Google Scholar]
- Nuaklong, P.; Sata, V.; Wongsa, A.; Srinavin, K.; Chindaprasirt, P. Recycled aggregate high calcium fly ash geopolymer concrete with inclusion of OPC and nano-SiO2. Constr. Build. Mater. 2018, 174, 244–252. [Google Scholar] [CrossRef]
- Lavanya, G.; Jegan, J. Durability study on high calcium fly ash based geopolymer concrete. Adv. Mater. Sci. Eng. 2015, 2015, 731056. [Google Scholar] [CrossRef]
- Mehta, A.; Siddique, R. Sulfuric acid resistance of fly ash based geopolymer concrete. Constr. Build. Mater. 2017, 146, 136–143. [Google Scholar] [CrossRef]
- Embong, R.; Kusbiantoro, A.; Shafiq, N.; Nuruddin, M.F. Strength and microstructural properties of fly ash based geopolymer concrete containing high-calcium and water-absorptive aggregate. J. Clean. Prod. 2016, 112, 816–822. [Google Scholar] [CrossRef]
- Pane, I.; Imran, I.; Budiono, B. Compressive Strength of Fly ash-based Geopolymer Concrete with a Variable of Sodium Hydroxide (NaOH) Solution Molarity. MATEC Web Conf. EDP Sci. 2018, 147, 01004. [Google Scholar]
- Kusbiantoro, A.; Nuruddin, M.F.; Shafiq, N.; Qazi, S.A. The effect of microwave incinerated rice husk ash on the compressive and bond strength of fly ash based geopolymer concrete. Constr. Build. Mater. 2012, 36, 695–703. [Google Scholar] [CrossRef]
- Kupwade-Patil, K.; Allouche, E.N. Impact of alkali silica reaction on fly ash-based geopolymer concrete. J. Mater. Civ. Eng. 2013, 25, 131–139. [Google Scholar] [CrossRef]
- Hair, J.F., Jr.; Hult, G.T.M.; Ringle, C.; Sarstedt, M. A primer on Partial Least Squares Structural Equation Modeling (PLS-SEM); Sage Publications: Thousand Oaks, CA, USA, 2016. [Google Scholar]
- Boadu, F.K. Rock properties and seismic attenuation: Neural network analysis. Pure Appl. Geophys. 1997, 149, 507–524. [Google Scholar] [CrossRef]
- Kurup, P.U.; Dudani, N.K. Neural networks for profiling stress history of clays from PCPT data. J. Geotech. Geoenviron. Eng. 2002, 128, 569–579. [Google Scholar] [CrossRef]
- Samui, P.; Dixon, B. Application of support vector machine and relevance vector machine to determine evaporative losses in reservoirs. Hydrol. Process. 2012, 26, 1361–1369. [Google Scholar] [CrossRef]
- Whitfield, P.; Mitchell, L. Quantitative Rietveld analysis of the amorphous content in cements and clinkers. J. Mater. Sci. 2003, 38, 4415–4421. [Google Scholar] [CrossRef]
- Font, O.; Moreno, N.; Querol, X.; Izquierdo, M.; Álvarez, E.; Diez, S.; Elvira, J.; Antenucci, D.; Nugteren, H.; Plana, F.; et al. X-ray powder diffraction-based method for the determination of the glass content and mineralogy of coal (co)-combustion fly ashes. Fuel 2010, 89, 2971–2976. [Google Scholar] [CrossRef]
- Methods for Sampling and Testing Aggregates, Method 5: Particle Density and Water Absorption of Fine Aggregate; AS 1141.5-2000; Standards Australia Limited: Sydney, Australia, 2000; pp. 1–8.
- Standard Test Method for Compressive Strength of Hydraulic Cement Mortars (Using 2-in or [50-mm] Cube Specimens); ASTM C109/C109M-20b; ASTM International Press: West Conshohocken, PA, USA, 2013.
- Brown, A.M. A step-by-step guide to non-linear regression analysis of experimental data using a Microsoft Excel spreadsheet. Comput. Methods Programs Biomed. 2001, 65, 191–200. [Google Scholar] [CrossRef]
- Concrete Structures; AS 3600-2018 (2018); Standards Australia Limited: Sydney, Australia, 2018; pp. 1–208, AS 3600-2018 (2018).
- ACI Committee; International Organization for Standardization. Building Code Requirements for Structural Concrete in ACI (American Concrete Institute); American Concrete Institute: Farmington Hills, MI, USA, 2008. [Google Scholar]


| Fly Ash (kg) | Aggregate (kg) | Activator (kg) | Added Water (kg) | Solid % in Na2SiO3 | NaOH Molarity | Heat Curing [Ambient Curing] | Comp. Strength (MPa) | Flexural Strength (MPa) | Elastic Modulus (GPa) | Ref. | ||||
|---|---|---|---|---|---|---|---|---|---|---|---|---|---|---|
| Coarse | Fine | NaOH | Na2SiO3 | SiO2 | Na2O | Time | °C | |||||||
| 414 | 1091 | 588 | 104 | 104 | 0 | 32.9 | 15.3 | 10 M | 24 h | 60 | 46.67 | – | 31.00 | [16] |
| 414 | 1091 | 588 | 104 | 104 | 0 | 32.9 | 15.3 | 15 M | 24 h | 60 | 54.40 | – | 37.80 | |
| 414 | 1091 | 588 | 104 | 104 | 0 | 32.9 | 15.3 | 20 M | 24 h | 60 | 43.42 | – | 38.00 | |
| 414 | 1091 | 588 | 69 | 138 | 0 | 32.9 | 15.3 | 10 M | 24 h | 60 | 40.09 | – | 24.20 | |
| 414 | 1091 | 588 | 69 | 138 | 0 | 32.9 | 15.3 | 15 M | 24 h | 60 | 48.18 | – | 31.00 | |
| 414 | 1091 | 588 | 69 | 138 | 0 | 32.9 | 15.3 | 20 M | 24 h | 60 | 49.50 | – | 31.80 | |
| 414 | 1091 | 588 | 104 | 104 | 0 | 32.9 | 15.3 | 10 M | 24 h | [23] | 39.67 | – | 30.40 | |
| 414 | 1091 | 588 | 104 | 104 | 0 | 32.9 | 15.3 | 15 M | 24 h | [23] | 45.34 | – | 34.80 | |
| 414 | 1091 | 588 | 104 | 104 | 0 | 32.9 | 15.3 | 20 M | 24 h | [23] | 37.64 | – | 38.40 | |
| 414 | 1091 | 588 | 69 | 138 | 0 | 32.9 | 15.3 | 10 M | 24 h | [23] | 33.80 | – | 23.40 | |
| 414 | 1091 | 588 | 69 | 138 | 0 | 32.9 | 15.3 | 15 M | 24 h | [23] | 39.02 | – | 26.80 | |
| 414 | 1091 | 588 | 69 | 138 | 0 | 32.9 | 15.3 | 20 M | 24 h | [23] | 46.69 | – | 35.40 | |
| 523 | 1124 | 459 | 118 | 118 | 0 | 28.7 | 11.7 | 10 M | 24 h | [23] | 36.5 | 5.5 | 22 | [39] |
| 500 | 1166 | 475 | 113 | 113 | 0 | 28.7 | 11.7 | 10 M | 24 h | [23] | 33.0 | 5.3 | 26 | |
| 478 | 1211 | 490 | 108 | 108 | 0 | 28.7 | 11.7 | 10 M | 24 h | [23] | 26.0 | 4.8 | 24 | |
| 470 | 1161 | 474 | 118 | 118 | 0 | 28.7 | 11.7 | 10 M | 24 h | [23] | 32.5 | 6.1 | 24 | |
| 450 | 1201 | 489 | 113 | 113 | 0 | 28.7 | 11.7 | 10 M | 24 h | [23] | 32.0 | 5.8 | 24 | |
| 430 | 1245 | 504 | 108 | 108 | 0 | 28.7 | 11.7 | 10 M | 24 h | [23] | 27.5 | 5.6 | 23.9 | |
| 428 | 1191 | 487 | 118 | 118 | 0 | 28.7 | 11.7 | 10 M | 24 h | [23] | 32.0 | 5.9 | 21.5 | |
| 409 | 1231 | 501 | 113 | 113 | 0 | 28.7 | 11.7 | 10 M | 24 h | [23] | 29.9 | 5.1 | 24.5 | |
| 391 | 1273 | 515 | 108 | 108 | 0 | 28.7 | 11.7 | 10 M | 24 h | [23] | 27.5 | 5 | 24.5 | |
| 392 | 1216 | 497 | 118 | 118 | 0 | 28.7 | 11.7 | 10 M | 24 h | [23] | 25.0 | 4.8 | 24.7 | |
| 375 | 1255 | 511 | 113 | 113 | 0 | 28.7 | 11.7 | 10 M | 24 h | [23] | 21.0 | 4.9 | 27.5 | |
| 359 | 1296 | 525 | 108 | 108 | 0 | 28.7 | 11.7 | 10 M | 24 h | [23] | 20.0 | 4.1 | 22.5 | |
| 523 | 1126 | 460 | 118 | 118 | 0 | 28.7 | 11.7 | 15 M | 24 h | [23] | 35.5 | 6.4 | 27 | |
| 500 | 1168 | 475 | 113 | 113 | 0 | 28.7 | 11.7 | 15 M | 24 h | [23] | 32.5 | 6.3 | 27 | |
| 478 | 1212 | 491 | 108 | 108 | 0 | 28.7 | 11.7 | 15 M | 24 h | [23] | 31.0 | 5.8 | 20 | |
| 470 | 1163 | 475 | 118 | 118 | 0 | 28.7 | 11.7 | 15 M | 24 h | [23] | 36.0 | 6.3 | 26 | |
| 450 | 1203 | 490 | 113 | 113 | 0 | 28.7 | 11.7 | 15 M | 24 h | [23] | 34.5 | 6 | 27.5 | |
| 430 | 1246 | 505 | 108 | 108 | 0 | 28.7 | 11.7 | 15 M | 24 h | [23] | 33.0 | 5.8 | 26 | |
| 428 | 1193 | 487 | 118 | 118 | 0 | 28.7 | 11.7 | 15 M | 24 h | [23] | 32.5 | 6.2 | 27 | |
| 409 | 1232 | 502 | 113 | 113 | 0 | 28.7 | 11.7 | 15 M | 24 h | [23] | 33.0 | 5.9 | 29 | |
| 391 | 1274 | 516 | 108 | 108 | 0 | 28.7 | 11.7 | 15 M | 24 h | [23] | 32.5 | 5.3 | 25.1 | |
| 392 | 1218 | 498 | 118 | 118 | 0 | 28.7 | 11.7 | 15 M | 24 h | [23] | 18.5 | 5.9 | 19 | |
| 375 | 1257 | 512 | 113 | 113 | 0 | 28.7 | 11.7 | 15 M | 24 h | [23] | 19.0 | 5.2 | 19.5 | |
| 359 | 1298 | 525 | 108 | 108 | 0 | 28.7 | 11.7 | 15 M | 24 h | [23] | 16.0 | 5.1 | 29 | |
| 390 | 1092 | 585 | 67 | 167 | 0 | 30.0 | 9.0 | 8 M | 28 days | [25] | 23.4 | – | – | [40] |
| 390 | 1092 | 585 | 67 | 167 | 0 | 30.0 | 9.0 | 10 M | 28 days | [25] | 25.0 | – | – | |
| 390 | 1092 | 585 | 67 | 167 | 0 | 30.0 | 9.0 | 12 M | 28 days | [25] | 28.2 | – | – | |
| 390 | 1092 | 585 | 67 | 167 | 0 | 30.0 | 9.0 | 14 M | 28 days | [25] | 31.8 | – | – | |
| 390 | 1092 | 585 | 67 | 167 | 0 | 30.0 | 9.0 | 16 M | 28 days | [25] | 32.2 | – | – | |
| 390 | 1092 | 585 | 67 | 167 | 0 | 30.0 | 9.0 | 18 M | 28 days | [25] | 30.3 | – | – | |
| 300 | 1684 | 681 | 51.4 | 129 | 0 | 29.4 | 14.7 | 14 M | 24 h | 60 | 25.8 | 4.81 | – | [41] |
| 300 | 1684 | 681 | 51.4 | 129 | 0 | 29.4 | 14.7 | 14 M | 24 h | 60 | 23.2 | 4.56 | – | |
| 300 | 1684 | 681 | 51.4 | 129 | 0 | 29.4 | 14.7 | 14 M | 24 h | 60 | 21.5 | 4.63 | – | |
| 300 | 1684 | 681 | 51.4 | 129 | 0 | 29.4 | 14.7 | 14 M | 24 h | 60 | 26.8 | 4.69 | – | |
| 300 | 1684 | 681 | 51.4 | 129 | 0 | 29.4 | 14.7 | 14 M | 24 h | 60 | 20.5 | 4.72 | – | |
| 300 | 1684 | 681 | 51.4 | 129 | 0 | 29.4 | 14.7 | 14 M | 24 h | 60 | 22.0 | 4.85 | – | |
| 600 | 1087 | 572 | 89.1 | 223 | 0 | 29.4 | 14.7 | 14 M | 24 h | 60 | 26.5 | 4.68 | – | |
| 600 | 1087 | 572 | 89.1 | 223 | 0 | 29.4 | 14.7 | 14 M | 24 h | 60 | 29.0 | 4.65 | – | |
| 600 | 1087 | 572 | 89.1 | 223 | 0 | 29.4 | 14.7 | 8 M | 24 h | 60 | 27.0 | – | – | |
| 600 | 1087 | 572 | 89.1 | 223 | 0 | 29.4 | 14.7 | 8 M | 24 h | 60 | 25.0 | – | – | |
| 600 | 1087 | 572 | 89.1 | 223 | 0 | 29.4 | 14.7 | 8 M | 24 h | 60 | 22.5 | – | – | |
| 600 | 1087 | 572 | 89.1 | 223 | 0 | 29.4 | 14.7 | 8 M | 24 h | 60 | 28.5 | – | – | |
| 600 | 1087 | 572 | 89.1 | 223 | 0 | 29.4 | 14.7 | 8 M | 24 h | 60 | 22.0 | – | – | |
| 600 | 1087 | 572 | 89.1 | 223 | 0 | 29.4 | 14.7 | 8 M | 24 h | 60 | 30.0 | – | – | |
| 494 | 858 | 691 | 198 | 198 | 0 | 30.0 | 15.0 | 14 M | 72 h | 60 | 59.5 | 4.48 | 33.63 | [42] |
| 494 | 858 | 691 | 198 | 198 | 0 | 30.0 | 15.0 | 14 M | 72 h | 60 | 52.3 | 4.72 | 34.37 | |
| 494 | 858 | 691 | 198 | 198 | 0 | 30.0 | 15.0 | 14 M | 72 h | 60 | 55.9 | 4.3 | 37.10 | |
| 494 | 858 | 691 | 198 | 198 | 0 | 30.0 | 15.0 | 14 M | 72 h | 60 | 80.4 | 5.27 | 42.87 | |
| 494 | 858 | 691 | 198 | 198 | 0 | 30.0 | 15.0 | 14 M | 72 h | 60 | 61.4 | 6.23 | 31.44 | |
| 494 | 858 | 691 | 198 | 198 | 0 | 30.0 | 15.0 | 14 M | 72 h | 60 | 39.2 | 4.19 | 19.06 | |
| 494 | 858 | 691 | 198 | 198 | 0 | 30.0 | 15.0 | 14 M | 72 h | 60 | 53.7 | 4.43 | 28.91 | |
| 494 | 858 | 691 | 198 | 198 | 0 | 30.0 | 15.0 | 14 M | 72 h | 60 | 36.5 | 3.58 | 26.97 | |
| 494 | 858 | 691 | 198 | 198 | 0 | 30.0 | 15.0 | 14 M | 72 h | 60 | 57.2 | 5.27 | 29.44 | |
| 494 | 858 | 691 | 198 | 198 | 0 | 30.0 | 15.0 | 14 M | 72 h | 60 | 42.8 | 5.18 | 22.56 | |
| 494 | 858 | 691 | 198 | 198 | 0 | 30.0 | 15.0 | 14 M | 72 h | 60 | 62.2 | 4.83 | 29.89 | |
| 450 | 1150 | 500 | 108 | 162 | 0 | 30.3 | 12.3 | 12 M | 48 h | 60 | 35.2 | 5 | – | [43] |
| 450 | 1036 | 500 | 108 | 162 | 0 | 30.3 | 12.3 | 12 M | 48 h | 60 | 32.9 | 3.6 | – | |
| 550 | 838 | 600 | 95 | 239 | 0 | 30.0 | 12.0 | 8 M | 24 h | 60 | 33.2 | – | – | [44] |
| 550 | 838 | 600 | 95 | 239 | 0 | 30.0 | 12.0 | 8 M | 28 day | [29] | 35.6 | – | – | |
| 550 | 838 | 600 | 95 | 239 | 0 | 30.0 | 12.0 | 10 M | 24 h | 60 | 35.4 | – | – | |
| 550 | 838 | 600 | 95 | 239 | 0 | 30.0 | 12.0 | 10 M | 28 day | [29] | 36.7 | – | – | |
| 550 | 838 | 600 | 95 | 239 | 0 | 30.0 | 12.0 | 12 M | 24 h | 60 | 42.4 | – | – | |
| 550 | 838 | 600 | 95 | 239 | 0 | 30.0 | 12.0 | 12 M | 28 day | [29] | 39.7 | – | – | |
| 550 | 838 | 600 | 95 | 239 | 0 | 30.0 | 12.0 | 14 M | 24 h | 60 | 40.1 | – | – | |
| 550 | 838 | 600 | 95 | 239 | 0 | 30.0 | 12.0 | 14 M | 28 day | [29] | 38.7 | – | – | |
| 550 | 838 | 600 | 95 | 239 | 0 | 30.0 | 12.0 | 8 M | 24 h | 60 | 34.7 | – | – | |
| 550 | 838 | 600 | 95 | 239 | 0 | 30.0 | 12.0 | 8 M | 28 day | [29] | 36.2 | – | – | |
| 550 | 838 | 600 | 95 | 239 | 0 | 30.0 | 12.0 | 10 M | 24 h | 60 | 34.3 | – | – | |
| 550 | 838 | 600 | 95 | 239 | 0 | 30.0 | 12.0 | 10 M | 28 day | [29] | 37.1 | – | – | |
| 550 | 838 | 600 | 95 | 239 | 0 | 30.0 | 12.0 | 12 M | 24 h | 60 | 41.3 | – | – | |
| 550 | 838 | 600 | 95 | 239 | 0 | 30.0 | 12.0 | 12 M | 28 day | [29] | 38.9 | – | – | |
| 550 | 838 | 600 | 95 | 239 | 0 | 30.0 | 12.0 | 14 M | 24 h | 60 | 42.3 | – | – | |
| 550 | 838 | 600 | 95 | 239 | 0 | 30.0 | 12.0 | 14 M | 28 day | [29] | 38.5 | – | – | |
| 550 | 838 | 600 | 95 | 239 | 0 | 30.0 | 12.0 | 8 M | 24 h | 60 | 36.3 | – | – | |
| 550 | 838 | 600 | 95 | 239 | 0 | 30.0 | 12.0 | 8 M | 28 day | [29] | 35.3 | – | – | |
| 550 | 838 | 600 | 95 | 239 | 0 | 30.0 | 12.0 | 10 M | 24 h | 60 | 36.1 | – | – | |
| 550 | 838 | 600 | 95 | 239 | 0 | 30.0 | 12.0 | 10 M | 28 day | [29] | 36.3 | – | – | |
| 550 | 838 | 600 | 95 | 239 | 0 | 30.0 | 12.0 | 12 M | 24 h | 60 | 42.2 | – | – | |
| 550 | 838 | 600 | 95 | 239 | 0 | 30.0 | 12.0 | 12 M | 28 day | [29] | 45.3 | – | – | |
| 550 | 838 | 600 | 95 | 239 | 0 | 30.0 | 12.0 | 14 M | 24 h | 60 | 40.2 | – | – | |
| 550 | 838 | 600 | 95 | 239 | 0 | 30.0 | 12.0 | 14 M | 28 day | [29] | 39.6 | – | – | |
| 550 | 838 | 600 | 95 | 239 | 0 | 30.0 | 12.0 | 8 M | 24 h | 60 | 34.4 | – | – | |
| 550 | 838 | 600 | 95 | 239 | 0 | 30.0 | 12.0 | 8 M | 28 day | [29] | 36.3 | – | – | |
| 550 | 838 | 600 | 95 | 239 | 0 | 30.0 | 12.0 | 10 M | 24 h | 60 | 35.4 | – | – | |
| 550 | 838 | 600 | 95 | 239 | 0 | 30.0 | 12.0 | 10 M | 28 day | [29] | 38.3 | – | – | |
| 550 | 838 | 600 | 95 | 239 | 0 | 30.0 | 12.0 | 12 M | 24 h | 60 | 43.4 | – | – | |
| 550 | 838 | 600 | 95 | 239 | 0 | 30.0 | 12.0 | 12 M | 28 day | [29] | 44.3 | – | – | |
| 550 | 838 | 600 | 95 | 239 | 0 | 30.0 | 12.0 | 14 M | 24 h | 60 | 39.4 | – | – | |
| 550 | 838 | 600 | 95 | 239 | 0 | 30.0 | 12.0 | 14 M | 28 day | [29] | 38.3 | – | – | |
| 550 | 838 | 600 | 95 | 239 | 0 | 30.0 | 12.0 | 8 M | 24 h | 60 | 33.1 | – | – | |
| 550 | 838 | 600 | 95 | 239 | 0 | 30.0 | 12.0 | 8 M | 28 day | [29] | 33.5 | – | – | |
| 550 | 838 | 600 | 95 | 239 | 0 | 30.0 | 12.0 | 10 M | 24 h | 60 | 35.1 | – | – | |
| 550 | 838 | 600 | 95 | 239 | 0 | 30.0 | 12.0 | 10 M | 28 day | [29] | 35.5 | – | – | |
| 550 | 838 | 600 | 95 | 239 | 0 | 30.0 | 12.0 | 12 M | 24 h | 60 | 42.2 | – | – | |
| 550 | 838 | 600 | 95 | 239 | 0 | 30.0 | 12.0 | 12 M | 28 day | [29] | 41.5 | – | – | |
| 550 | 838 | 600 | 95 | 239 | 0 | 30.0 | 12.0 | 14 M | 24 h | 60 | 40.2 | – | – | |
| 550 | 838 | 600 | 95 | 239 | 0 | 30.0 | 12.0 | 14 M | 28 day | [29] | 37.5 | – | – | |
| 550 | 838 | 600 | 95 | 239 | 0 | 30.0 | 12.0 | 8 M | 24 h | 60 | 34.2 | – | – | |
| 550 | 838 | 600 | 95 | 239 | 0 | 30.0 | 12.0 | 8 M | 28 day | [29] | 35.5 | – | – | |
| 550 | 838 | 600 | 95 | 239 | 0 | 30.0 | 12.0 | 10 M | 24 h | 60 | 36.2 | – | – | |
| 550 | 838 | 600 | 95 | 239 | 0 | 30.0 | 12.0 | 10 M | 28 day | [29] | 37.5 | – | – | |
| 550 | 838 | 600 | 95 | 239 | 0 | 30.0 | 12.0 | 12 M | 24 h | 60 | 41.4 | – | – | |
| 550 | 838 | 600 | 95 | 239 | 0 | 30.0 | 12.0 | 12 M | 28 day | [29] | 40.5 | – | – | |
| 550 | 838 | 600 | 95 | 239 | 0 | 30.0 | 12.0 | 14 M | 24 h | 60 | 40.8 | – | – | |
| 550 | 838 | 600 | 95 | 239 | 0 | 30.0 | 12.0 | 14 M | 28 day | [29] | 38.4 | – | – | |
| 310 | 1204 | 649 | 48.6 | 121.5 | 0 | 34.7 | 16.2 | 10 M | 24 h | 80 | 44.4 | – | – | [45] |
| 350 | 1250 | 650 | 41 | 103 | 0 | 29.8 | 14.7 | 8 M | 7 day | [28] | 19.0 | – | – | [46] |
| 350 | 1250 | 650 | 41 | 103 | 0 | 29.8 | 14.7 | 8 M | 7 day | [28] | 26.0 | – | – | |
| 350 | 1250 | 650 | 41 | 103 | 0 | 29.8 | 14.7 | 8 M | 7 day | [28] | 23.5 | – | – | |
| 350 | 1250 | 650 | 41 | 103 | 0 | 29.8 | 14.7 | 8 M | 7 day | [28] | 22.5 | – | – | |
| 350 | 1250 | 650 | 41 | 103 | 0 | 29.8 | 14.7 | 8 M | 7 day | [28] | 17.8 | – | – | |
| 350 | 1250 | 650 | 41 | 103 | 0 | 29.8 | 14.7 | 8 M | 7 day | [28] | 21.5 | – | – | |
| 350 | 1250 | 650 | 41 | 103 | 0 | 29.8 | 14.7 | 8 M | 7 day | [28] | 19.0 | – | – | |
| 350 | 1250 | 650 | 41 | 103 | 0 | 29.8 | 14.7 | 8 M | 7 day | [28] | 13.0 | – | – | |
| 350 | 1250 | 650 | 41 | 103 | 0 | 29.8 | 14.7 | 8 M | 7 day | [28] | 12.0 | – | – | |
| 350 | 1250 | 650 | 41 | 103 | 0 | 29.8 | 14.7 | 8 M | 24 h | 60 | 32.5 | – | – | |
| 350 | 1250 | 650 | 41 | 103 | 0 | 29.8 | 14.7 | 8 M | 24 h | 60 | 33.5 | – | – | |
| 350 | 1250 | 650 | 41 | 103 | 0 | 29.8 | 14.7 | 8 M | 24 h | 60 | 31.0 | – | – | |
| 350 | 1250 | 650 | 41 | 103 | 0 | 29.8 | 14.7 | 8 M | 24 h | 60 | 24.7 | – | – | |
| 350 | 1250 | 650 | 41 | 103 | 0 | 29.8 | 14.7 | 8 M | 24 h | 60 | 22.0 | – | – | |
| 350 | 1250 | 650 | 41 | 103 | 0 | 29.8 | 14.7 | 8 M | 24 h | 60 | 25.0 | – | – | |
| 350 | 1250 | 650 | 41 | 103 | 0 | 29.8 | 14.7 | 8 M | 24 h | 60 | 23.5 | – | – | |
| 350 | 1250 | 650 | 41 | 103 | 0 | 29.8 | 14.7 | 8 M | 24 h | 60 | 16.0 | – | – | |
| 350 | 1250 | 650 | 41 | 103 | 0 | 29.8 | 14.7 | 8 M | 24 h | 60 | 15.0 | – | – | |
| 383 | 1379 | 567 | 54.5 | 137.00 | 0 | 32.4 | 13.5 | 12 M | 7 day | [30] | 20.0 | – | – | [44] |
| 527 | 1159 | 522 | 53.3 | 133.33 | 0 | 32.4 | 13.5 | 12 M | 7 day | [30] | 19.0 | – | – | |
| 530 | 1070 | 505 | 51.6 | 128.59 | 0 | 32.4 | 13.5 | 12 M | 7 day | [30] | 16.0 | – | – | |
| 450 | 1200 | 600 | 80 | 120 | 0 | 32.4 | 13.5 | 10 M | 7 day | [25] | 18.5 | – | – | [47] |
| 450 | 1200 | 600 | 80 | 120 | 0 | 32.4 | 13.5 | 12 M | 7 day | [25] | 27.0 | – | – | |
| 450 | 1200 | 600 | 80 | 120 | 0 | 32.4 | 13.5 | 14 M | 7 day | [25] | 29.3 | – | – | |
| 410 | 1143 | 521.8 | 110 | 120 | 2.3 | 32.4 | 13.5 | 10 M | 7 day | [25] | 16.2 | – | – | |
| 410 | 1143 | 521.8 | 110 | 120 | 2.3 | 32.4 | 13.5 | 12 M | 7 day | [25] | 25.0 | – | – | |
| 410 | 1143 | 521.8 | 110 | 120 | 2.3 | 32.4 | 13.5 | 14 M | 7 day | [25] | 22.5 | – | – | |
| 350 | 1200 | 645 | 41 | 103 | 35 | 29.8 | 14.7 | 8 M | 3 day | [35] | 19.0 | – | – | [48] |
| 350 | 1200 | 645 | 41 | 103 | 35 | 29.8 | 14.7 | 8 M | 24 h | 65 | 49.0 | – | – | |
| 350 | 1200 | 645 | 41 | 103 | 35 | 29.8 | 14.7 | 8 M | 3 day | 55 | 48.0 | – | – | |
| 500 | 1000 | 750 | 125 | 125 | 0 | 30.0 | 15.0 | 14 M | 72 h | 80 | 51.0 | – | – | [49] |
| 500 | 1000 | 750 | 125 | 125 | 0 | 30.0 | 15.0 | 14 M | 72 h | 80 | 53.0 | – | – | |
| 500 | 1000 | 750 | 125 | 125 | 0 | 30.0 | 15.0 | 14 M | 72 h | 80 | 50.0 | – | – | |
| 500 | 1000 | 750 | 125 | 125 | 0 | 30.0 | 15.0 | 14 M | 72 h | 80 | 50.0 | – | – | |
| 500 | 1000 | 750 | 125 | 125 | 0 | 30.0 | 15.0 | 14 M | 72 h | 80 | 52.0 | – | – | |
| 500 | 1000 | 750 | 125 | 125 | 0 | 30.0 | 15.0 | 14 M | 72 h | 80 | 44.0 | – | – | |
| Variable | Minimum | Maximum | Average | SD | Skewness | Kurtosis |
|---|---|---|---|---|---|---|
| Water/solid | 0.123 | 0.330 | 0.263 | 0.045 | −0.557 | −0.243 |
| Activator/fly ash | 0.340 | 0.802 | 0.549 | 0.105 | 0.433 | 0.388 |
| Na2SiO3/NaOH | 0.500 | 2.516 | 1.878 | 0.754 | −0.488 | −1.569 |
| NaOH molarity | 8 | 20 | 11.8 | 3.12 | 0.521 | −0.118 |
| Compressive strength (MPa) | 12 | 80.4 | 32.8 | 12.4 | 0.218 | 0.779 |
| Na2SiO3 | NaOH | Extra Water | Binder | Total | |
|---|---|---|---|---|---|
| Solid | 120.1 | 25.8 | 0 | 460 | 605.9 |
| Water | 187.7 | 57.4 | w | 0 | 245.1 + w |
| Mix Notation | Target Strength | Mix Design Variables | |||||||
|---|---|---|---|---|---|---|---|---|---|
| Water/Solid | Activator/Fly Ash | Na2SiO3/NaOH | NaOH Molarity | ||||||
| M25 | 25 MPa | 0.25 | 0.42 | 1.5 | 10 M | ||||
| M30 | 30 MPa | 0.28 | 0.50 | 2.0 | 10 M | ||||
| M40 | 40 MPa | 0.35 | 0.70 | 3.5 | 10 M | ||||
| M45 | 45 MPa | 0.42 | 0.85 | 4.0 | 8 M | ||||
| Mix Notation | Target Strength | Mix Proportions (kg/m3) | |||||||
| Fly Ash | Sand | Aggregates | Na2SiO3 | NaOH | Added Water | ||||
| M25 | 25 MPa | 460 | 500.8 | 985.8 | 115.9 | 77.3 | 93.7 | ||
| M30 | 30 MPa | 460 | 495.7 | 975.8 | 153.3 | 76.7 | 75.5 | ||
| M40 | 40 MPa | 460 | 480.3 | 945.5 | 250.5 | 71.5 | 33.1 | ||
| M45 | 45 MPa | 460 | 467 | 919.3 | 307.8 | 83.2 | 2.82 | ||
| Source Material | Component (wt.%) | |||||||||||
|---|---|---|---|---|---|---|---|---|---|---|---|---|
| SiO2 | Al2O3 | Fe2O3 | CaO | P2O5 | TiO2 | MgO | K2O | SO3 | MnO | Na2O | LOI a | |
| Fly ash | 38.7 | 20.8 | 5.3 | 26.6 | 0.15 | 0.45 | 1.5 | 2.6 | 2.1 | 0.5 | 1.2 | 0.1 |
| Properties Investigated | Fly Ash | |
|---|---|---|
| Specific gravity | 2.15 | |
| BET Surface area, (m2/kg) | 2619 | |
| Fineness (%) | at 10 microns | 45.2 |
| at 20 microns | 64.1 | |
| at 45 microns | 85.9 | |
| Amorphous content (%) | 67.1 | |
| Crystalline content (%) | 32.8 | |
| Concrete Type | 7-Day | 28-Day |
|---|---|---|
| M25 | 19.0 ± 0.6 | 27.2 ± 0.8 |
| M30 | 23.1 ± 0.9 | 33.1 ± 1.2 |
| M40 | 22.9 ± 0.7 | 38.1 ± 0.5 |
| M45 | 32.7 ± 0.9 | 44.1 ± 0.8 |
Publisher’s Note: MDPI stays neutral with regard to jurisdictional claims in published maps and institutional affiliations. |
© 2021 by the authors. Licensee MDPI, Basel, Switzerland. This article is an open access article distributed under the terms and conditions of the Creative Commons Attribution (CC BY) license (http://creativecommons.org/licenses/by/4.0/).
Share and Cite
Gunasekara, C.; Atzarakis, P.; Lokuge, W.; Law, D.W.; Setunge, S. Novel Analytical Method for Mix Design and Performance Prediction of High Calcium Fly Ash Geopolymer Concrete. Polymers 2021, 13, 900. https://doi.org/10.3390/polym13060900
Gunasekara C, Atzarakis P, Lokuge W, Law DW, Setunge S. Novel Analytical Method for Mix Design and Performance Prediction of High Calcium Fly Ash Geopolymer Concrete. Polymers. 2021; 13(6):900. https://doi.org/10.3390/polym13060900
Chicago/Turabian StyleGunasekara, Chamila, Peter Atzarakis, Weena Lokuge, David W. Law, and Sujeeva Setunge. 2021. "Novel Analytical Method for Mix Design and Performance Prediction of High Calcium Fly Ash Geopolymer Concrete" Polymers 13, no. 6: 900. https://doi.org/10.3390/polym13060900
APA StyleGunasekara, C., Atzarakis, P., Lokuge, W., Law, D. W., & Setunge, S. (2021). Novel Analytical Method for Mix Design and Performance Prediction of High Calcium Fly Ash Geopolymer Concrete. Polymers, 13(6), 900. https://doi.org/10.3390/polym13060900