
Exploring the Structure–Performance Relationship of Sulfonated Polysulfone Proton Exchange Membrane by a Combined Computational and Experimental Approach


Abstract
:1. Introduction
2. Materials and Methods
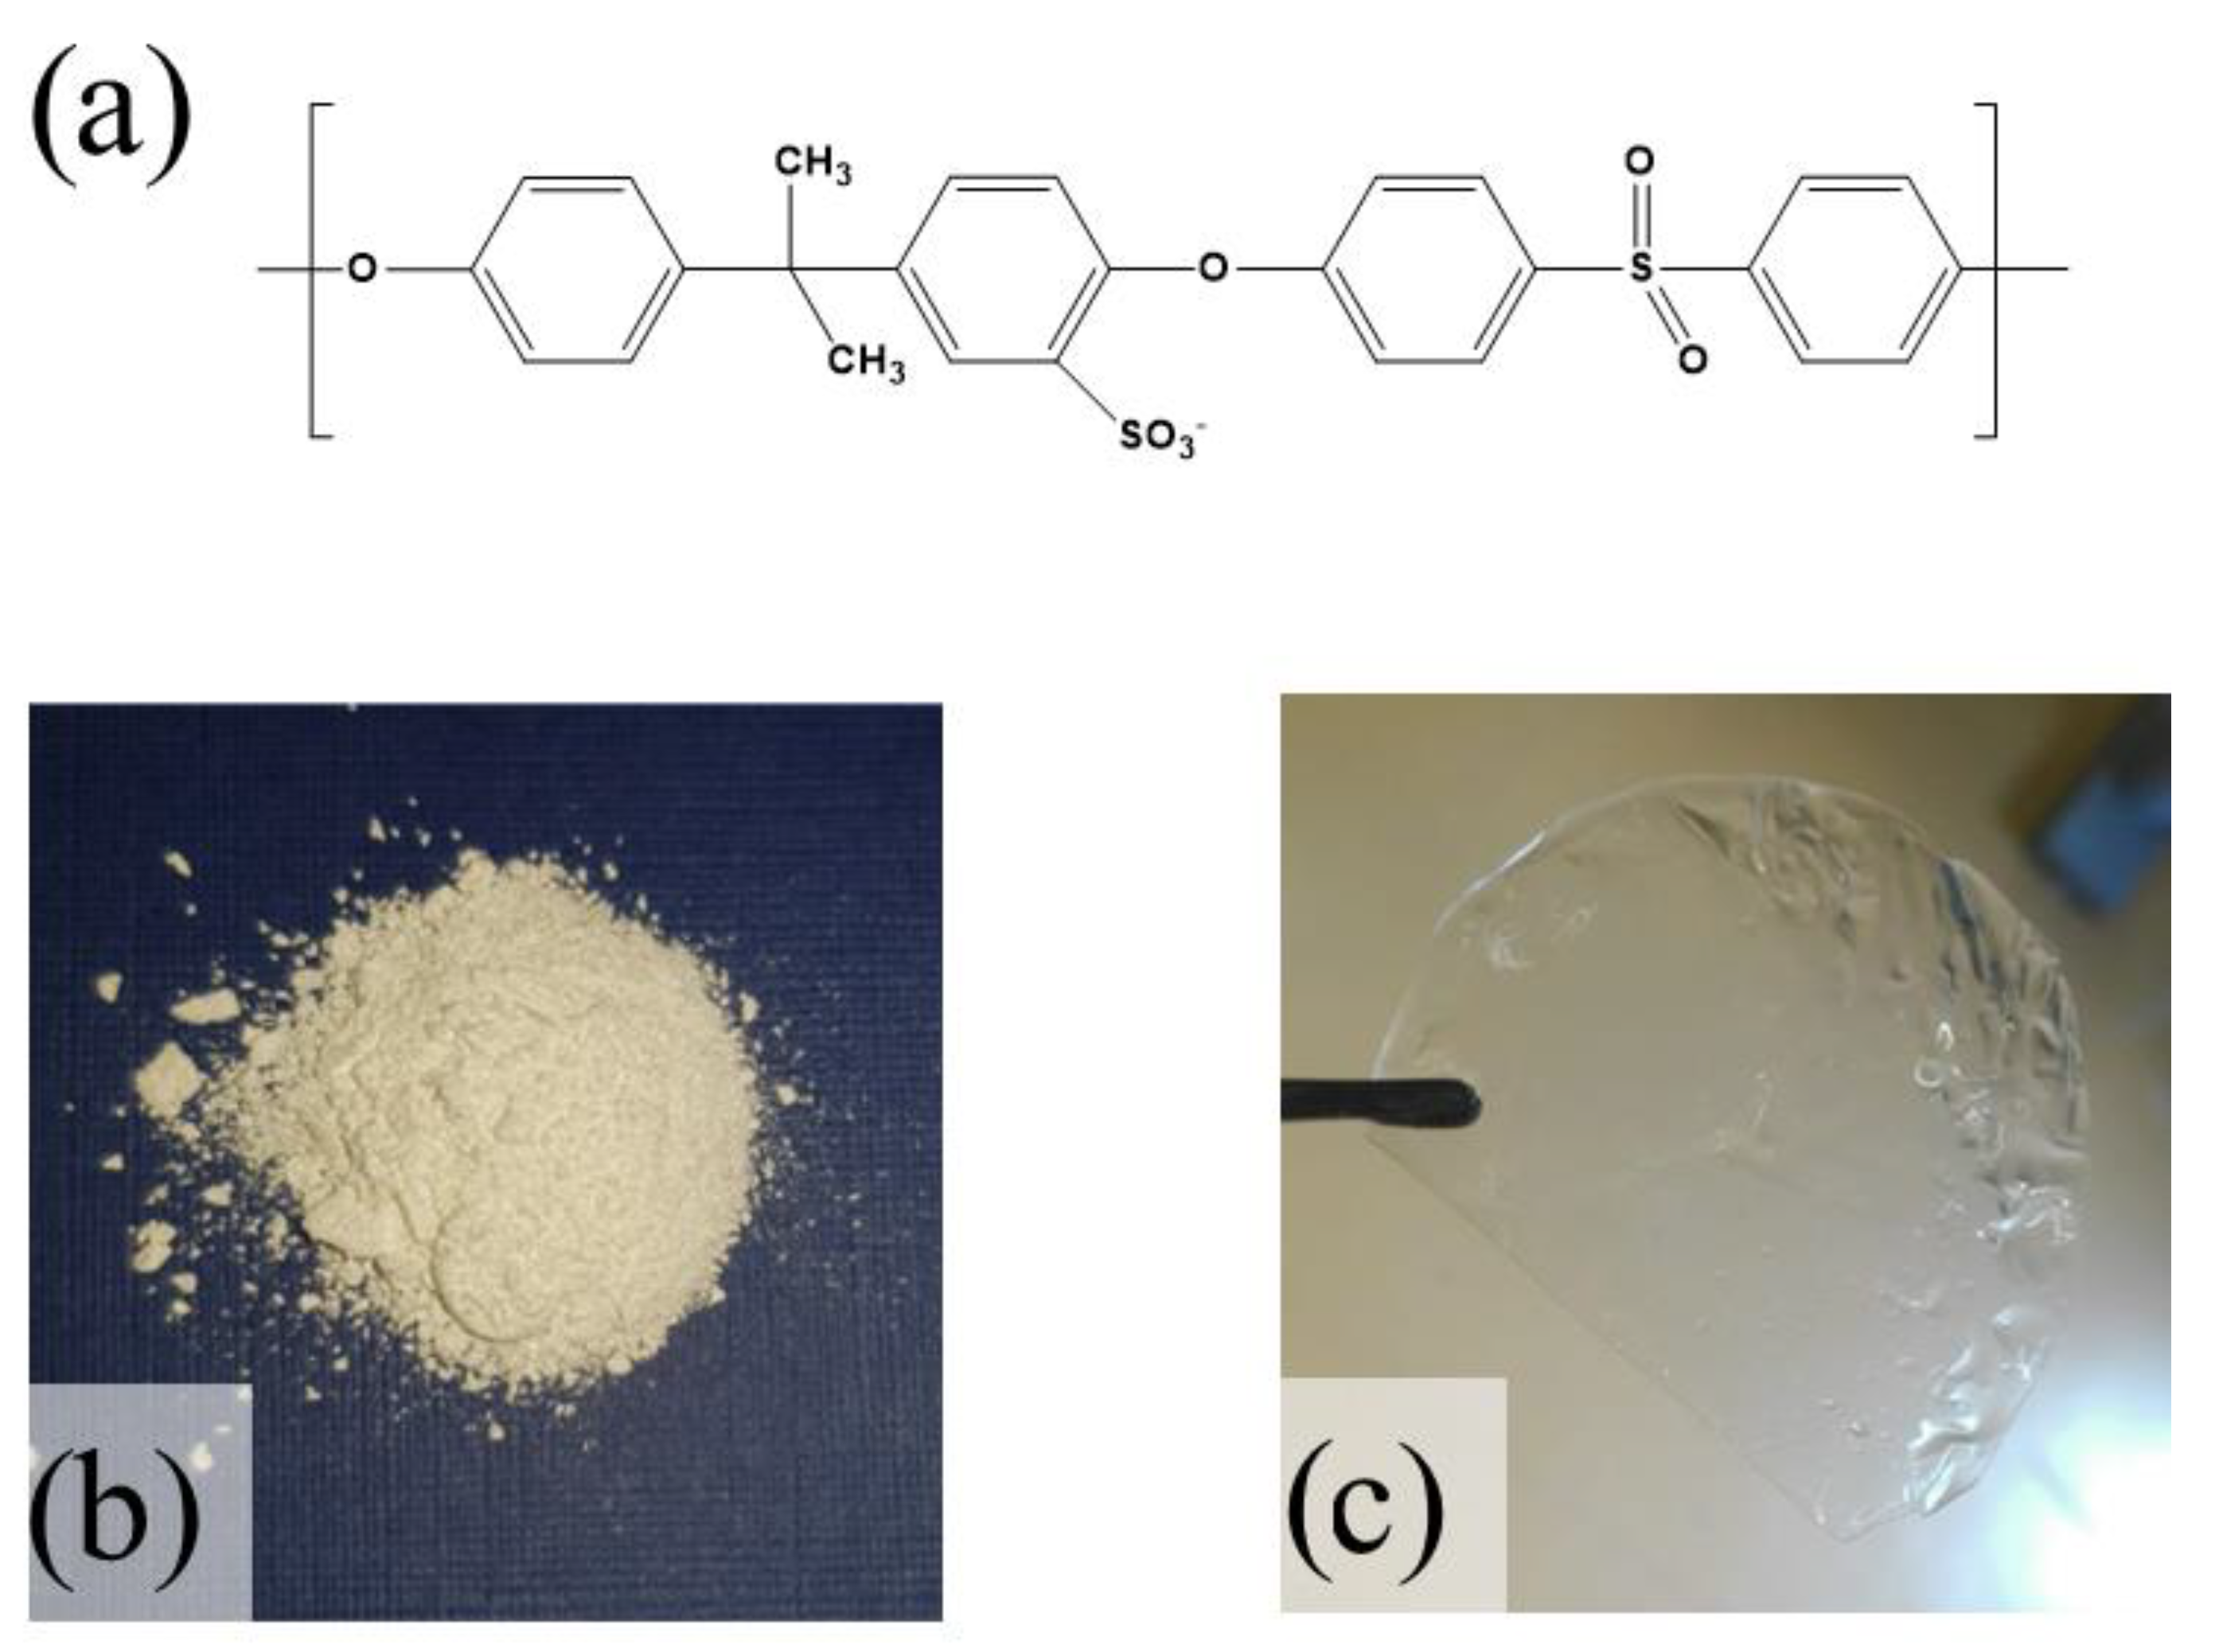
2.1. Synthesis Sulfonated Polysulfone and Membrane Preparation
2.2. Characterizations
2.2.1. Water Uptake and Thickness Swelling
2.2.2. NMR (PFG and Relaxometry) Spectroscopy
2.2.3. Electrochemical Impedance Spectroscopy (EIS) and Fuel Cell Tests
2.3. Computational Methods
2.3.1. Molecular Models
2.3.2. Molecular Dynamics Simulations
2.3.3. DFT Calculations
3. Results & Discussion
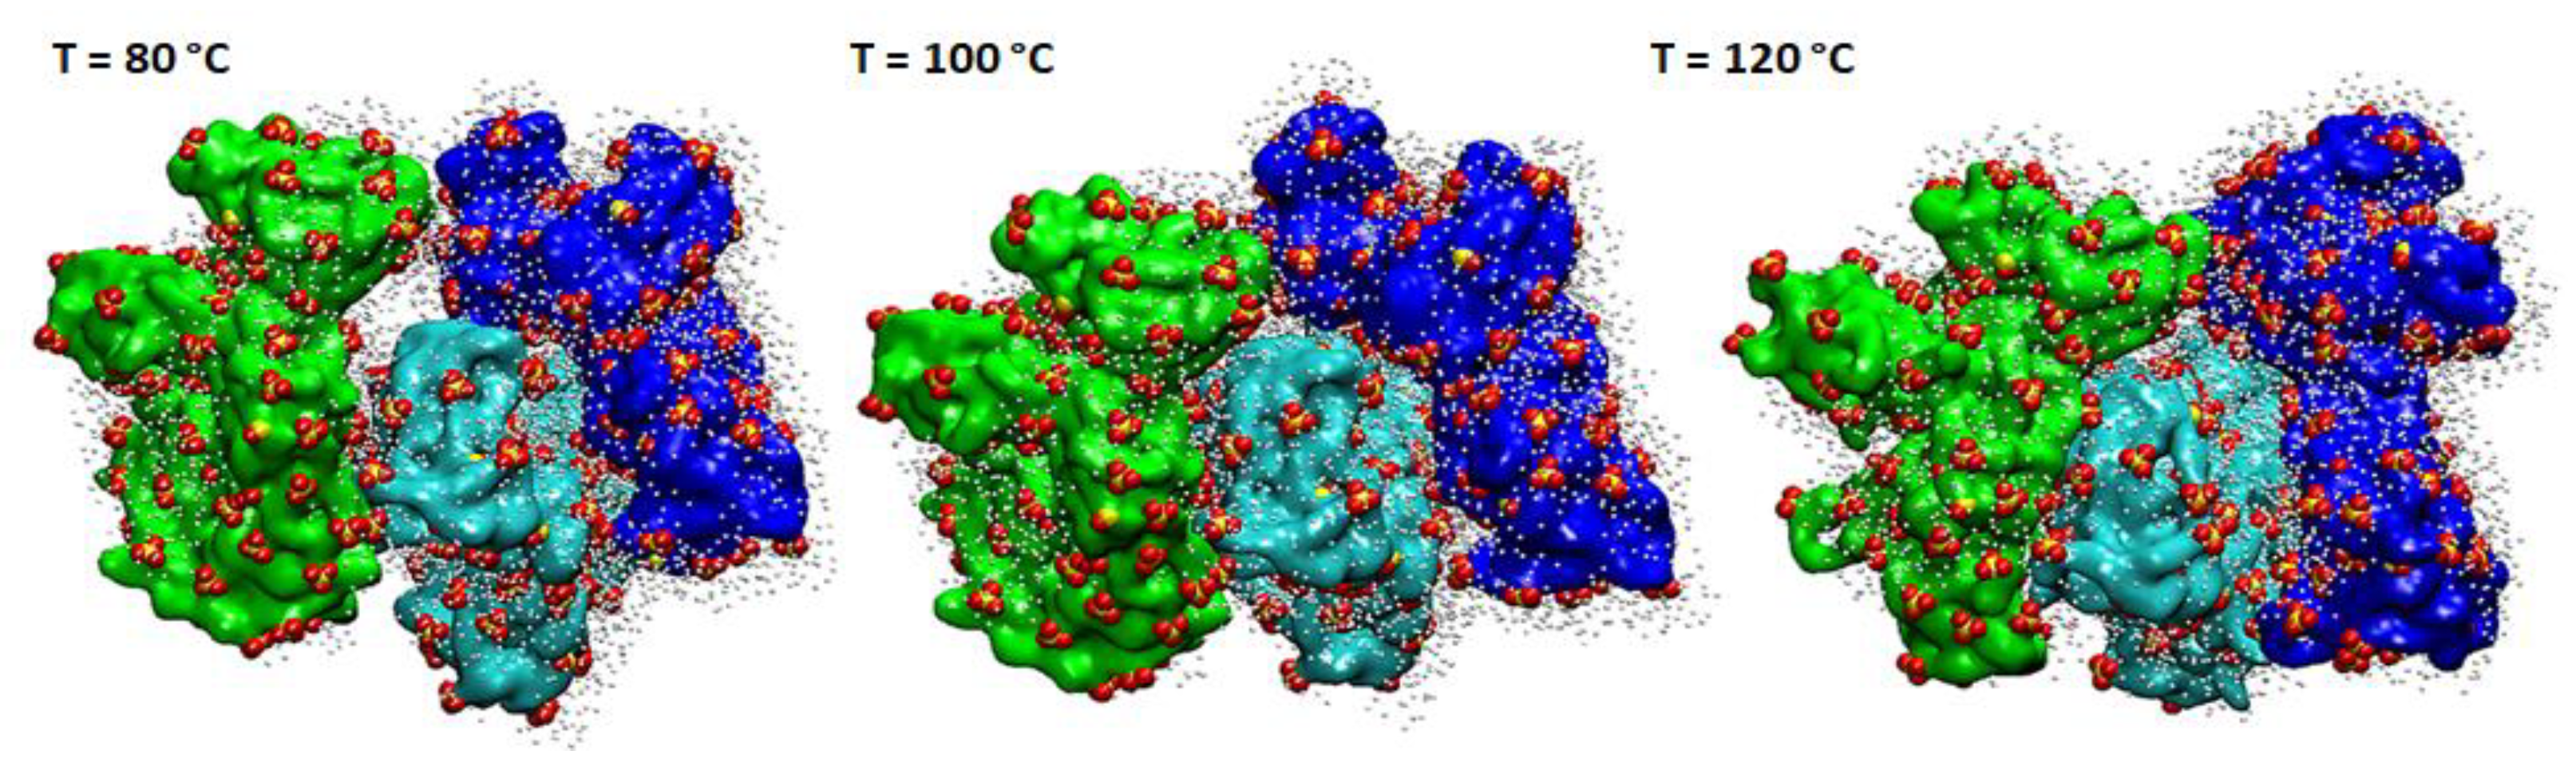
3.1. Computational Studies
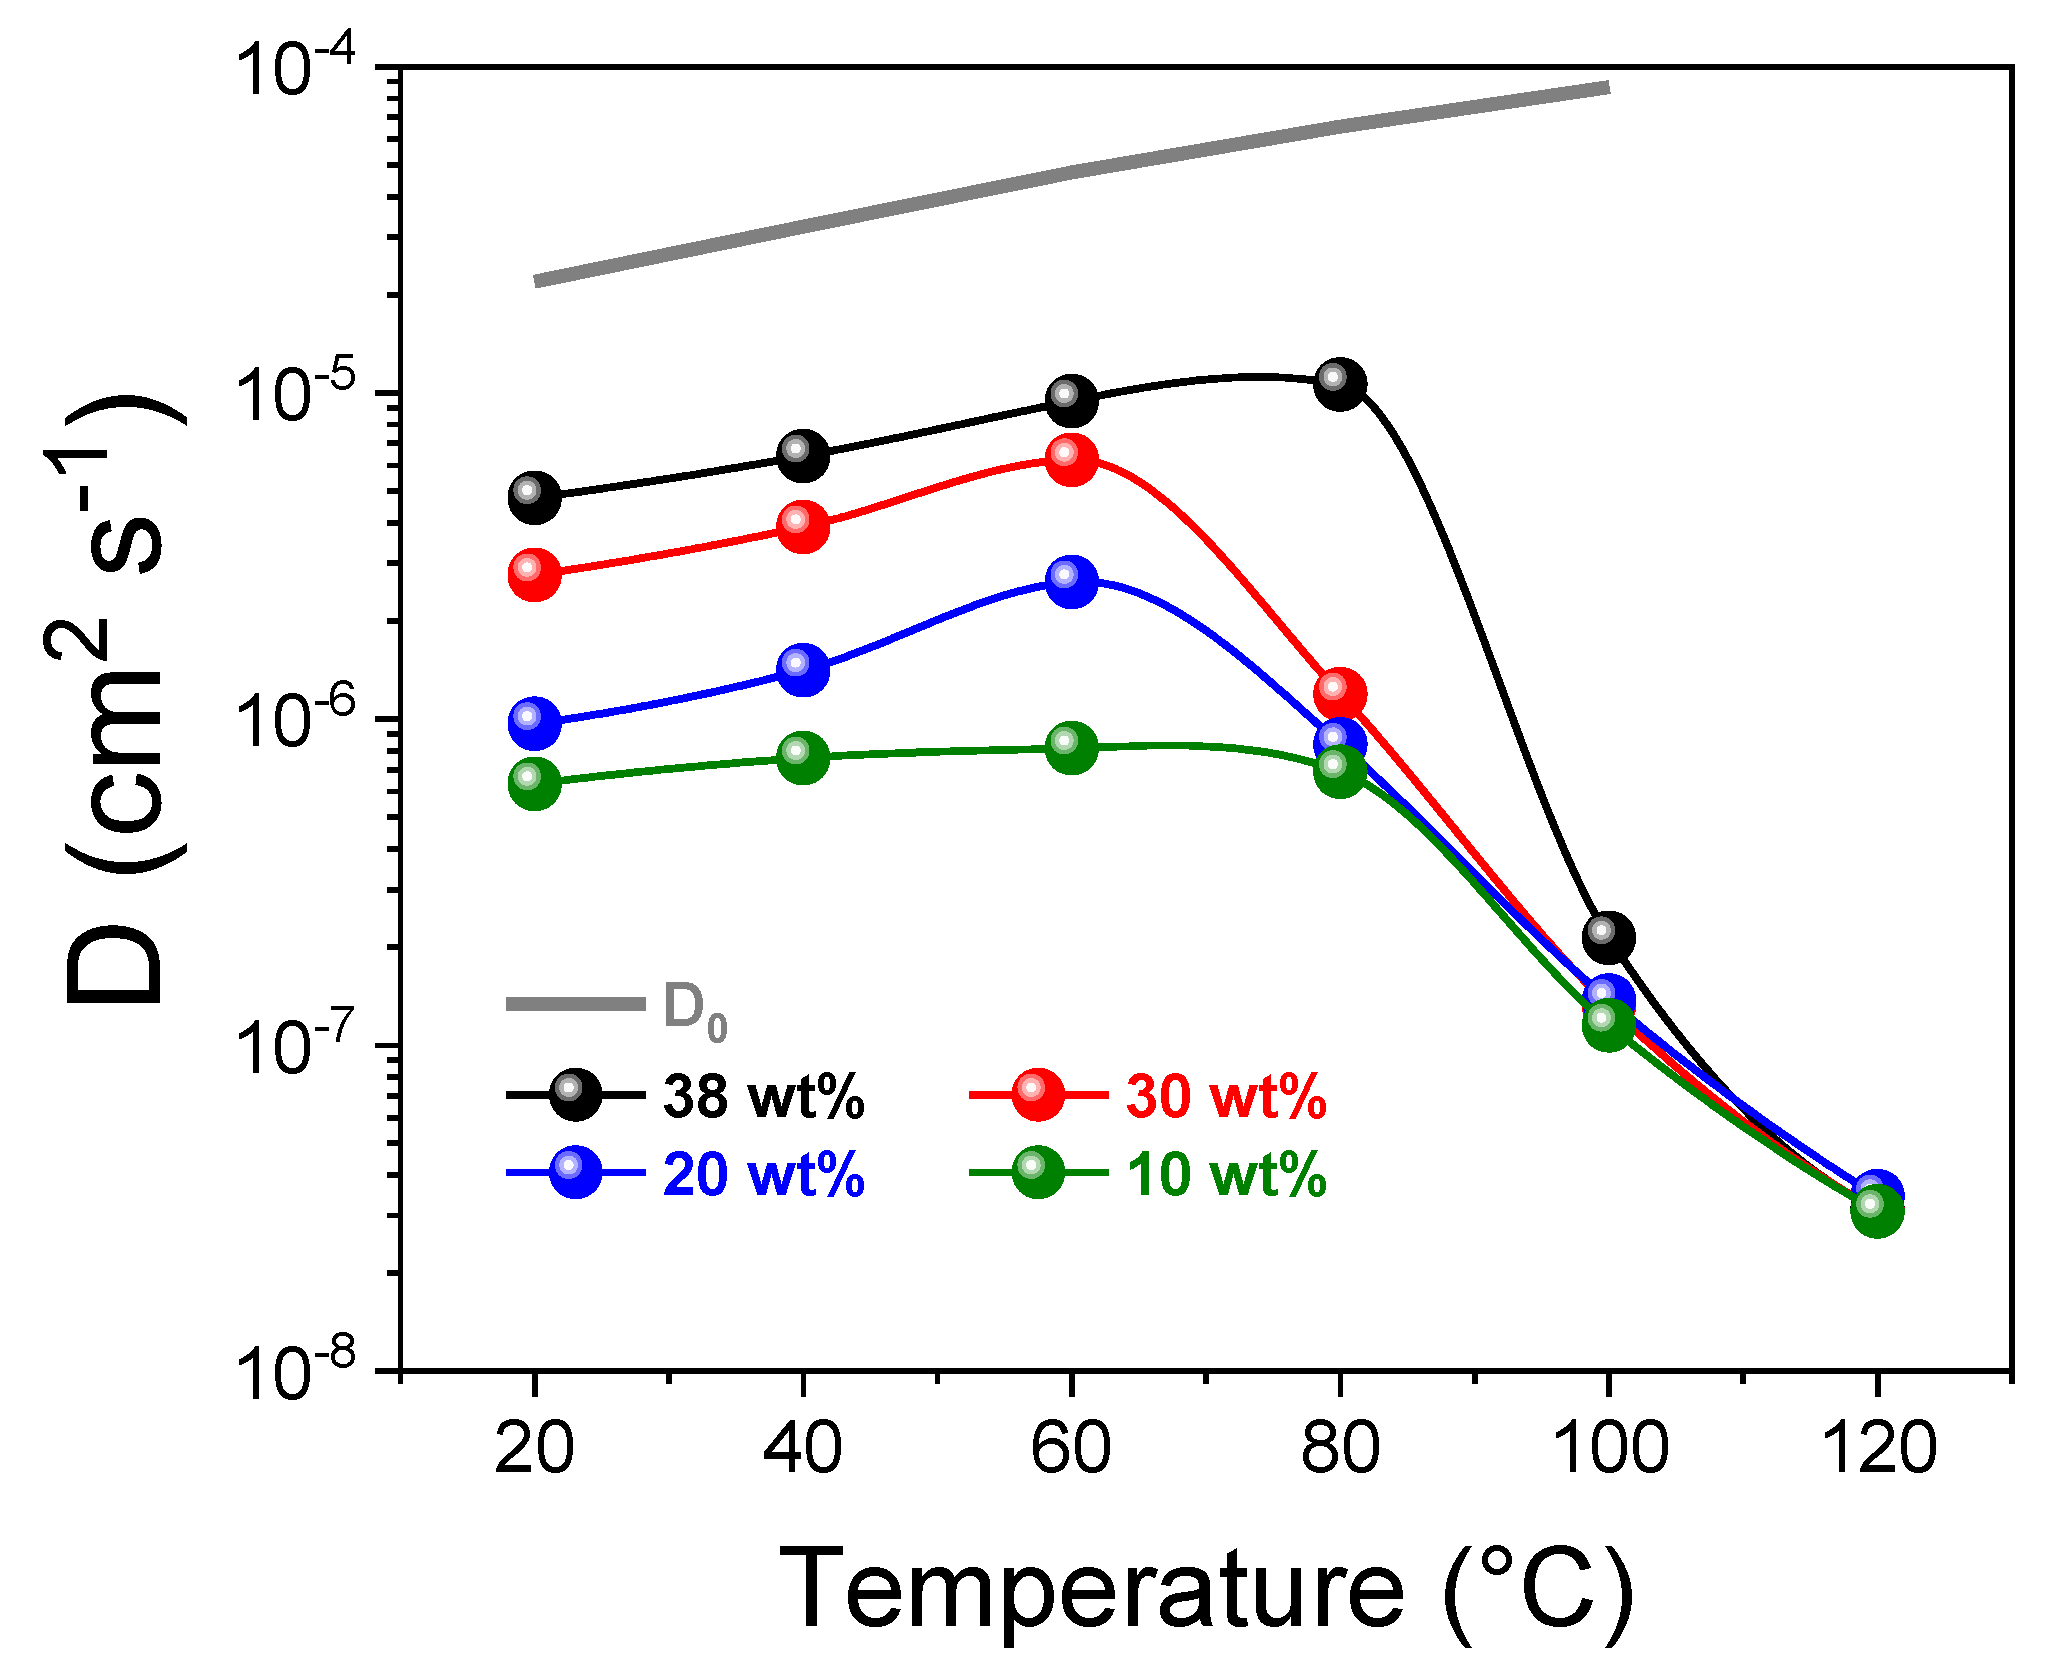
3.2. PFG-NMR Investigation and the “Two-Sites” Model
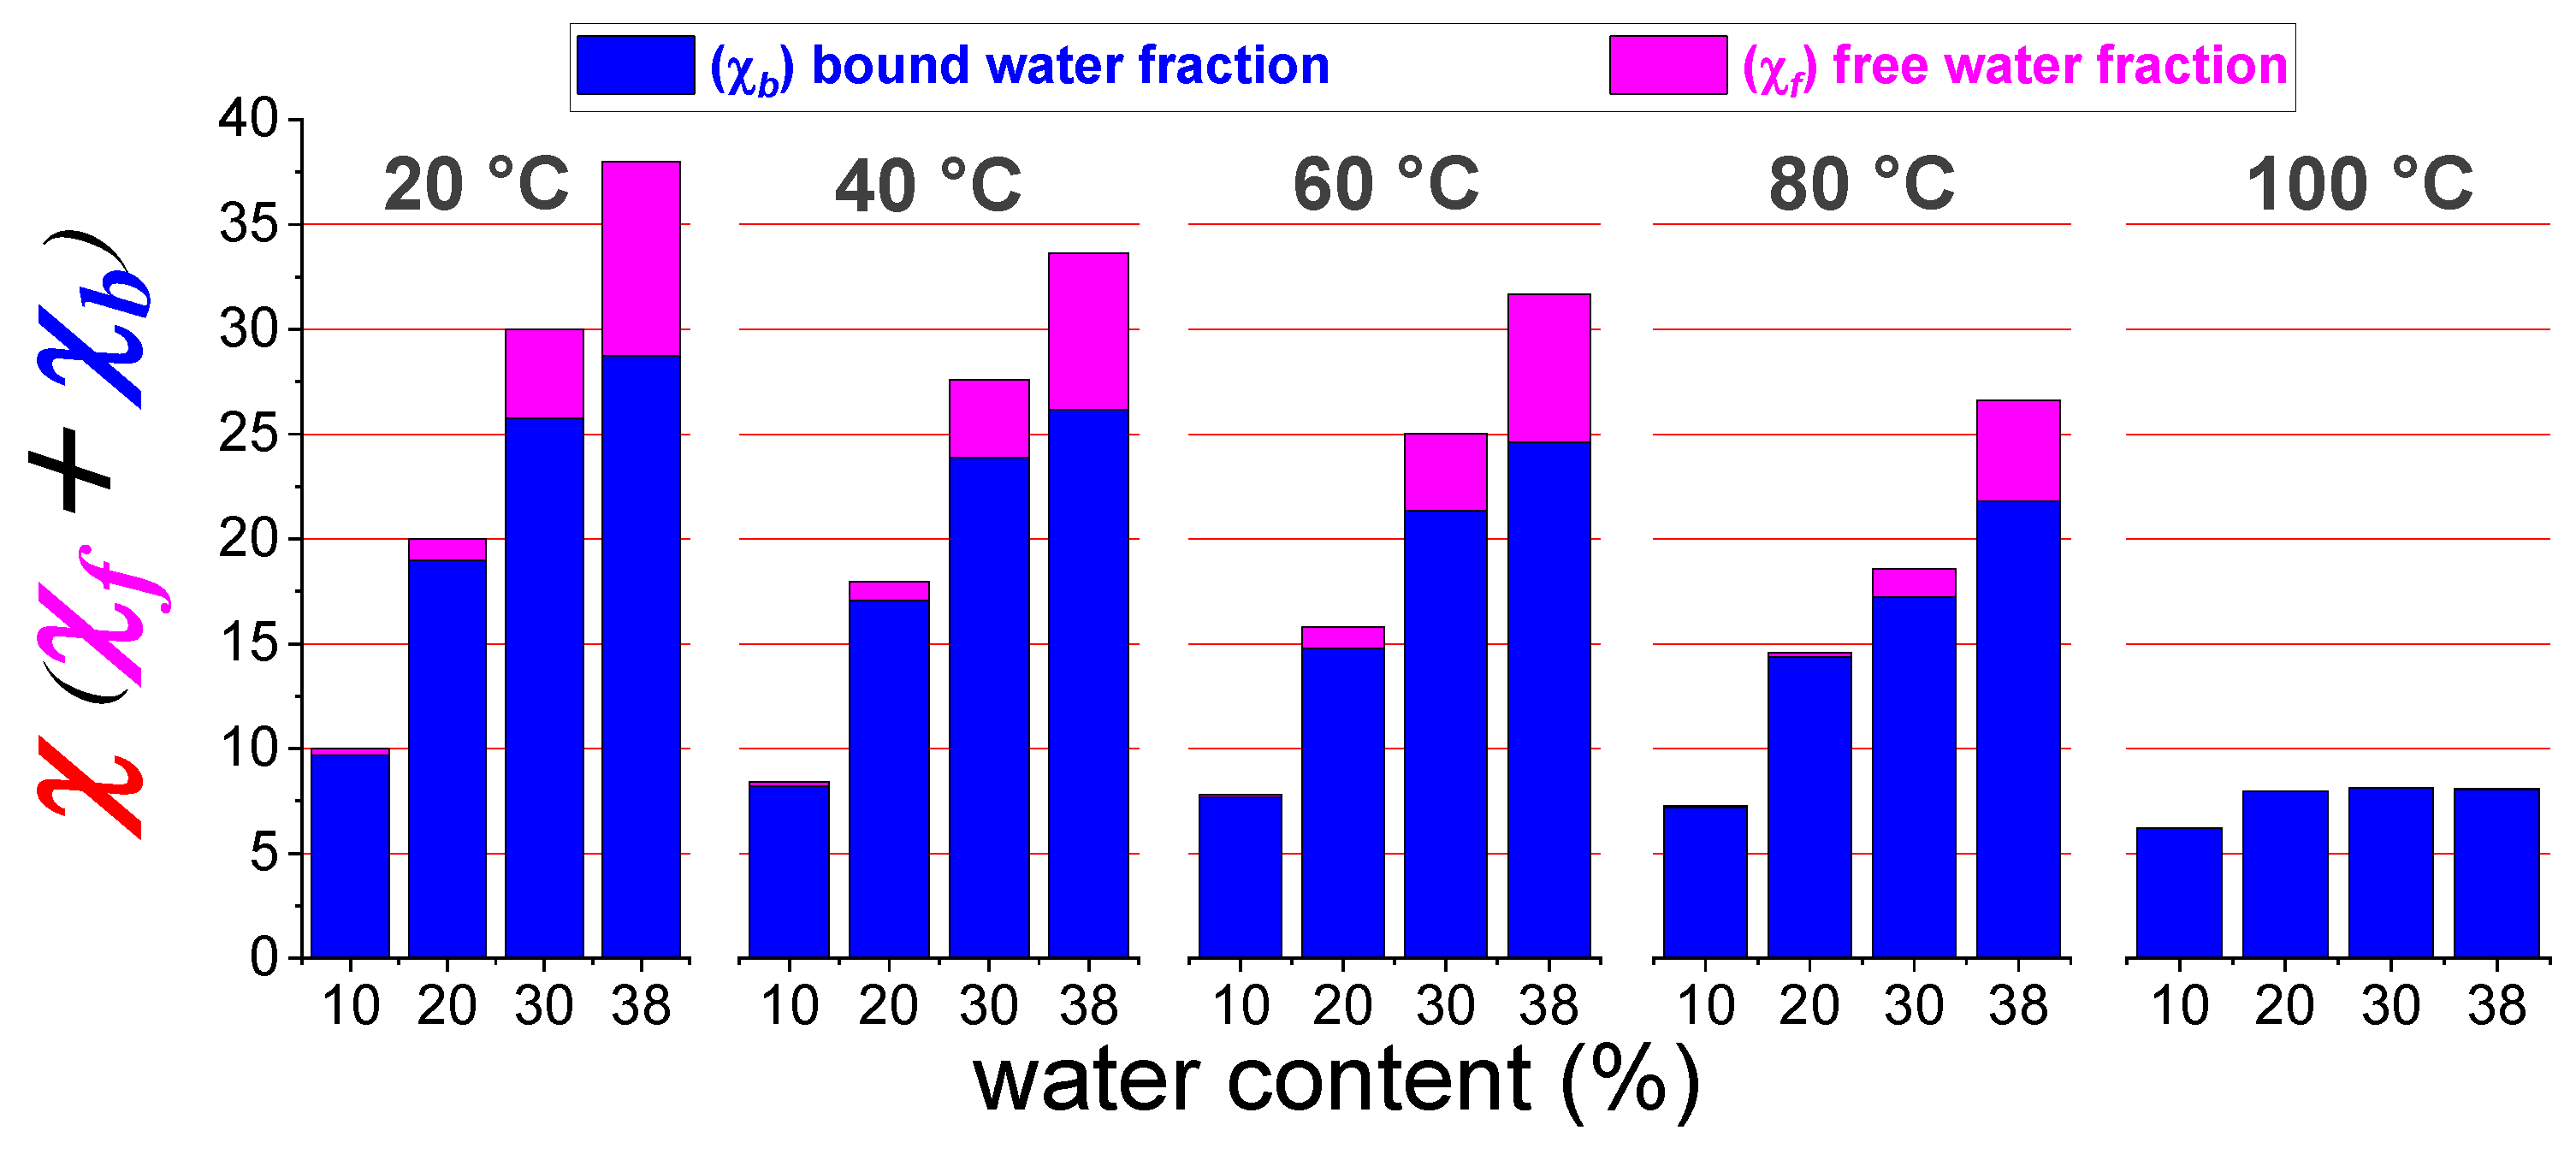
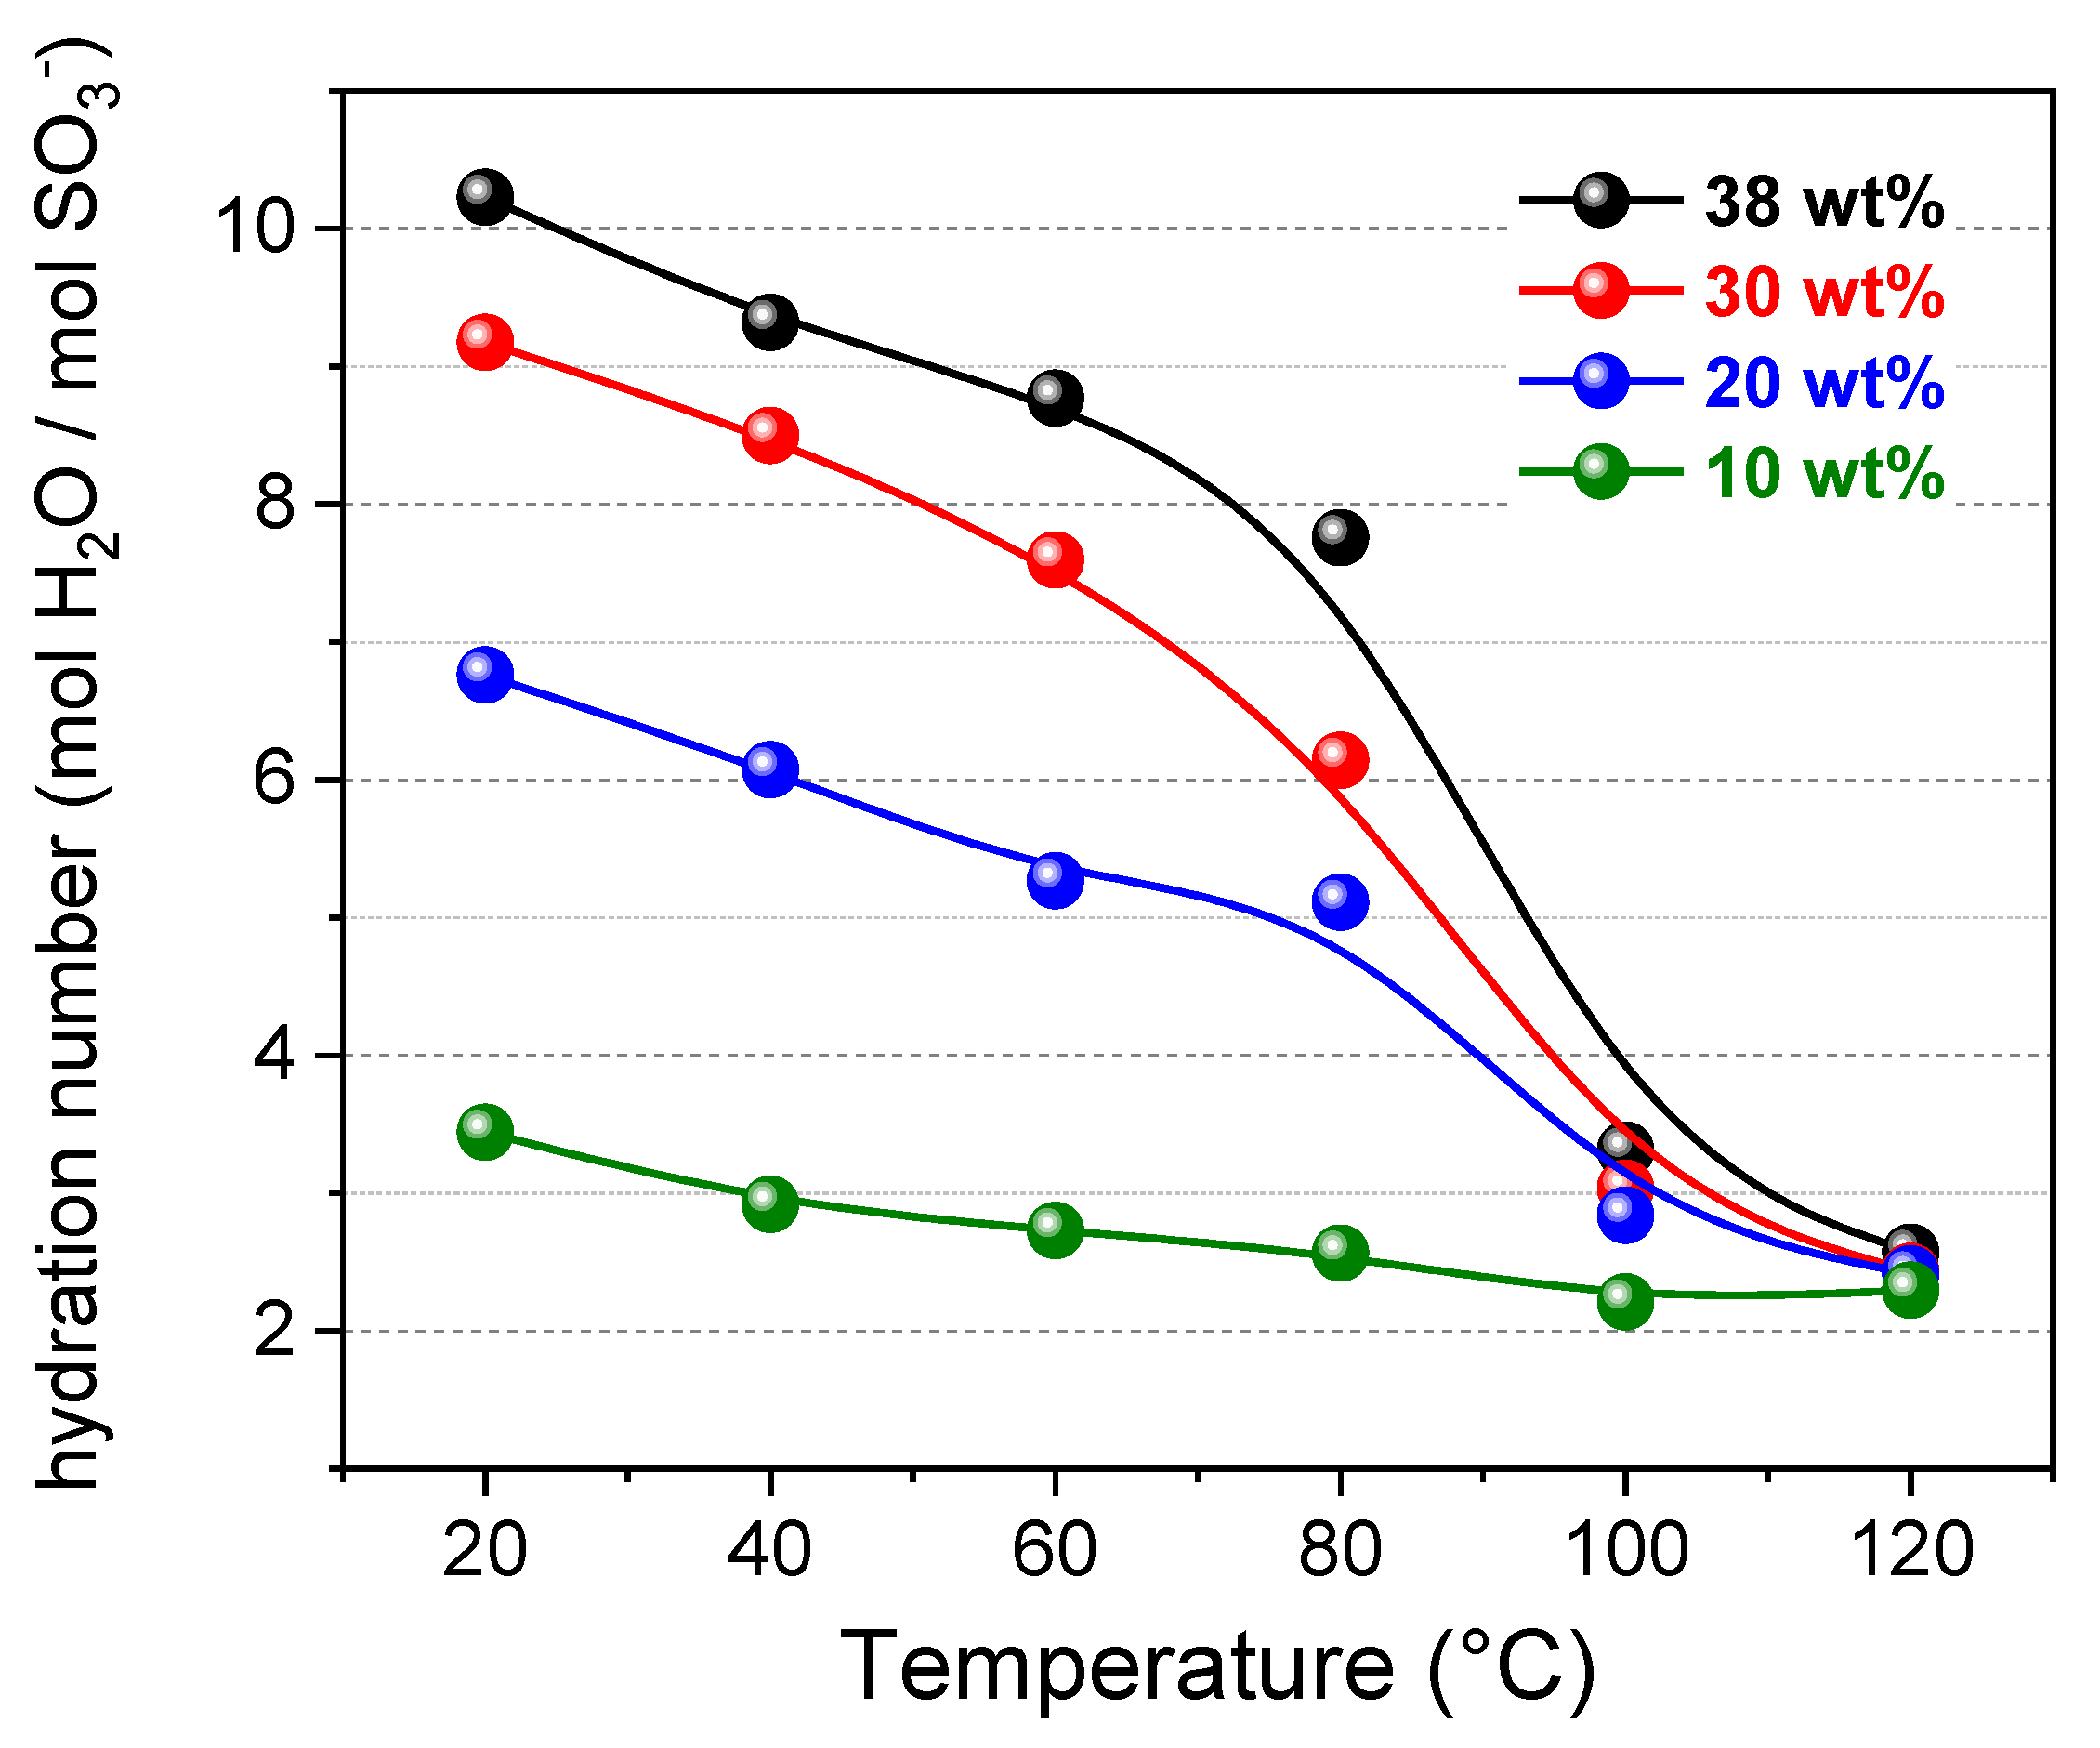
- By increasing the temperature, the total amount of water content gradually decreases due to the evaporation (as already seen by the diffusivity and 1H-NMR signal evolution),
- The membrane swelling (going from 10 wt% up to 38 wt% of water uptake) produces a continuous redistribution of the water molecules among the hydration spheres of the sulfonic groups and the bulk-water, with a progressive growth of both χf and χb,
- Most of the water confined in the membrane is in a “bound state”, i.e., involved in the hydration shell of the polymer’s sulfonic groups since χf is much lower than χ,
- χf gradually decreases during heating and practically collapses above 80 °C, and at 100 °C there is only hydration water.
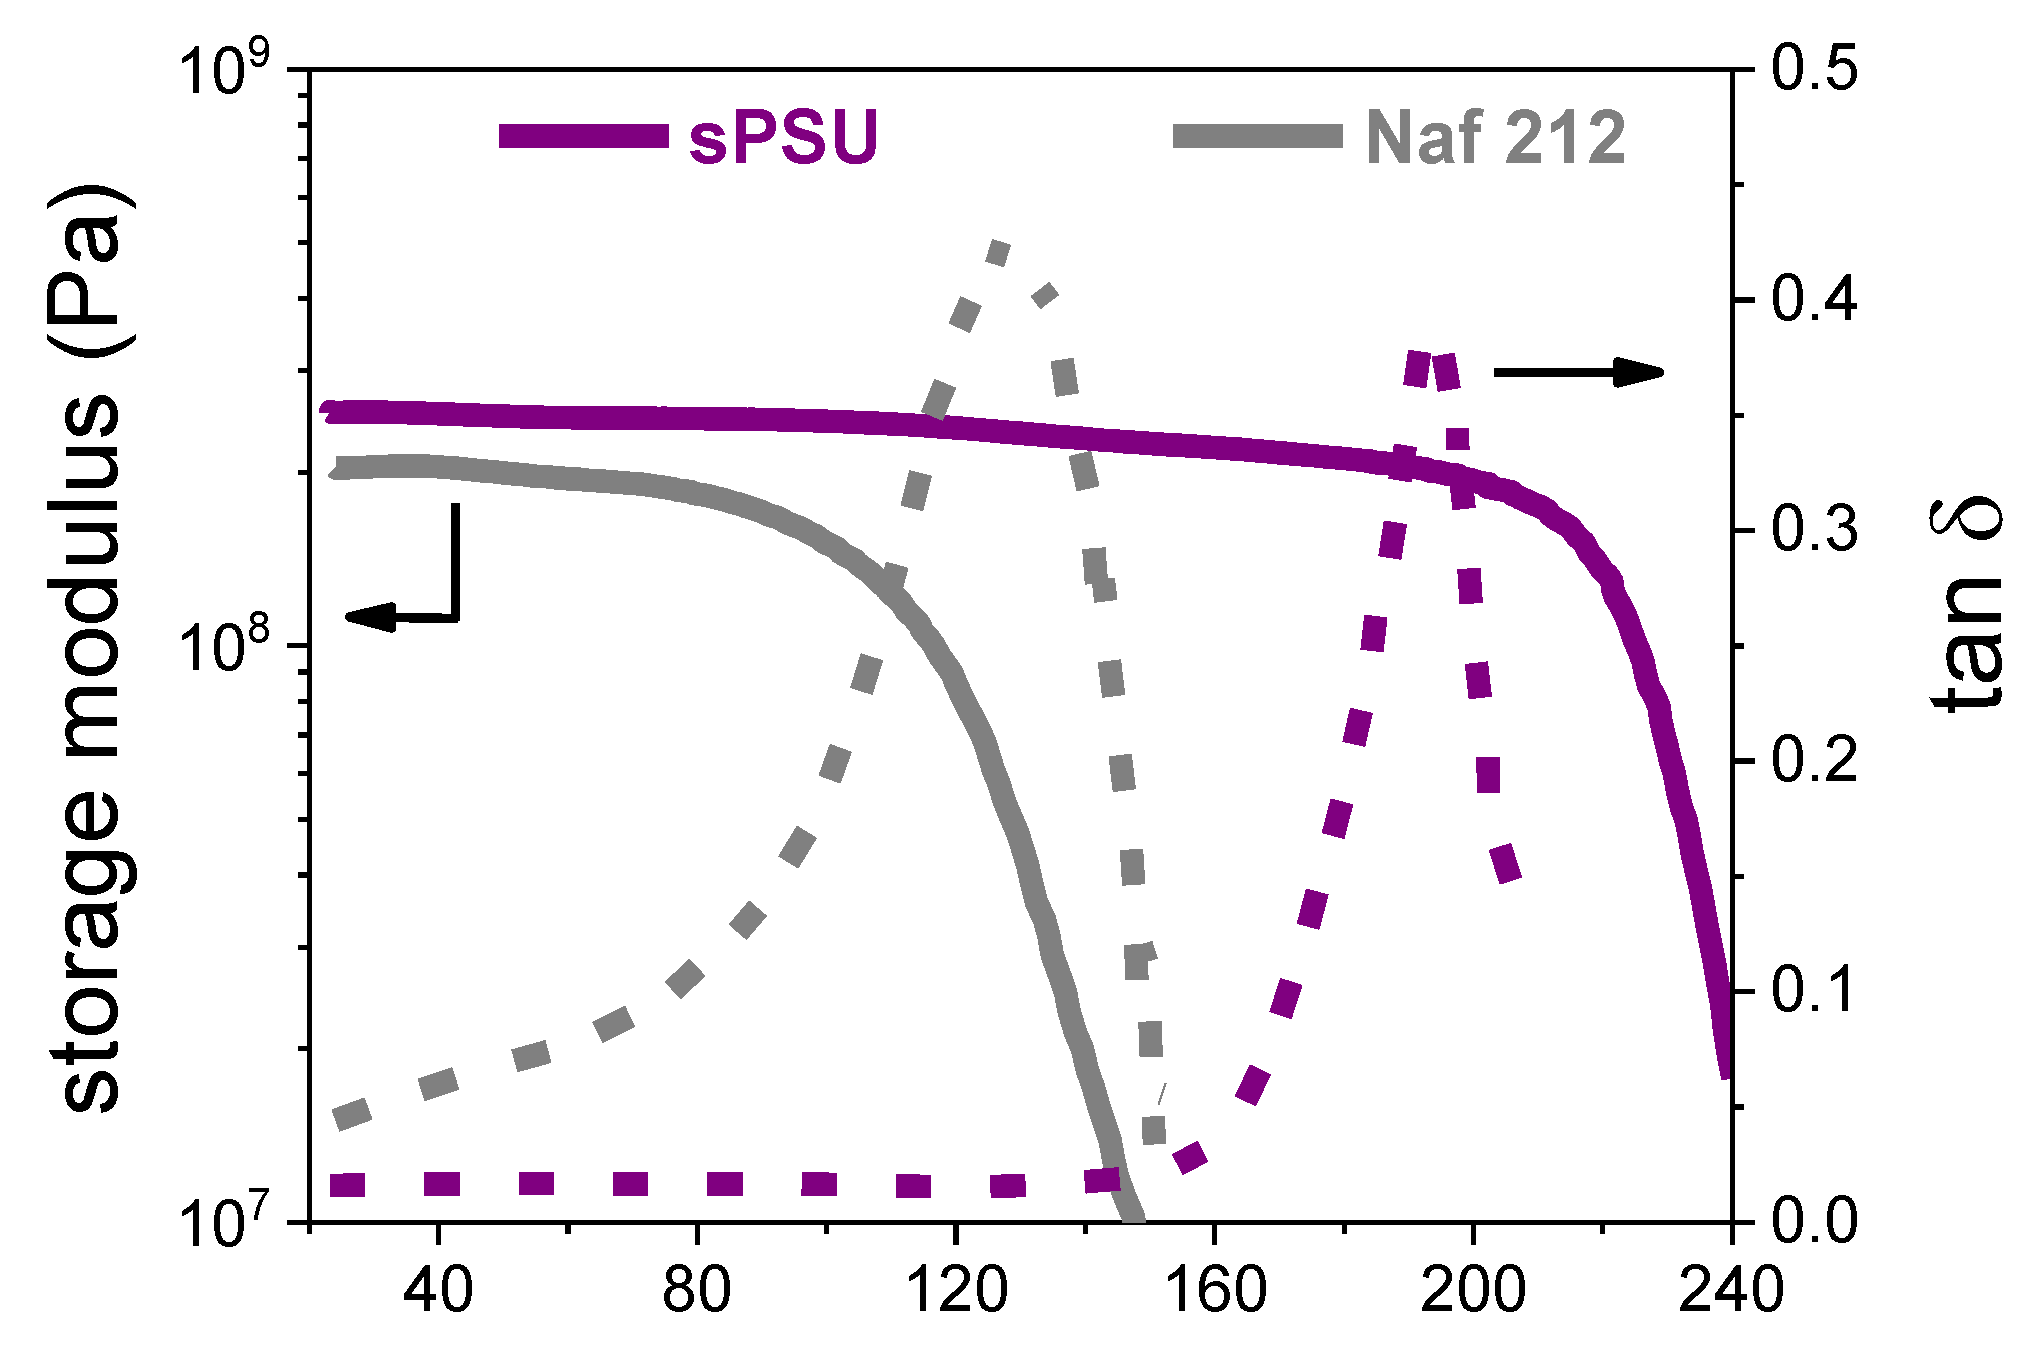
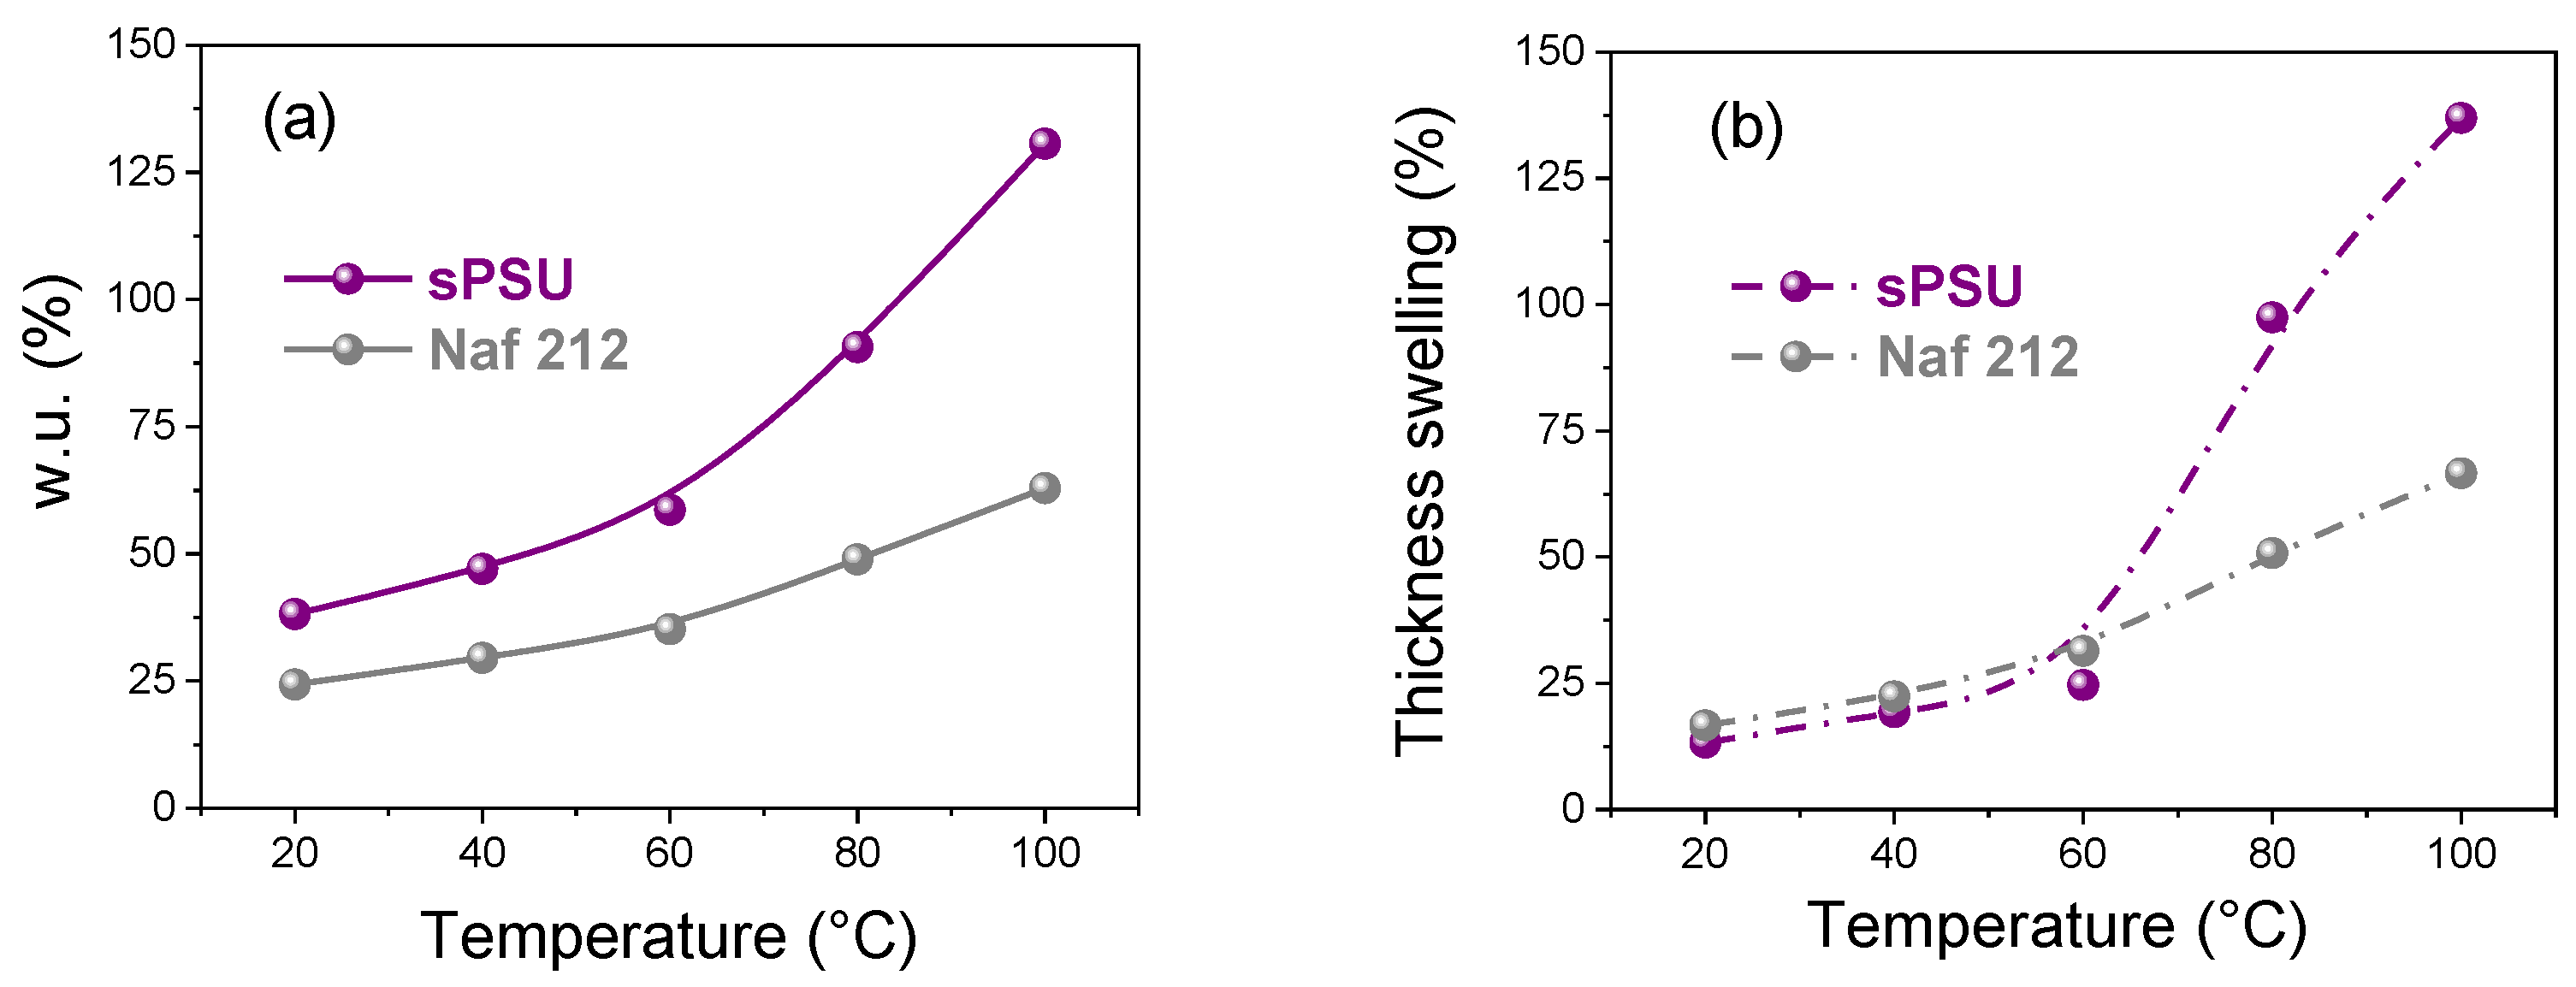
3.3. Mechanical Properties, Dimensional Stability and Electrochemical Performance of sPSU Membrane
4. Conclusions
Supplementary Materials
Author Contributions
Funding
Informed Consent Statement
Data Availability Statement
Conflicts of Interest
References
- Liu, H.; Chen, J.; Hissel, D.; Lu, J.; Hou, M.; Shao, Z. Prognostics methods and degradation indexes of proton exchange membrane fuel cells: A review. Renew. Sustain. Energy Rev. 2020, 123, 109721. [Google Scholar] [CrossRef]
- Toyota Mirai fuel cell electric vehicle relies on Gore technology. Membr. Technol. 2016, 2016, 4. [CrossRef]
- Stropnik, R.; Lotrič, A.; Bernad Montenegro, A.; Sekavčnik, M.; Mori, M. Critical materials in PEMFC systems and a LCA analysis for the potential reduction of environmental impacts with EoL strategies. Energy Sci. Eng. 2019, 7, 2519–2539. [Google Scholar] [CrossRef]
- Ketpang, K.; Shanmugam, S.; Suwanboon, C.; Chanunpanich, N.; Lee, D. Efficient water management of composite membranes operated in polymer electrolyte membrane fuel cells under low relative humidity. J. Membr. Sci. 2015, 493, 285–298. [Google Scholar] [CrossRef]
- Pourzare, K.; Mansourpanah, Y.; Farhadi, S. Advanced nanocomposite membranes for fuel cell applications: A comprehensive review. Biofuel Res. J. 2016, 12, 496–513. [Google Scholar] [CrossRef] [Green Version]
- Haragirimana, A.; Ingabire, P.B.; Liu, Y.; Li, N.; Hu, Z.; Chen, S. An effective strategy to enhance the performance of the proton exchange membranes based on sulfonated poly(ether ether ketone)s. Int. J. Hydrogen Energy 2020, 45, 10017–10029. [Google Scholar] [CrossRef]
- Simari, C.; Enotiadis, A.; Nicotera, I. Transport Properties and Mechanical Features of Sulfonated Polyether Ether Ketone/Organosilica Layered Materials Nanocomposite Membranes for Fuel Cell Applications. Membranes 2020, 10, 87. [Google Scholar] [CrossRef] [PubMed]
- Kim, A.R.; Park, C.J.; Vinothkannan, M.; Yoo, D.J. Sulfonated poly ether sulfone/heteropoly acid composite membranes as electrolytes for the improved power generation of proton exchange membrane fuel cells. Compos. Part B Eng. 2018, 155, 272–281. [Google Scholar] [CrossRef]
- Wong, C.Y.; Wong, W.Y.; Loh, K.S.; Daud, W.R.W.; Lim, K.L.; Khalid, M.; Walvekar, R. Development of Poly(Vinyl Alcohol)-Based Polymers as Proton Exchange Membranes and Challenges in Fuel Cell Application: A Review. Polym. Rev. 2020, 60, 171–202. [Google Scholar] [CrossRef]
- Devrim, Y.; Erkan, S.; Baç, N.; Eroǧlu, I. Preparation and characterization of sulfonated polysulfone/titanium dioxide composite membranes for proton exchange membrane fuel cells. Int. J. Hydrogen Energy 2009, 34, 3467–3475. [Google Scholar] [CrossRef]
- Lufrano, F.; Squadrito, G.; Patti, A.; Passalacqua, E. Sulfonated Polysulfone as Promising Membranes for Polymer Electrolyte Fuel Cells. J. Appl. Polym. Sci. 1999, 3–8. [Google Scholar] [CrossRef]
- Simari, C.; Lufrano, E.; Corrente, G.A.; Nicotera, I. Anisotropic behavior of mechanically extruded sulfonated polysulfone: Implications for proton exchange membrane fuel cell applications. Solid State Ion. 2021, 362, 115581. [Google Scholar] [CrossRef]
- Simari, C.; Lufrano, E.; Brunetti, A.; Barbieri, G.; Nicotera, I. Highly-performing and low-cost nanostructured membranes based on Polysulfone and layered doubled hydroxide for high-temperature proton exchange membrane fuel cells. J. Power Sources 2020, 471, 228440. [Google Scholar] [CrossRef]
- Lufrano, E.; Simari, C.; Lo Vecchio, C.; Aricò, A.S.; Baglio, V.; Nicotera, I. Barrier properties of sulfonated polysulfone/layered double hydroxides nanocomposite membrane for direct methanol fuel cell operating at high methanol concentrations. Int. J. Hydrogen Energy 2020. [Google Scholar] [CrossRef]
- Zhu, Y.; Manthiram, A. Synthesis and characterization of polysulfone-containing sulfonated side chains for direct methanol fuel cells. J. Power Sources 2011, 196, 7481–7487. [Google Scholar] [CrossRef]
- Hou, H.; Di Vona, M.L.; Knauth, P. Durability of Sulfonated Aromatic Polymers for Proton-Exchange-Membrane Fuel Cells. ChemSusChem 2011, 4, 1526–1536. [Google Scholar] [CrossRef]
- Park, C.H.; Lee, C.H.; Guiver, M.D.; Lee, Y.M. Sulfonated hydrocarbon membranes for medium-temperature and low-humidity proton exchange membrane fuel cells (PEMFCs). Prog. Polym. Sci. 2011, 36, 1443–1498. [Google Scholar] [CrossRef] [Green Version]
- Lufrano, F.; Baglio, V.; Staiti, P.; Stassi, A.; Aricò, A.S.; Antonucci, V. Investigation of sulfonated polysulfone membranes as electrolyte in a passive-mode direct methanol fuel cell mini-stack. J. Power Sources 2010, 195, 7727–7733. [Google Scholar] [CrossRef]
- Simari, C.; Baglio, V.; Lo Vecchio, C.; Aricò, A.S.; Agostino, R.G.; Coppola, L.; Oliviero Rossi, C.; Nicotera, I. Reduced methanol crossover and enhanced proton transport in nanocomposite membranes based on clay−CNTs hybrid materials for direct methanol fuel cells. Ionics 2017, 23. [Google Scholar] [CrossRef]
- Tanner, J.E. Use of the stimulated echo in NMR diffusion studies. J. Chem Phys. 1970, 52, 2523–2526. [Google Scholar] [CrossRef]
- Nicotera, I.; Kosma, V.; Simari, C.; D’Urso, C.; Aricò, A.S.; Baglio, V. Methanol and proton transport in layered double hydroxide and smectite clay-based composites: Influence on the electrochemical behavior of direct methanol fuel cells at intermediate temperatures. J. Solid State Electrochem. 2015, 19, 2053–2061. [Google Scholar] [CrossRef]
- Simari, C.; Enotiadis, A.; Lo Vecchio, C.; Baglio, V.; Coppola, L.; Nicotera, I. Advances in hybrid composite membranes engineering for high-performance direct methanol fuel cells by alignment of 2D nanostructures and a dual-layer approach. J. Membr. Sci. 2020, 599, 117858. [Google Scholar] [CrossRef]
- Prejanò, M.; Marino, T.; Russo, N. On the inhibition mechanism of glutathione transferase P1 by piperlongumine. Insight from theory. Front. Chem. 2018, 6, 606. [Google Scholar] [CrossRef]
- Prejanò, M.; Romeo, I.; Sgrizzi, L.; Russo, N.; Marino, T. Why hydroxy-proline improves the catalytic power of the peptidoglycan: N -deacetylase enzyme: Insight from theory. Phys. Chem. Chem. Phys. 2019, 21, 23338–23345. [Google Scholar] [CrossRef] [PubMed]
- Prejanò, M.; Medina, F.E.; Ramos, M.J.; Russo, N.; Fernandes, P.A.; Marino, T. How the Destabilization of a Reaction Intermediate Affects Enzymatic Efficiency: The Case of Human Transketolase. ACS Catal. 2020, 10, 2872–2881. [Google Scholar] [CrossRef]
- Wang, J.; Wolf, R.M.; Caldwell, J.W.; Kollman, P.A.; Case, D.A. Development and Testing of a General Amber Force Field. J. Comput. Chem. 2004, 25, 1157–1174. [Google Scholar] [CrossRef]
- Bayly, C.I.; Cieplak, P.; Cornell, W.D.; Kollman, P.A. A well-behaved electrostatic potential based method using charge restraints for deriving atomic charges: The RESP model. J. Phys. Chem. 1993, 97, 10269–10280. [Google Scholar] [CrossRef]
- Martínez, L.; Andrade, R.; Birgin, E.G.; Martínez, J.M. Software News and Update Packmol: A Package for Building Initial Configurations for Molecular Dynamics Simulations. J. Comput. Chem. 2009, 30, 2157–2164. [Google Scholar] [CrossRef] [PubMed]
- Ryckaert, J.P.; Ciccotti, G.; Berendsen, H.J.C. Numerical integration of the cartesian equations of motion of a system with constraints: Molecular dynamics of n-alkanes. J. Comput. Phys. 1977, 23, 327–341. [Google Scholar] [CrossRef] [Green Version]
- Ewald, P.P. Die Berechnung optischer und elektrostatischer Gitterpotentiale. Ann. Phys. 1921, 369, 253–287. [Google Scholar] [CrossRef] [Green Version]
- Case, D.A.; Ben-Shalom, I.Y.; Brozell, S.R.; Cerutti, D.S.; Cheatham, T.E.; Cruzeiro, V.W.D.; Darden, T.A.; Duke, R.E.; Ghoreishi, D.; Gilson, M.K.; et al. AMBER 2016; University of California: San Francisco, CA, USA, 2018. [Google Scholar]
- Roe, D.R.; Cheatham, T.E. PTRAJ and CPPTRAJ: Software for processing and analysis of molecular dynamics trajectory data. J. Chem. Theory Comput. 2013, 9, 3084–3095. [Google Scholar] [CrossRef] [PubMed]
- John, P. Perdew Density-functional approximation for the correlation energy of the inhomogeneous electron gas. Phys. Rev. B 1986, 33, 8822–8824. [Google Scholar] [CrossRef]
- Frisch, M.J.; Trucks, G.W.; Schlegel, H.B.; Scuseria, G.E.; Robb, M.A.; Cheeseman, J.R.; Scalmani, G.; Barone, V.; Petersson, G.A.; Nakatsuji, H.; et al. Gaussian 09, Revision D.01; Gaussian, Inc.: Wallingford, UK, 2016. [Google Scholar]
- Contreras-garcía, J.; Johnson, E.R.; Keinan, S.; Chaudret, R.; Piquemal, J.; Beratan, D.N.; Yang, W. NCIPLOT: A Program for Plotting Noncovalent Interaction Regions. J. Chem. Theory Comput. 2011, 7, 625–632. [Google Scholar] [CrossRef]
- Gartner, T.E.; Jayaraman, A. Modeling and Simulations of Polymers: A Roadmap. Macromolecules 2019, 52, 755–786. [Google Scholar] [CrossRef] [Green Version]
- Xiao, B.; Wang, W.E.I.; Zhang, X.; Long, G.; Chen, H.; Cai, H.; Deng, L.I.N. A novel fractal model for relative permeability of gas diffusion layer in proton exchange membrane fuel cell with capillary pressure effect. Fractals 2019, 27, 1950012. [Google Scholar] [CrossRef]
- Liang, M.; Liu, Y.; Xiao, B.; Yang, S.; Wang, Z.; Han, H. An analytical model for the transverse permeability of gas diffusion layer with electrical double layer effects in proton exchange membrane fuel cells. Int. J. Hydrogen Energy 2018, 43, 17880–17888. [Google Scholar] [CrossRef]
- Abramyan, T.M.; Snyder, J.A.; Thyparambil, A.A.; Stuart, S.J.; Latour, R.A. Cluster analysis of molecular simulation trajectories for systems where both conformation and orientation of the sampled states are important. J. Comput. Chem. 2016, 37, 1973–1982. [Google Scholar] [CrossRef] [Green Version]
- Cui, S.T.; Liu, J.; Selvan, M.E.; Keffer, D.J.; Edwards, B.J.; Steele, W.V. A molecular dynamics study of nafion polyelectrolyte membrane and the aqueous phase structure for proton transport. J. Phys. Chem. B 2007, 119, 2208–2218. [Google Scholar] [CrossRef]
- Sengupta, S.; Lyulin, A.V. Molecular Modeling of Structure and Dynamics of Nafion Protonation States. J. Phys. Chem. B 2019, 123, 6882–6891. [Google Scholar] [CrossRef] [PubMed] [Green Version]
- Akbari, S.; Mosavian, M.T.H.; Moosavi, F.; Ahmadpour, A. Molecular dynamics simulation of Keggin HPA doped Nafion® 117 as a polymer electrolyte membrane. RSC Adv. 2017, 7, 44537–44546. [Google Scholar] [CrossRef] [Green Version]
- Komarov, P.V.; Khalatur, P.G.; Khokhlov, A.R. Large-scale atomistic and quantum-mechanical simulations of a nafion membrane: Morphology, proton solvation and charge transport. Beilstein J. Nanotechnol. 2013, 4, 567–587. [Google Scholar] [CrossRef] [Green Version]
- Portale, G.; Carbone, A.; Martinelli, A.; Passalacqua, E. Microstructure, state of water and proton conductivity of sulfonated poly(ether ether ketone). Solid State Ion. 2013, 252, 62–67. [Google Scholar] [CrossRef]
- Wang, C.; Paddison, S.J. Mesoscale modeling of hydrated morphologies of sulfonated polysulfone ionomers. Soft Matter 2014, 10, 819–830. [Google Scholar] [CrossRef] [PubMed]
- Simari, C.; Vecchio, C.L.; Enotiadis, A.; Davoli, M.; Baglio, V.; Nicotera, I. Toward optimization of a robust low-cost sulfonated-polyethersulfone containing layered double hydroxide for PEM fuel cells. J. Appl. Polym. Sci. 2019, 47884, 1–10. [Google Scholar] [CrossRef]
- Nicotera, I.; Simari, C.; Boutsika, L.G.; Coppola, L.; Spyrou, K.; Enotiadis, A. NMR investigation on nanocomposite membranes based on organosilica layered materials bearing different functional groups for PEMFCs. Int. J. Hydrogen Energy 2017, 42, 27940–27949. [Google Scholar] [CrossRef]
- Nicotera, I.; Kosma, V.; Simari, C.; Ranieri, G.A.; Sgambetterra, M.; Panero, S.; Navarra, M.A. An NMR study on the molecular dynamic and exchange effects in composite Nafion/sulfated titania membranes for PEMFCs. Int. J. Hydrogen Energy 2015, 40, 14651–14660. [Google Scholar] [CrossRef]
- Lu, Z.; Polizos, G.; Macdonald, D.D.; Manias, E. State of Water in Perfluorosulfonic Ionomer (Nafion 117) Proton Exchange Membranes. J. Electrochem. Soc. 2008, 155, B163. [Google Scholar] [CrossRef]
- Coppola, L.; Muzzalupo, R.; Ranieri, G.A. Temperature dependence of Water Self-Diffusion in the Gel phase of a Potassium Palmitate System. J. Phys. II 1996, 6, 657–666. [Google Scholar] [CrossRef] [Green Version]
- Gottwald, A.; Creamer, L.K.; Hubbard, P.L.; Callaghan, P.T. Diffusion, relaxation, and chemical exchange in casein gels: A nuclear magnetic resonance study. J. Chem. Phys. 2005, 122, 34506. [Google Scholar] [CrossRef]
- Johnson, C.S. Effects of Chemical Exchange in Diffusion-Ordered 2D NMR Spectra. J. Magn. Reson. Ser. A 1993, 102, 214–218. [Google Scholar] [CrossRef]
- Wang, J. Theory of the Self-diffusion of Water in Protein Solutions. A New Method for Studying the Hydration and Shape of Protein Molecules. J. Am. Chem. Soc. 1954, 76, 4755–4763. [Google Scholar] [CrossRef]
- Chidichimo, G.; De Fazio, D.; Ranieri, G.; Terenzi, M. Self-diffusion of water in a lamellar lyotropic liquid crystal: A study by Pulased Field Gradient NMR. Chem. Phys. Lett. 1985, 117, 514–517. [Google Scholar] [CrossRef]
- Jönsson, B.; Wennerström, H.; Nilsson, P.G.; Linse, P. Self-diffusion of small molecules in colloidal systems. Colloid Polym. Sci. 1986, 264, 77–88. [Google Scholar] [CrossRef]
- Faxen, H. Der Widerstand gegen die Bewegung einer starren Kugel in einer zähen Flüssigkeit, die zwischen zwei parallelen ebenen Wänden eingeschlossen ist. Ann. Phys. 1922, 4, 89–119. [Google Scholar] [CrossRef] [Green Version]
- Moreau, P.; Van Effenterre, D.; Navailles, L.; Nallet, F.; Roux, D. Confined diffusion of hydrophilic probes inserted in lyotropic lamellar phases. Eur. Phys. J. E 2008, 26, 225–234. [Google Scholar] [CrossRef]
- Kreuer, K.D.; Paddison, S.J.; Spohr, E.; Schuster, M. Transport in proton conductors for fuel-cell applications: Simulations, elementary reactions, and phenomenology. Chem. Rev. 2004, 104, 4637–4678. [Google Scholar] [CrossRef] [Green Version]
- Choi, B.G.; Hong, J.; Park, Y.C.; Jung, D.H.; Hong, W.H.; Hammond, P.T.; Park, H. Innovative polymer nanocomposite electrolytes: Nanoscale manipulation of ion channels by functionalized graphenes. ACS Nano 2011, 5, 5167–5174. [Google Scholar] [CrossRef]
- Wu, H.-L.; Ma, C.-C.M.; Li, C.-H.; Chen, C.-Y. Swelling Behavior and Solubility Parameter of Sulfonated Poly(ether ether ketone). J. Polym. Sci. Part B Polym. Phys. 2006, 44, 3128–3134. [Google Scholar] [CrossRef]
- Koziara, B.T.; Akkilic, N.; Nijmeijer, K.; Benes, N.E. The effects of water on the morphology and the swelling behavior of sulfonated poly(ether ether ketone) films. J. Mater. Sci. 2016, 51, 1074–1082. [Google Scholar] [CrossRef] [Green Version]
- Shen, L.; Xiao, G.; Yan, D.; Sun, G.; Zhu, P.; Na, Z. Comparison of the water uptake and swelling between sulfonated poly(phthalazinone ether ketone ketone)s and sulfonated poly(arylene ether ketone ketone)s. Polym. Bull. 2005, 54, 57–64. [Google Scholar] [CrossRef]
- Kreuer, K.D. On the development of proton conducting polymer membranes for hydrogen and methanol fuel cells. J. Membr. Sci. 2001, 185, 29–39. [Google Scholar] [CrossRef]
- de Bonis, C.; Simari, C.; Kosma, V.; Mecheri, B.; D’Epifanio, A.; Allodi, V.; Mariotto, G.; Brutti, S.; Suarez, S.; Pilar, K.; et al. Enhancement of proton mobility and mitigation of methanol crossover in sPEEK fuel cells by an organically modified titania nanofiller. J. Solid State Electrochem. 2016, 20. [Google Scholar] [CrossRef]
- Bai, H.; Li, Y.; Zhang, H.; Chen, H.; Wu, W.; Wang, J.; Liu, J. Anhydrous proton exchange membranes comprising of chitosan and phosphorylated graphene oxide for elevated temperature fuel cells. J. Membr. Sci. 2015, 495, 48–60. [Google Scholar] [CrossRef]
- Simari, C.; Stallworth, P.; Peng, J.; Coppola, L.; Greenbaum, S.; Nicotera, I. Graphene oxide and sulfonated-derivative: Proton transport properties and electrochemical behavior of Nafion-based nanocomposites. Electrochim. Acta 2019, 297, 240–249. [Google Scholar] [CrossRef]
- Kreuer, K.-D. Proton Conductivity: Materials and Applications. Chem. Mater. 1996, 8, 610–641. [Google Scholar] [CrossRef]
- Kim, A.R.; Vinothkannan, M.; Yoo, D.J. Sulfonated fluorinated multi-block copolymer hybrid containing sulfonated(poly ether ether ketone) and graphene oxide: A ternary hybrid membrane architecture for electrolyte applications in proton exchange membrane fuel cells. J. Energy Chem. 2018, 27, 1247–1260. [Google Scholar] [CrossRef]
- Elumalai, V.; Kavya Sravanthi, C.K.; Sangeetha, D. Synthesis characterization and performance evaluation of tungstic acid functionalized SBA-15/SPEEK composite membrane for proton exchange membrane fuel cell. Appl. Nanosci. 2019, 9, 1163–1172. [Google Scholar] [CrossRef]
- Gayathri, R.; Prabhu, M.R. Protonated state and synergistic role of Nd3+doped barium cerate perovskite for the enhancement of ionic pathways in novel sulfonated polyethersulfone for H2/O2fuel cells. Soft Matter 2020, 16, 4220–4233. [Google Scholar] [CrossRef]
- Abouzari-Lotf, E.; Zakeri, M.; Nasef, M.M.; Miyake, M.; Mozarmnia, P.; Bazilah, N.A.; Emelin, N.F.; Ahmad, A. Highly durable polybenzimidazole composite membranes with phosphonated graphene oxide for high temperature polymer electrolyte membrane fuel cells. J. Power Sources 2019, 412, 238–245. [Google Scholar] [CrossRef]


| RH [%] | sPSU | Nafion 212 | ||||
|---|---|---|---|---|---|---|
| σ @ 90 °C [mS cm−1] | σ @ 120 °C [mS cm−1] | Ea [eV] | σ @ 90 °C [mS cm−1] | σ @ 120 °C [mS cm−1] | Ea [eV] | |
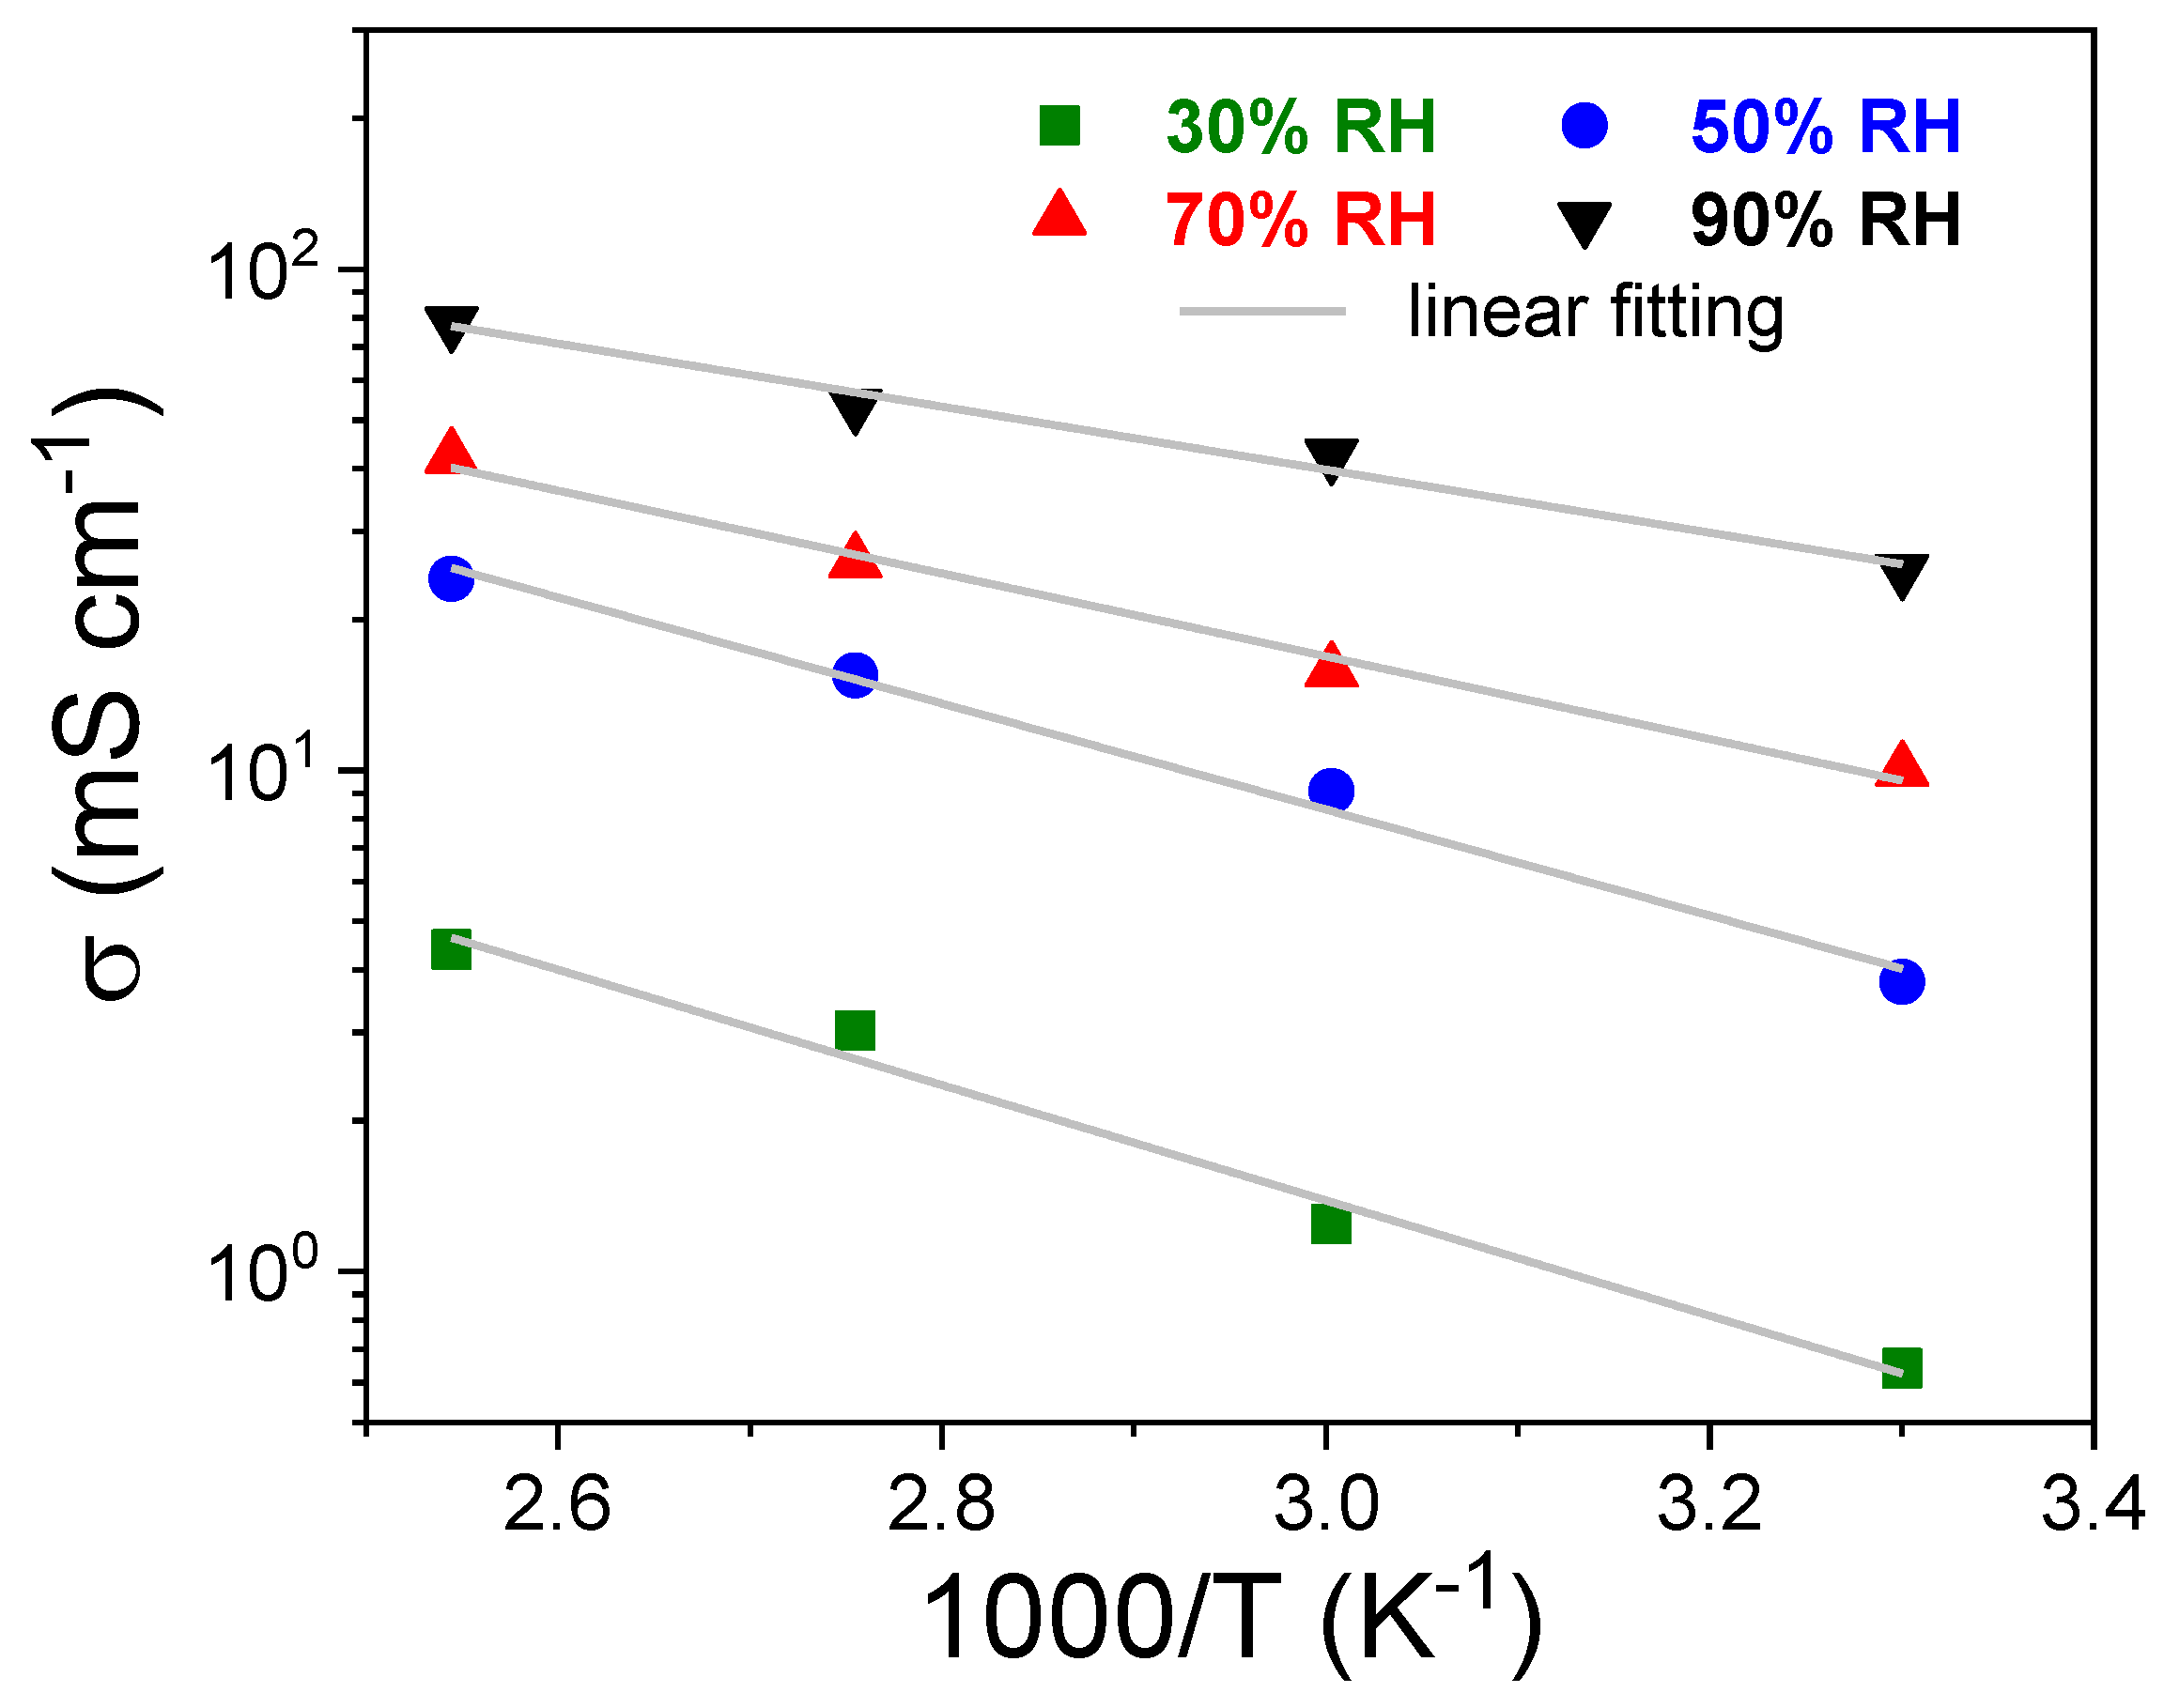
| 30 | 3.0 ± 0.1 | 4.39 ± 0.1 | 0.33 ± 0.03 | 8.8 ± 0. 2 | 17.4 ± 0.3 | 0.23 ± 0.02 |
| 50 | 15.5 ± 0.1 | 24.10 ± 0.2 | 0.30 ± 0.02 | 24.4 ± 0.2 | 38.6 ± 0.4 | 0.21 ± 0.03 |
| 70 | 26.0 ± 0.2 | 42.19 ± 0.2 | 0.21 ± 0.01 | 48.6 ± 0.3 | 72.95 ± 0.4 | 0.17 ± 0.02 |
| 90 | 53.5 ± 0.2 | 78.2 ± 0.3 | 0.14 ± 0.02 | 91.1 ± 0.4 | 127.9 ± 0.6 | 0.12 ± 0.01 |
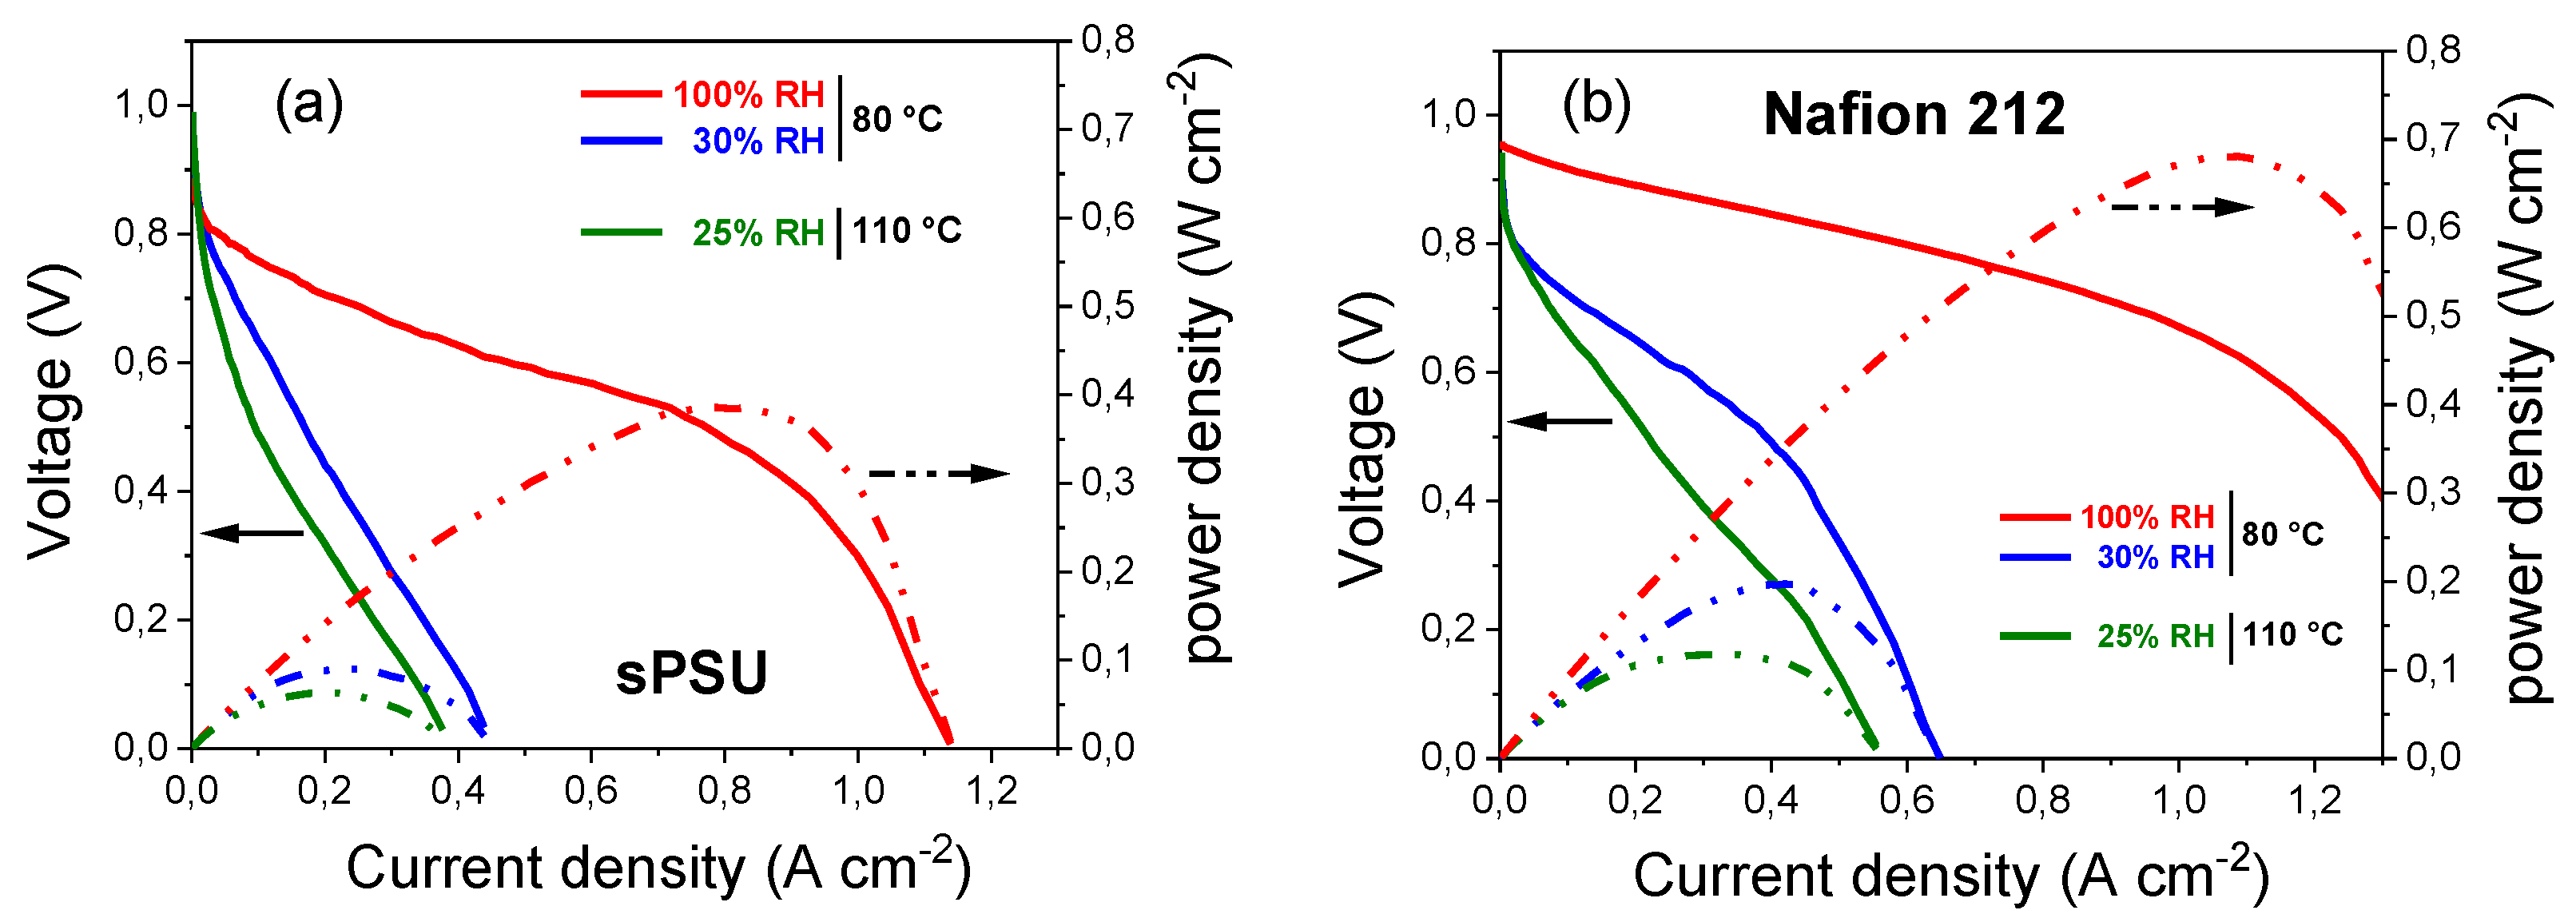
| Membrane | T | RH | OCV | Max Power Density | Ref. |
|---|---|---|---|---|---|
| [°C] | [%] | [V] | [mW cm−2] | ||
| sPSU80 | 80 | 100 | 0.917 | 388 | This work |
| 80 | 30 | 0.908 | 91 | ||
| 110 | 25 | 0.899 | 64 | ||
| Naf 212 | 80 | 100 | 0.902 | 683 | |
| 80 | 30 | 0.901 | 197 | ||
| 110 | 25 | 0.890 | 118 | ||
| SFMC | 70 | 100 | 0.980 | 182 | [68] |
| sPEEK | 80 | 100 | 0.855 | 255 | [69] |
| sPES | 80 | 100 | 0.850 | 66 | [70] |
| Chitosan | 120 | 20 | 0.959 | 57 | [65] |
| PBI | 120 | dry | 0.884 | 202 | [71] |
Publisher’s Note: MDPI stays neutral with regard to jurisdictional claims in published maps and institutional affiliations. |
© 2021 by the authors. Licensee MDPI, Basel, Switzerland. This article is an open access article distributed under the terms and conditions of the Creative Commons Attribution (CC BY) license (http://creativecommons.org/licenses/by/4.0/).
Share and Cite
Simari, C.; Prejanò, M.; Lufrano, E.; Sicilia, E.; Nicotera, I. Exploring the Structure–Performance Relationship of Sulfonated Polysulfone Proton Exchange Membrane by a Combined Computational and Experimental Approach. Polymers 2021, 13, 959. https://doi.org/10.3390/polym13060959
Simari C, Prejanò M, Lufrano E, Sicilia E, Nicotera I. Exploring the Structure–Performance Relationship of Sulfonated Polysulfone Proton Exchange Membrane by a Combined Computational and Experimental Approach. Polymers. 2021; 13(6):959. https://doi.org/10.3390/polym13060959
Chicago/Turabian StyleSimari, Cataldo, Mario Prejanò, Ernestino Lufrano, Emilia Sicilia, and Isabella Nicotera. 2021. "Exploring the Structure–Performance Relationship of Sulfonated Polysulfone Proton Exchange Membrane by a Combined Computational and Experimental Approach" Polymers 13, no. 6: 959. https://doi.org/10.3390/polym13060959