3.4.1. Absorbance and Absorption Edge Study
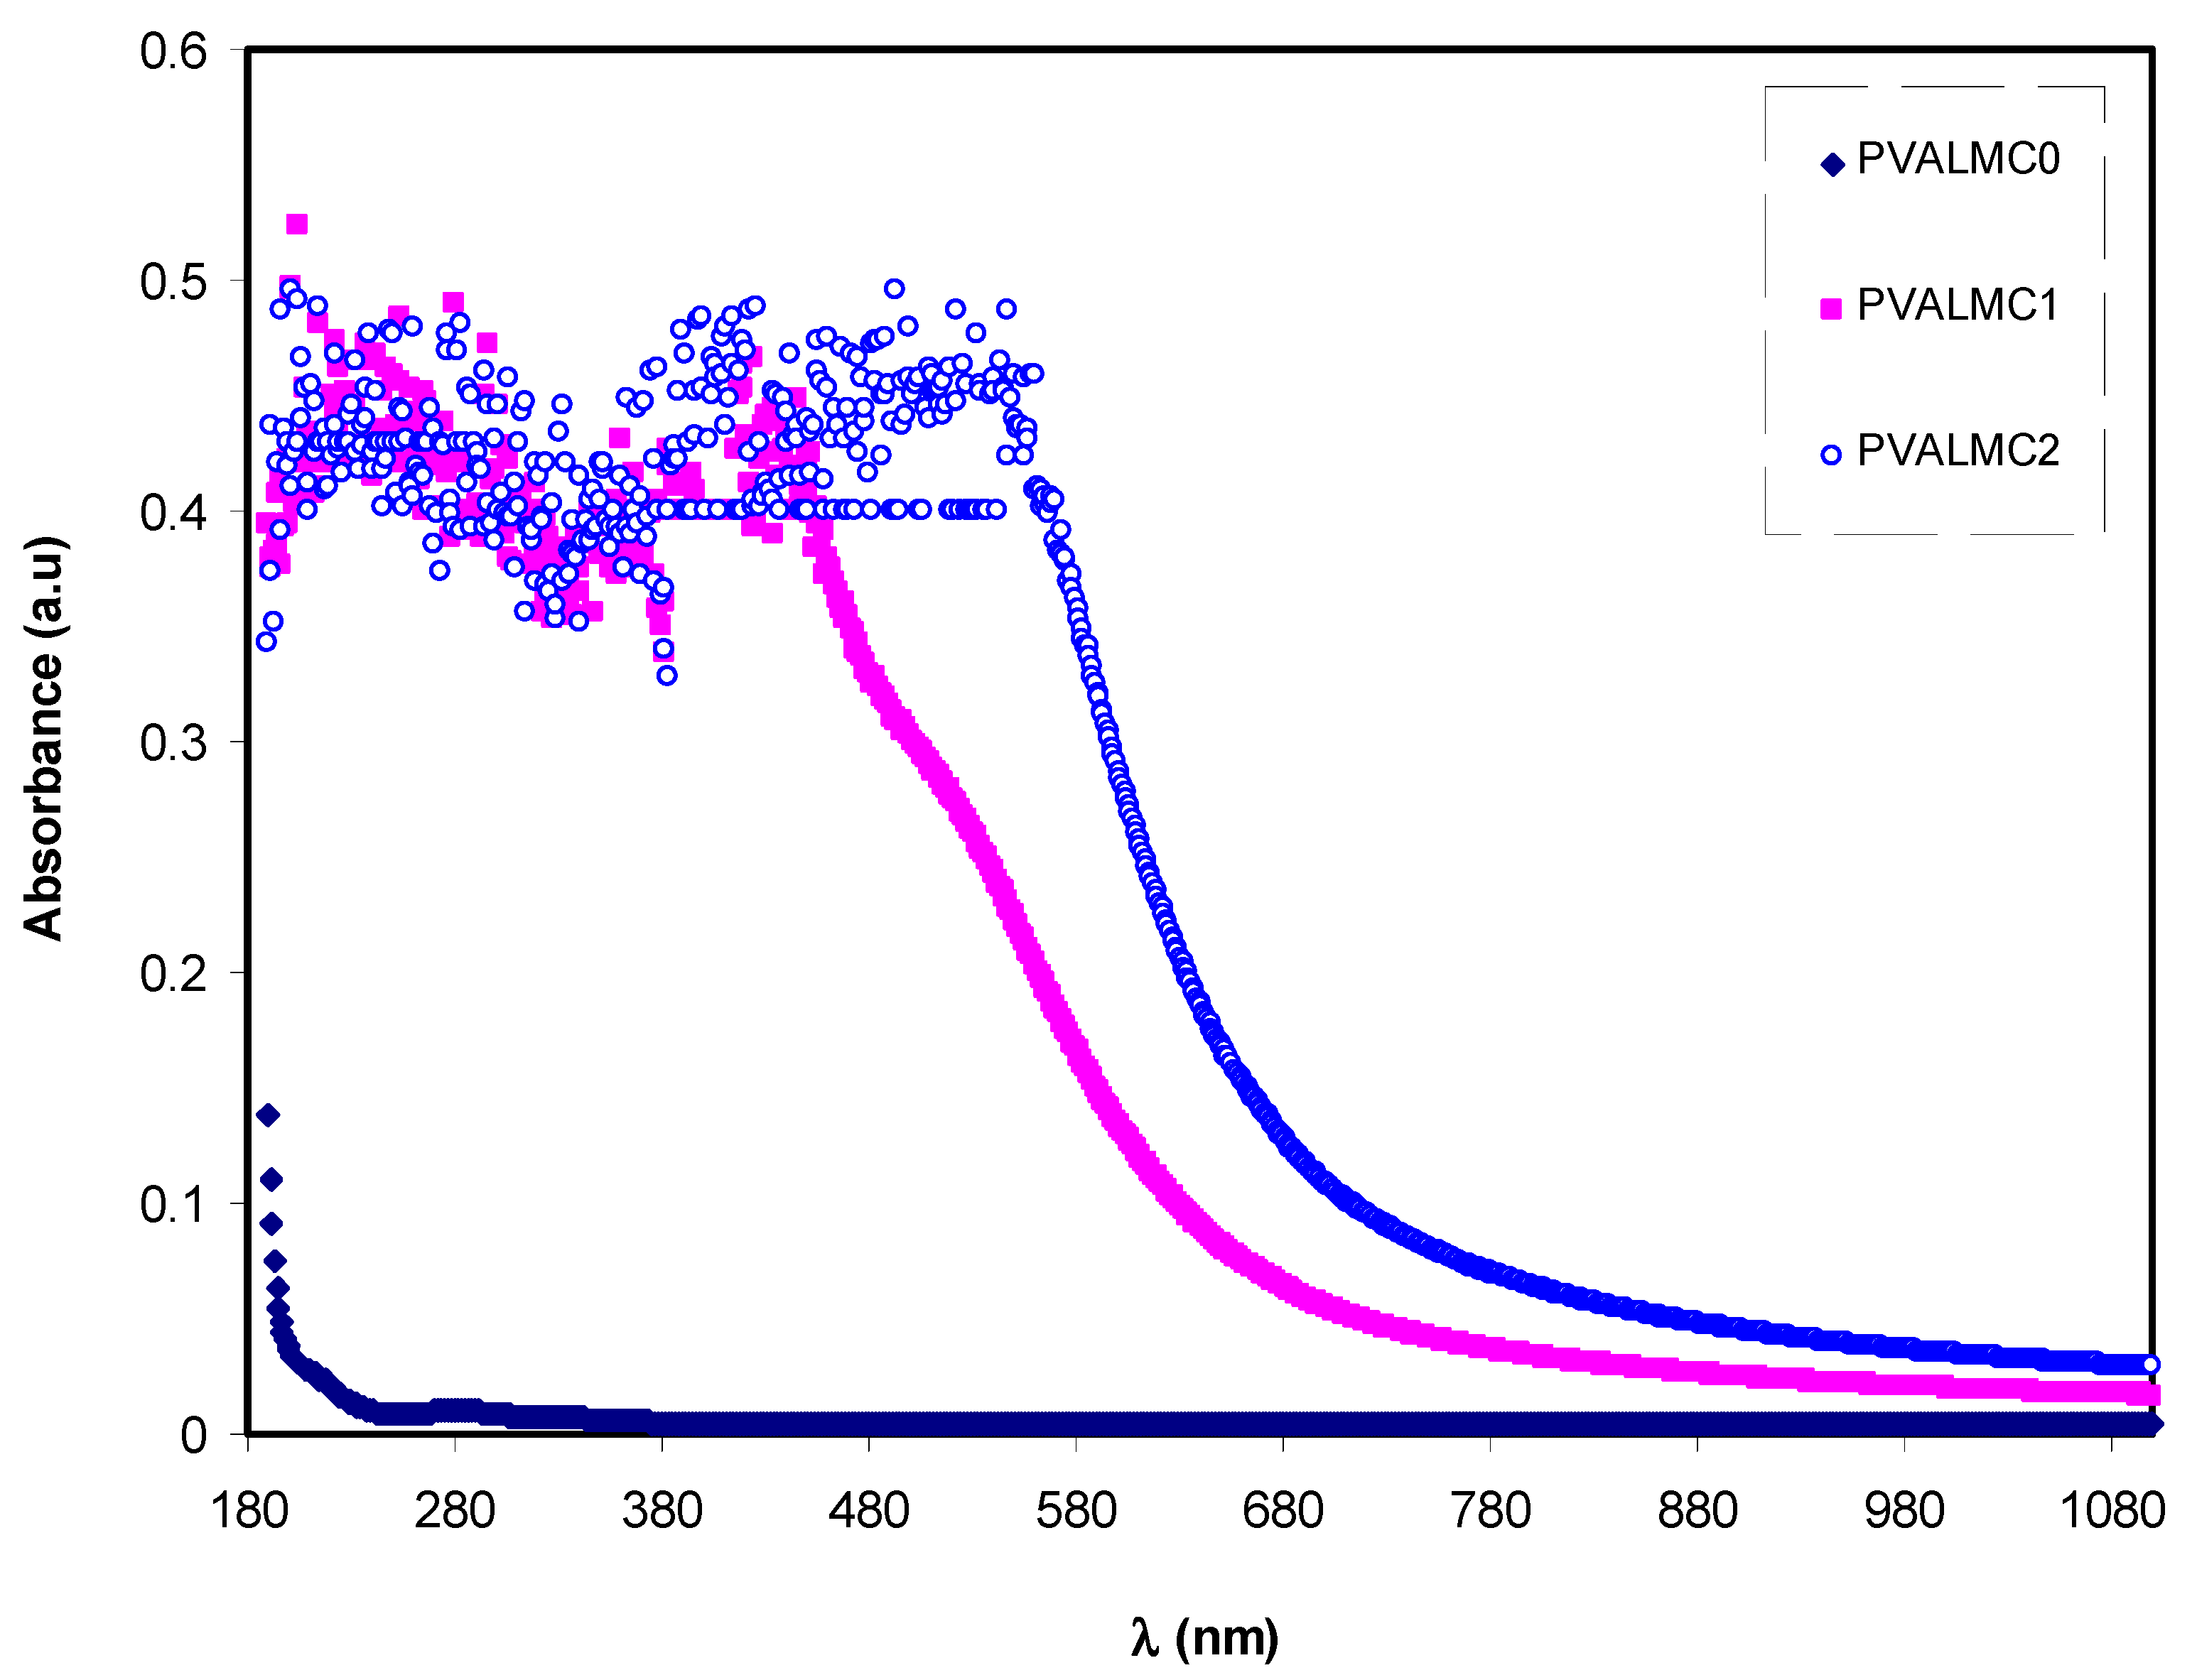
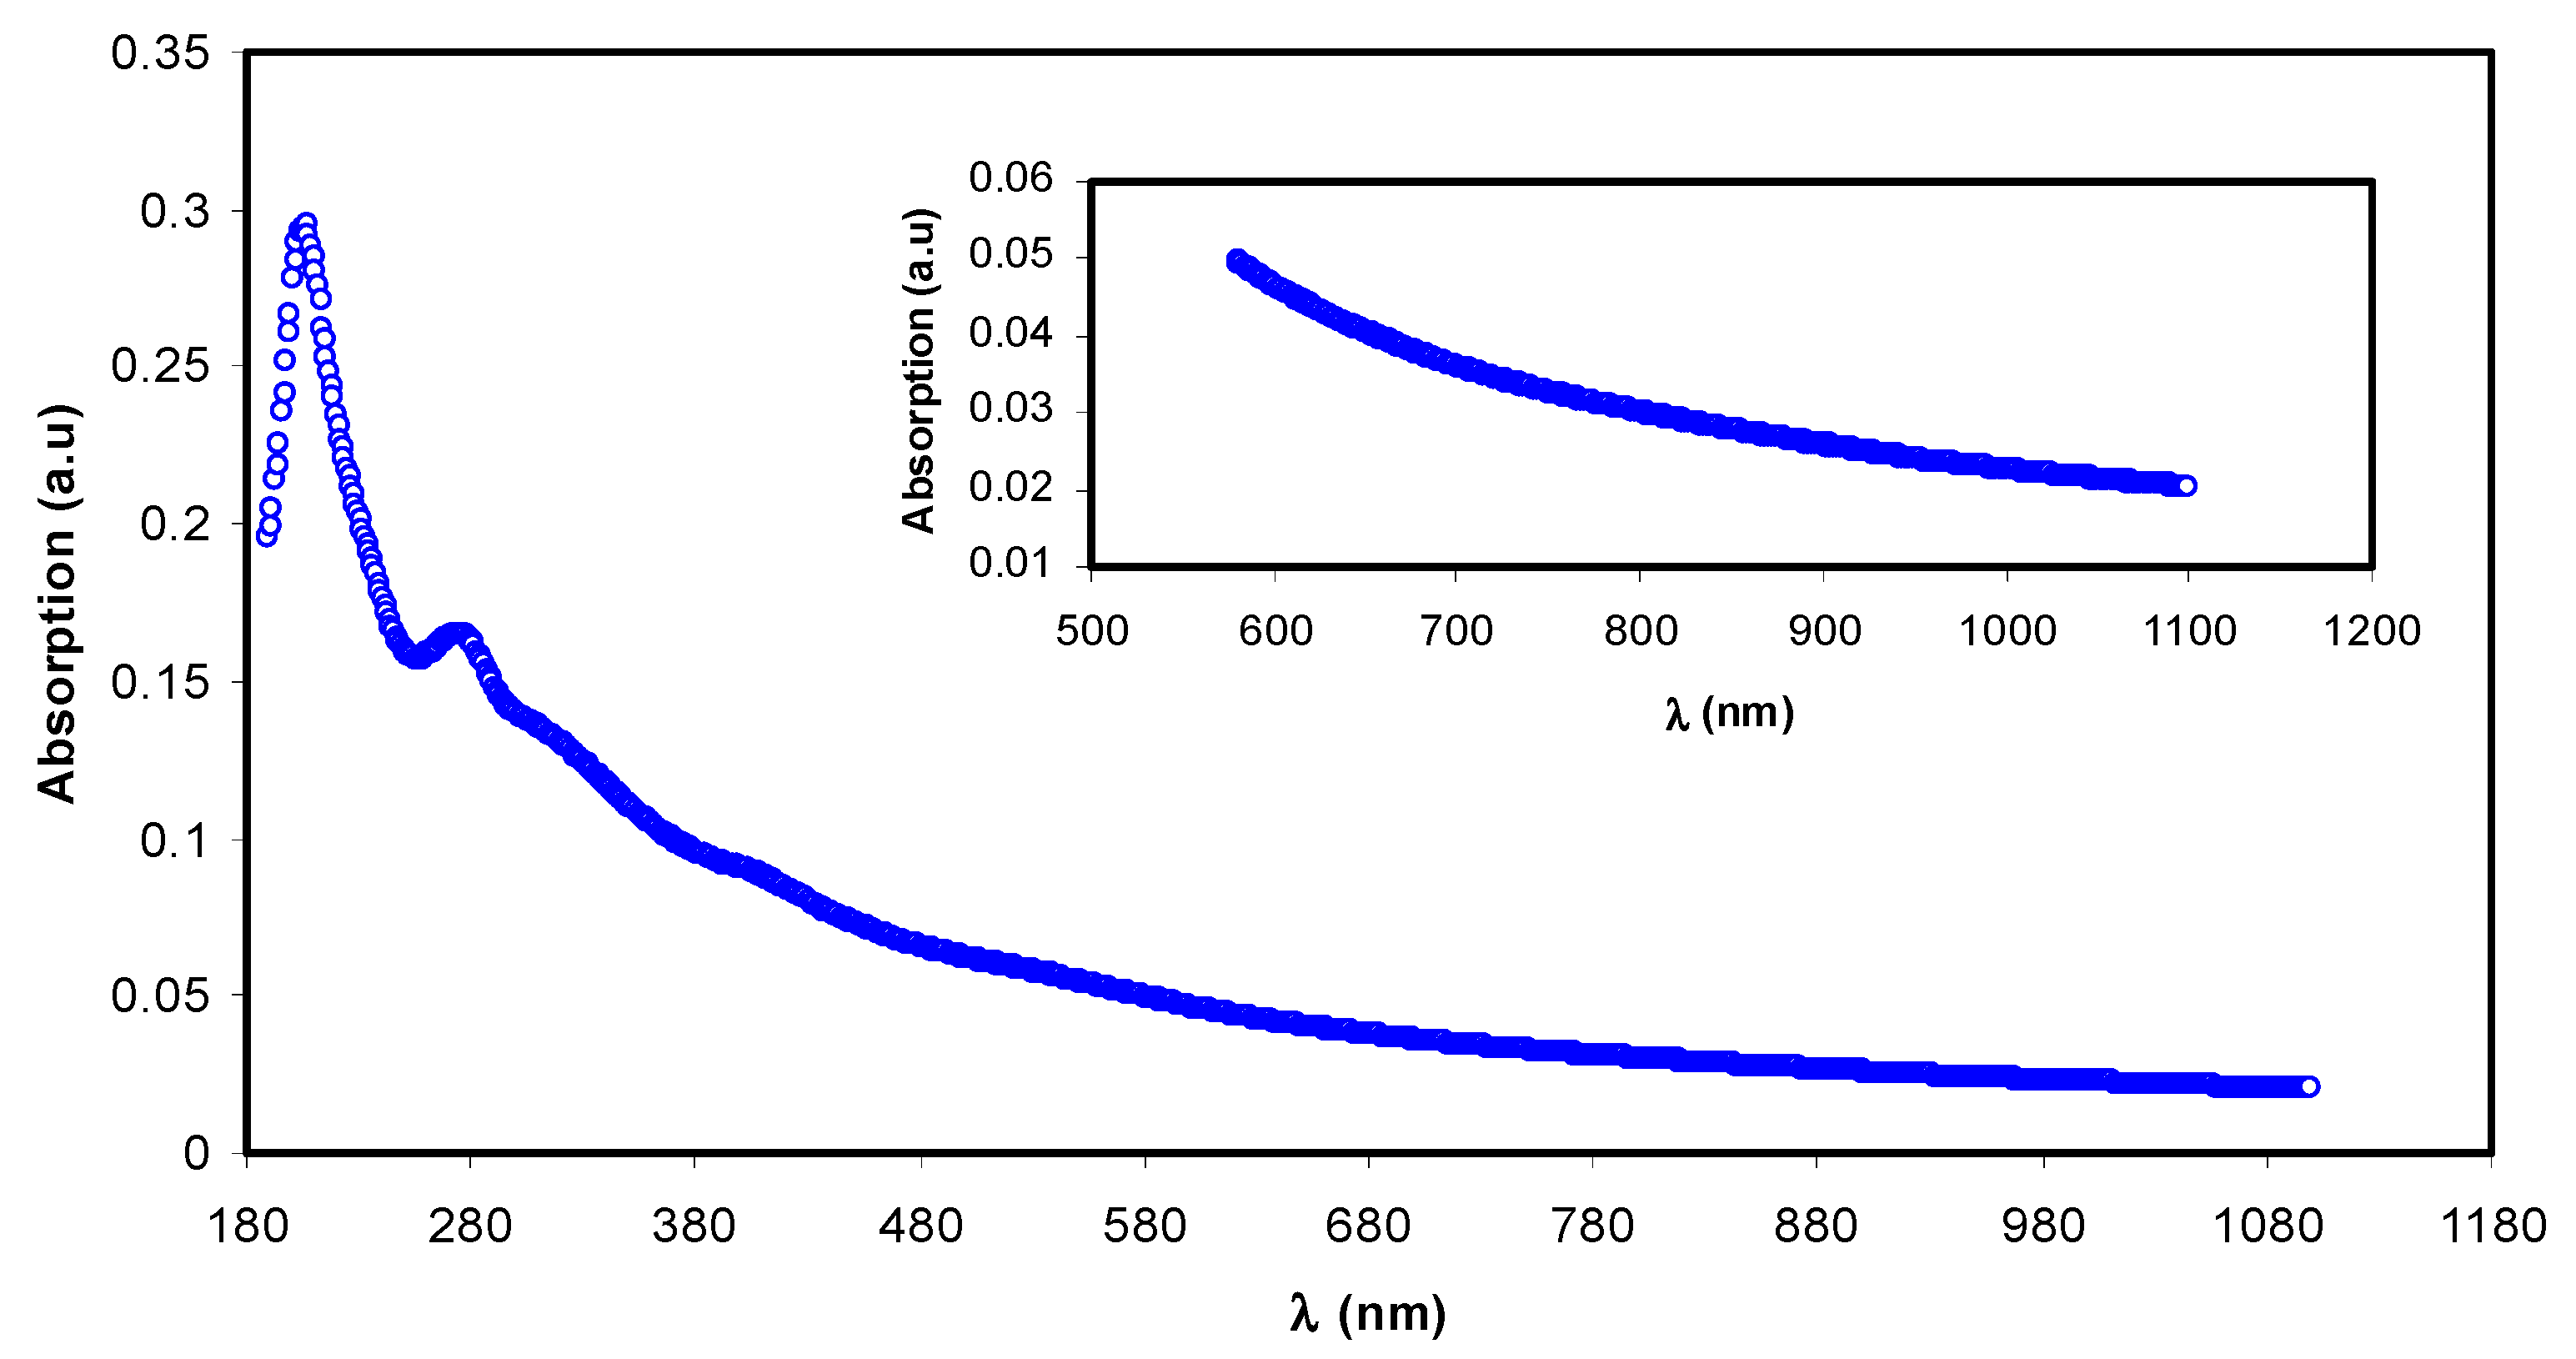
Figure 7 illustrates the absorption spectra of pure PVA polymer and their composites. The absorption spectrum of composite alloys covers almost all the significant parts of solar radiation. Most organometallics commonly display prominent optical absorption and emission in the 600–700 nm regions [
46]. This may be interpreted based on overlap formation between the orbitals with the assistance of ligands. Thus, electrons can carry energy all over the structure and provide the absorption spectra [
47]. Thus, it is implicit that it is possible to expect some phenomena from the optical absorption spectra, including reducing the optical bandgap. This is related to the fact that optical constants include valuable information for technological applications. The optical properties of polymers are essential for optical applications because optical properties are directly related to their structural and electronic properties [
46]. It is observed that the optical absorption edge is not sharply apparent, which indicates the amorphous nature of the samples [
48].
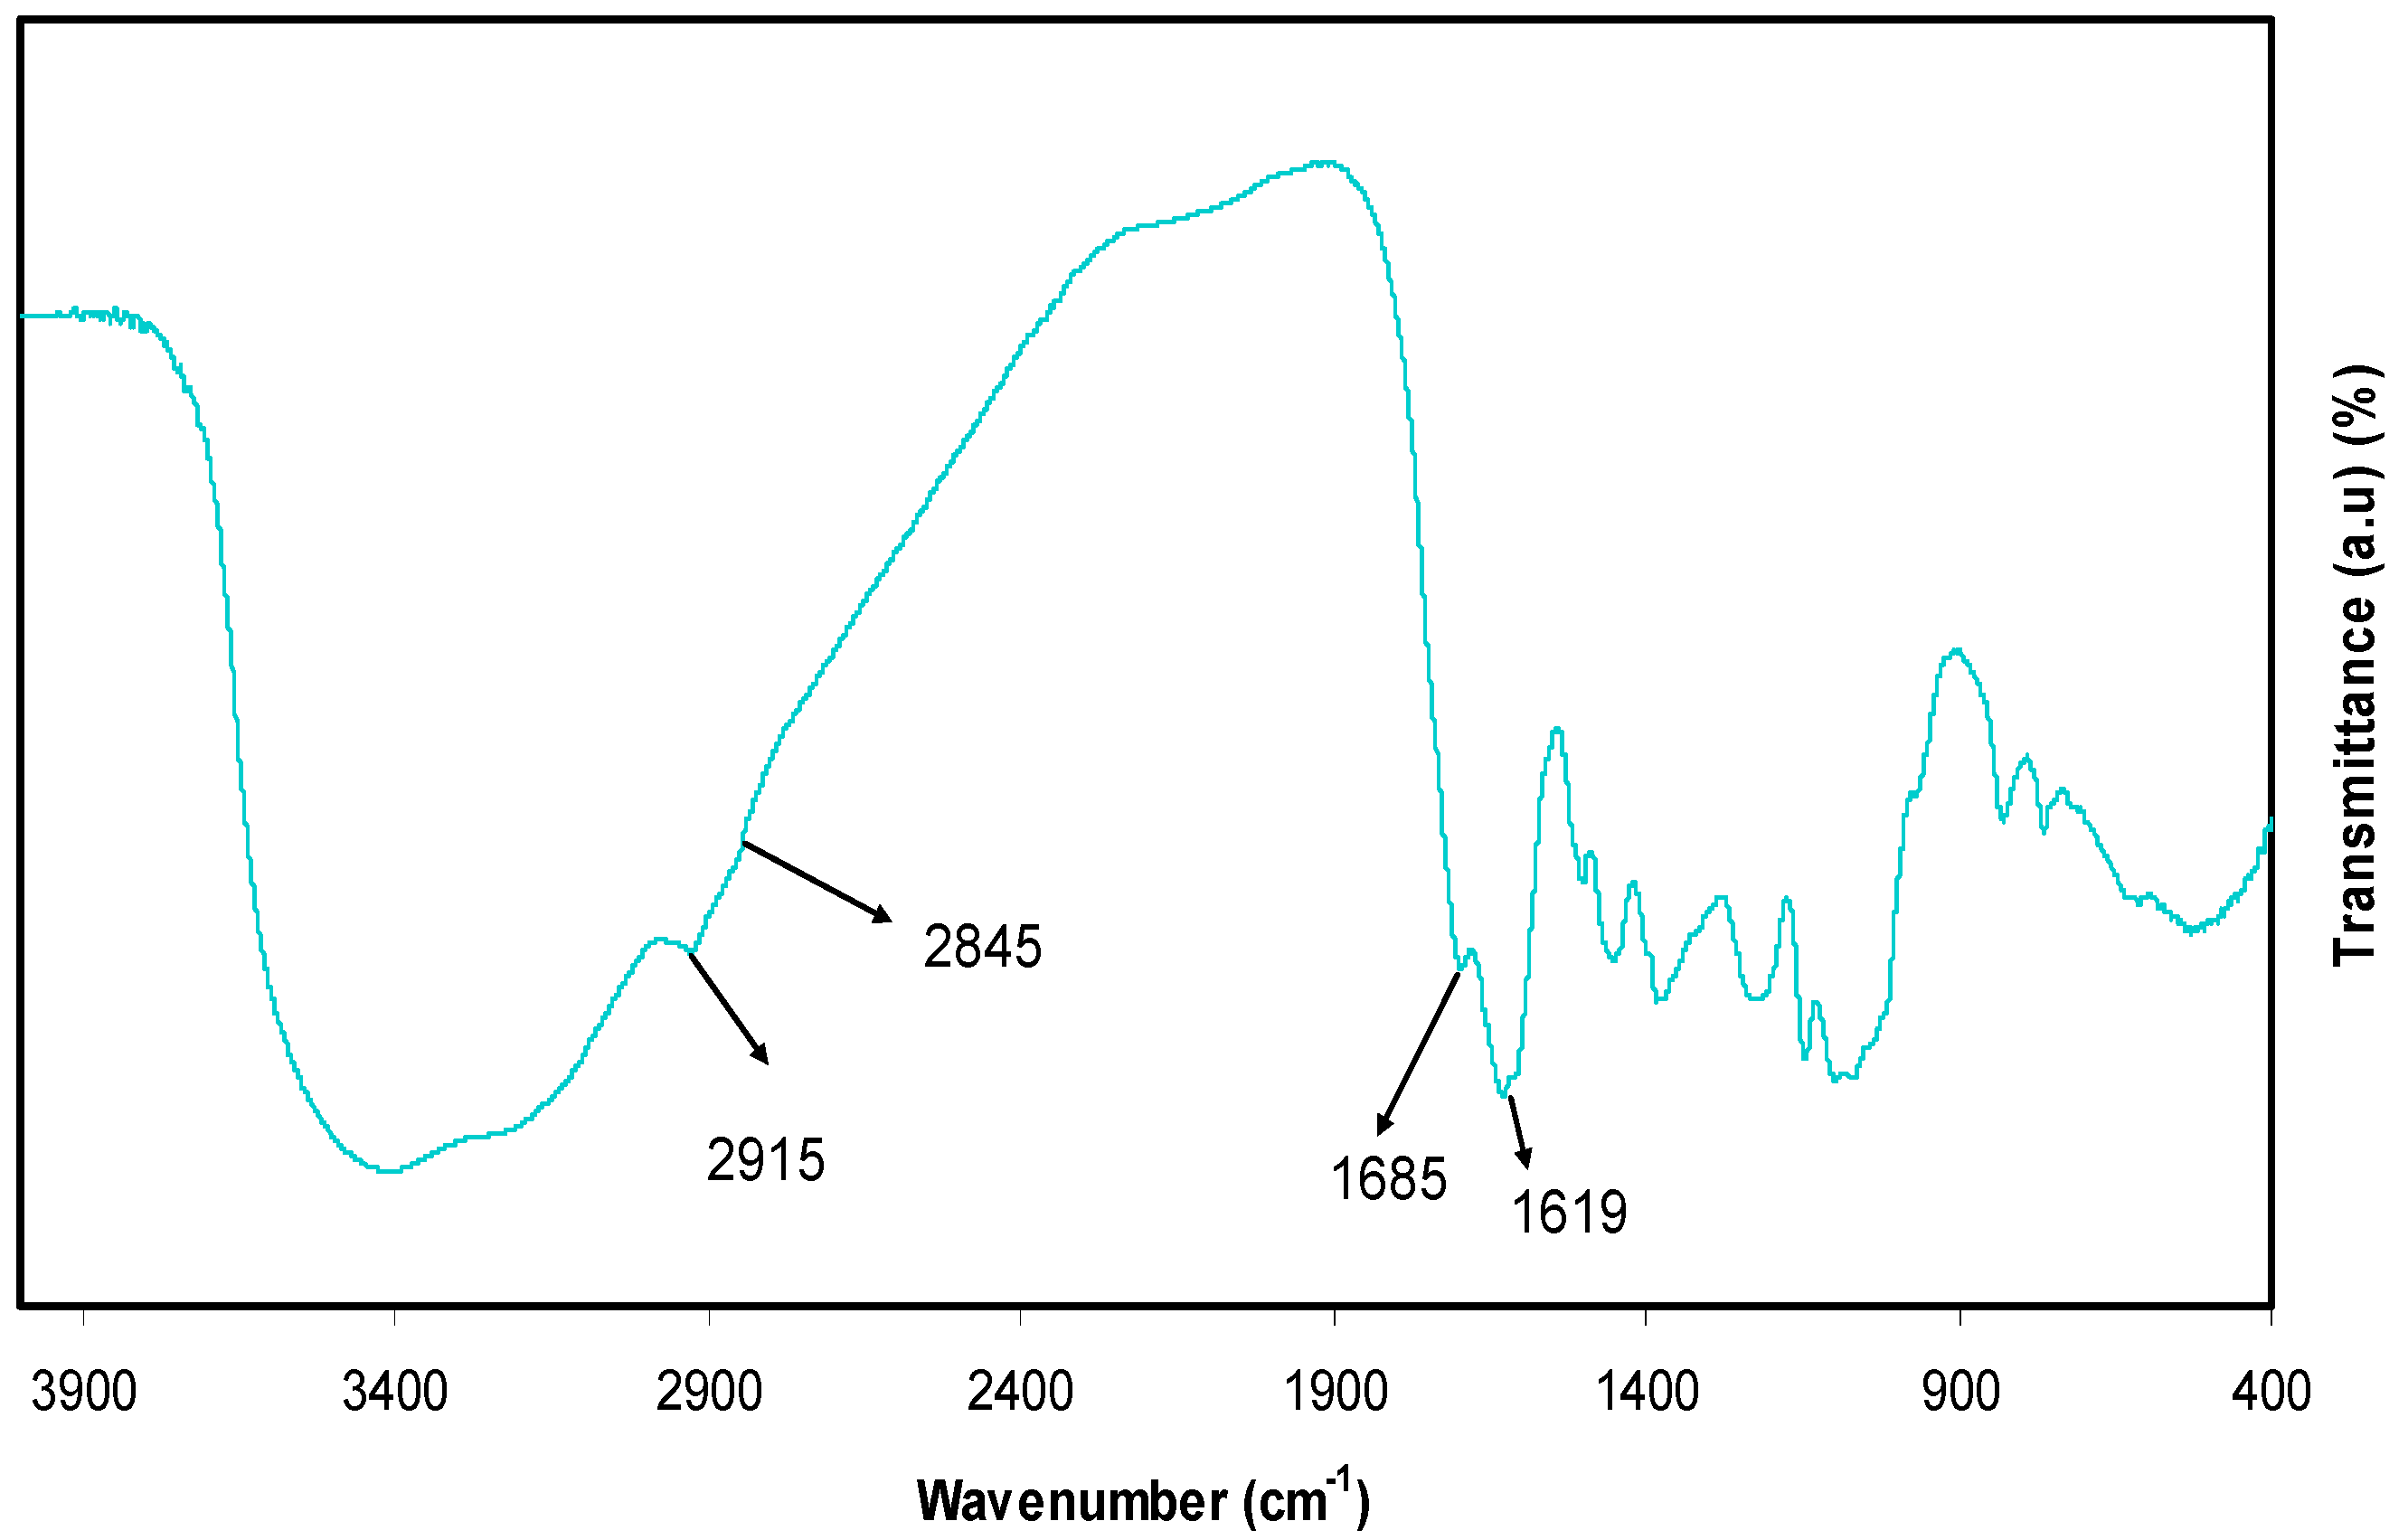
The absorbance of pure PVA in the (240–270 nm) region is in agreement with previous studies and is ascribed to the π–π* electronic transition in the aromatic ring group, which has mainly occurred due to forbidden transitions in the excited states of the polymer. The absorption between 270 nm and 375 nm was associated with the
p–
p* electronic transition in –C=C– bonds [
49].
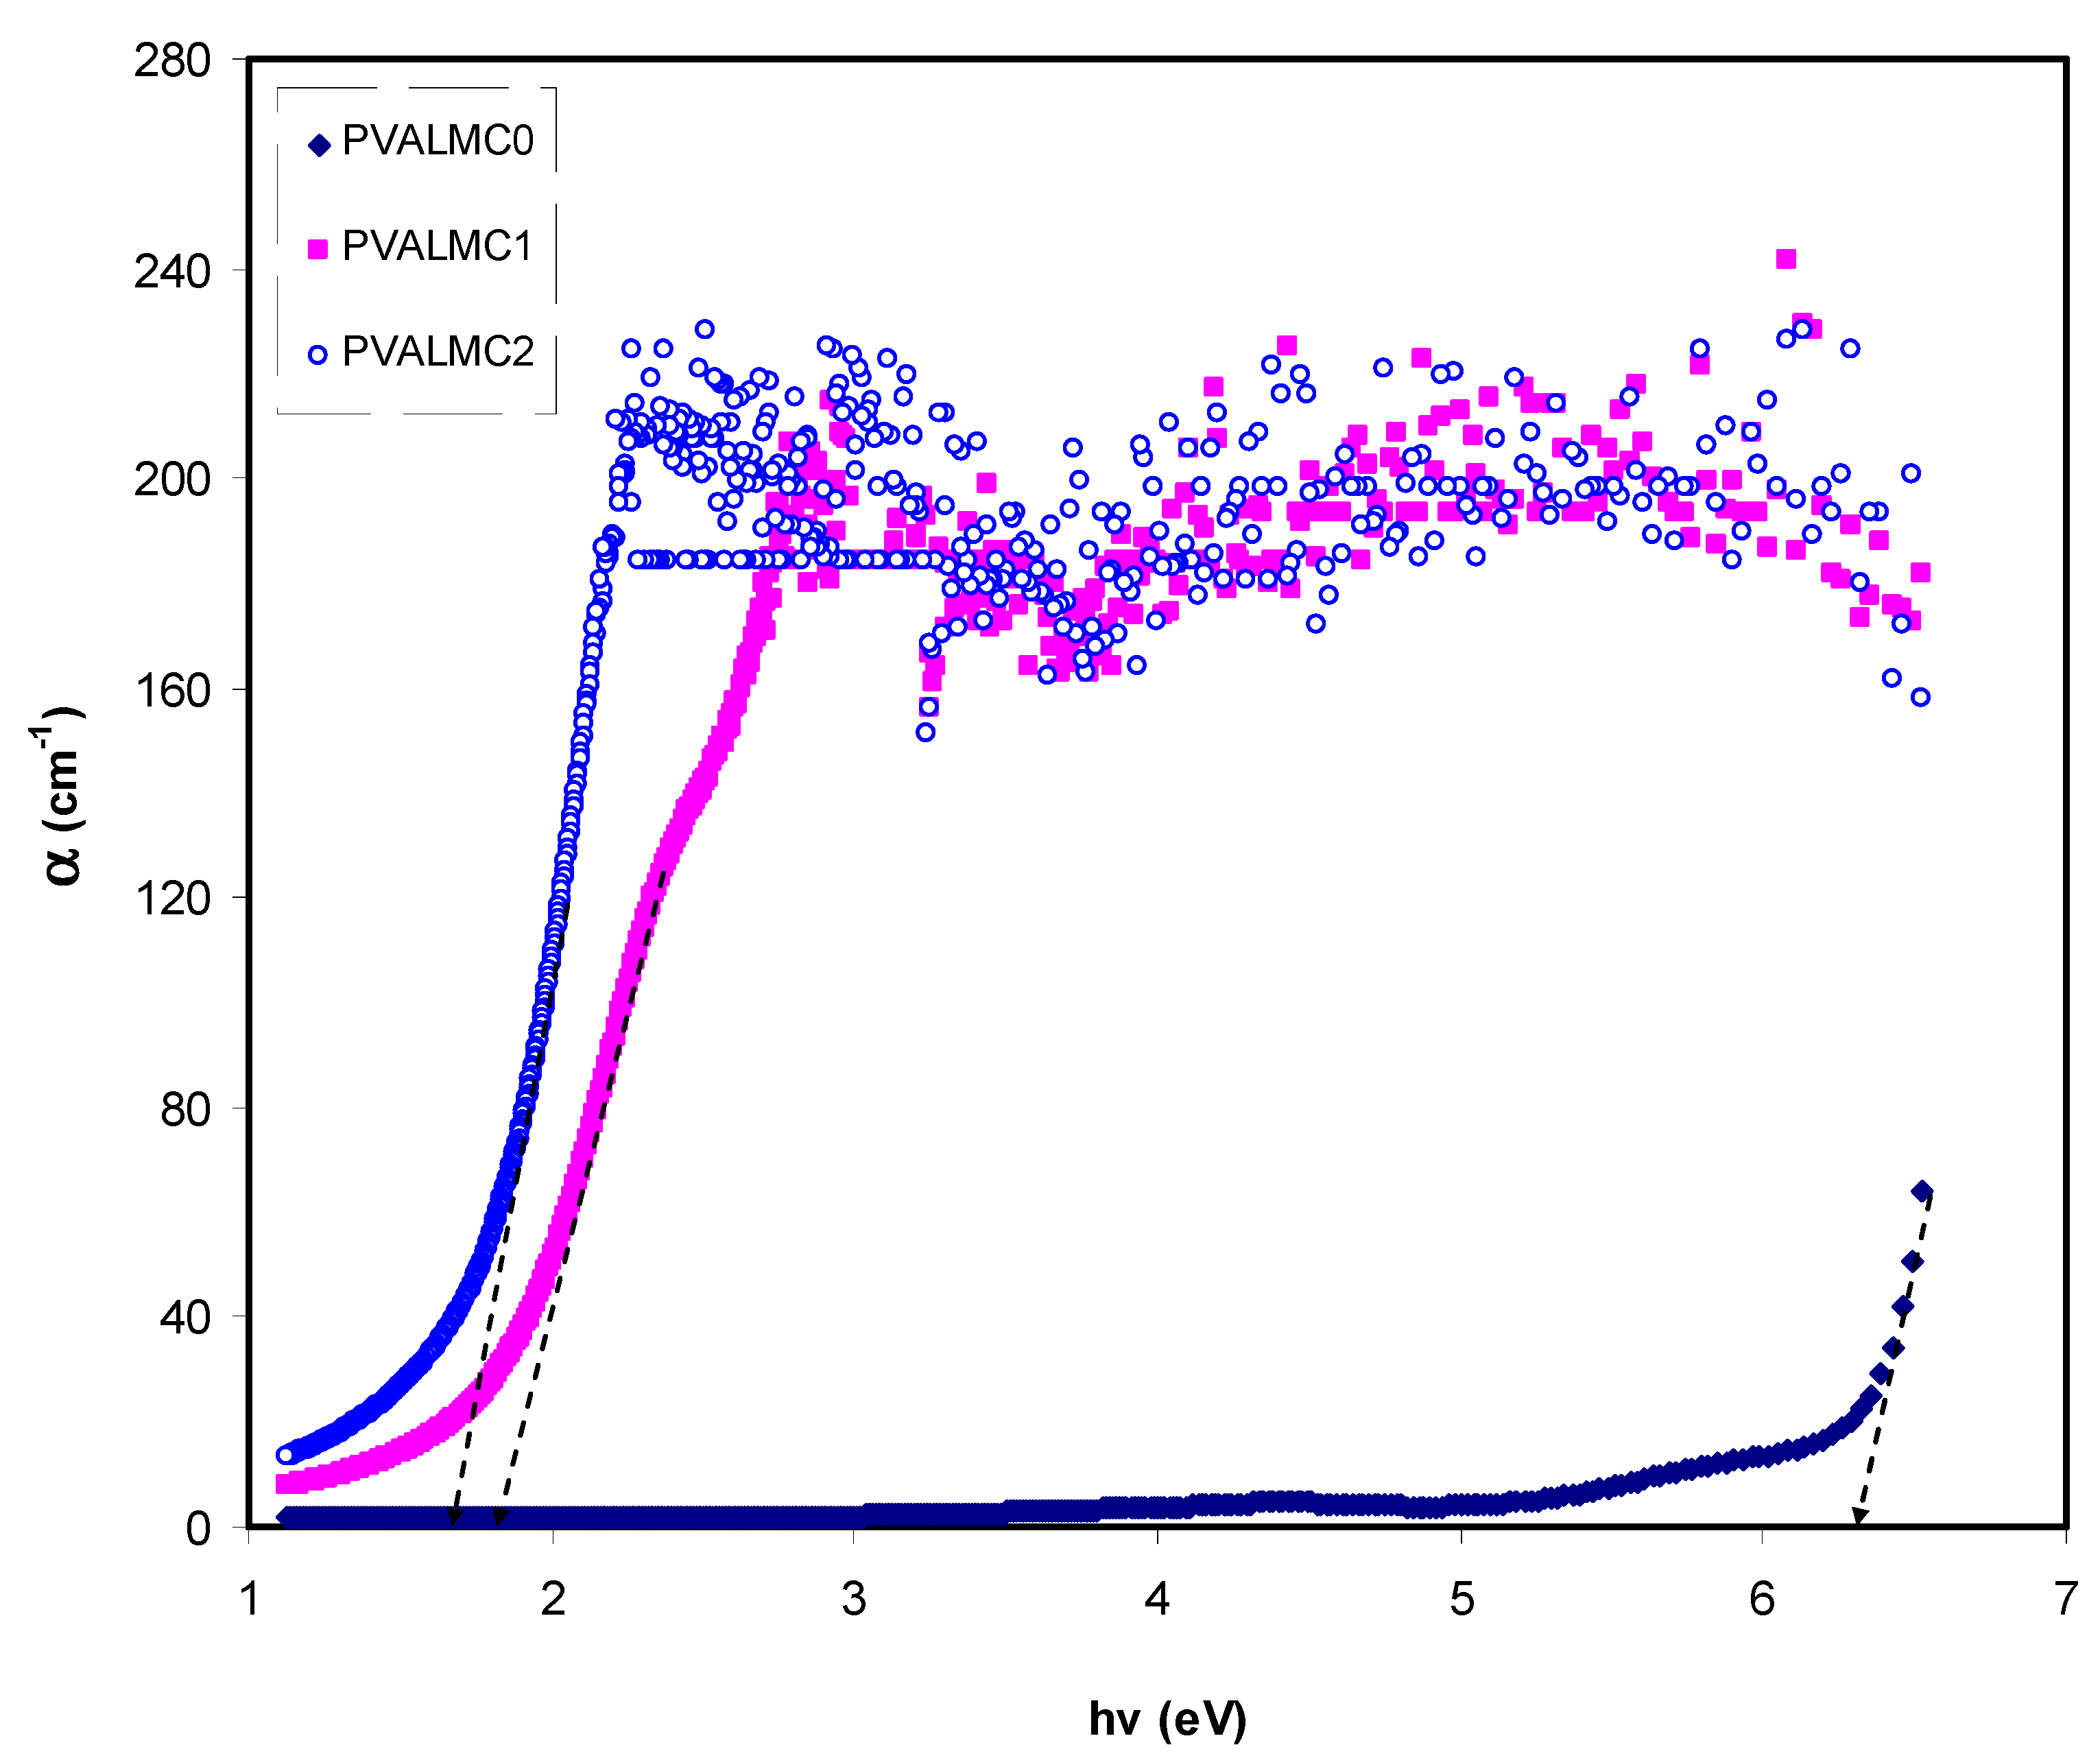
Figure 8 demonstrates the absorption coefficient (α) of clean PVA polymer and their hybrids. The following equation can be employed to calculate the α of the prepared films at various
λ from the absorption patterns [
39]:
Here
t is the thickness of the films. Investigations of optical absorption of polymer/metal complex hybrids, particularly the absorption edge, have been shown to be a valuable tool to elucidate these materials’ electronic structures. Characterization of indirect and direct transition happening in the bandgap of polymer/metal complex hybrids is feasible through optical absorption spectra [
50]. Meaningful information on the optical band gap is achieved when the fundamental absorption edge (FAE) is well studied. In the absorption process, an absorption edge represents the action of exciting an electron by a photon from a lower to a higher energy state [
51]. The broad shift of FAE to lower photon energy for the hybrid films than pure PVA, as depicted in
Figure 8, is evidence that metal complexes are essential for doping functional polymers. The FAE values are presented in Table 2.
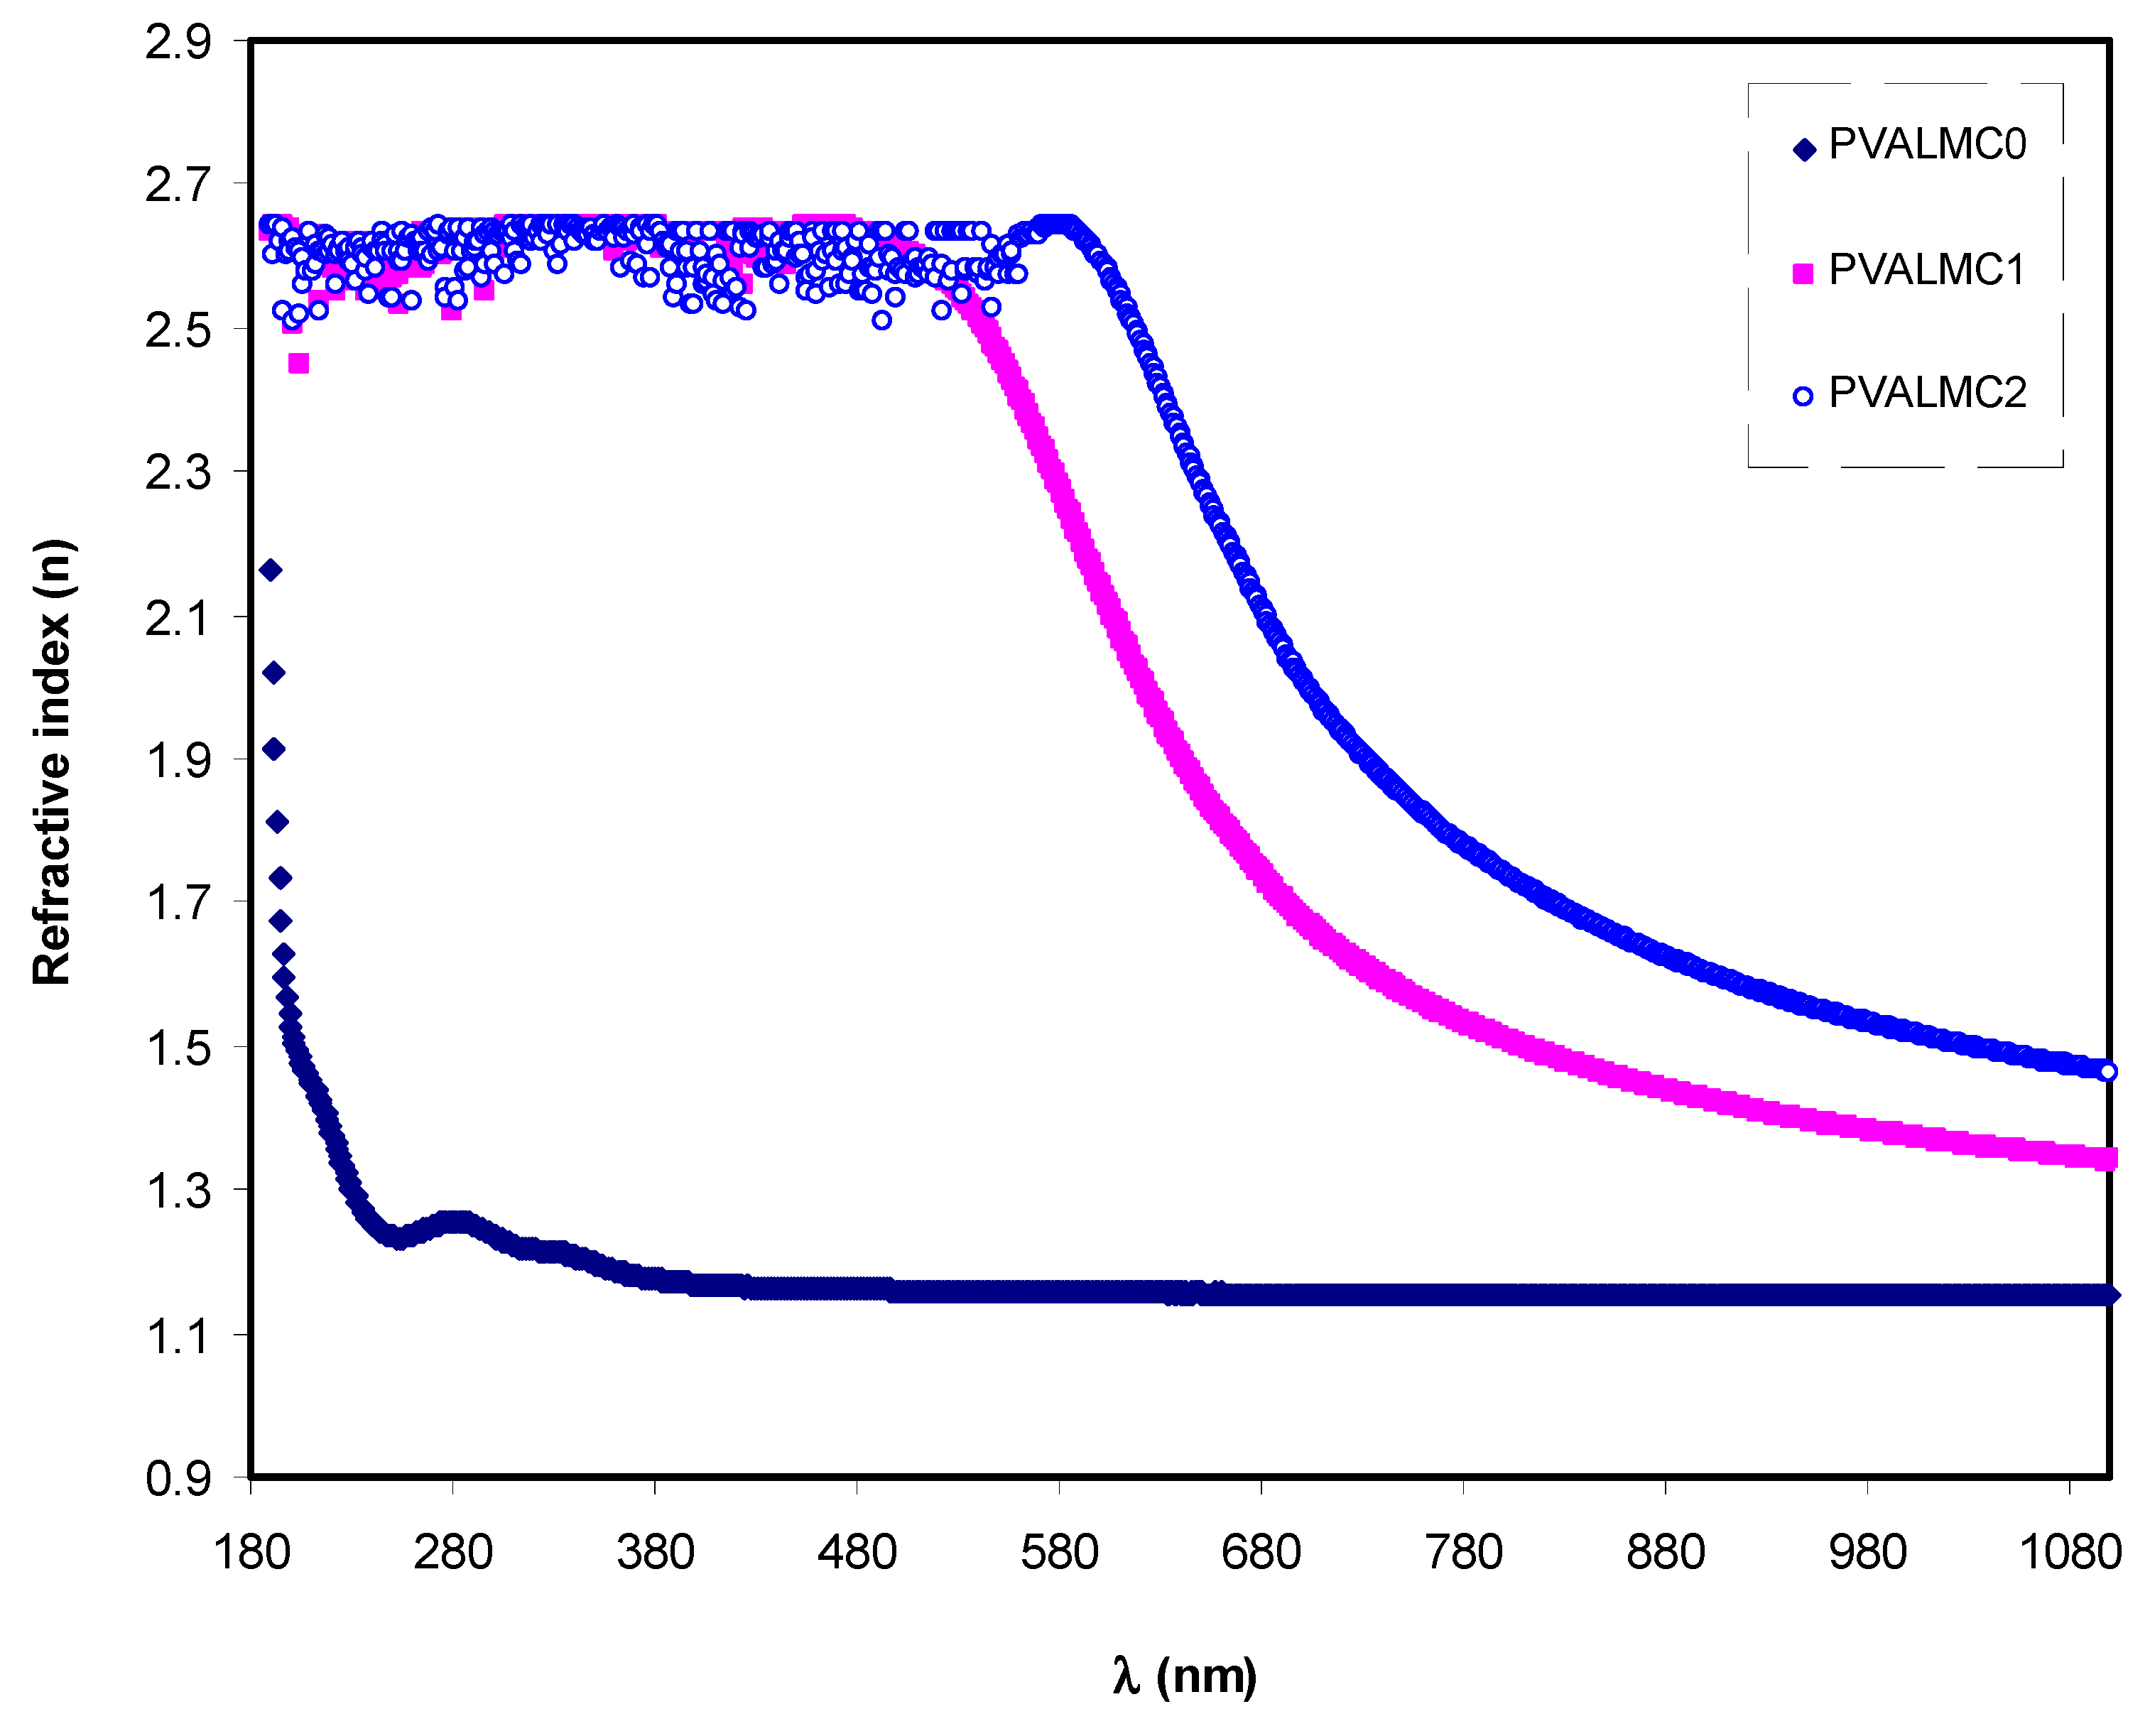
3.4.2. Refractive Index and Localized Density of State (N/m*) Study
Figure 9 illustrates the indices of refraction (
n) of neat PVA and their hybrids. Clarified dispersion in the
n pattern can be observed for the hybrid films. From the optical materials point of view, the detailed knowledge of the wavelength-dependent complex index of refraction, n, is vital for the optical system’s proposal and routine [
52]. One of the significant characteristics of material includes the refractive index since it is highly connected to both the electronic polarizability of ions and the internal field. Therefore, its assessment for optical materials is highly important for applications in integrated optic devices like switches, fififilters, and modulators. The refractive index is regarded as a critical parameter in designing those devices. [
53]. Besides its function in optical devices, the variations in
n are crucial for scheming the optical characteristics of polymers [
54]. The values of refractive indices were calculated from reflectance (
R) and extinction coefficient (
K) by using Kramer’s–Kronig relations:
where
K =
λα/4π
t,
λ is the wavelength of incident light and
t is the thickness of the prepared films. The results shown in
Figure 9 suggest that the films’ refractive index could be increased by incorporating Al-complex. It also demonstrates that all the tested specimens’ refractive indices were maximum in the UV region below 300 nm. After that, they started to decrease with the increase of wavelength. At long-wavelength (
λ→∞), the value of
n became constant. This is because of the resonance effect due to the specimens’ polarization by the incident light’s photons. The refraction index for pure PVA exhibited a sharp decline in the wavelength range of 300 nm then remained steady.
On the other hand, the index of refraction of PVA composites increased as Al complex concentration increased, and it demonstrated a gradual decline with the increase of wavelength. This is possibly due to the enhancement of packing density and PVA polarization by adding the Al
3+-complex [
55].
Figure 9 indicates that the Al complex filler’s insertion into the PVA polymer matrix altered the
n of the composite films and increased the value from 2.2 to about 2.7. This boost in the value of the static refractive index by nanofiller addition is consistent with the previous studies. It is likely ascribed to the enhancement of bond strength and dipole strength due to the creation of space charges in the presence of the Al complex [
56].
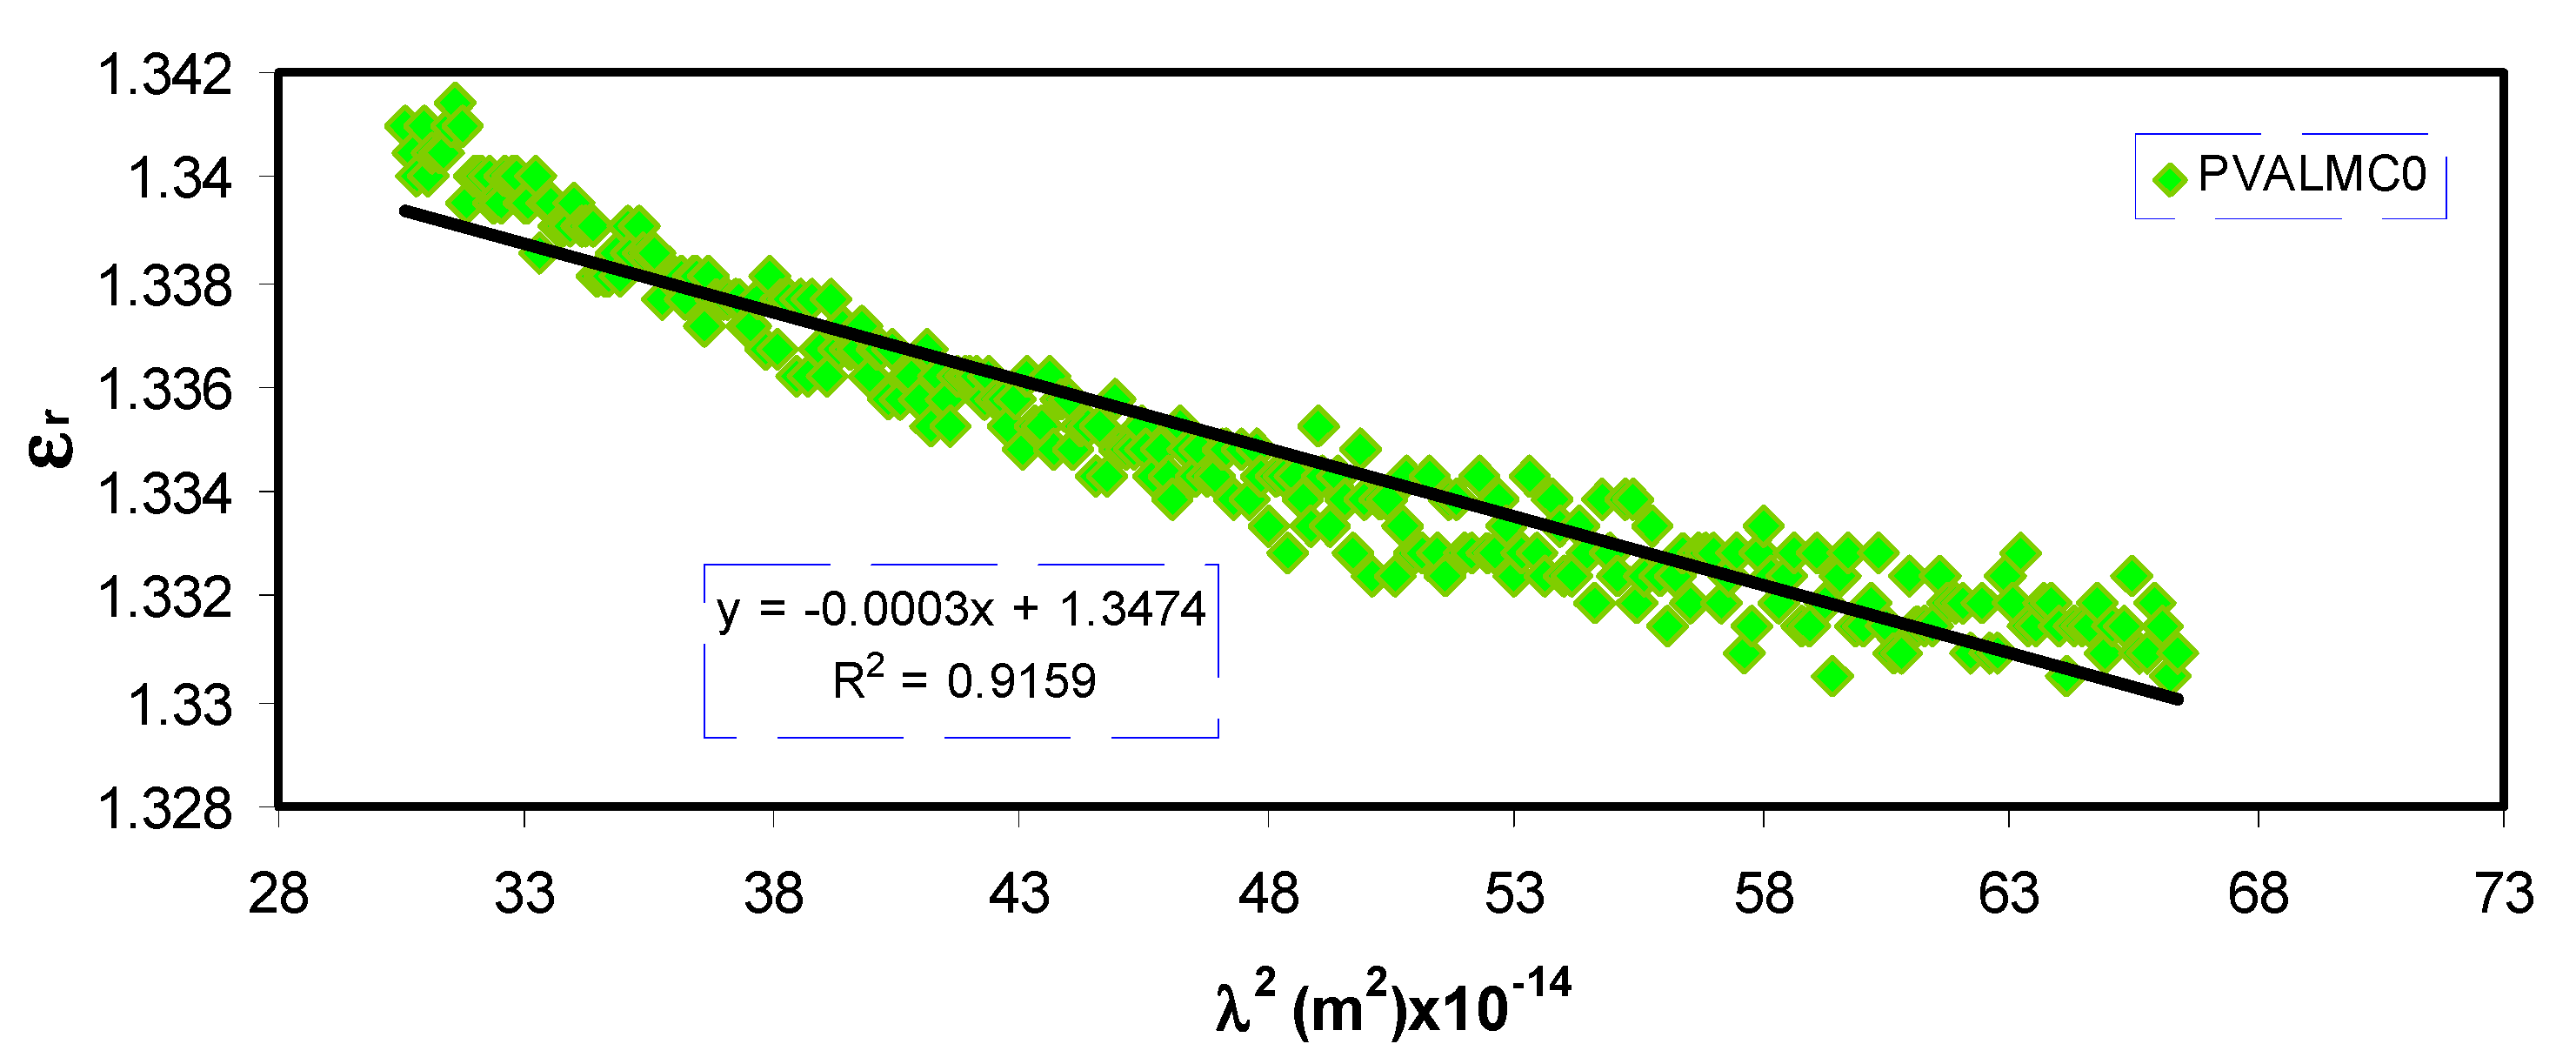
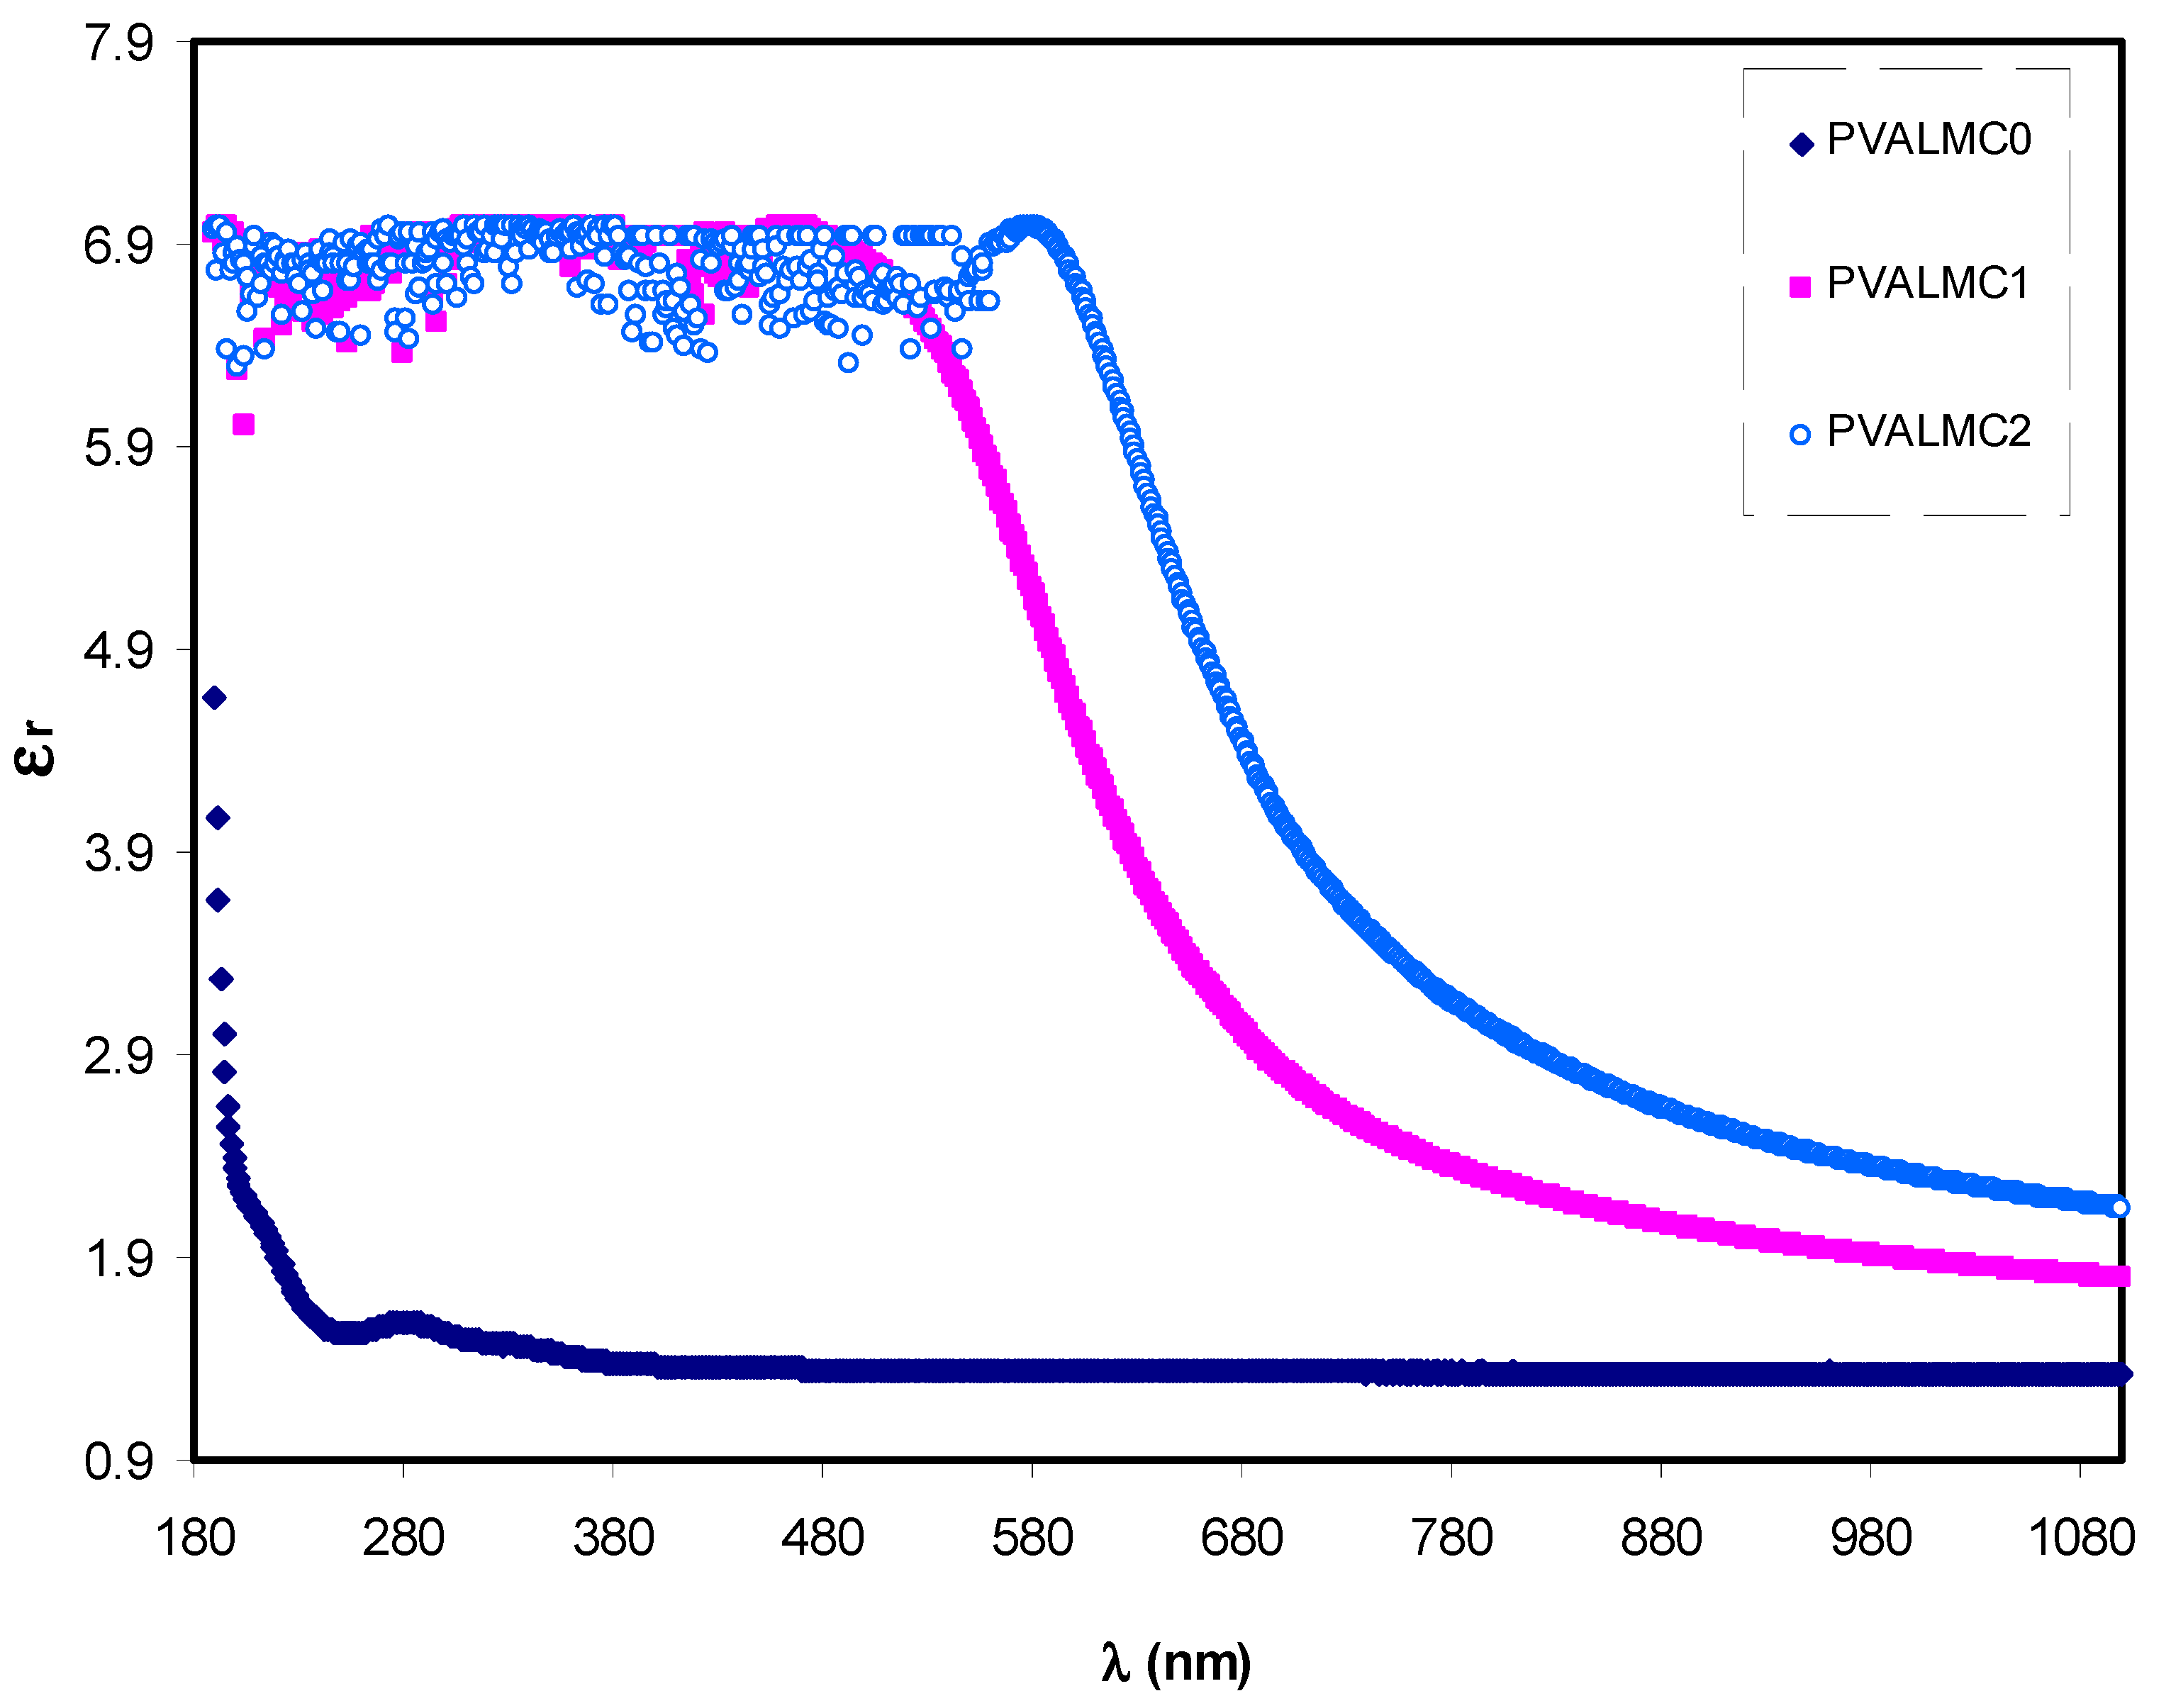
The basic optical transition in polymer composites is mainly attributed to the variation of optical dielectric constant, which describes the feasibility of losing energy by an electron as it travels through a surface of the bulk material. It is expressed in terms of real (ԑr) and imaginary (ԑi) parts. The real part measures the ability of the material to slow down the speed of the electromagnetic wave. The imaginary part accounts for the efficiency of absorbing energy due to polarization. The value of ԑr is calculated from the refractive index (n) of the medium (ԑr = n2 − k2), while the value of ԑi is derived from extinction coefficient (k) (ԑi = 2nk).
Optical dielectric constant (
ԑr) against wavelength (
λ) for the PVALMC0, PVALMC1, and PVALMC2 samples is shown in
Figure 10. Dielectric response of the material at high frequency (short wavelengths)
ԑ∞ was determined from the correlations between wavelength and refractive index according to Spitzer–Fan model [
57]:
where
e is the charge of an electron,
c is the speed of light,
ԑo is the dielectric constant of free space,
N is the concentration of charge carrier, and
m* is the effective mass it is assumed to be 1.16
me [
58,
59].
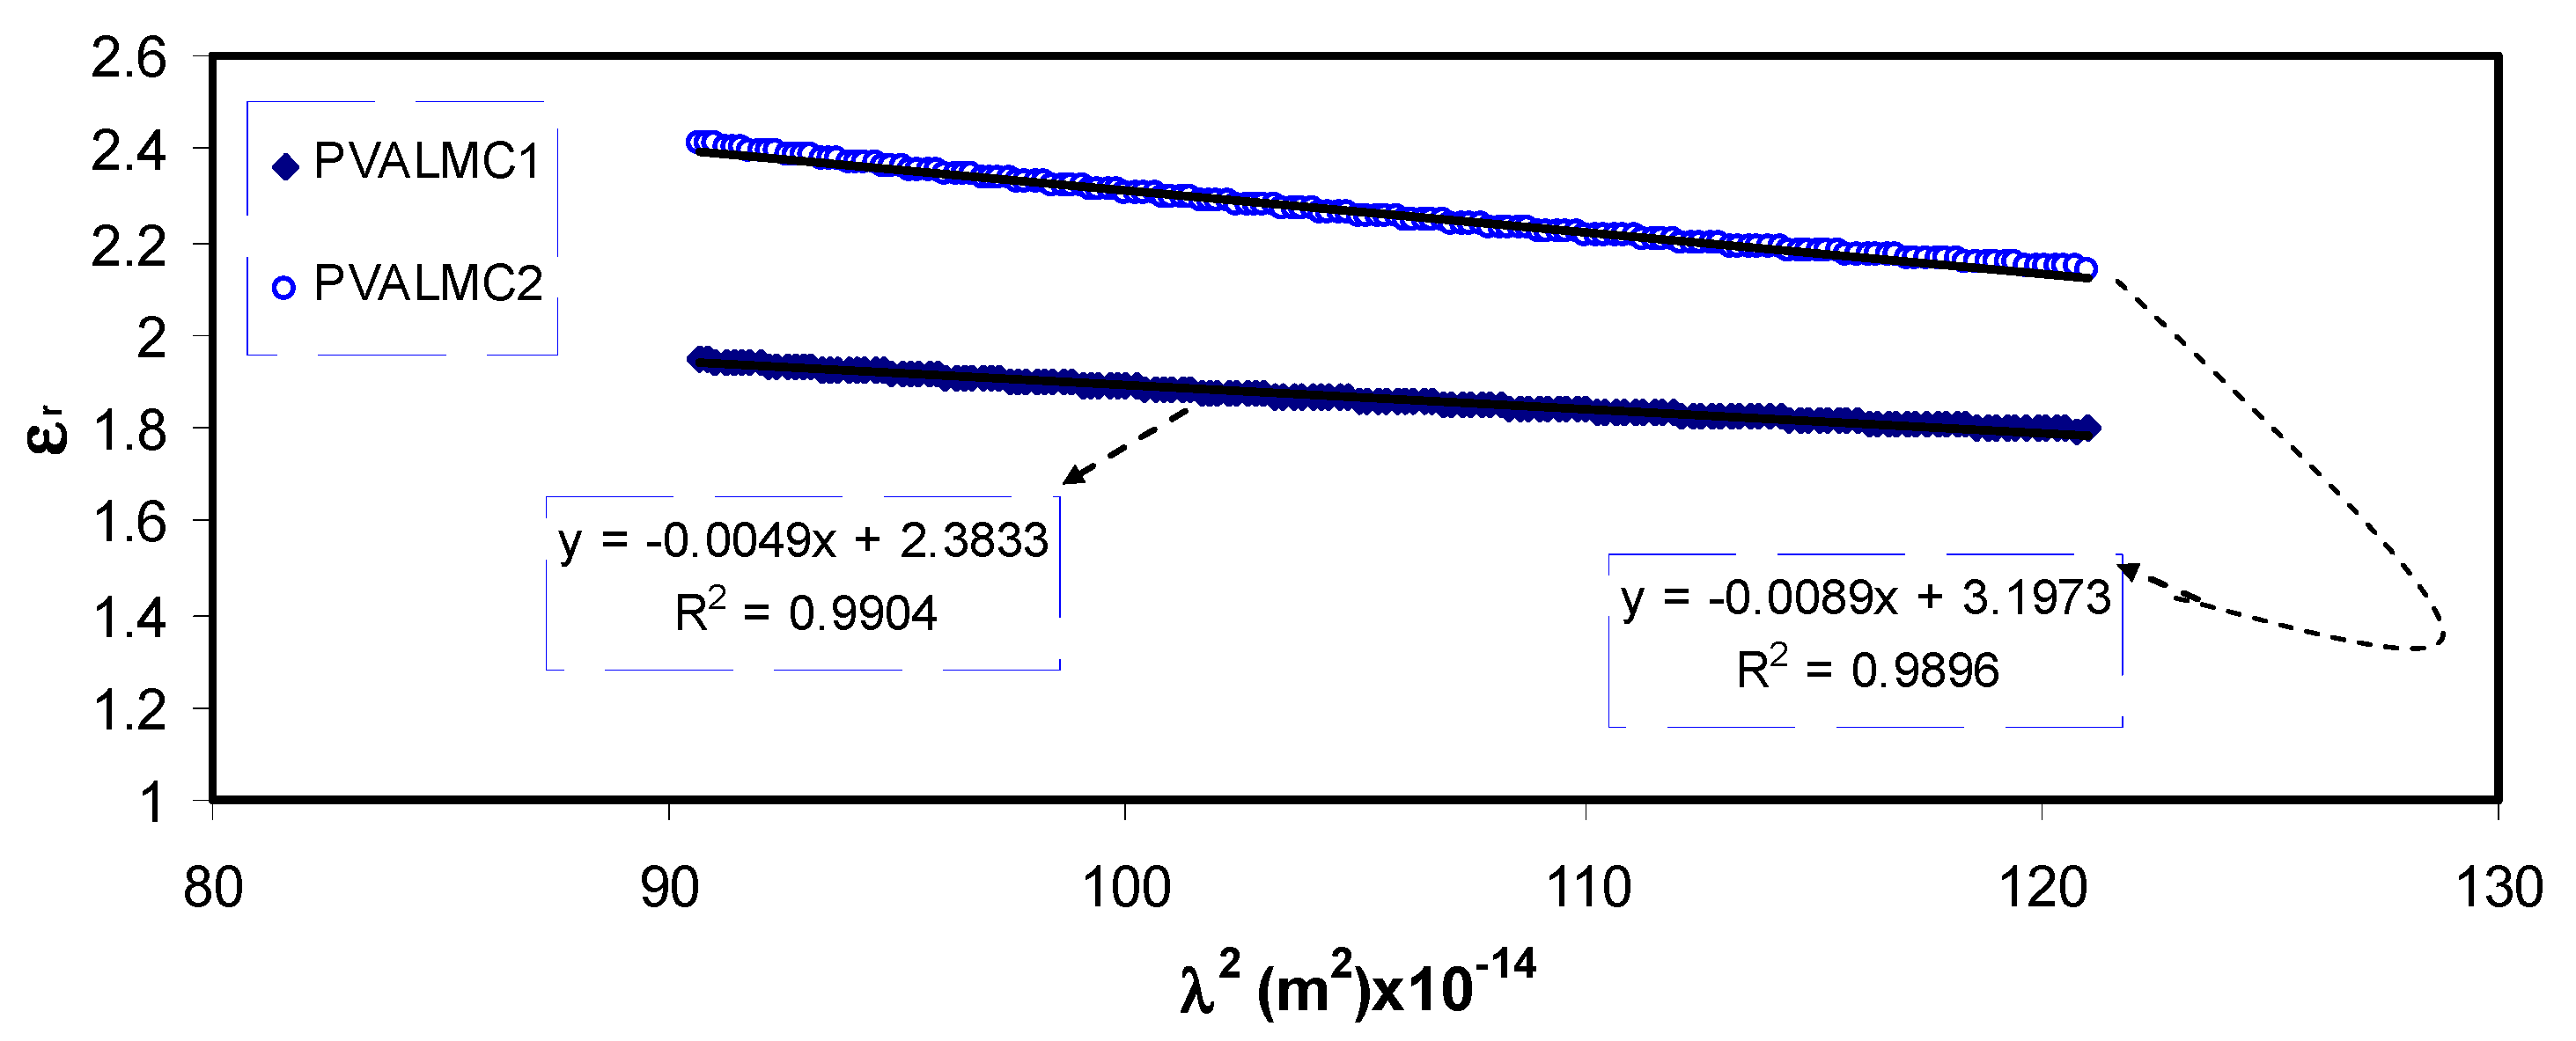
Plotting the values of
ԑr versus
λ2 in the visible wavelength region yields a straight line, as shown in
Figure 11. The
ԑ∞ and
N/m* values were determined from the slope and intercept of the line with the y-axis, respectively, using the parameters shown in
Table 1. The values of
ԑ∞,
N/m*, and N estimated from Equation (3) are summarized in
Table 2.
From
Table 2, it can be noticed that as filler concentration increased, the values of charge carriers/
m* for pure PVA film raised by up to 20 times from 3.68 * 10
55 to 109 * 10
55 atoms/m
3, and the value of
ԑ∞ increased from 1.4 to 3.6, indicating that the increase of free charge carriers had vigorously participated in the polarization process. The values estimated for localized density of states (
N/m*) in the present work are comparable with those reported in the literature by other researchers using Equation (3) [
60,
61].
3.4.3. Optical Dielectric Losses and Tauc’s Model
The quantum mechanics (QM), especially the complex dielectric function (CDF) assessment, need to be considered to describe this structure-property relationship accurately. This is because the CDF expresses the electron density of a material to an external electromagnetic fififield [
62]. It is hard to forecast the type of electron transition from the Tauc equation because exponents should be studied, as can be seen in later sections [
63]. Previous theoretical studies confirmed the existence of a considerable connection between the CDF (
ε*=
ε1 −
i ε2) and the band structure of insulating and semiconductor materials. In fact,
ε* represents the nature of the medium in response to the propagation of the electromagnetic wave through it. The imaginary part
ε2 represents the real transitions between the occupied
and unoccupied
wave functions (electronic states), and is given by [
64]:
Thus, from Equation (4), there is an apparent correlation between
ε2 or
εi and the band structure
from the QM point of view. The CDF being interconnected to other assessable optical parameters (
n and extinction coefficient) can be evaluated by simple equations.
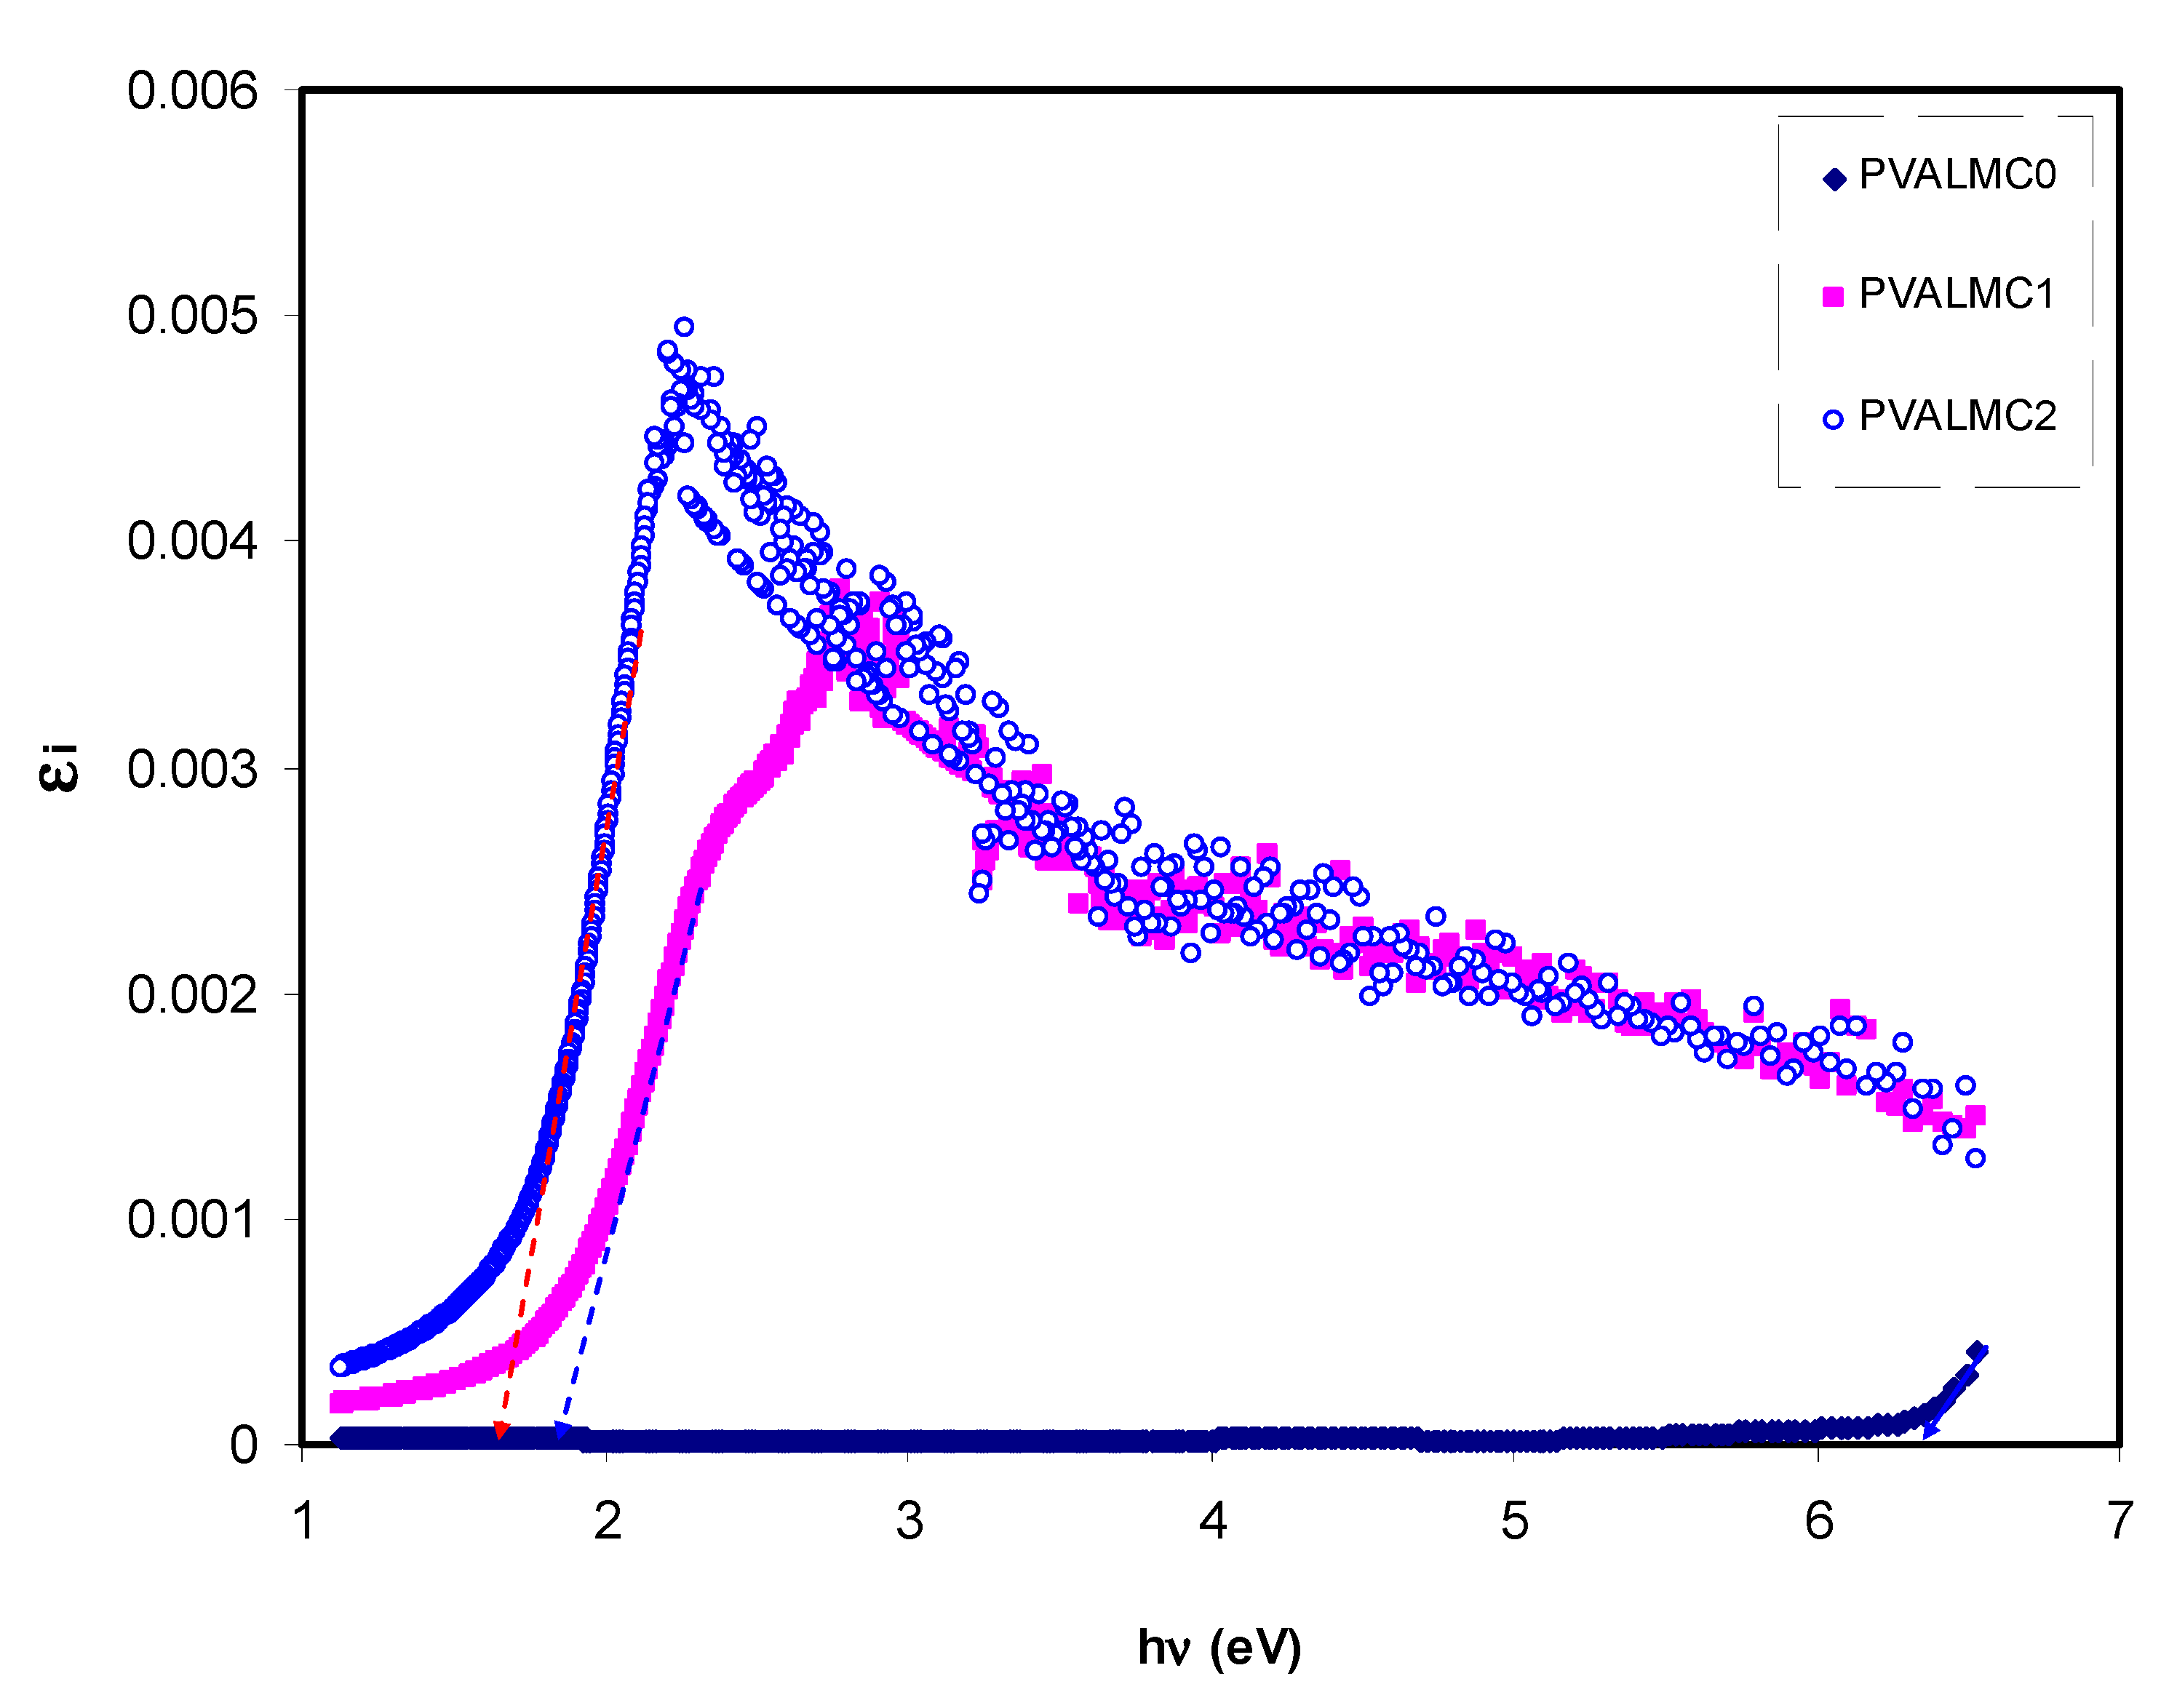
Figure 12 represents the plot of
εi versus
hν for clean PVA and composite films. Clear peaks for all the films can be detected. Prior investigations show that the peaks appearing in the
ε2 part of the dielectric function are directly related to inter-band transitions [
65,
66]. Thus, the intercept of linear parts below the peaks (
Figure 12) on the hν axis can be regarded as the valid bandgap.
Solids’ optical characteristics can be primarily explained by the CDF being linked to other detectable optical quantities using simple equations [
67]. Previous studies emphasized that optical dielectric functions (
εr and
εi) are related to the density of localized electronic states within the forbidden gap of the composite films [
60,
61,
67]. Using the
εi parameter with the help of (
N/m*) values, various important other parameters such as relaxation time (
τ), plasma frequency (
ωp), and electrical resistivity (
ρ) can easily be estimated using the Drude free electron model:
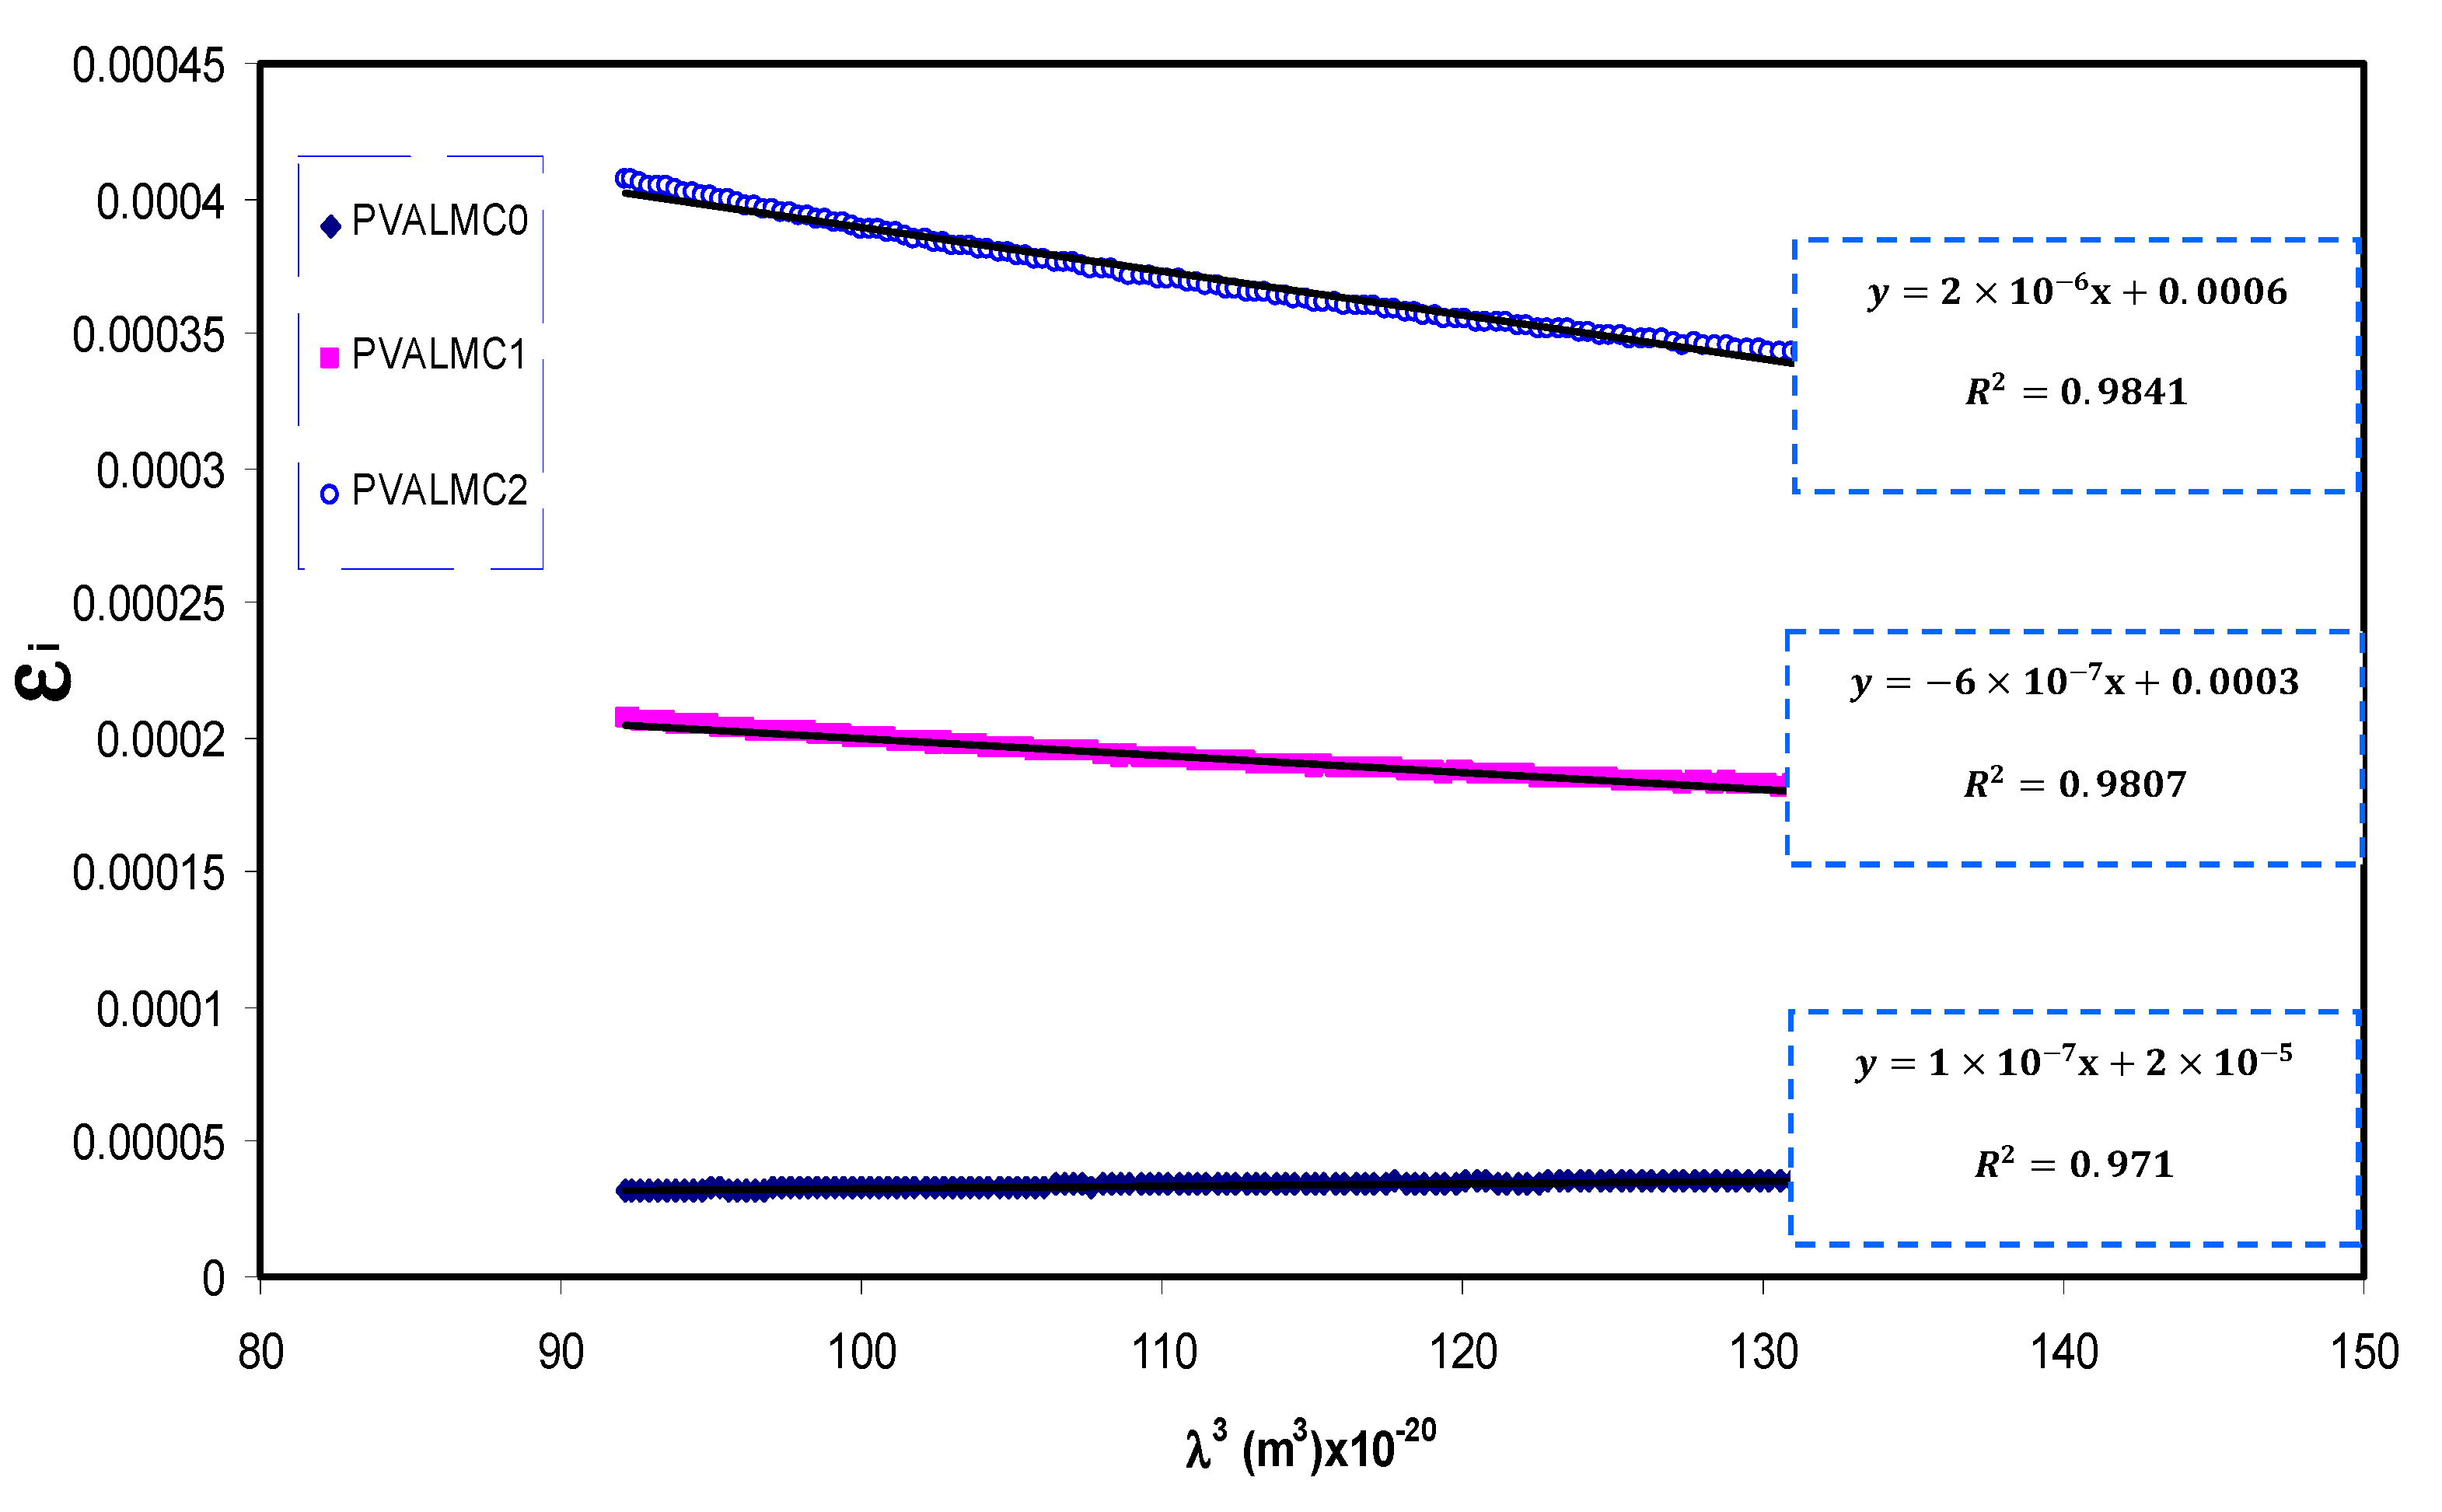
Figure 13 shows a variation of
εi with
λ3 for pure PVA films at different Al metal complex loadings in the region where a linear behavior was achieved. Using the
N/m* values obtained from Equation (5) and the slope of
εi versus
λ3, the values of relaxation time (
τ) were calculated. In addition, the optical mobility (
µopt), electrical resistivity (
ρopt), and plasma angular frequency of the electron were computed from the following relations [
68]:
The calculated values of
τ and
ωp are also presented in
Table 3. It can be seen from the table that the values of relaxation time (
τ), optical mobility (
µopt), and optical resistivity (
ρopt) of pure PVA were dropped with the addition of the Al
+3 metal complex. This indicates that the nanocomposites’ relaxation answer to the incident optical electric field has occurred quicker than the unfilled polymer. The decline of
τ,
µopt, and
ρopt are linked to the increase of
n, and, consequently, the velocity of light decreases in the medium with a higher refractive index. The addition of the Al
+3 metal complex also caused an intensification of plasma frequency (
ωp) of the electron by up to 20-fold, from 0.32 × 10
15 to 1.77 × 10
15 Hz. This is in agreement with previous findings for other polymer nanocomposites, indicating that the strong local electric field was induced by the nanofillers’ dipole moment, which enhanced the material’s polarization under the incident electric field [
69]. Thus, in addition to bandgap estimation from optical dielectric loss function, various optical parameters were determined, which are crucial from the materials selection viewpoints for optoelectronic applications.
The fundamental absorption refers to the band-to-band transitions, which are treated with exact selection rules, and it declares itself by a speedy boost in the fundamental absorption region [
50,
70]. Based on the band structure, there are several types of transitions [
70]. In amorphous semiconductors which have indirect transitions, no electronic momentum conservation is available when the transition occurs from the valence band to the conduction band [
47]. The
α for direct bandgap material is expressed by the equation below [
63]:
where
hυ is photon energy,
A is a constant, and
Eg is optical energy gap. The values of
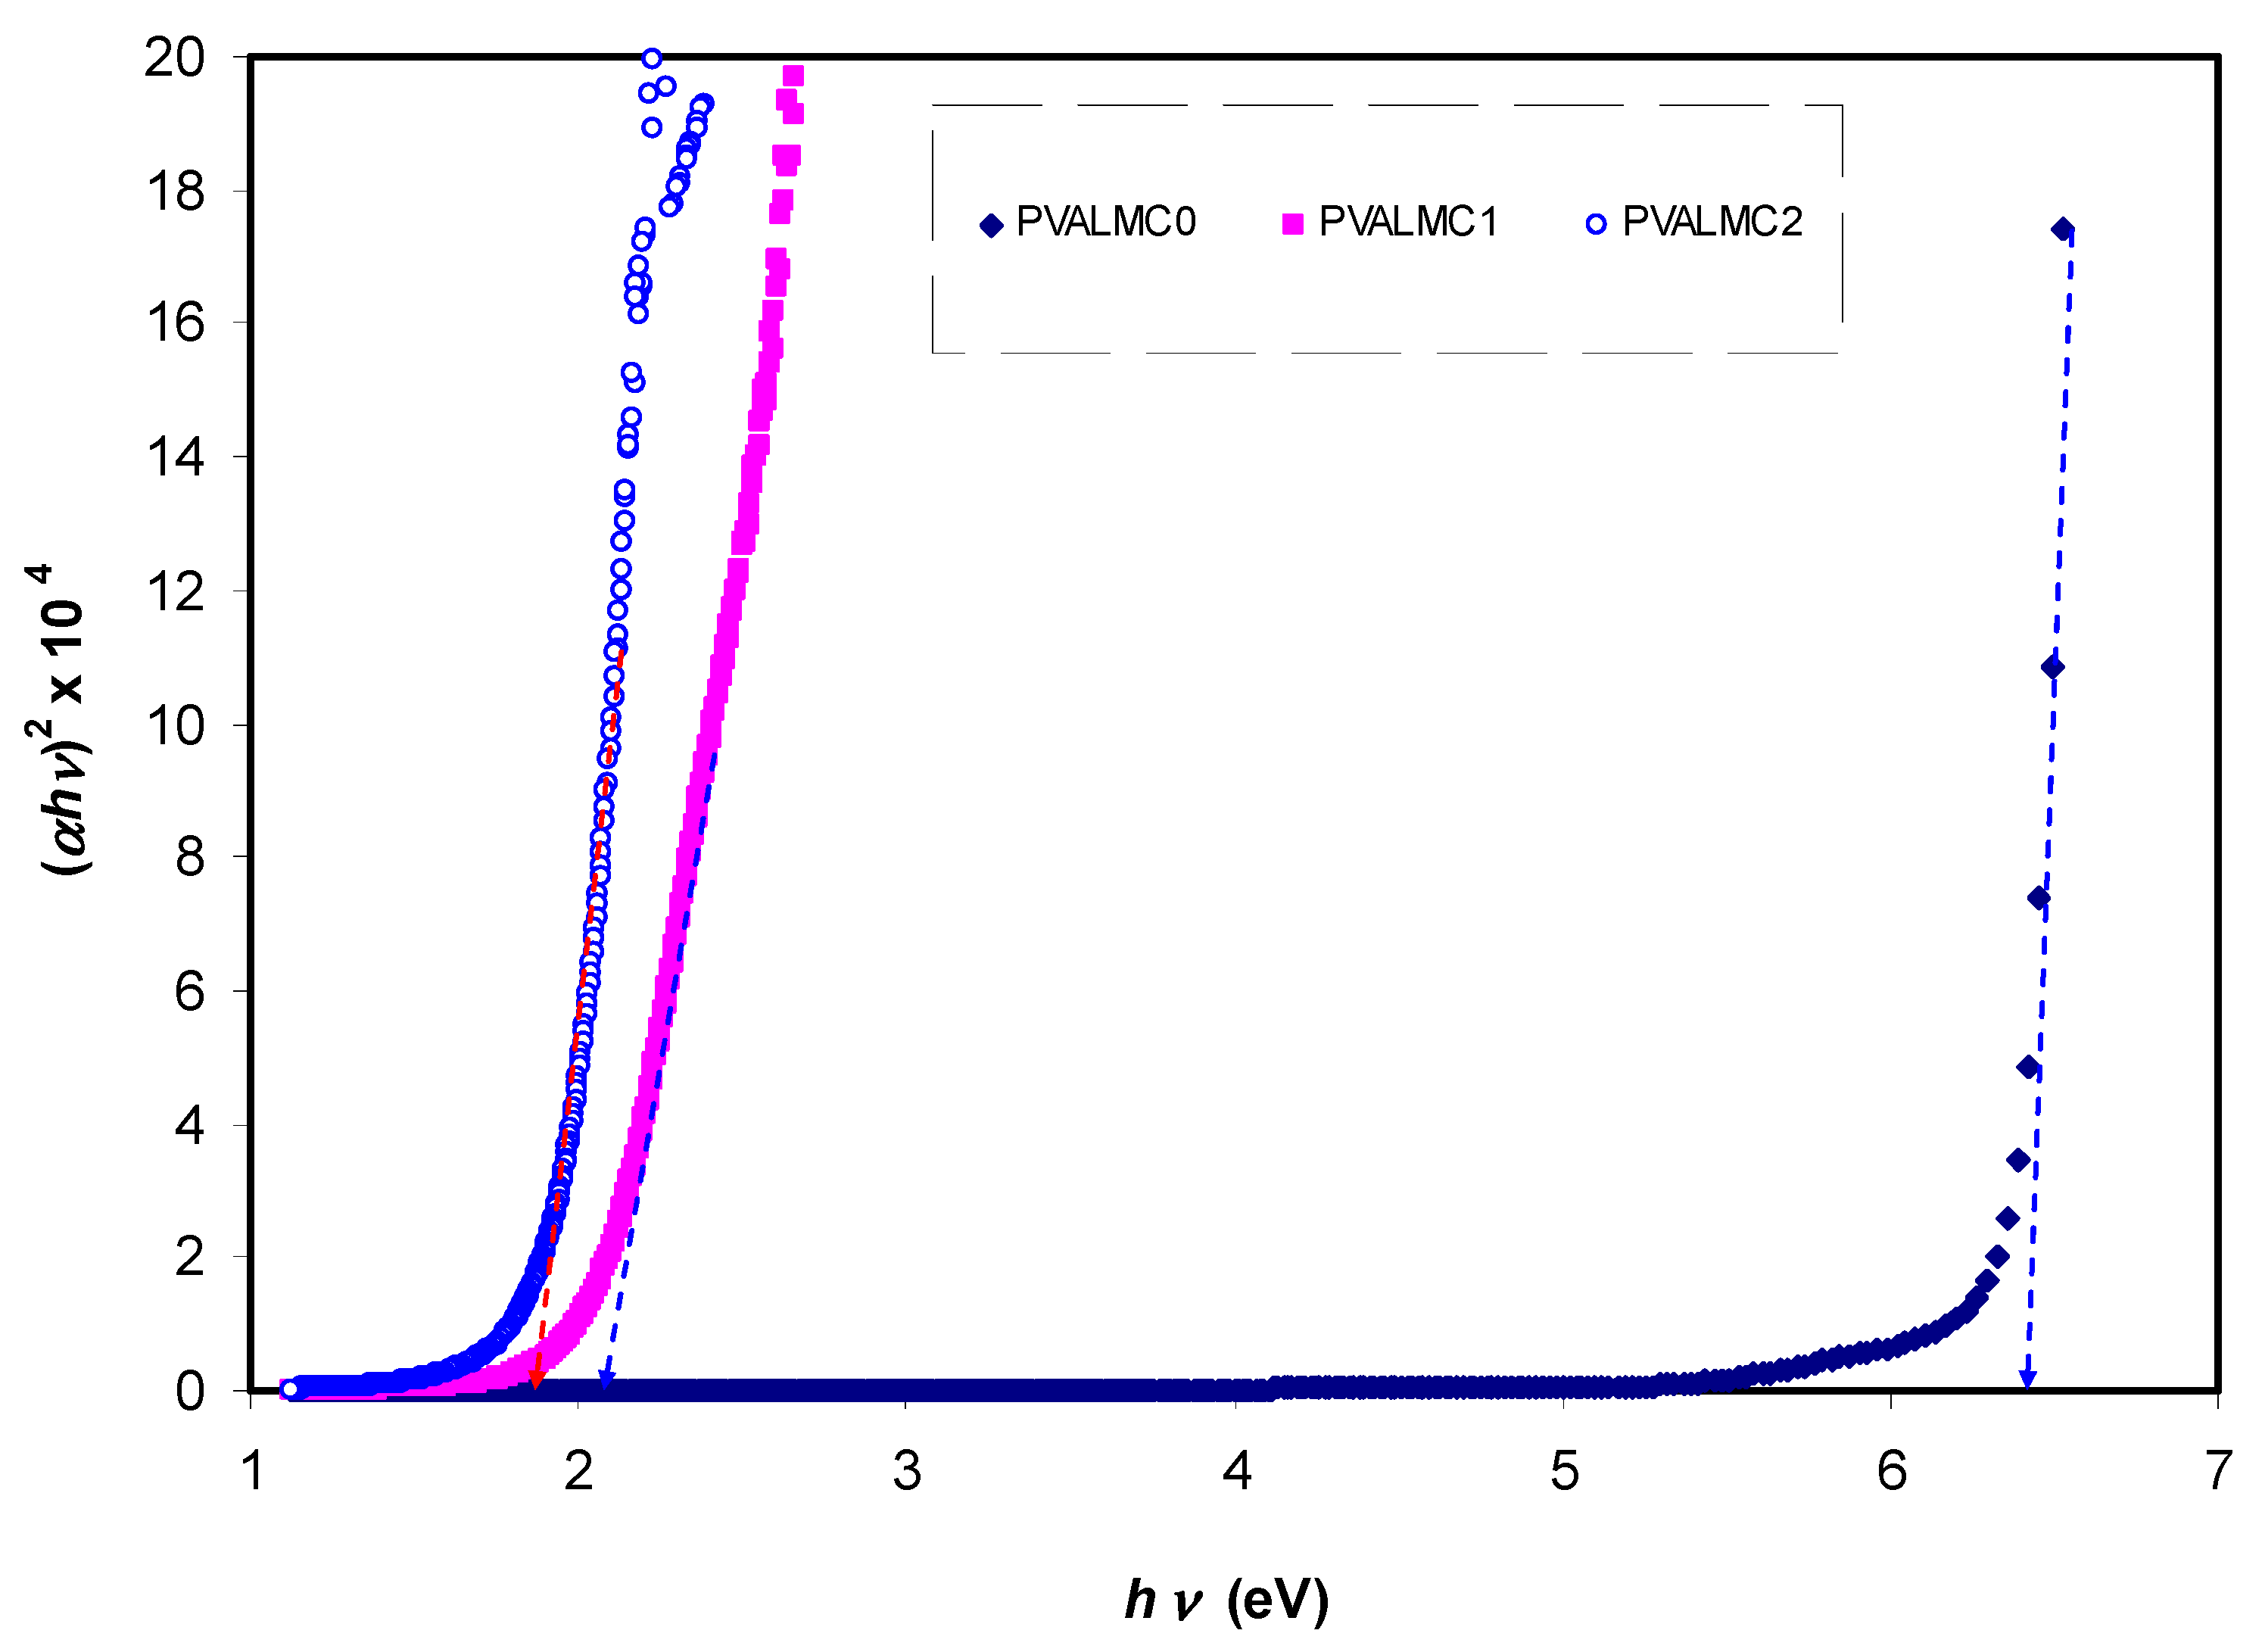
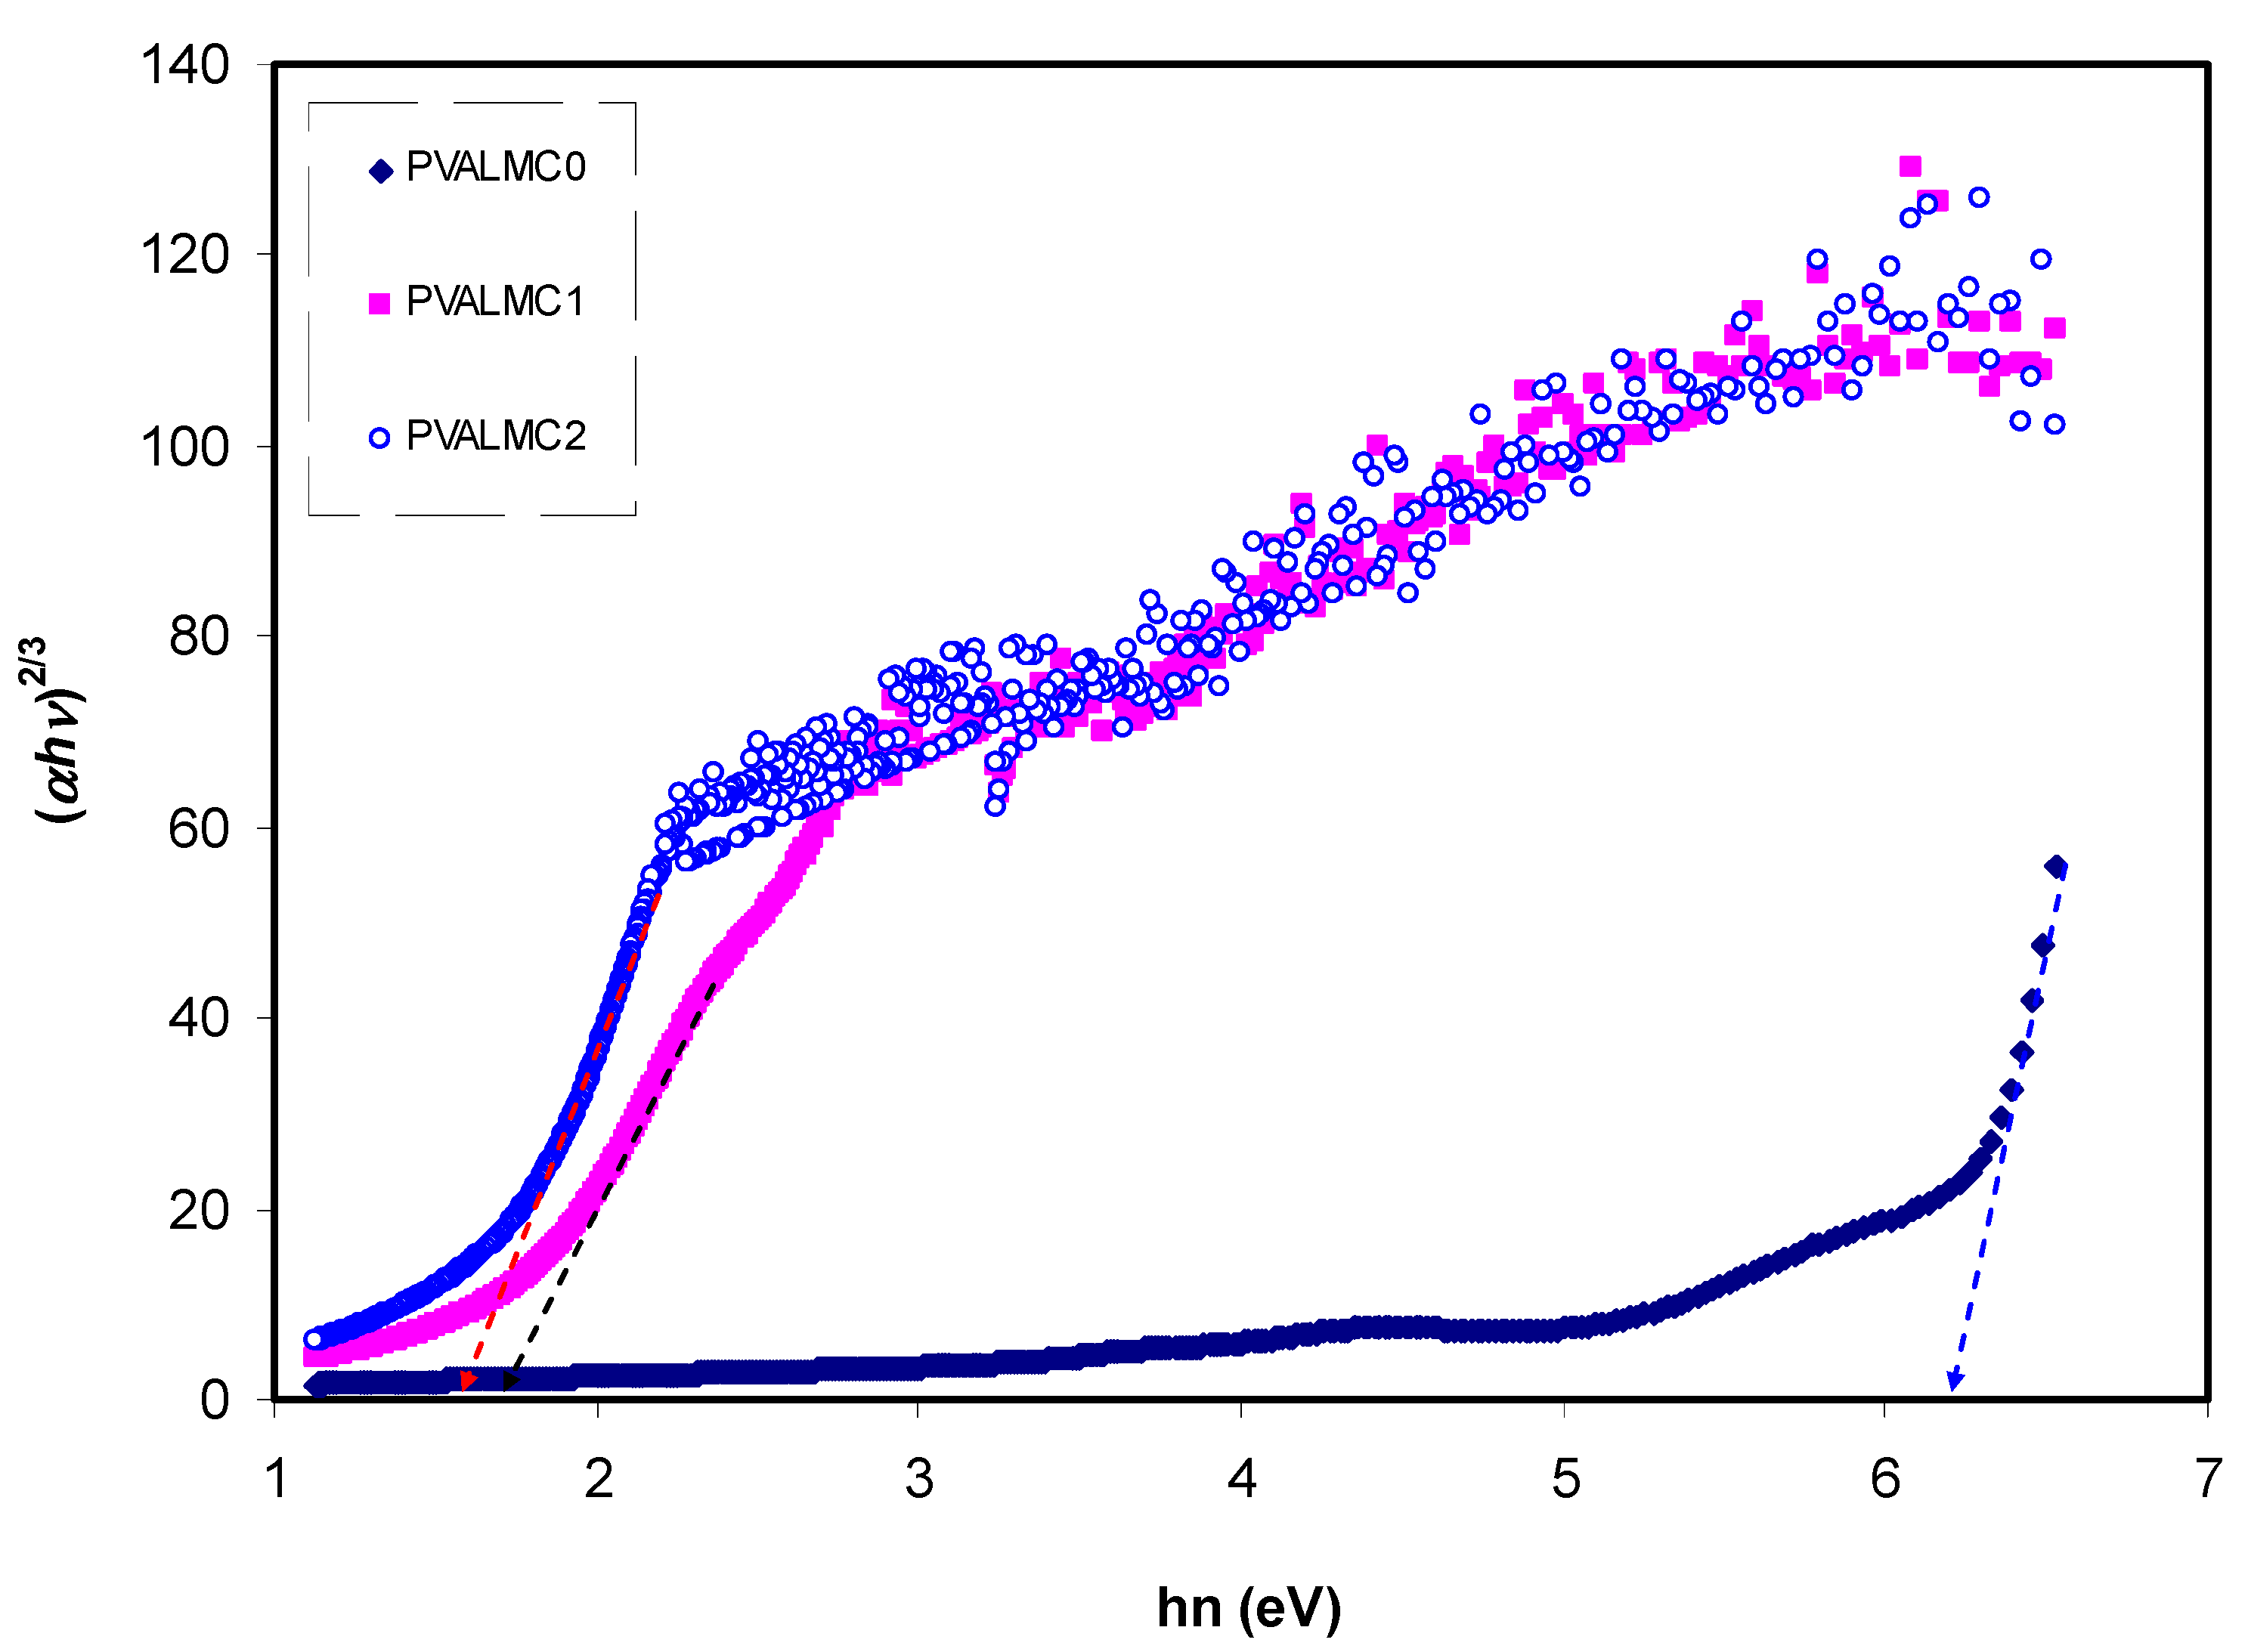
γ = 1/2, 3/2, 2, and 3 representing direct allowed, direct forbidden, indirect allowed, and indirect forbidden transitions, respectively. The intercept of linear parts of
Figure 14 on the photon energy axis can be employed to evaluate the band gap value. It is well reported that the success of optoelectronic tools is associated mainly with the current enhancement in material superiority. Knowledge of band gaps is crucial for understanding a semiconductor’s electrical properties and is therefore of great practical interest [
70]. The bandgap values for direct allowed transition (
γ = 1/2) and direct forbidden transition (
γ = 3/2) are presented in
Table 4. Since different orbitals of the metal complexes and the ligands contribute to the band edges in amorphous materials, it is hard to envisage whether the transition type is direct or indirect [
71]. Thus, from the fundamental absorption equation (i.e., Equation (3)), many figures can be drawn in reference to the values of
γ. However, it is hard to specify the type of electron transition from Equation (3) alone. To identify the responsible type of electron transition accurately, the Tauc’s model results should be compared to bandgap values received from
εi spectra (
Figure 12). From the comparison of
Figure 14 and
Figure 15 to
Figure 12 (see
Table 4), it can be deduced that the type of electronic transition in pure PVA is direct allowed, and in composite samples it is forbidden direct allowed transition. Thus, an optical dielectric function is an effective tool to study the band structure of solids. The source and the distinct peaks in the dielectric functions of carbon-based materials are caused by interbond transitions [
66].
The bandgap variation reported in the present work for PVA impregnated with Al
3+-complex is of great importance compared to those reported for PVA incorporated with various ceramic fillers and nanoparticles, as depicted in
Table 5.
3.4.4. Wemple-DiDomenico (WD) Model
One of the most essential properties of the optical material is the refractive index and its dispersion behavior. The refractive index dispersion is crucial in optical communication and in designing devices for spectral dispersion [
81]. The single oscillator model presented by WD can be applied to explore the refractive index dispersion in the normal region [
82]. The exploration is done by introducing a dispersion energy parameter (
Ed) as a gauge of the force of inters band optical transition. This
Ed parameter combines both the coordination number and the charge allocation in each unit cell and is firmly interconnected to the chemical bonding [
83]. However, a single oscillator parameter (
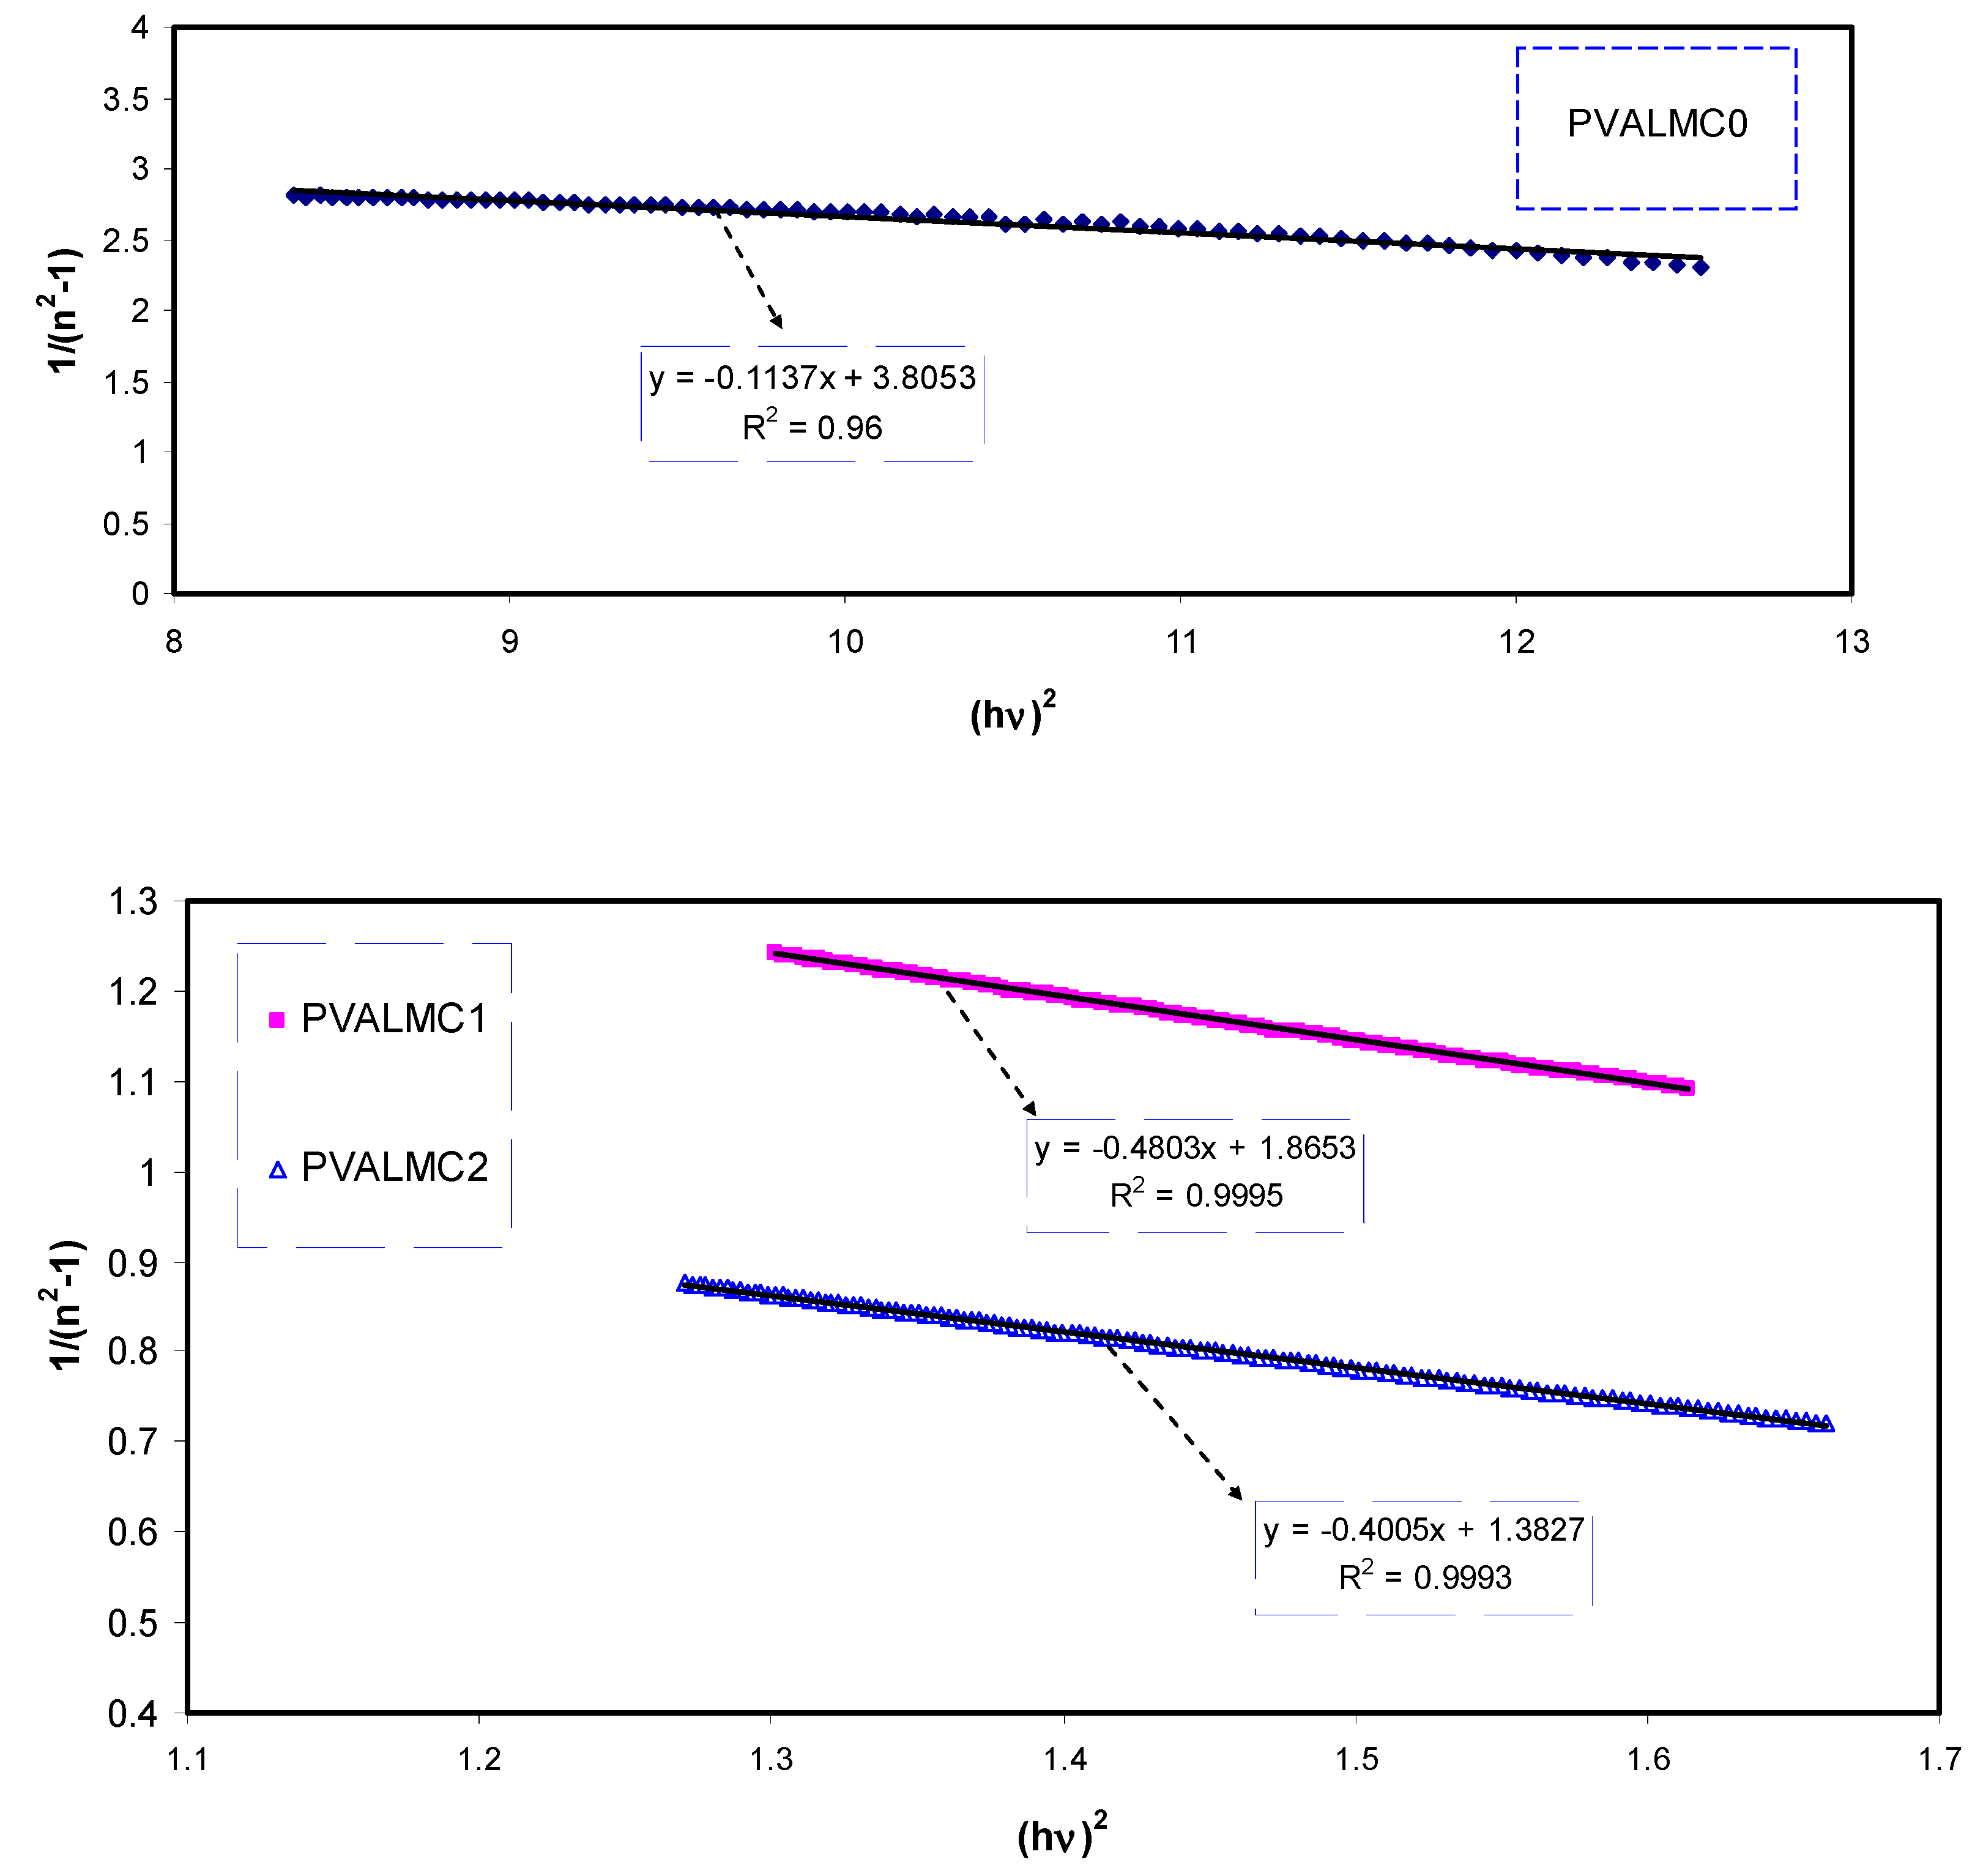
Eo) is proportional to the energy of the oscillator. The refractive index and the photon energy below the interband absorption edge can be related to each other through the following semi-empirical relation:
As depicted in
Figure 16, the data on the plots of 1/(
n2 − 1) against (
hυ)
2 were fitted with linear regression lines to obtain the values of
Ed and
Eo from the intercept and slope, respectively. The calculated values of the
Eo and
Ed are given in
Table 6. An increase in
Ed and a decrease in
Eo values with increasing the concentration of the Al
3+ complex solution were observed. There is a relation of
Eo with the optical band gap (
Eg) [
84]. For the present films, empirically, the
Eo values are equal to the direct
Eg (i.e.,
Eo ≈ Eg), as shown in
Table 4.


 ,
, 


