
Viscoelastic Polyurethane Foam with Keratin and Flame-Retardant Additives

 , , ,
, , ,  , , and
Abstract
:
1. Introduction
2. Materials and Methods
- Keratin filler with particle size 0.01–0.04 mm (K), (Łukasiewicz Research Network—Institute of Biopolymers and Chemical Fibers, Łódź, Poland).
- Fyrol PNX (F)—ICL Industrial Products Ltd., Tel-Aviv, Israel), an alkyl phosphate.
- Expandable Graphite (EG)—Sinograf SA, Toruń, Poland), the particle size 0.5 mm, expansion 250 mL/g, starting expansion temperature 220 °C.
- Aluminum hydroxide, MARTINAL (ATH)—(Albemarle, Charlotte, NC, USA), the particle size 10 µm.
- Magnesium hydroxide, MAGNIFIN (MTH)—(Albemarle, Charlotte, NC, USA), the particle size 20 µm.
- Zinc oxide (ZO—(Unipress Institute of High Pressure Physics, Warsaw, Poland), the particle sizes 70 nm.
- Ammonium polyphosphate, Exolit AP 422 (APP)—(Clariant, Muttenz, Switzerland).
2.1. Preparation of Keratin Feather
2.2. Preparation of Foams
3. Experimental
4. Results and Discussion
4.1. Characteristics of Keratin Fibers
4.2. Characteristics of Foams
4.2.1. Chemical Constitution
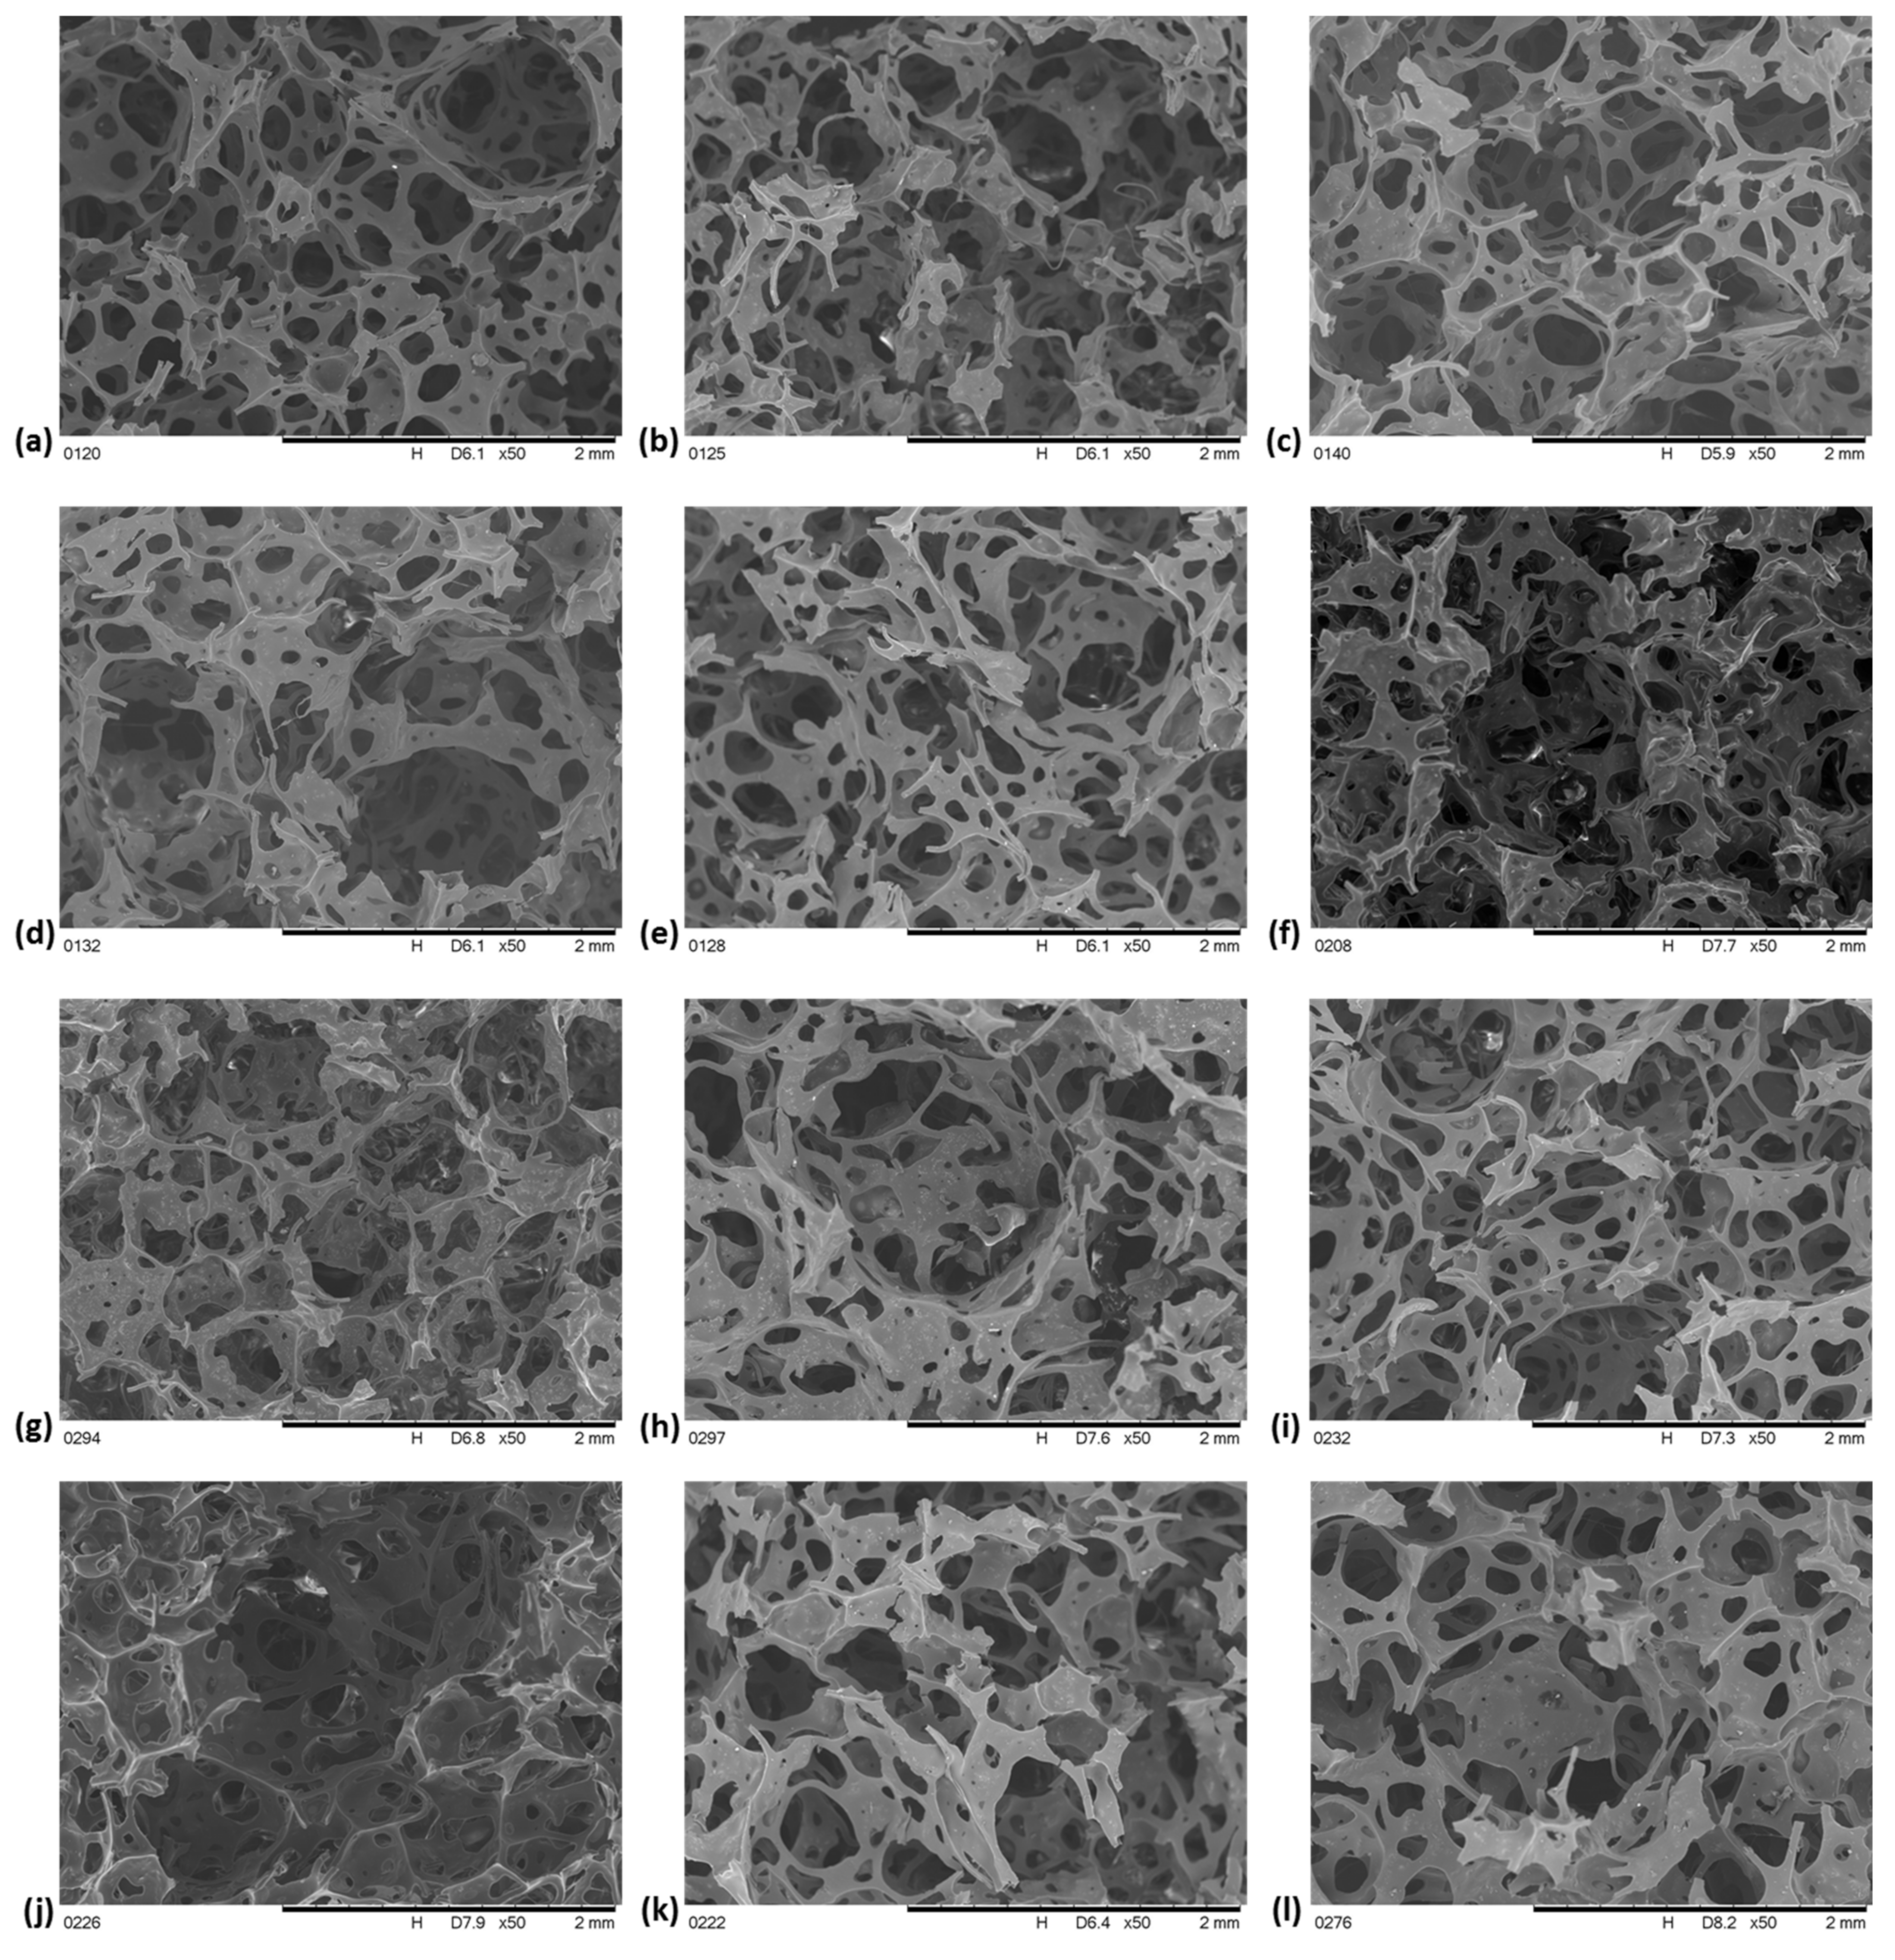
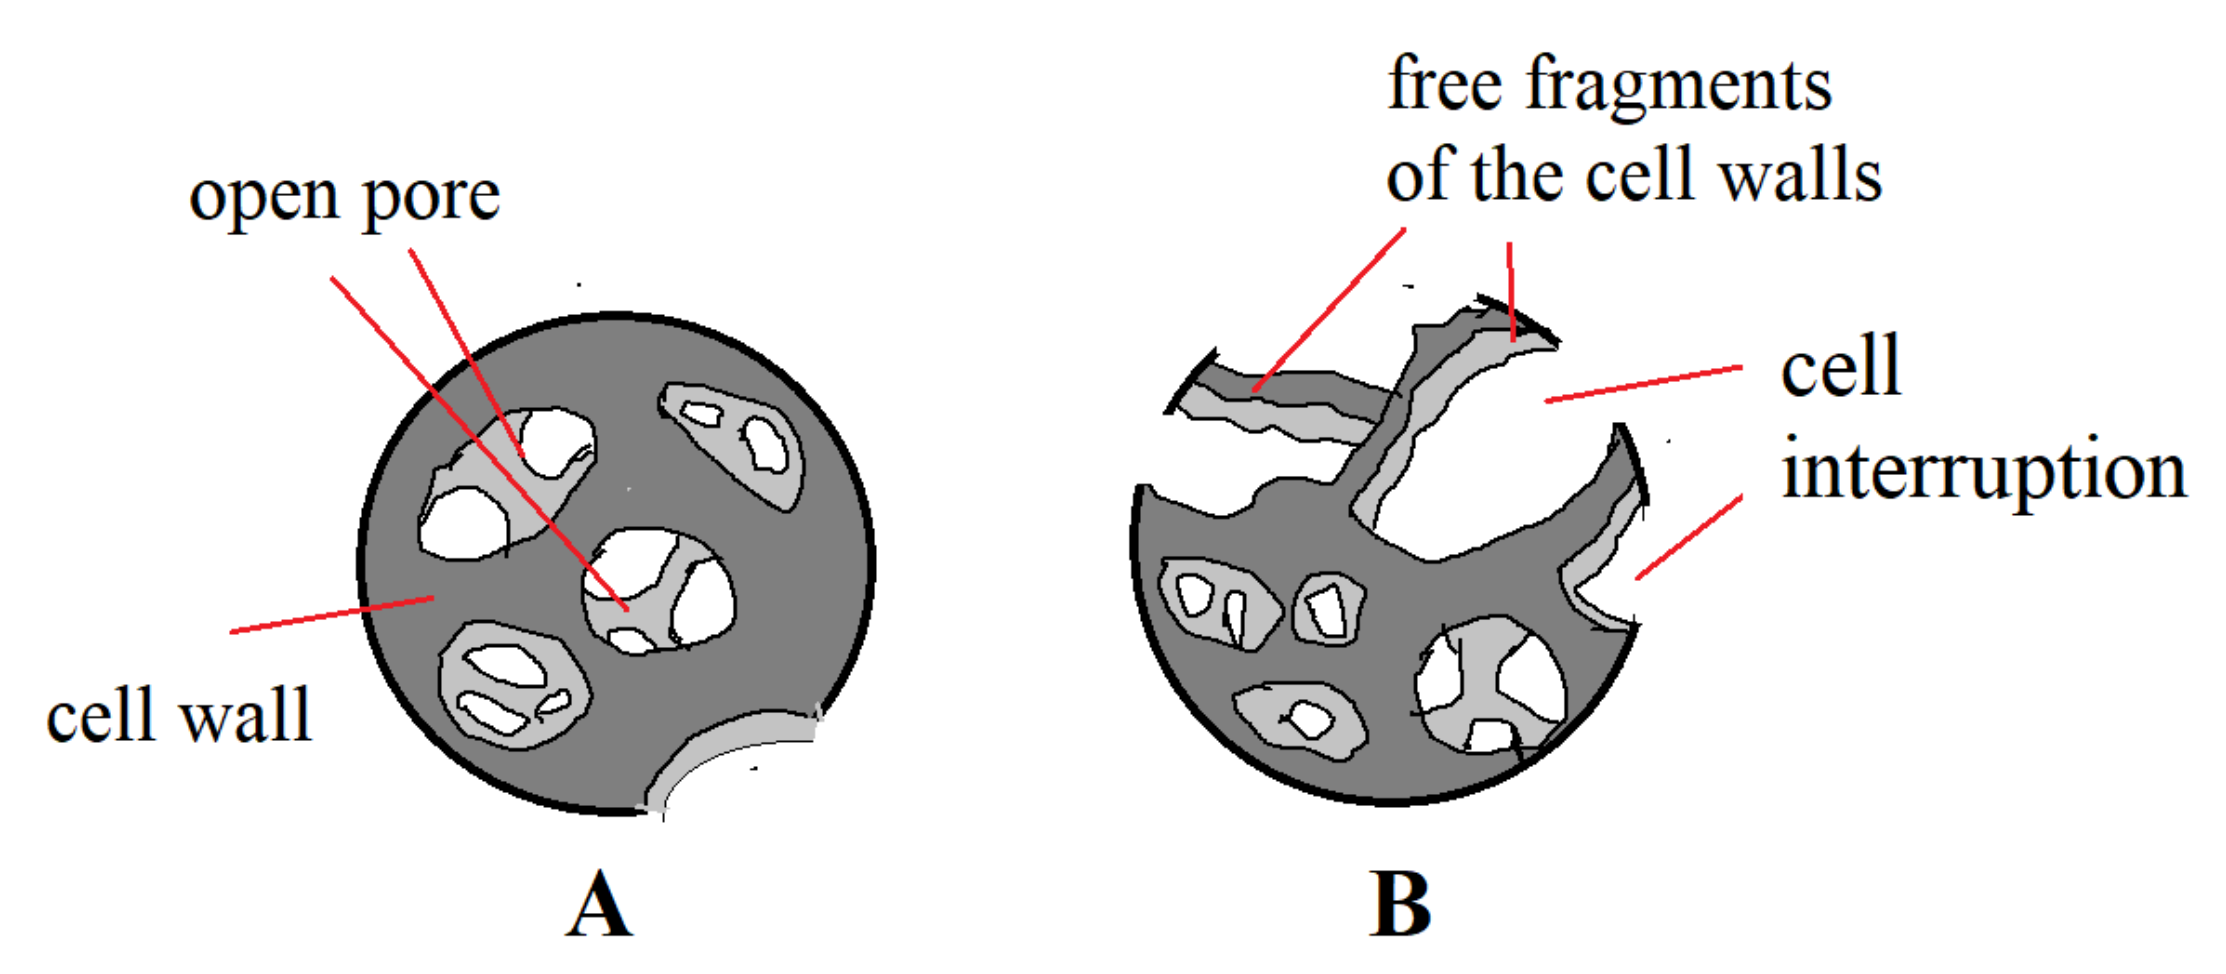
4.2.2. Morphology
4.2.3. Apparent Density
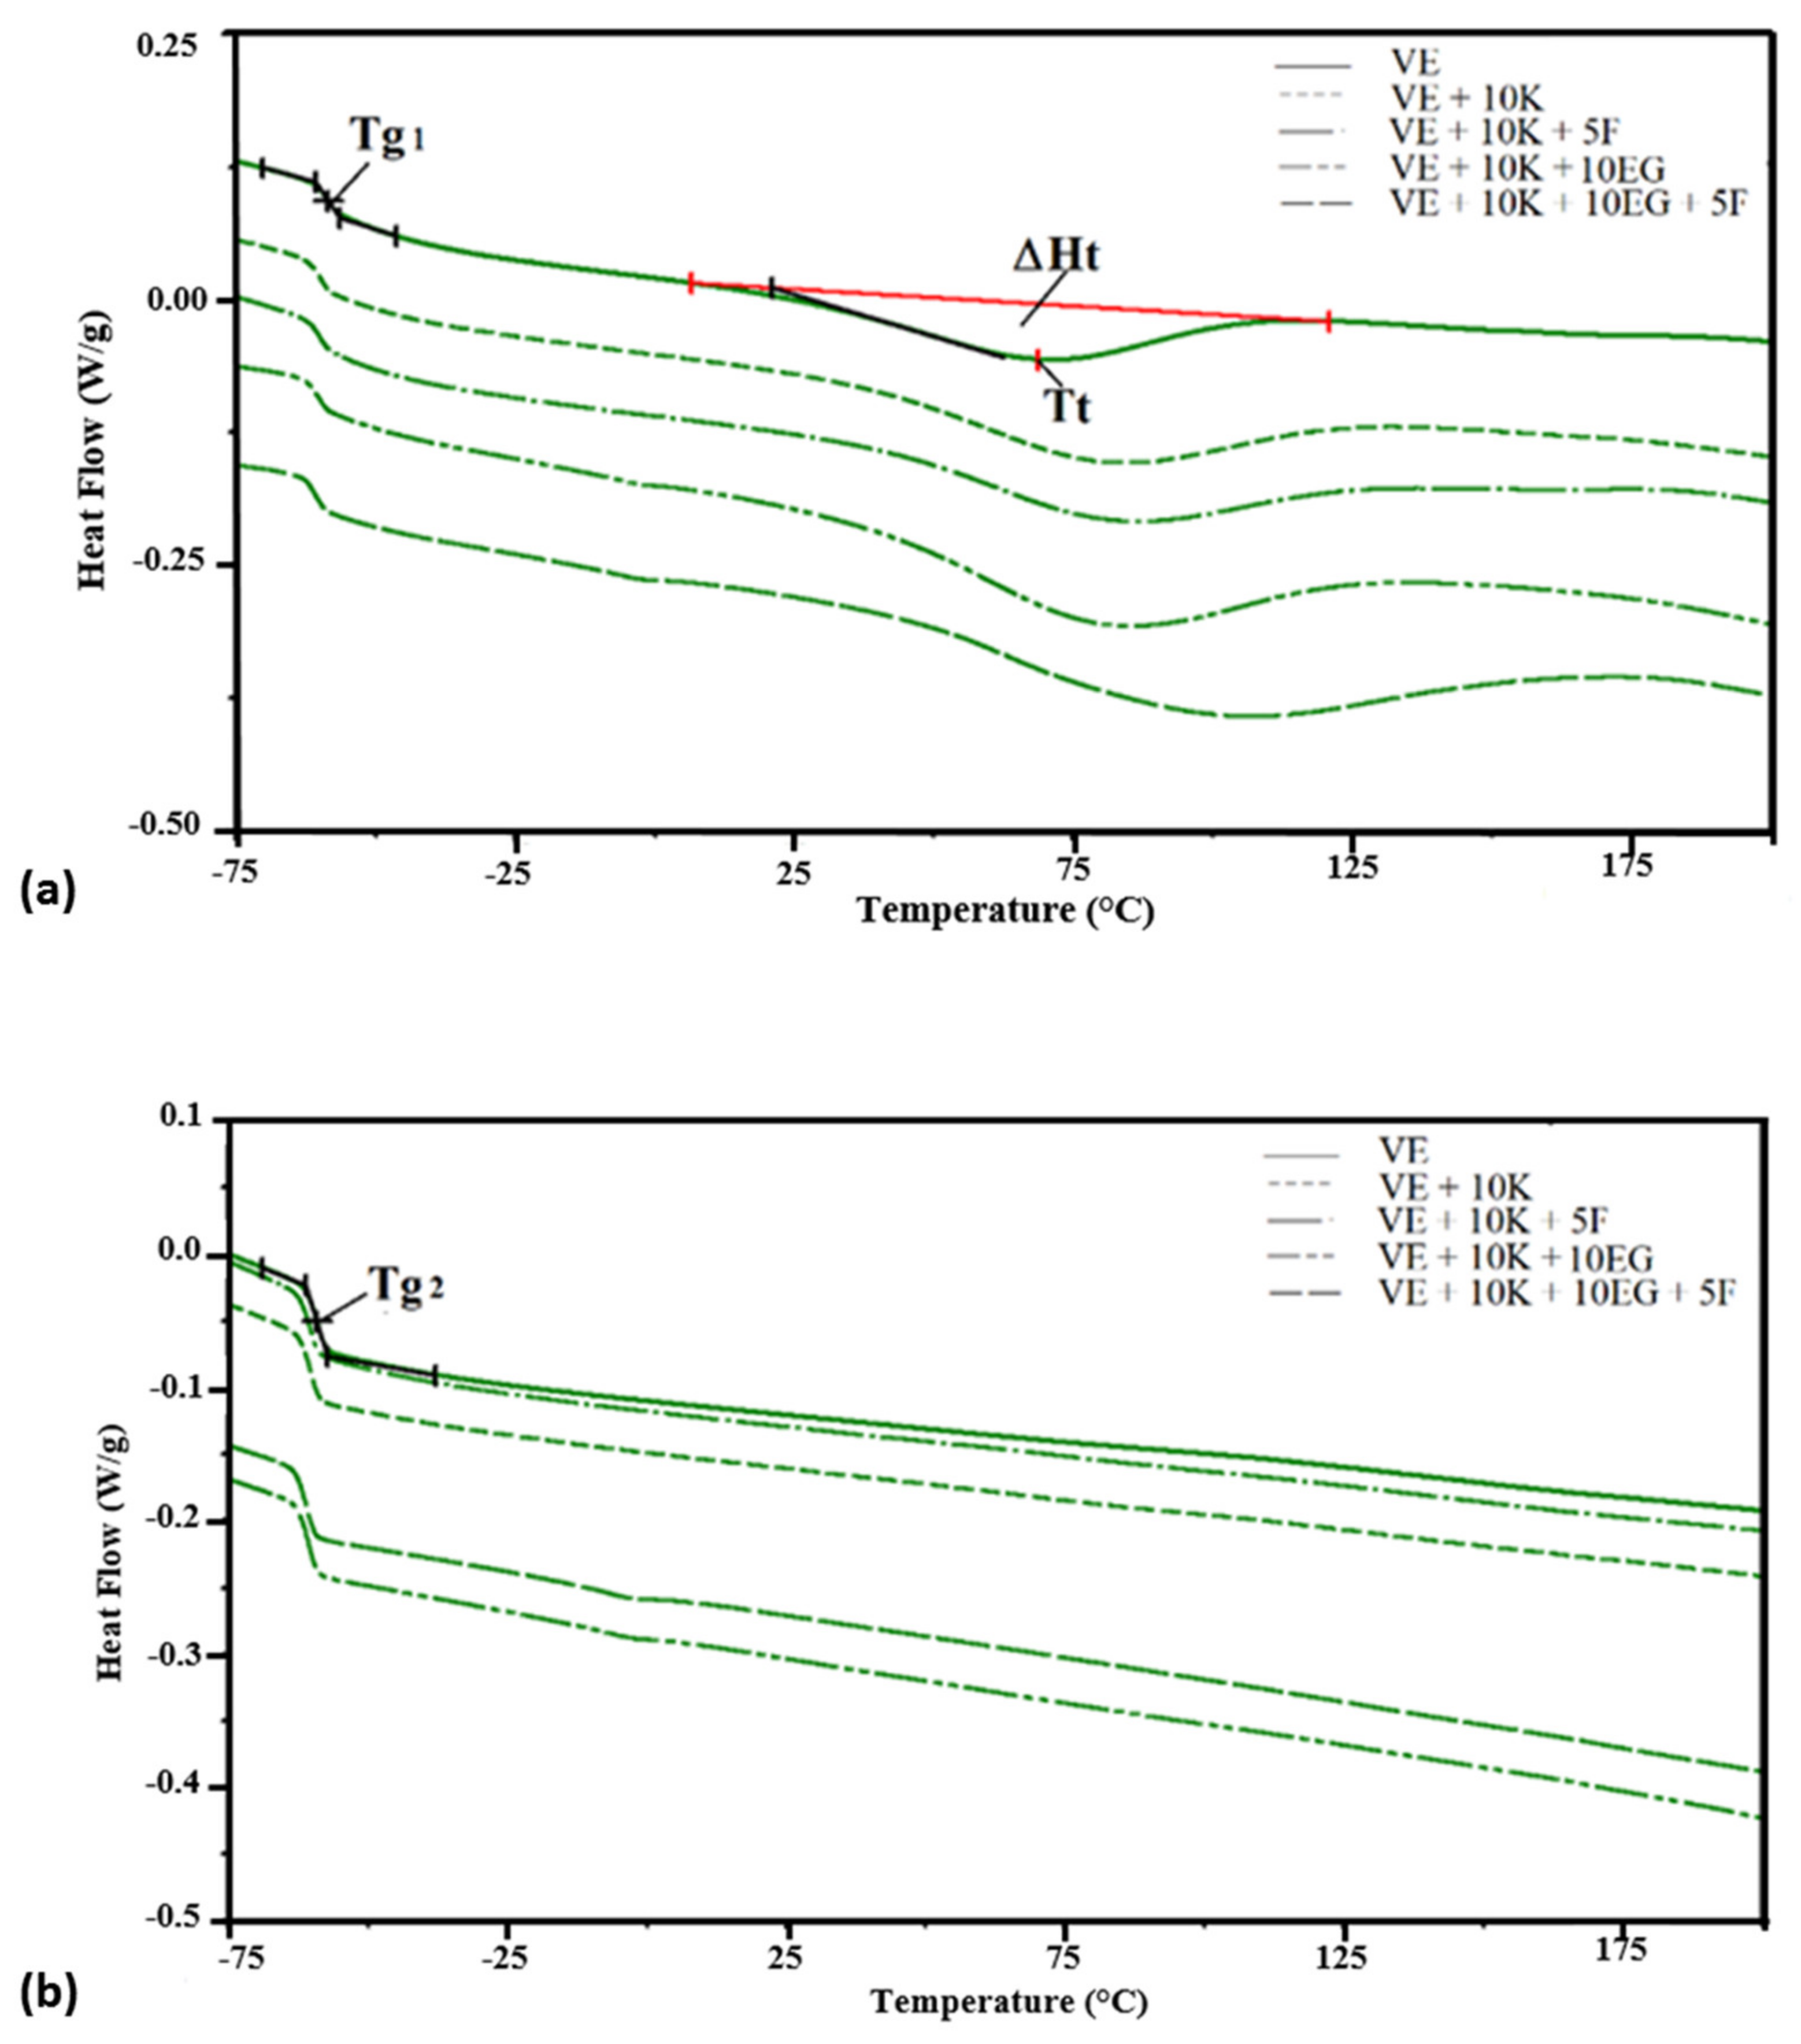
4.2.4. Thermal Analysis
4.2.5. Mechanical Properties
5. Conclusions
Author Contributions
Funding
Institutional Review Board Statement
Informed Consent Statement
Conflicts of Interest
Abbreviations
| APP | Ammonium polyphosphate |
| ATH | Aluminum hydroxide |
| ATR-FTIR | Fourier transform infrared spectroscopy |
| av-HRR | Average of heat release rate |
| CS | Compressive set |
| DPS | Degree of phase separation |
| DSC | Differential scanning calorimetry |
| TA | Thermal analyses |
| DTG | Derivative thermogravimetry |
| EG | Expandable graphite |
| F | Fyrol pn |
| FPUF | Flexible polyurethane foam |
| FR | Flame retardant |
| FTIR | Spectrophotometric analyses |
| HRR | Heat release rate |
| HS | Rigid segments in polyurethanes |
| HSe | Rigid segments in polyurethanes determined from tga analysis |
| HSt | Rigid segments in polyurethanes for theoretical foam |
| K | Keratin filler |
| ma1, ma2, ma3 | Weight loss at each of the degradation stages in air atmosphere |
| MDI | Diisocyanate ongronate 4040—a mixture of monomeric isomers and oligomer icmethylenediphenyl-4, 4′-diisocyanate |
| mn1, mn2, mn3 | Weight loss at each of the degradation stages in nitrogen atmosphere |
| MTH | Magnesium hydroxide |
| pHRR | Maximum value of heat release rate |
| pHRR/tPHRR | pHRR ratio at the time of its achievement, maximum value of heat release rate |
| PML | Percentage mass loss |
| R | Hydrogen bonding inde |
| Ra900 | Residue after degradation at 900 °c in air atmosphere |
| Rn900 | Residue after degradation at 900 °c in nitrogen atmosphere |
| SAG | Comfort coefficient |
| SEM | Scanning Electron Microscope |
| SS | Flexible segments in polyurethanes |
| SSe | Flexible segments in polyurethanes determined from TGA analysis |
| SSt | Flexible segments in polyurethanes for theoretical foam |
| Ta1, Ta2, Ta3 | Temperature of the maximum degree of degradation in air atmosphere |
| Ta5% | Temperature of 5% weight loss in air atmosphere |
| Tg | Glass transition temperature |
| TGA | Thermogravimetric Analyses |
| Tgs1, Tgs2 | Glass transition temperature in the first and second heating cycle |
| THR | Total heat release |
| Tn1, Tn2, Tn3 | Temperature of the maximum degree of degradation in nitrogen atmosphere |
| Tn5% | Temperature of 5% weight loss in nitrogen atmosphere |
| Tt | Temperature of the transformation disorder-order |
| Va1, Va2, Va3 | Maximum rate of degradation in air atmosphere |
| VE | Unmodified polyurethane foams |
| VEPUR | Viscoelastic polyurethane foam |
| VE+ 10 K | Unmodified polyurethane foam with addition of 10% keratin |
| VE + 10 K +5 F | Unmodified polyurethane foam with addition of 10% keratin and 5% Fyrol |
| VE + 10 K +10 ATH | Unmodified polyurethane foam with addition of 10% keratin, 10% aluminum hydroxide |
| VE + 10 K+ 10 ATH+5 F | Unmodified polyurethane foam with addition of 10% keratin, 10% aluminum hydroxide and 5% fyrol |
| VE + 10 K +10 MTH | 10% magnesium hydroxide |
| VE + 10 K +10 MTH + 5 F | Unmodified polyurethane foam with addition of 10% keratin, 10% magnesium hydroxide and 5% fyrol |
| VE + 10 K +10 ZO | Unmodified polyurethane foam with addition of 10% keratin and 10% zinc oxide |
| VE + 10 K +10 ZO +5 F | Unmodified polyurethane foam with addition of 10% keratin, 10% zinc oxide, and 5% fyrol |
| VE + 10 K +10 EG | Unmodified polyurethane foam with addition of 10% keratin and 10% expandable graphite |
| VE + 10 K +10 EG +5 F | Unmodified polyurethane foam with addition of 10% keratin 10% expandable grophite and 5% fyrol |
| VE + 10 K +10 APP | Unmodified polyurethane foam with addition of 10% keratin and 10% ammonium polyphosphate |
| VE + 10 K +10 APP +5 F | unmodified polyurethane foam with addition of 10% keratin, 10% ammonium polyphosphate, and 5% fyrol |
| Vn1, Vn2, Vn3 | maximum rate of degradation in nitrogen atmosphere |
| ZO | zinc oxide |
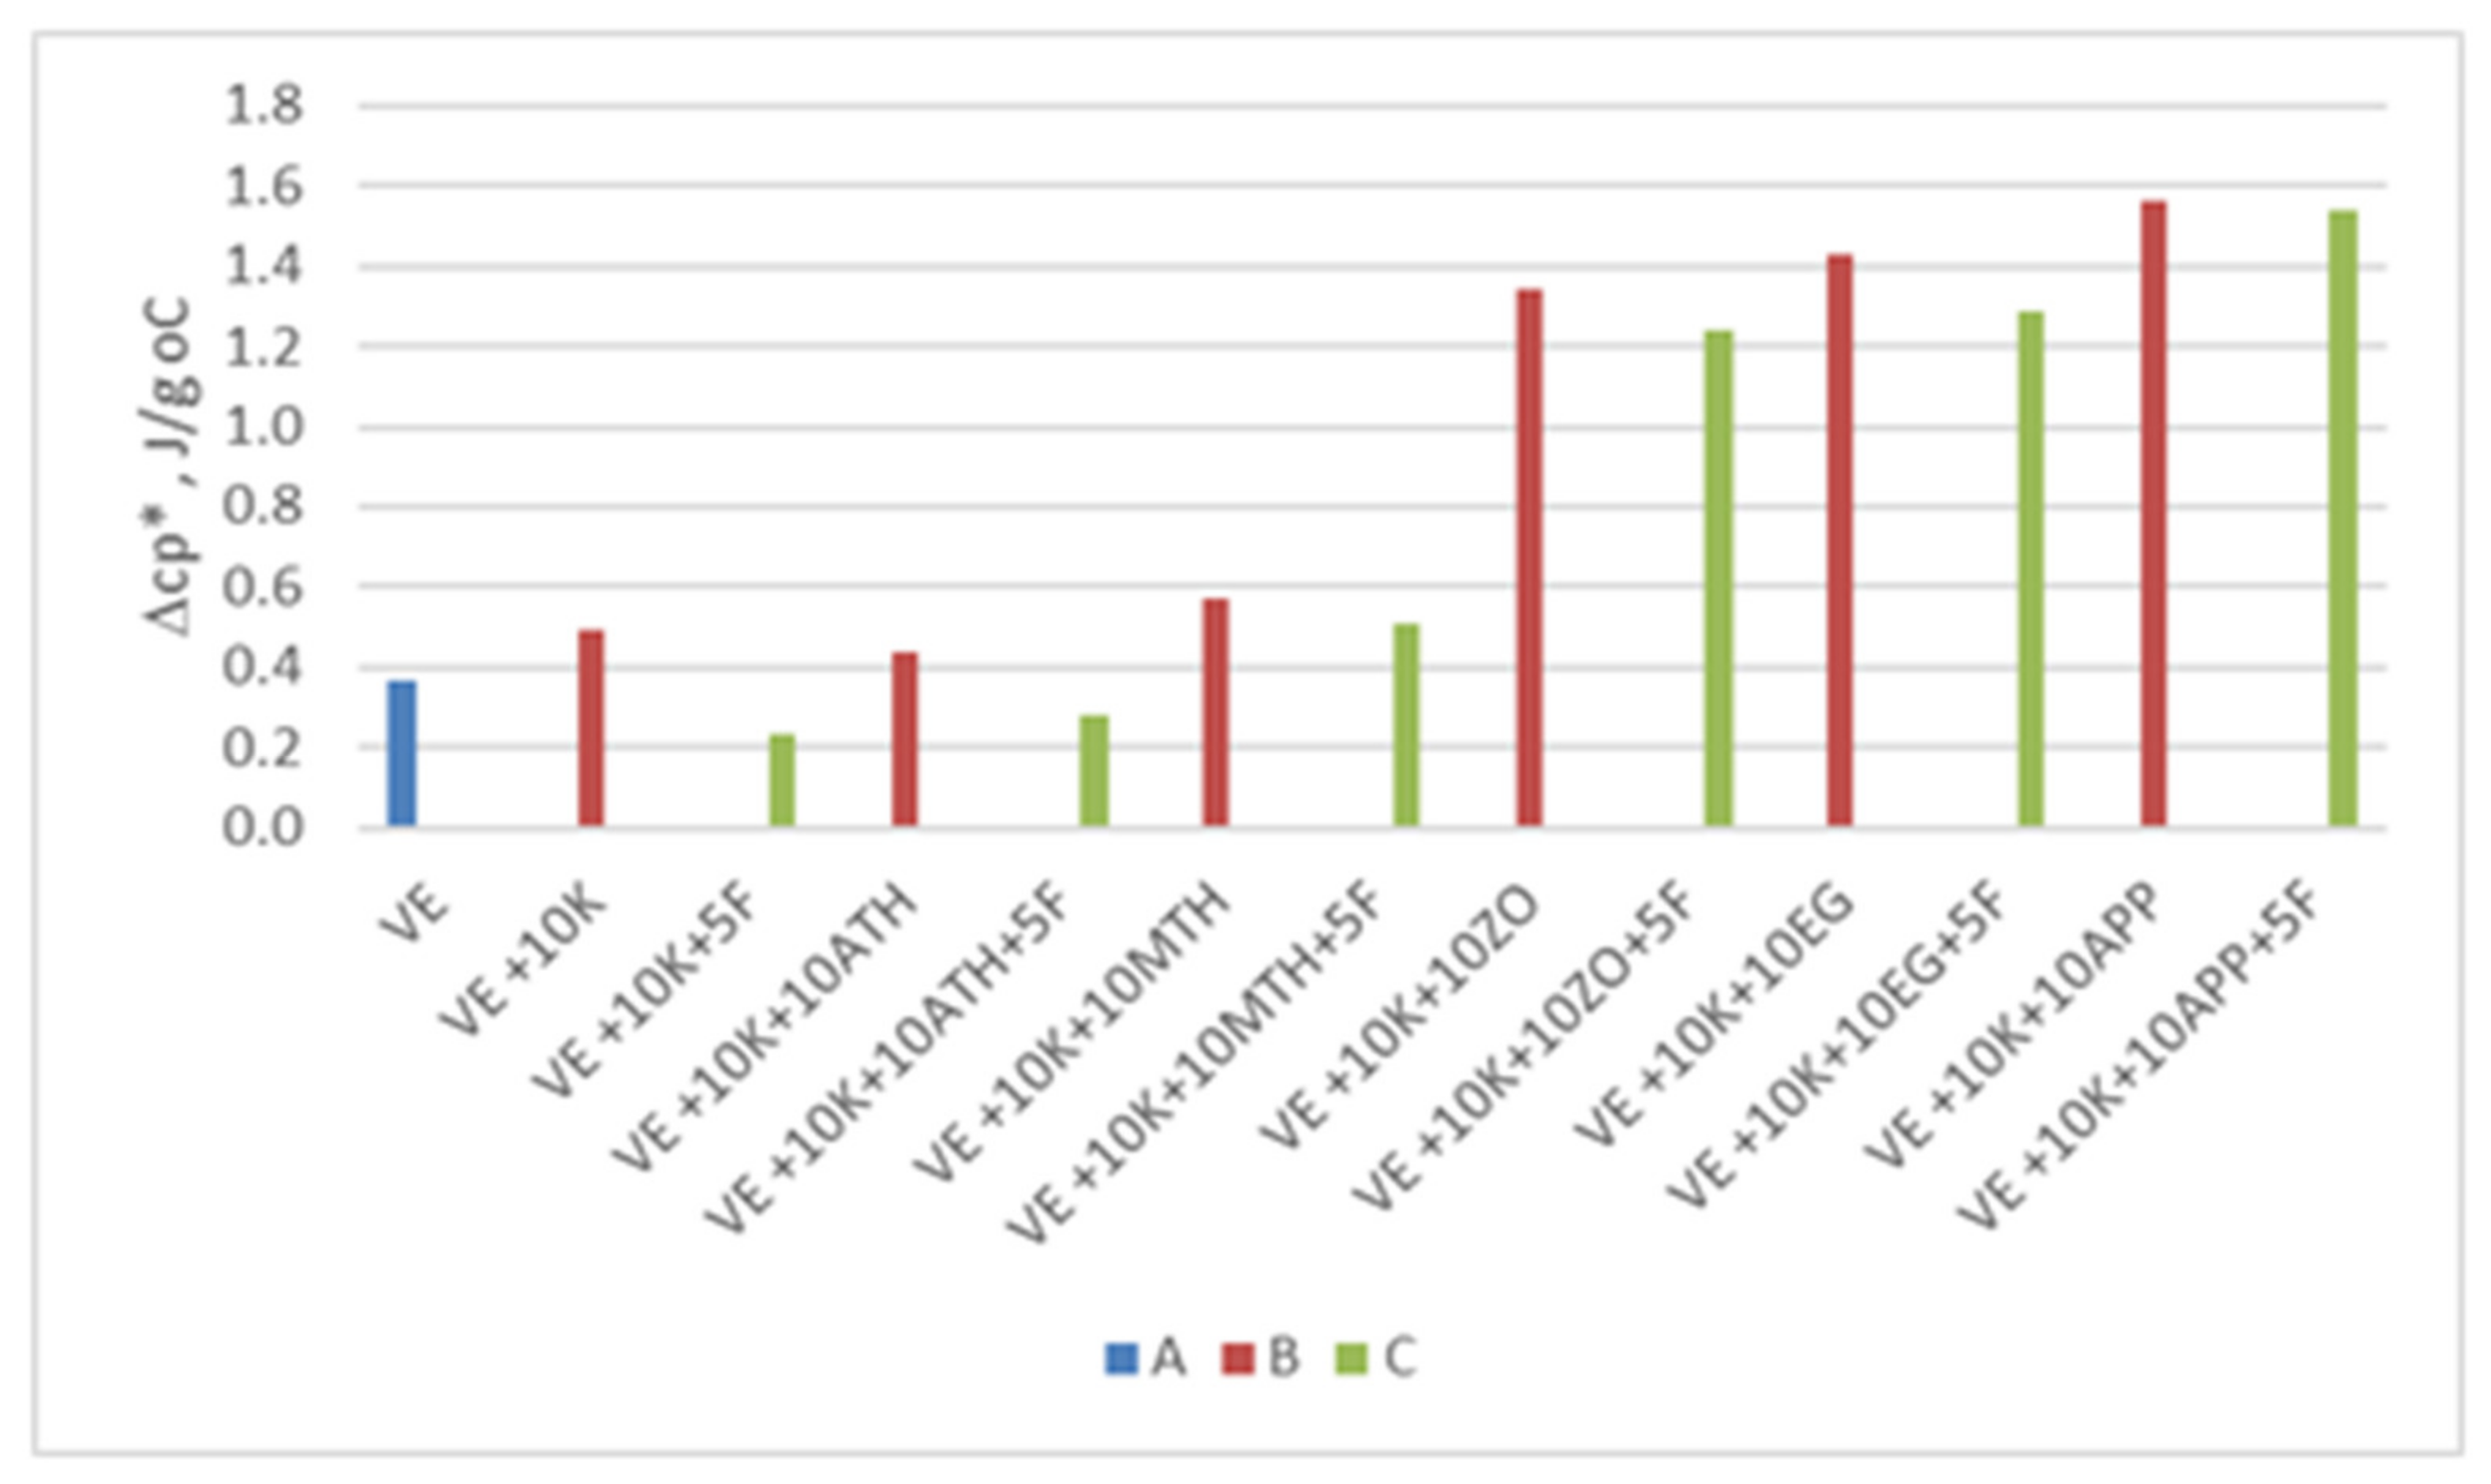
| Δcp * | specific heat in the scope of glass transition transformation. |
| ΔHt | enthalpy of transformation disorder–order |
References
- Available online: https://spinoff.nasa.gov/Spinoff2005/ch_6.html (accessed on 3 December 2020).
- Park, K.H.; Park, J. The Efficacy of a Viscoelastic Foam Overlay on Prevention of Pressure Injury in Acutely Ill Patients: A Prospective Randomized Controlled Trial. J. WOCN 2017, 44, 440–444. [Google Scholar] [CrossRef] [PubMed]
- Gunningberg, L.; Lindholm, C.; Clarlsson, M.; Sjoden, P.O. Effect of visco-elastic foam mattresses on the development of pressure ulcers in patients with hip fractures. J. Wound Care 2000, 9, 455–460. [Google Scholar] [CrossRef] [PubMed]
- Hamilton, S.; Collins, F. Reducing pressure ulcer incidence in a long-term setting. Br. J. Nurs. 2005, 7, 14. [Google Scholar]
- Serraes, B.; van Leen, M.; Schols, J.; van Hecke, A.; Verhaeghe, S.; Beeckman, D. Prevention of pressure ulcers with a static air support surface: A systematic review. Int. Wound J. 2018, 15, 333–343. [Google Scholar] [CrossRef] [PubMed]
- Morgan, A.B. Revisitingflexible polyurethane foam flammability in furniture and bedding in the United States. Fire Mater. 2020, 1–13. [Google Scholar] [CrossRef]
- McKenna, S.T.; Hull, T.R. The fire toxicity of polyurethane foams. Fire Sci. Rev. 2016, 5, 1. [Google Scholar] [CrossRef] [Green Version]
- Kramer, R.H.; Zammarano, M.; Linteris, G.T.; Gedde, U.W.; Gilman, J.W. Heat release and structural collapse of flexible polyurethane foam. Polym Degrad. Stab. 2010, 95, 1115–1122. [Google Scholar] [CrossRef]
- Pitts, W.M. Role of two stage pyrolysis in fire growth on flexible polyurethane foam slabs. Fire Mater. 2014, 38, 232–338. [Google Scholar] [CrossRef]
- Nazare, S.; Pitts, W.M.; Shields, J.; Knowlton, E.; De Leon, B.; Zammarano, M.; Davis, R. Assessing fire-blocking effectiveness of barrier fabrics in the cone calorimeter. J. Fire Sci. 2019, 37, 340–376. [Google Scholar] [CrossRef]
- Blais, M.; Carpenter, K. Flexible polyurethane foams: A comparative measurement of toxic vapors and other toxic emissions in controlled combustion environments of foams with and without fire retardants. Fire Technol. 2015, 51, 3–18. [Google Scholar] [CrossRef] [Green Version]
- Lopez-Cuesta, J.M. Flame Retardant Polymer Nanocomposites; Morgan, A.B., Wilkie, C.A., Eds.; John Wiley & Sons: Hoboken, NJ, USA, 2007; ISBN 978-0-471-73426-0. [Google Scholar]
- Wilkie, C.A.; Morgan, A.B. (Eds.) Fire Retardancy of Polymeric Materials, 2nd ed.; Taylor and Francis: Boca Raton, FL, USA, 2010; ISBN 978-1-4200-8399-6. [Google Scholar]
- Troitzsch, J.H. Fires, statistics, ignition sources, and passive fire protection measures. J. Fire Sci. 2016, 34, 171–198. [Google Scholar] [CrossRef]
- Weil, E.D.; Levchik, S.V. Flame Retardants for Plastics and Textiles: Practical Applications; Hanser: Cincinnati, OH, USA, 2009; ISBN 978-1-56990-454-1. [Google Scholar]
- Hirschler, M.M. Flame retardants and heat release: Review of traditional studies on products and on groups of polymers. Fire Mater. 2015, 39, 207–231. [Google Scholar] [CrossRef]
- Hirschler, M.M. Flame retardants and heat release: Review of data on individual polymers. Fire Mater. 2015, 39, 232–258. [Google Scholar] [CrossRef] [Green Version]
- U.S. EPA Design for the Environment. Flame Retardants Used in Flexible Polyurethane Foam: An Alternatives Assessment Update; United States Environmental Protection Agency: Washington, DC, USA, 2015. [Google Scholar]
- Horrocks, R.A. Textile flammability research since 1980—Personal challenges and partial solutions. Polym. Degrad. Stab. 2013, 98, 2813–2824. [Google Scholar] [CrossRef]
- Schartel, B.; Wilkie, C.A.; Camino, G. Recommendations on the scientific approach to polymer flame retardancy: Part 1–Scientific terms and methods. J. Fire Sci. 2016, 34, 447–467. [Google Scholar] [CrossRef]
- Levchik, S.V.; Weil, E.D. Thermal decomposition, combustion and fireretardancy of polyurethanes—A review of the recent literature. Polym. Int. 2004, 53, 1585–1610. [Google Scholar] [CrossRef]
- Hoffman, K.; Butt, C.M.; Chen, A.; Limkakeng, A.T.; Stapleton, H.M. High exposure to organophosphate flame retardant in infants: Associations with baby products. Environ. Sci. Technol. 2016, 49, 14554–14559. [Google Scholar] [CrossRef]
- Li, W.-L.; Ma, W.-L.; Jia, H.-L.; Hong, W.J.; Moon, H.B.; Nakata, H.; Minh, N.H.; Sinha, R.K.; Chi, K.H.; Kannan, K.; et al. Polybrominated diphenyl ethers (PBDEs) in surface soils across five Asian countries: Levels, spatial distribution, and source contribution. Envrion. Sci. Technol. 2016, 50, 12779–12788. [Google Scholar] [CrossRef]
- Li, T.-Y.; Zhou, J.-F.; Wu, C.-C.; Bao, L.-J.; Si, L.; Zeng, E.Y. Characteristics of polybrominated diphenyl ethers released from thermal treatment and open burning of e-waste. Envrion. Sci. Technol. 2018, 52, 4650–4657. [Google Scholar] [CrossRef]
- Available online: http://en.wikipedia.org/wiki/Restriction_of_Hazardous_Substances_Directive (accessed on 14 April 2020).
- Available online: http://eur-lex.europa.eu/legal-content/EN/TXT/?qid=1399998664957&uri=CELEX:02011L0065-20140129 (accessed on 14 April 2020).
- Available online: http://eur-lex.europa.eu/legal-content/EN/TXT/?uri=celex%3A32012L0019 (accessed on 14 April 2020).
- Available online: https://www.epa.gov/assessing-and-managing-chemicals-under-tsca/polybrominated-diphenyl-ethers-pbdes (accessed on 14 April 2020).
- Chattopadhyay, D.K.; Webster, D.C. Thermal stability and flame retardancy of polyurethanes. Prog. Polym. Sci. 2009, 34, 1068–1133. [Google Scholar] [CrossRef]
- Aircraft Materials Fire Test Handbook, Revision 3. DOT/FAA/TC17/55 July 2019. Appendix K. Available online: https://www.fire.tc.faa.gov/pdf/TC17-55.pdf (accessed on 14 April 2020).
- Lorenzetti, A.; Dittrich, B.; Schartel, B.; Roso, M. Expandable graphite in polyurethane foams: The effect of expansion volume and intercalants on flame retardancy. J. Appl. Polym. Sci. 2017, 134, 5173. [Google Scholar] [CrossRef]
- Gama, N.V.; Silva, R.; Mohseni, F.; Davarpanah, A.; Amaral, V.S.; Ferreira, A.; Barros-Timmons, A. Enhancement of physical and reaction to fire properties of crude glycerol polyurethane foams filled with expanded graphite. Polym. Test. 2018, 69, 199–207. [Google Scholar] [CrossRef]
- Cheng, J.-J.; Qu, W.-J.; Sun, S.-H. Mechanical Properties Improvement and Fire Hazard Reduction of Expandable Graphite Microencapsulated in Rigid Polyurethane Foams. Polym. Compos. 2019, 40, E1006–E1014. [Google Scholar] [CrossRef]
- Peng, T.; Liu, B.; Gao, X.; Luo, L.; Sun, H. Preparation, quantitative surface analysis, intercalation characteristics and industrial implications of low temperature expandable graphite. Appl. Surf. Sci. 2018, 444, 800–810. [Google Scholar] [CrossRef]
- Yang, H.; Wang, X.; Song, L.; Yu, B.; Yuan, Y.; Hu, Y.; Yuen, R.K.K. Aluminum hypophosphite in combination with expandable graphite as a novel flame retardant system for rigid polyurethane foams. Polym. Adv. Technol. 2014, 25, 1034–1043. [Google Scholar] [CrossRef]
- Duquesne, S.; Delobel, R.; le Bras, M.; Camino, G. A comparative study of the mechanism of action of ammonium polyphosphate and expandable graphite in polyurethane. Polym. Degrad. Stab. 2002, 77, 333–344. [Google Scholar] [CrossRef]
- Wang, S.; Qian, L.; Xin, F. The synergistic flame-retardant behaviors of pentaerythritol phosphate and expandable graphite in rigid polyurethane foams. Polym. Compos. 2018, 39, 329–336. [Google Scholar] [CrossRef]
- Zhou, R.; Ming, Z.; He, J.; Ding, Y.; Jiang, J. Effect of Magnesium Hydroxide and Aluminum Hydroxide on the Thermal Stability, Latent Heat and Flammability Properties of Paraffin/HDPE Phase Change Blends. Polymers 2020, 12, 180. [Google Scholar] [CrossRef] [Green Version]
- Peng, H.K.; Wang, X.; Li, T.T.; Lou, C.W.; Wang, Y.; Lin, J.H. Mechanical properties, thermal stability, sound absorption, and flame retardancy of rigid PU foam composites containing a fire-retarding agent: Effect of magnesium hydroxide and aluminium hydroxide. Polym. Adv. Technol. 2019, 30, 2045–2055. [Google Scholar] [CrossRef]
- Eugenia, M.M.; Adolfo, T.L.; Estrada, R.F. Characterization of Polyurethane Nanocomposites for Flame Retardant Applications. J. Chem. Chem. Eng. 2018, 12, 60–73. [Google Scholar] [CrossRef]
- Pavlicevic, J. The influence of ZnO nanoparticles on thermal and mechanical behavior of polycarbonate-based polyurethane composites. Compos. Part. B Eng. 2014, 60, 673–679. [Google Scholar] [CrossRef]
- Akkoyun, M.; Suvaci, E. Effects of TiO2, ZnO, and Fe3O4 nanofillers on rheological behavior, microstructure, and reaction kinetics of rigid polyurethane foams. J. Appl. Polym. Sci. 2016. [Google Scholar] [CrossRef]
- Zieleniewska, M.; Ryszkowska, J.; Bryśkiewicz, A.; Auguścik, M.; Szczepkowski, L.; Świderski, A.; Wrześniewska-Tosik, K. The structure and properties of viscoelastic polyurethane foams with Fyrol and keratin fibres. Polimery 2017, 62, 127–135. [Google Scholar] [CrossRef]
- Bhattaryya, D.; Subasinghe, A.; Kim, N.K. Multifunctional of Polymer Composites. In Their Composites and Flammability Characterizations; Chapter 4—Natural fibres; William Andrew: Norwich, NY, USA, 2015; pp. 102–143. [Google Scholar] [CrossRef]
- Martinez-Hernanadez, A.L.; Velasco-Santos, C. Keratin: Structure, Properties and Applications; Dullaart, R., Mousquès, J., Eds.; Nova Science Publishers, Inc.: Hauppauge, NY, USA, 2012; pp. 149–211. ISBN 978-1-62100-336-6. [Google Scholar]
- Wrześniewska-Tosik, K.; Zajchowski, S.; Bryśkiewicz, A.; Ryszkowska, J. Feathers as a Flame-Retardant in Elastic Polyurethane Foam. Fibres Text. East. Eur. 2014, 103, 119–123. [Google Scholar]
- Brebu, M.; Spiridon, J. Thermal degradation of keratin waste. J. Anal. Appl. Pyrolysis 2011, 91, 288–295. [Google Scholar] [CrossRef]
- Senoz, E.; Wool, R.P.; McChalicher, C.W.J.; Hong, C.K. Physical and chemical changes in feather keratin during pyrolysis. Polym. Degrad. Stab. 2012, 97, 297–307. [Google Scholar] [CrossRef]
- Aluigi, A.; Vineis, C.; Varesano, A.; Mazzuchetti, G.; Ferrero, F.; Tonin, C. Structure and properties of keratin/PEO blend nanofibres. Eur. Polym. J. 2008, 44, 2465. [Google Scholar] [CrossRef]
- Prochoń, M.; Przepiórkowska, A. Innovative application of biopolymer keratin as a filler of synthetic acrylonitrile-butadiene rubber NBR. J. Chem. 2013, 2013, 1–8. [Google Scholar] [CrossRef]
- Prochoń, M.; Przepiórkowska, A.; Zaborski, M. Keratin as a filler for carboxylated acrylonitrile-butadiene rubber XNBR. J. Appl. Polym. Sci. 2007, 106, 3674–3687. [Google Scholar] [CrossRef]
- Martínez-Hernández, A.L.; Velasco-Santos, C.; de Icaza, M.; Castaño, V.M. Mechanical properties evaluation of new composites with protein biofibres reinforcing poly (methyl methacrylate). Polymer 2005, 46, 8233–8238. [Google Scholar] [CrossRef]
- Barth, A. Infrared spectroscopy of proteins. Biochim. Bio-Phys. Acta 2007, 1767, 1073–1101. [Google Scholar] [CrossRef] [Green Version]
- Panayiotou, H. Vibrational Spectroscopy of Keratin Fibres: A Forensic Approach. Ph.D. Thesis, Queensland University of Technology, Brisbane, Australia, 2004. [Google Scholar]
- Gao, Y.; Xu, S.; Yue, Q.; Ortaboy, S.; Gao, B.; Sun, Y. Synthesis and characterization of heteroatom-enriched biochar from keratin-based and algous-based wastes. Adv. Powder Technol. 2016, 27, 1280–1286. [Google Scholar] [CrossRef]
- Fagbemi, O.D.; Sithole, B.; Tesfaye, T. Optimization of keratin protein extraction from waste chicken feathers using hybrid pre-treatment techniques. Sustain. Chem. Pharm. 2020, 17, 100267. [Google Scholar] [CrossRef]
- Hatchett, D.W.; Kinyanju, J.M.; Sapochak, L. FTIR Analysis of Chemical Gradients in Thermally Processed Molded Polyurethane Foam. J. Cell. Plast. 2007, 43, 183. [Google Scholar] [CrossRef]
- Zieleniewska, M.; Szczepkowski, L.; Krzyżowska, M.; Leszczyński, M.K.; Ryszkowska, J. Rigid polyurethane foam composites with vegetable filler for application in the cosmetics industry. Polimery 2016, 61, 807–814. [Google Scholar] [CrossRef]
- Członka, S.; Sienkiewicz, N.; Strąkowska, A.; Strzelec, K. Keratin feathers as a filler for rigid polyurethane foams on the basis of soybean oil polyol. Polym. Test. 2008, 72, 32–45. [Google Scholar] [CrossRef]
- Ryszkowska, J.L.; Auguścik, M.; Sheikh, A.; Boccaccini, A.R. Biodegradable polyurethane composite scaffolds containing Bioglass® for bone tissue engineering. Compos. Sci. Technol. 2010, 70, 1894–1908. [Google Scholar] [CrossRef] [Green Version]
- Tien, Y.I.; Wei, K.H. Hydrogen bonding and mechanical properties in segmented montmorillonite/polyurethane nanocomposites of different hard segment ratios. Polymer 2001, 42, 3213–3221. [Google Scholar] [CrossRef]
- Ionescu, M. Chemistry and Technology of Polyols for Polyurethanes; Rapra Technology Ltd.: Shawbury, UK, 2008. [Google Scholar]
- Wirpsza, Z.; Horwood, E. Polyurethanes: Chemistry, Technology, and Applications. In Ellis Horwood Series in Polymer Science and Technology; Kemp, T.J., Ed.; Kemp, T.J., Translator; Ellis Horwood Limited: New York, NY, USA, 1993. [Google Scholar]
- Thirumal, M.; Khastgir, D.; Singha, N.K.; Manjunath, B.S.; Naik, Y.P. Effect of expandable graphite on the properties of intumescent flame retardant polyurethane foam. J. Appl. Polym. Sci. 2008, 110, 2586–2594. [Google Scholar] [CrossRef]
- Hu, X.M.; Wang, D.M. Enhanced fire behavior of rigid polyurethane foam by intumescent flame retardants. J. Appl. Polym. Sci. 2013, 129, 238–246. [Google Scholar] [CrossRef]
- Bassi, M.; Tonelli, C.; di Meo, A. Glass Transition Behavior of a Microphase Segregated Polyurethane Based on PFPE and IPDI. A Calorimetric Study. Macromolecules 2003, 36, 8015–8023. [Google Scholar] [CrossRef]
- Chen, T.K.; Chui, J.Y.; Shieh, T.S. Glass Transition Behaviors of a Polyurethane Hard Segment based on 4,4′-Diisocyanatodiphenylmethane and 1,4-Butanediol and the Calculation of Microdomain Composition. Macromolecules 1997, 30, 5068–5074. [Google Scholar] [CrossRef]
- Raftopoulos, K.N.; Jancia, M.; Aravopoulou, D.; Hebda, E.; Pielichowski, K.; Pissis, P. POSS along the Hard Segments of Polyurethane. Phase Separation and Molecular Dynamics. Macromolecules 2013, 46, 7378–7386. [Google Scholar] [CrossRef]
- Günther, M.; Levchik, S.V.; Schartel, B. Bubbles and collapses: Fire phenomena of flame-retarded flexible polyurethane foams. Polym. Adv. Technol. 2020, 31, 2185–2198. [Google Scholar] [CrossRef]
- Sui, H.; Ju, X.; Liu, X.; Cheng, K.; Luo, Y.; Zhong, F. Primary thermal degradation effects on the polyurethane film. Polym. Degrad. Stab. 2014, 101, 109–113. [Google Scholar] [CrossRef]
- Liu, A.; Walther, A.; Ikkala, O.; Belova, L.; Berglund, L.A. Clay nanopaper with tough cellulose nanofiber matrix for fire retardancy and gas barrier functions. Biomacromolecules 2011, 12, 633–641. [Google Scholar] [CrossRef]
- Lu, H.; Liang, F.; Gou, J. Nanopaper Enabled Shape-Memory Nanocomposite with Vertically Aligned Nickel Nanostrand: Controlled Synthesis and Electrical Actuation. Soft Matter 2011, 7, 7416–7423. [Google Scholar] [CrossRef]
- Schartel, B.; Wilkie, C.A.; Camino, G. Recommendations on the scientific approach to polymer flame retardancy: Part 2—Concepts. J. Fire Sci. 2016, 35, 3–20. [Google Scholar] [CrossRef]
- Hilyard, N.C. Mechanics of Cellular Plastics. Appl. Sci. Publ. Ltd. 1982, 3, 10. [Google Scholar]
- Singh, H.; Jain, A.K. Ignition Combustion, Toxicity, and Fire Retardancy of Polyurethane Foams: A Comprehensive Review. J. Appl. Polym. Sci. 2009, 111, 1115–1143. [Google Scholar] [CrossRef]
- Wada, H.; Toyota, Y.; Horie, A.; Sasaki, T.; Suzuli, C.; Fukuda, H. Automotive Seating Foams with Excellent Riding Comfort Prepared by a Novel Polypropylene Glycol. Polym. J. 2008, 40, 842–845. [Google Scholar] [CrossRef]


| Sample VEPUR | Addition | Amount of Additive % mas/Parts per Hundred Parts of Polyol | Component Composition of Foams, wt% | ||
|---|---|---|---|---|---|
| Component A | Component B | Sum of Additives | |||
| VE * | - | - | 69 | 31 | - |
| VE + 10 K | K | 10 | 64 | 29 | 6 |
| VE +10 K +5 F | K | 10 | 62 | 29 | 9 |
| F | 5 | - | - | - | |
| VE +10 K +10 ATH | K | 10 | 60 | 28 | 12 |
| ATH | 10 | - | - | - | |
| VE +10 K+ 10 ATH + 5 F | K | 10 | 58 | 27 | 15 |
| ATH | 10 | - | - | - | |
| F | 5 | - | - | - | |
| VE +10 K +10 MTH | K | 10 | 60 | 28 | 12 |
| MTH | 10 | - | - | - | |
| VE +10 K +10 MTH + 5 F | CF | 10 | 58 | 27 | 15 |
| MTH | 10 | - | - | - | |
| F | 5 | - | - | - | |
| VE +10 K +10 ZO | K | 10 | 60 | 28 | 12 |
| ZO | 10 | - | - | - | |
| VE +10 K +10 ZO +5 F | K | 10 | 58 | 27 | 15 |
| ZO | 10 | - | - | - | |
| F | 5 | - | - | - | |
| VE +10 K +10 EG | K | 10 | 60 | 28 | 12 |
| EG | 10 | - | - | - | |
| VE +10 K +10 EG +5 F | K | 10 | 58 | 27 | 15 |
| EG | 10 | - | - | - | |
| F | 5 | - | - | - | |
| VE +10 K +10 APP | K | 10 | 60 | 28 | 12 |
| APP | 10 | - | - | - | |
| VE +10 K +10 APP +5 F | K | 10 | 58 | 27 | 15 |
| APP | 10 | - | - | - | |
| F | 5 | - | - | - | |
| Wavenumber, cm−1 | Band Description |
|---|---|
| 3281 | Amide A—ν(NH) the 𝛽 or extended polypeptide chain |
| 3071 | Amide B—ν𝑎(NH) the 𝛽 or extended polypeptide chain |
| 2928 | Asymmetric CH3—ν(CH3) bands of aliphatic hydrocarbons |
| 2853 | Symmetric CH2—ν (CH2) bands of aliphatic hydrocarbons |
| 1643 | Amide I—δ(N-H) bending vibration (of primary amines) of protein molecules |
| 1528 | Amide II—δ(N-H) bending vibration (of secondary amines) of protein molecules |
| 1204 | Amide III—the valency vibration of δ(-COO) groups |
| 500–670 | ν(C-S) and ν(S-S) stretching vibration of sulfur from cysteine of keratin protein |
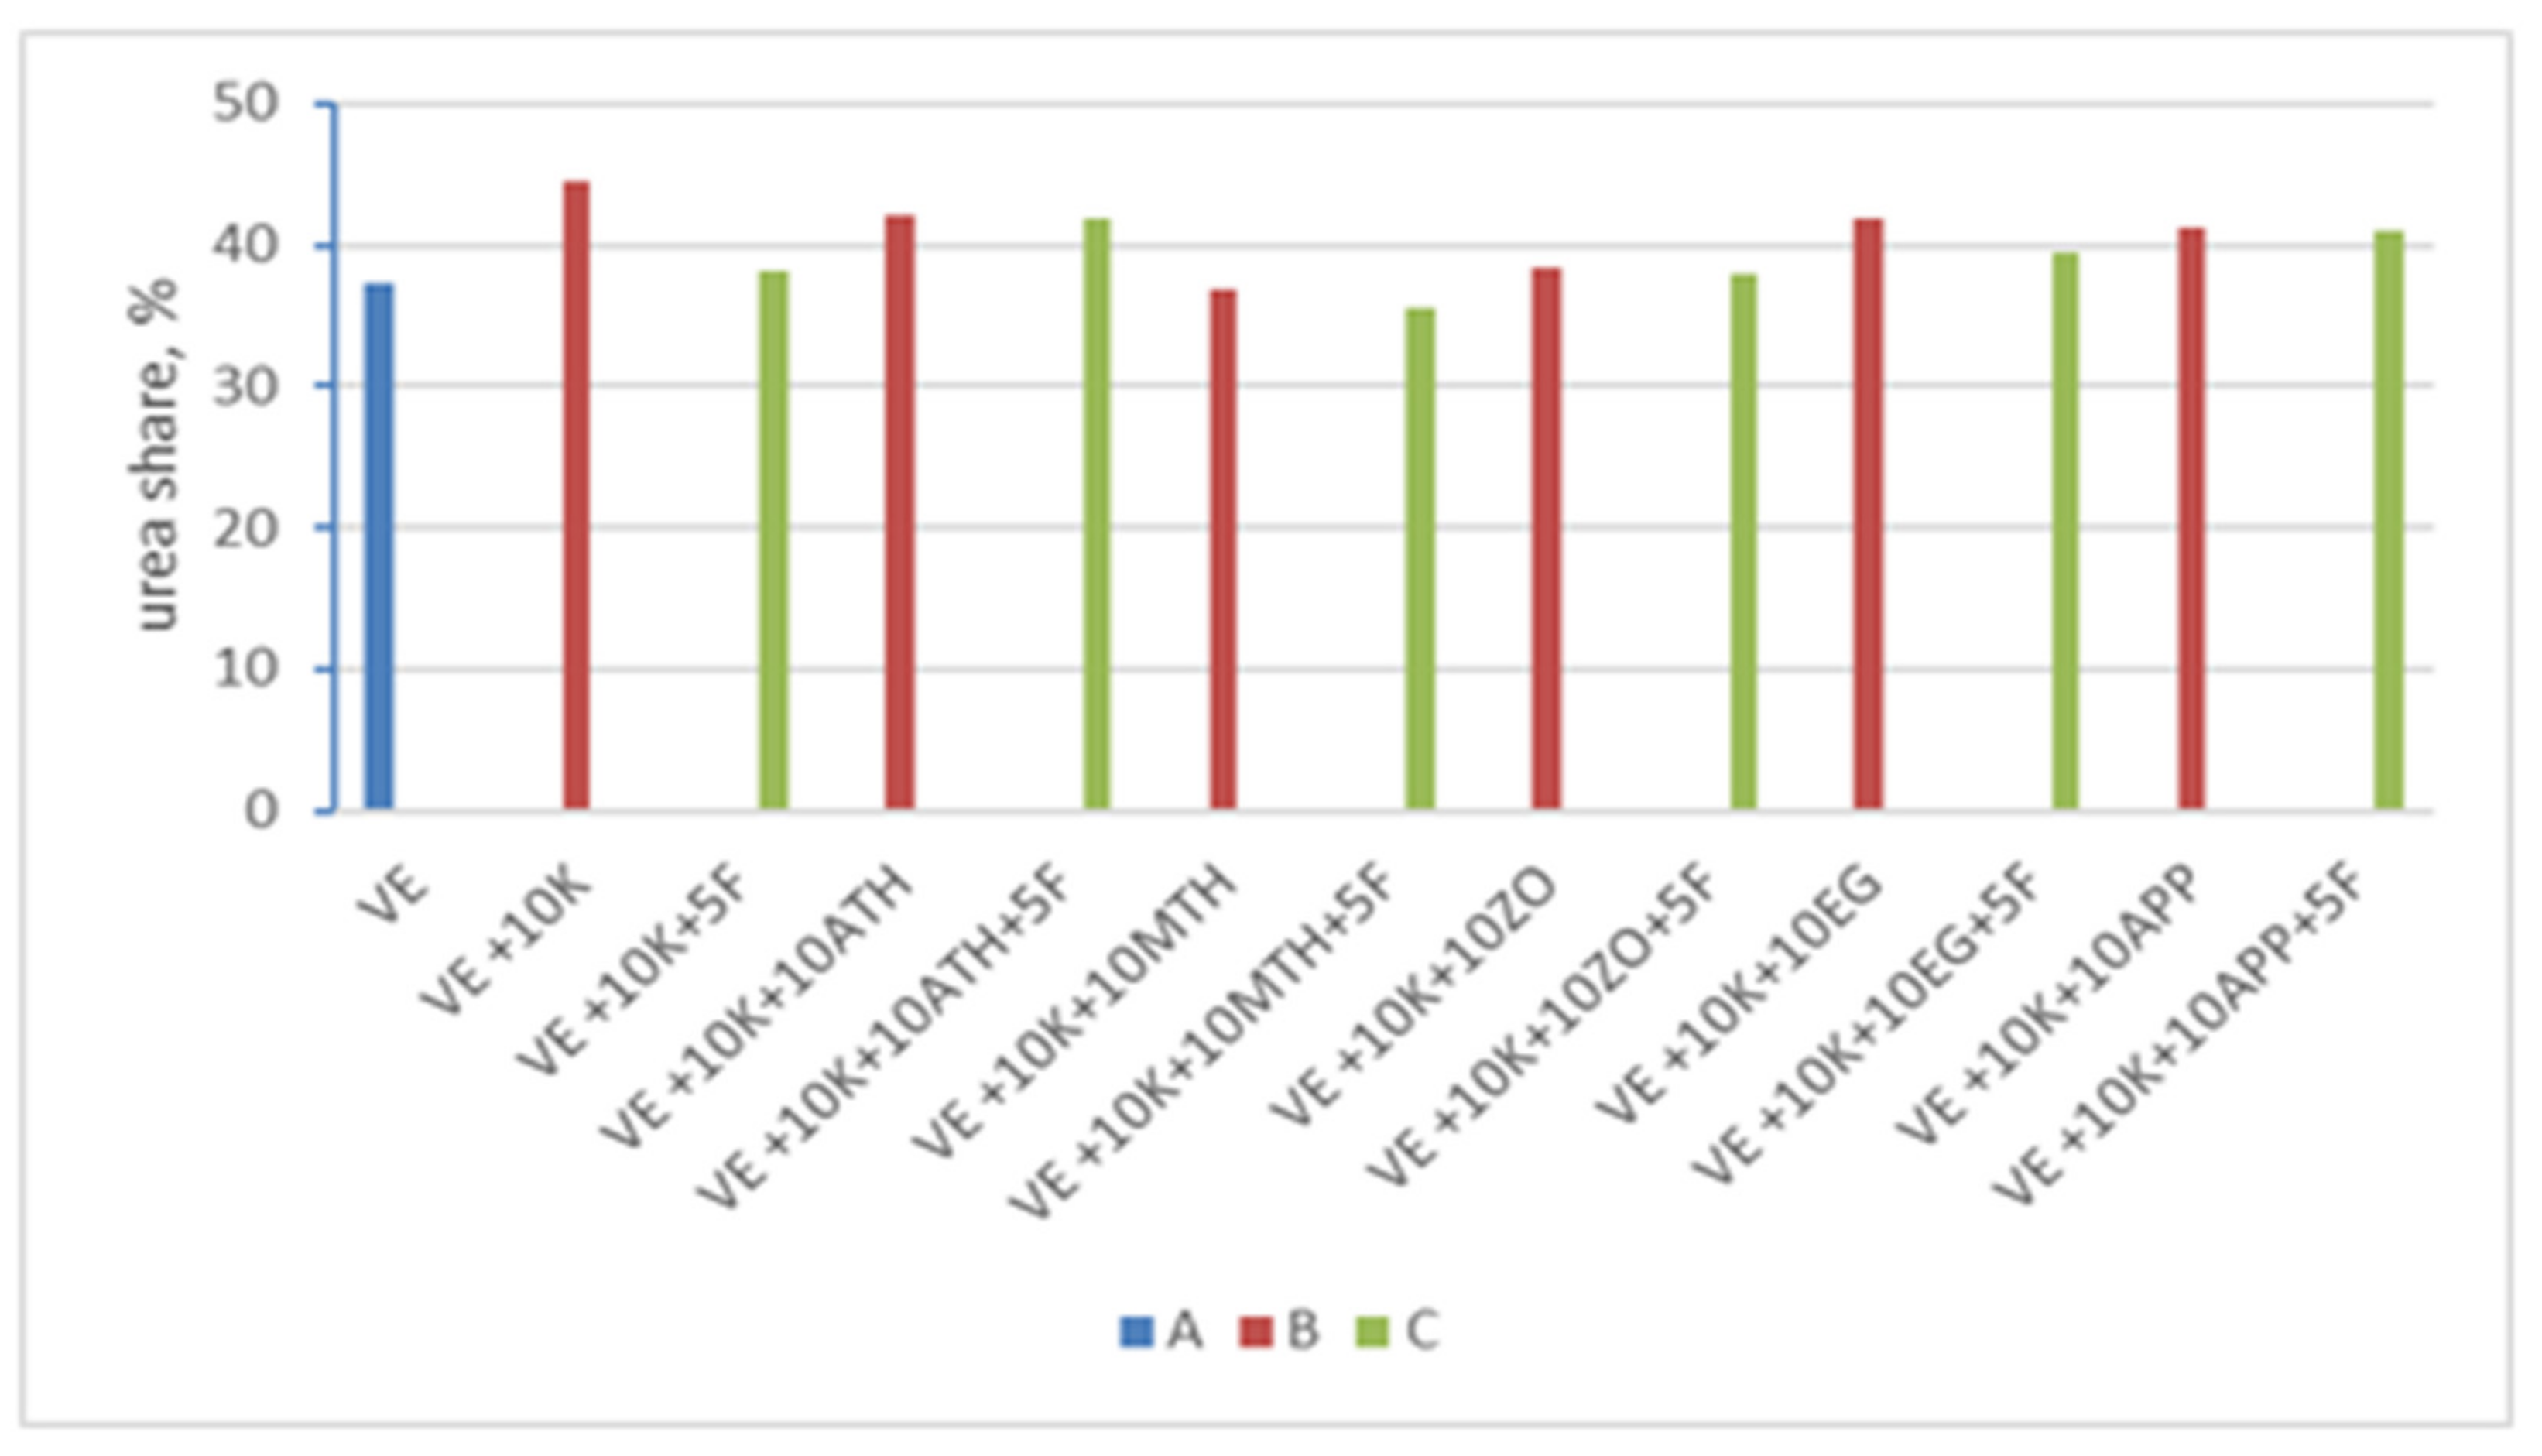
| VEPUR Foams | Urea Share, % | R | DPS |
|---|---|---|---|
| VE | 37.3 | 1.25 | 0.55 |
| VE + 10 K | 44.6 | 1.40 | 0.58 |
| VE + 10 K + 5 F | 38.2 | 1.24 | 0.55 |
| VE + 10 K + 10 ATH | 42.1 | 1.39 | 0.58 |
| VE + 10 K + 10 ATH + 5 F | 41.9 | 1.33 | 0.57 |
| VE + 10 K + 10 MTH | 36.9 | 1.40 | 0.58 |
| VE + 10 K + 10 MTH + 5 F | 35.5 | 1.25 | 0.56 |
| VE + 10 K + 10 ZO | 38.5 | 1.35 | 0.57 |
| VE + 10 K + 10 ZO + 5 F | 38.0 | 1.20 | 0.55 |
| VE + 10 K + 10 EG | 41.8 | 1.39 | 0.58 |
| VE + 10 K + 10 EG + 5 F | 39.5 | 1.32 | 0.57 |
| VE + 10 K + 10 APP | 41.3 | 1.39 | 0.58 |
| VE + 10 K + 10 APP + 5 F | 41. 0 | 1.25 | 0.56 |
| VEPUR | Apparent Density a, kg/m3 | Tgs1, °C | Δcp *, J/g°C | Tt, °C | ΔHt, J/g | Tgs2, °C |
|---|---|---|---|---|---|---|
| VE | 55.5 (0.8) | −58.6 | 0.37 | 18.8 | 68.2 | −59.2 |
| VE + 10 K | 61.5 (1.8) | −60.0 | 0.49 | 19.1 | 80.1 | −60.4 |
| VE + 10 K + 5 F | 69.3 (1.2) | −60.2 | 0.32 | 20.6 | 81.6 | −60.5 |
| VE + 10 K + 10 ATH | 73.6 (1.2) | −59.9 | 0.44 | 17.4 | 75.2 | −60.7 |
| VE + 10 K + 10 ATH + 5 F | 80.2 (1.7) | −60.1 | 0.28 | 17.6 | 79.2 | −60.2 |
| VE + 10 K + 10 MTH | 83.5 (2.2) | −60.0 | 0.54 | 17.4 | 77.7 | −60.3 |
| VE + 10 K + 10 MTH + 5 F | 95.1 (4.1) | −60.2 | 0.31 | 17.5 | 76.9 | −60.2 |
| VE + 10 K + 10 ZO | 82.4 (4.3) | −60.2 | 1.34 | 32.7 | 76.5 | −60.8 |
| VE + 10 K + 10 ZO + 5 F | 83.8 (1.5) | −60.5 | 1.24 | 27.2 | 78.2 | −61.2 |
| VE + 10 K + 10 EG | 71.3 (1.8) | −60.7 | 1.43 | 28.1 | 76.7 | −60.8 |
| VE + 10 K+10 EG+5 F | 79.0 (2.4) | −60.9 | 1.29 | 34.3 | 81.8 | −61.1 |
| VE + 10 K+10 APP | 88.0 (1.8) | −60.7 | 1.56 | 29.1 | 76.3 | −61.0 |
| VE + 10 K+10 APP+5 F | 87.6 (2.3) | −61.0 | 1.44 | 34.0 | 82.2 | −61.0 |
| VEPUR | Tn5%, C | mn1, g | mn2, g | mn3, g | Rn900, % | Tn1, °C | Vn1, %/°C | Tn2, °C | Vn2, %/°C | Tn3, °C | Vn3, %/°C |
|---|---|---|---|---|---|---|---|---|---|---|---|
| VE | 252 | 7.5 | 11.4 | 68.4 | 0.3 | 256 | 0.15 | 292 | 0.36 | 368 | 1.55 |
| VE + 10 K | 249 | 7.3 | 16.0 | 63.3 | 4.3 | 256 | 0.14 | 302 | 0.31 | 377 | 1.91 |
| VE + 10 K + 5 F | 236 | 9.5 | 9.5 | 56.5 | 9.2 | 256 | 0.16 | 303 | 0.31 | 381 | 1.38 |
| VE + 10 K + 10 ATH | 248 | 7.0 | 18.1 | 56.2 | 11.3 | 256 | 0.14 | 297 | 0.43 | 375 | 1.60 |
| VE + 10 K + 10 ATH + 5 F | 236 | 9.4 | 16.5 | 53.8 | 12.6 | 257 | 0.19 | 292 | 0.46 | 379 | 1.24 |
| VE + 10 K + 10 MTH | 254 | 6.2 | 15.3 | 57.4 | 12.1 | 256 | 0.13 | 300 | 0.30 | 381 | 1.59 |
| VE + 10 K + 10 MTH + 5 F | 241 | 9.0 | 14.0 | 55.2 | 13.8 | 261 | 0.15 | 306 | 0.26 | 388 | 1.36 |
| VE + 10 K + 10 ZO | 252 | 7.3 | 13.9 | 54.7 | 14.3 | 257 | 0.14 | 298 | 0.29 | 380 | 1.68 |
| VE + 10 K + 10 ZO + 5 F | 240 | 9.1 | 12.5 | 53.6 | 14.7 | 258 | 0.15 | 306 | 0.24 | 388 | 1.35 |
| VE + 10 K + 10 EG | 245 | nd | 22.5 | 53.8 | 10.6 | nd | nd | 285 | 0.33 | 372 | 1.51 |
| VE + 10 K + 10 EG + 5 F | 228 | nd | 20.4 | 50.8 | 14.0 | nd | nd | 286 | 0.30 | 375 | 1.21 |
| VE + 10 K + 10 APP | 249 | 7.4 | 15.4 | 49.8 | 14.9 | 256 | 0.16 | 299 | 0.36 | 352 | 3.03 |
| VE + 10 K + 10 APP + 5 F | 233 | 10.2 | 13.2 | 47.7 | 16.6 | 256 | 0.17 | 295 | 0.32 | 352 | 2.95 |
| VEPUR | Ta5%, °C | ma1, % | ma2, % | ma3, % | Ra900, % | Ta1, °C | Va1, %/°C | Ta2, °C | Va2, %/°C | Ta3, °C | Va3, %/°C | Ta4, °C | Va4, %/°C |
|---|---|---|---|---|---|---|---|---|---|---|---|---|---|
| VE | 246 | 7.1 | 70.1 | nd | 0.6 | 248 | 0.21 | 316 | 2.53 | nd | nd | nd | nd |
| VE + 10 K | 242 | 8.3 | 34.9 | 32.2 | 0.8 | 248 | 0.24 | 318 | 0.69 | 382 | 0.72 | 514 | 0.42 |
| VE + 10 K + 5 F | 228 | 10.0 | 34.4 | 25.2 | 1.1 | 245 | 0.25 | 316 | 0.69 | 363 | 0.57 | 503 | 0.28 |
| VE + 10 K + 10 ATH | 242 | 9.8 | 42.6 | 17.1 | 8.0 | 248 | 0.24 | 298 | 0.59 | 346 | 0.54 | 507 | 0.21 |
| VE + 10 K + 10 ATH + 5 F | 231 | 10.6 | 39.8 | 15.5 | 8.5 | 246 | 0.31 | 291 | 0.57 | 318 | 0.58 | 509 | 0.22 |
| VE + 10 K + 10 MTH | 245 | 7.5 | 40.8 | 19.8 | 8.6 | 250 | 0.22 | 307 | 0.69 | 361 | 0.51 | 497 | 0.19 |
| VE + 10 K + 10 MTH + 5 F | 235 | 10.4 | 33.5 | 23.6 | 8.9 | 248 | 0.25 | 323 | 0.68 | 365 | 0.66 | 514 | 0.20 |
| VE + 10 K + 10 ZO | 245 | 8.2 | 41.9 | 14.5 | 12.1 | 250 | 0.24 | 308 | 0.67 | 355 | 0.55 | 491 | 0.23 |
| VE + 10 K + 10 ZO + 5 F | 236 | 10.5 | 34.0 | 18.7 | 12.1 | 248 | 0.28 | 323 | 0.63 | 356 | 0.59 | 511 | 0.22 |
| VE + 10 K + 10 EG | 239 | 13.8 | 50.9 | nd | 1.5 | 250 | 0.45 | 294 | 1.25 | nd | nd | 517 | 0.22 |
| VE + 10 K + 10 EG + 5 F | 224 | 13.3 | 48.7 | nd | 2.0 | 247 | 0.42 | 291 | 1.13 | nd | nd | 518 | 0.20 |
| VE + 10 K + 10 APP | 242 | 7.8 | 12.2 | 40.9 | 7.8 | 246 | 0.25 | 280 | 0.39 | 328 | 1.19 | 486 | 0.13 |
| VE + 10 K + 10 APP + 5 F | 229 | 9.7 | 11.7 | 40.2 | 7.5 | 250 | 0.23 | 280 | 0.38 | 333 | 1.07 | 488 | 0.13 |
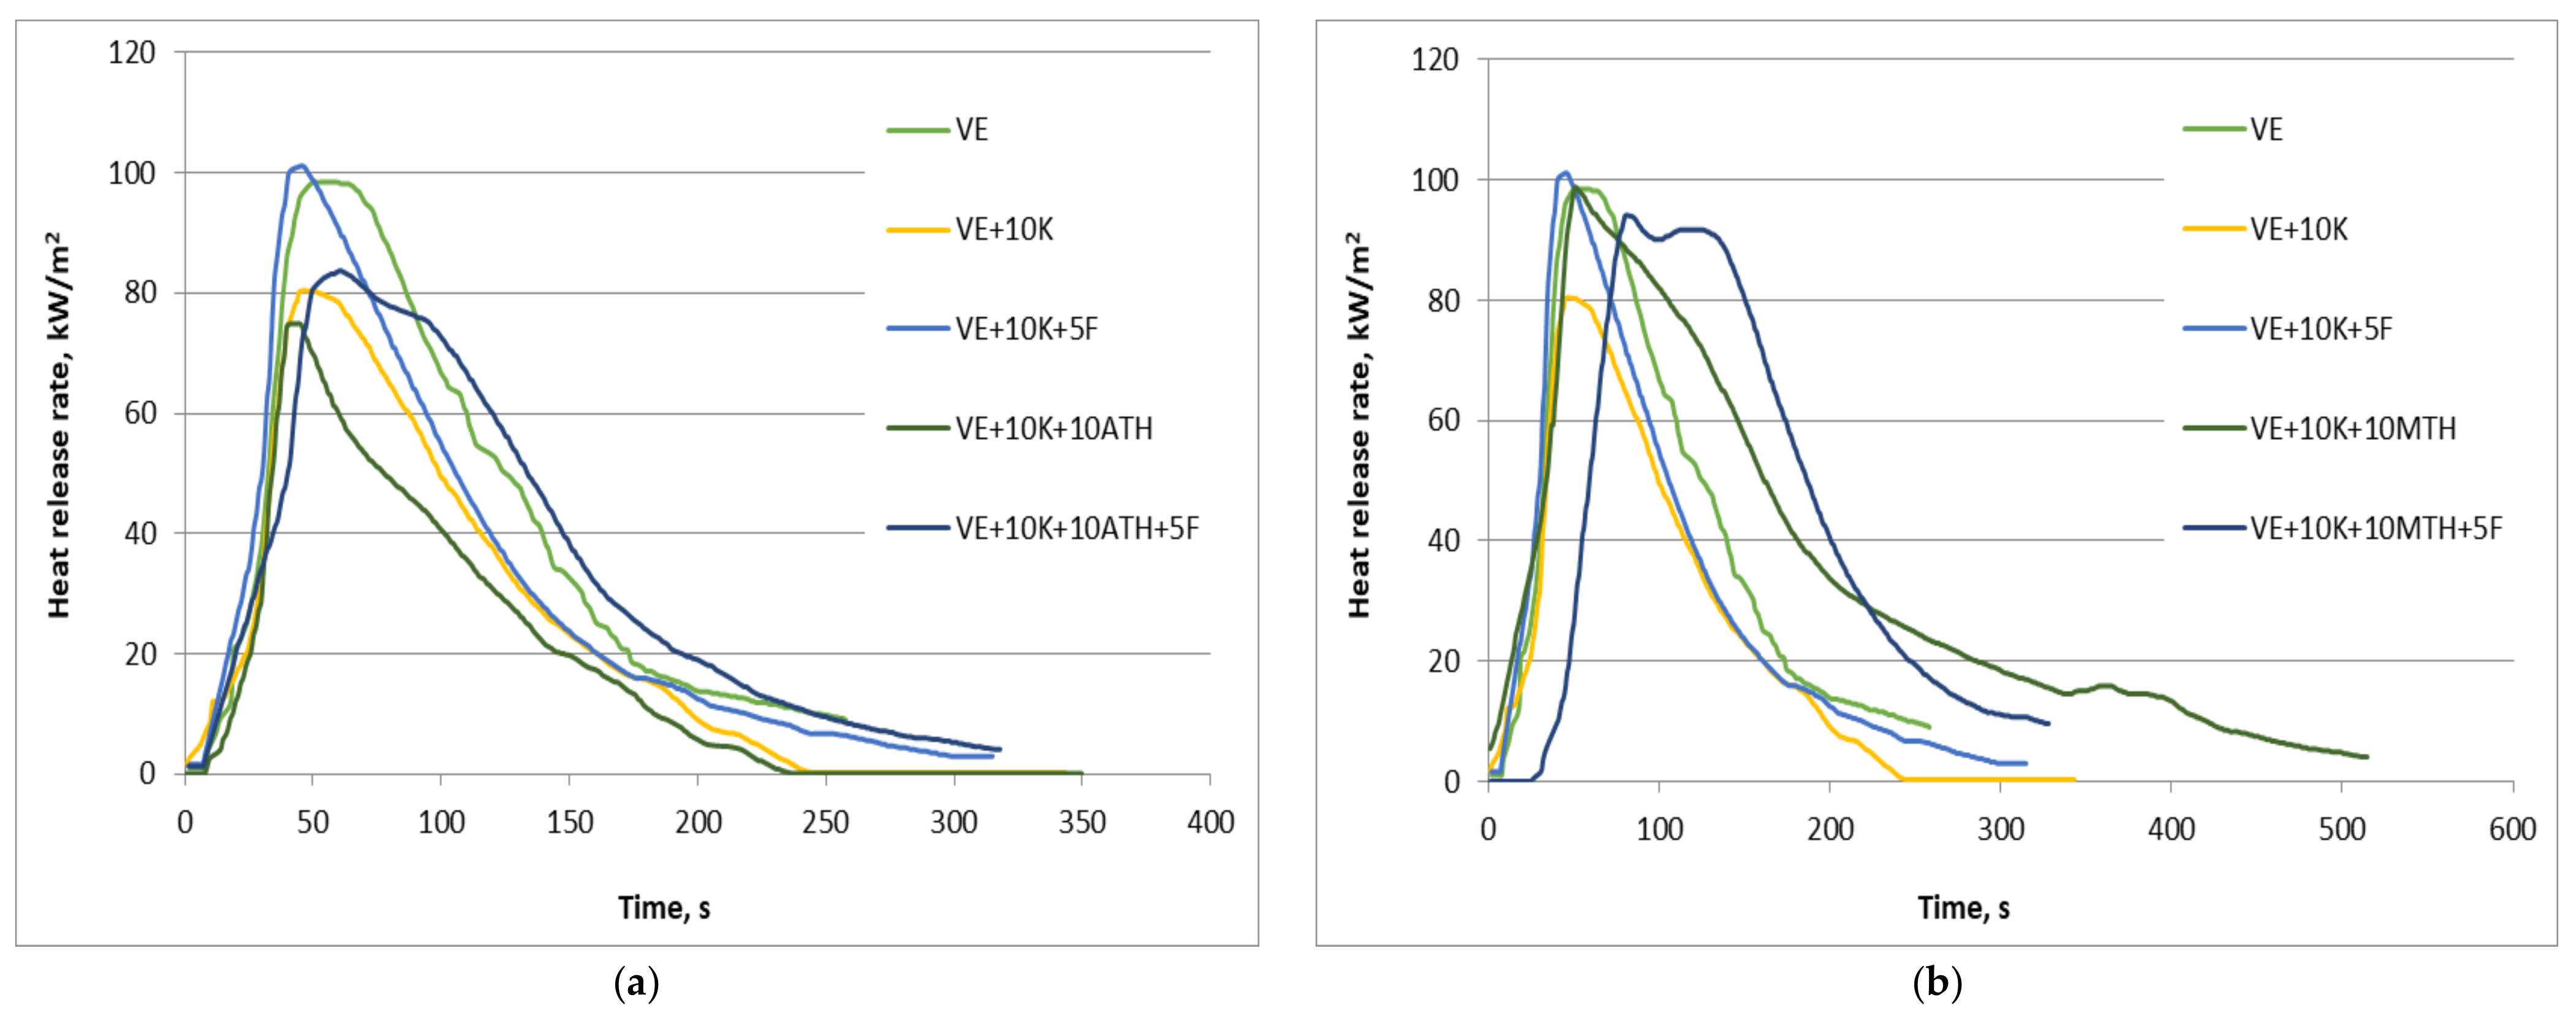
| Sample | av-HRR, kW/m2 | pHRR, kW/m2 | pHRR/tPHRR, kW/m2s1 | THR, MJ/m2 | PML, % |
|---|---|---|---|---|---|
| VE | 75 (5) | 104 (8) | 1.9 (0) | 7.9 (0) | 94.5 (0) |
| VE + 10 K | 40 (6) | 81 (1) | 1.7 (0) | 7.0 (1) | 94.2 (4) |
| VE + 10 K + 5 F | 58 (14) | 106 (7) | 1.7 (1) | 10.0 (1) | 89.3 (1) |
| VE + 10 K + 10 ATH | 36 (11) | 94 (27) | 1.4 (0) | 9.0 (4) | 87.7 (4) |
| VE + 10 K + 10 ATH + 5 F | 50 (3) | 87 (4) | 1.4 (0) | 8.4 (2) | 83.4 (1) |
| VE + 10 K + 10 MTH | 50 (10) | 101 (3) | 2.0 (0) | 14.3 (3) | 88.6 (3) |
| VE + 10 K + 10 MTH + 5 F | 60 (12) | 101 (10) | 1.4 (0) | 12.9 (0) | 83.8 (1) |
| VE + 10 K + 10 ZO | 71 (12) | 110 (10) | 1.5 (0) | 12.1 (1) | 83.5 (1) |
| VE + 10 K + 10 ZO + 5 F | 92 (41) | 156 (36) | 2.0 (1) | 11.1 (1) | 80.8 (1) |
| VE + 10 K + 10 EG | 19 (4) | 31 (2) | 0.7 (1) | 4.0 (0) | 67.3 (12) |
| VE + 10 K + 10 EG + 5 F | 24 (3) | 30 (6) | 0.3 (0) | 4.5 (1) | 58.4 (3) |
| VE + 10 K + 10 APP | 55 (11) | 92 (13) | 1.3 (0) | 10.9 (3) | 81.0 (0) |
| VE + 10 K + 10 APP + 5 F | 66 (17) | 107 (13) | 1.9 (0) | 9.2 (0) | 79.2 (3) |
| VEPUR | CLD 40. kPa | SAG | Compression by 90% | Compression by 75% | Compression by 50% |
|---|---|---|---|---|---|
| The Compression set. % | |||||
| VE | 4.9 (0.3) | 2.9 (0.2) | 14 (3) | 10 (3) | 10 (3) |
| VE + 10 K | 3.1 (0.2) | 4.8 (0.4) | 25 (9) | 16 (5) | 17 (3) |
| VE + 10 K + 5 F | 2.8 (0.3) | 6.6 (0.5) | 24 (8) | 18 (4) | 17 (4) |
| VE + 10 K + 10 ATH | 3.9 (0.3) | 5.3 (0.5) | 57 (11) | 23 (6) | 16 (3) |
| VE + 10 K + 10 ATH + 5 F | 3.1 (0.2) | 6.5 (0.5) | 39 (4) | 22 (5) | 20 (4) |
| VE + 10 K + 10 MTH | 4.5 (0.3) | 8.9 (0.7) | 55 (9) | 33 (6) | 27 (4) |
| VE + 10 K + 10 MTH + 5 F | 3.4 (0.3) | 8.2 (0.8) | 51 (8) | 24 (3) | 20 (3) |
| VE + 10 K + 10 ZO | 4.2 (0.4) | 7.5 (0.6) | 62 (12) | 45 (3) | 24 (4) |
| VE + 10 K + 10 ZO + 5 F | 3.1 (0.2) | 7.8 (0.6) | 43 (5) | 48 (4) | 25 (3) |
| VE + 10 K + 10 EG | 3.8 (0.3) | 6.7 (0.5) | 59 (6) | 56 (9) | 20 (3) |
| VE + 10 K + 10 EG + 5 F | 3.0 (0.3) | 8.7 (0.7) | 54 (5) | 33 (5) | 26 (5) |
| VE + 10 K + 10 APP | 5.6 (0.4) | 6.2 (0.5) | 37 (4) | 22 (3) | 17 (3) |
| VE + 10 K + 10 APP+5 F | 3.9 (0.4) | 7.3 (0.5) | 50 (7) | 34 (5) | 25 (5) |
Publisher’s Note: MDPI stays neutral with regard to jurisdictional claims in published maps and institutional affiliations. |
© 2021 by the authors. Licensee MDPI, Basel, Switzerland. This article is an open access article distributed under the terms and conditions of the Creative Commons Attribution (CC BY) license (https://creativecommons.org/licenses/by/4.0/).
Share and Cite
Wrześniewska-Tosik, K.; Ryszkowska, J.; Mik, T.; Wesołowska, E.; Kowalewski, T.; Pałczyńska, M.; Walisiak, D.; Auguścik Królikowska, M.; Leszczyńska, M.; Niezgoda, K.; et al. Viscoelastic Polyurethane Foam with Keratin and Flame-Retardant Additives. Polymers 2021, 13, 1380. https://doi.org/10.3390/polym13091380
Wrześniewska-Tosik K, Ryszkowska J, Mik T, Wesołowska E, Kowalewski T, Pałczyńska M, Walisiak D, Auguścik Królikowska M, Leszczyńska M, Niezgoda K, et al. Viscoelastic Polyurethane Foam with Keratin and Flame-Retardant Additives. Polymers. 2021; 13(9):1380. https://doi.org/10.3390/polym13091380
Chicago/Turabian StyleWrześniewska-Tosik, Krystyna, Joanna Ryszkowska, Tomasz Mik, Ewa Wesołowska, Tomasz Kowalewski, Michalina Pałczyńska, Damian Walisiak, Monika Auguścik Królikowska, Milena Leszczyńska, Krzysztof Niezgoda, and et al. 2021. "Viscoelastic Polyurethane Foam with Keratin and Flame-Retardant Additives" Polymers 13, no. 9: 1380. https://doi.org/10.3390/polym13091380