
Electromagnetic Wave-Absorbing and Bending Properties of Three-Dimensional Honeycomb Woven Composites


Abstract
:
1. Introduction
2. Materials and Methods
2.1. Materials and Equipment
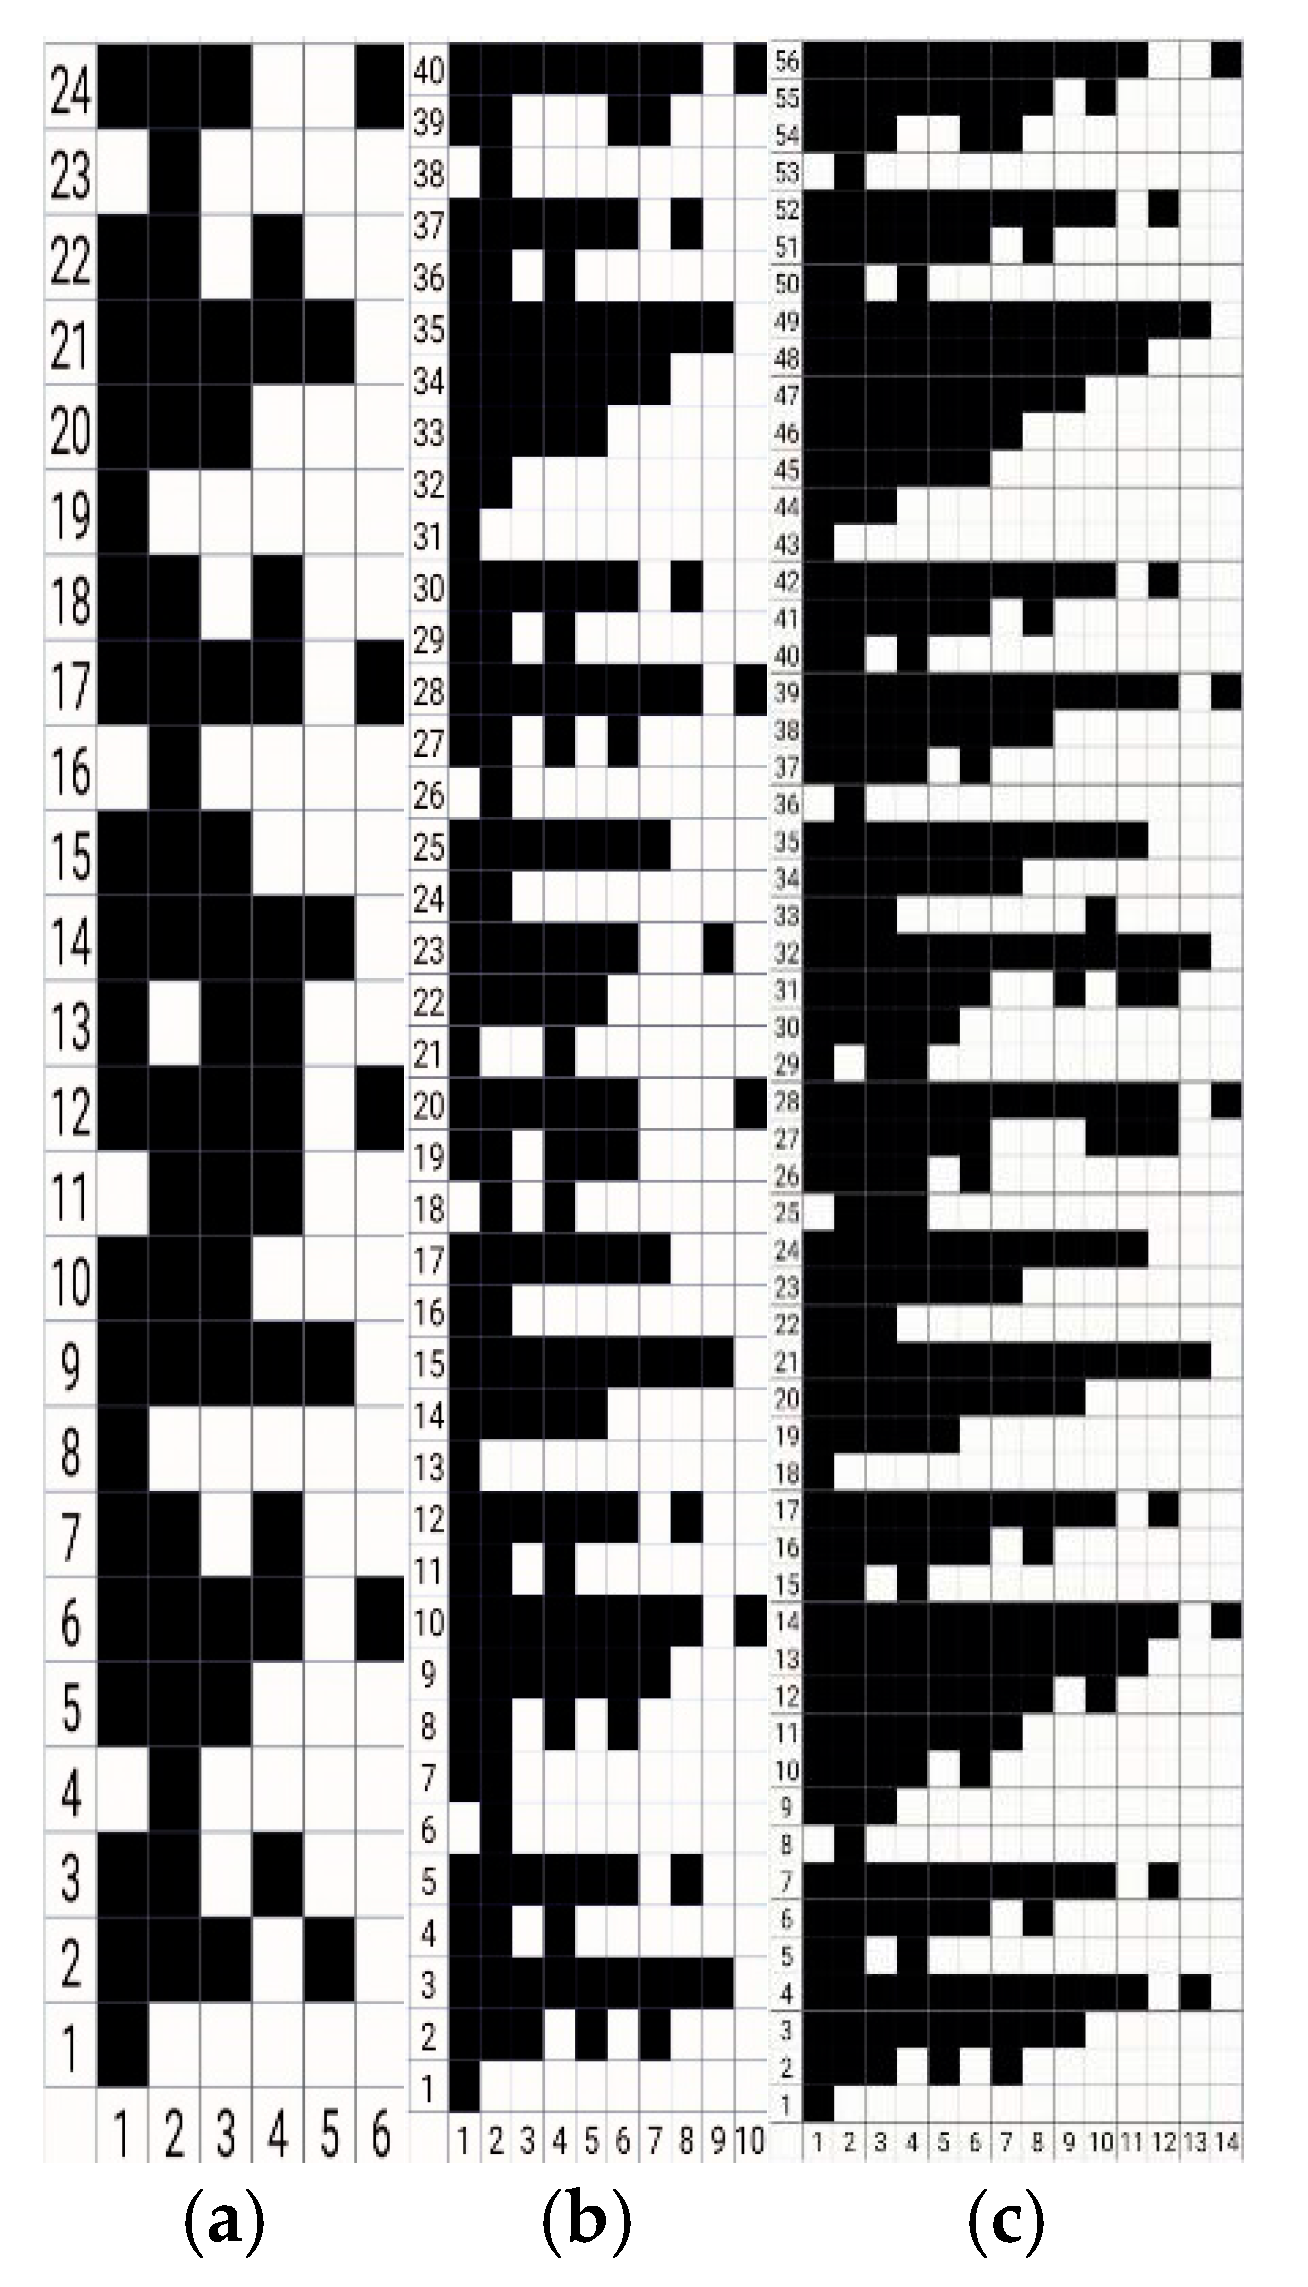
2.2. Preform Design and Weaving
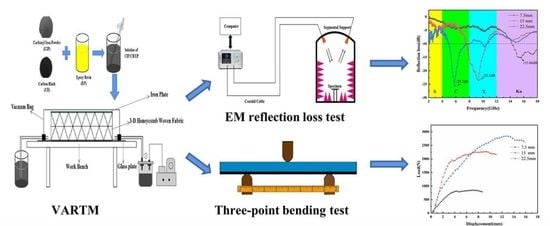
2.3. Fabrication of the 3-D Honeycomb Woven EM Absorbing Composites
2.4. Characterization Methods
3. Results and Discussion
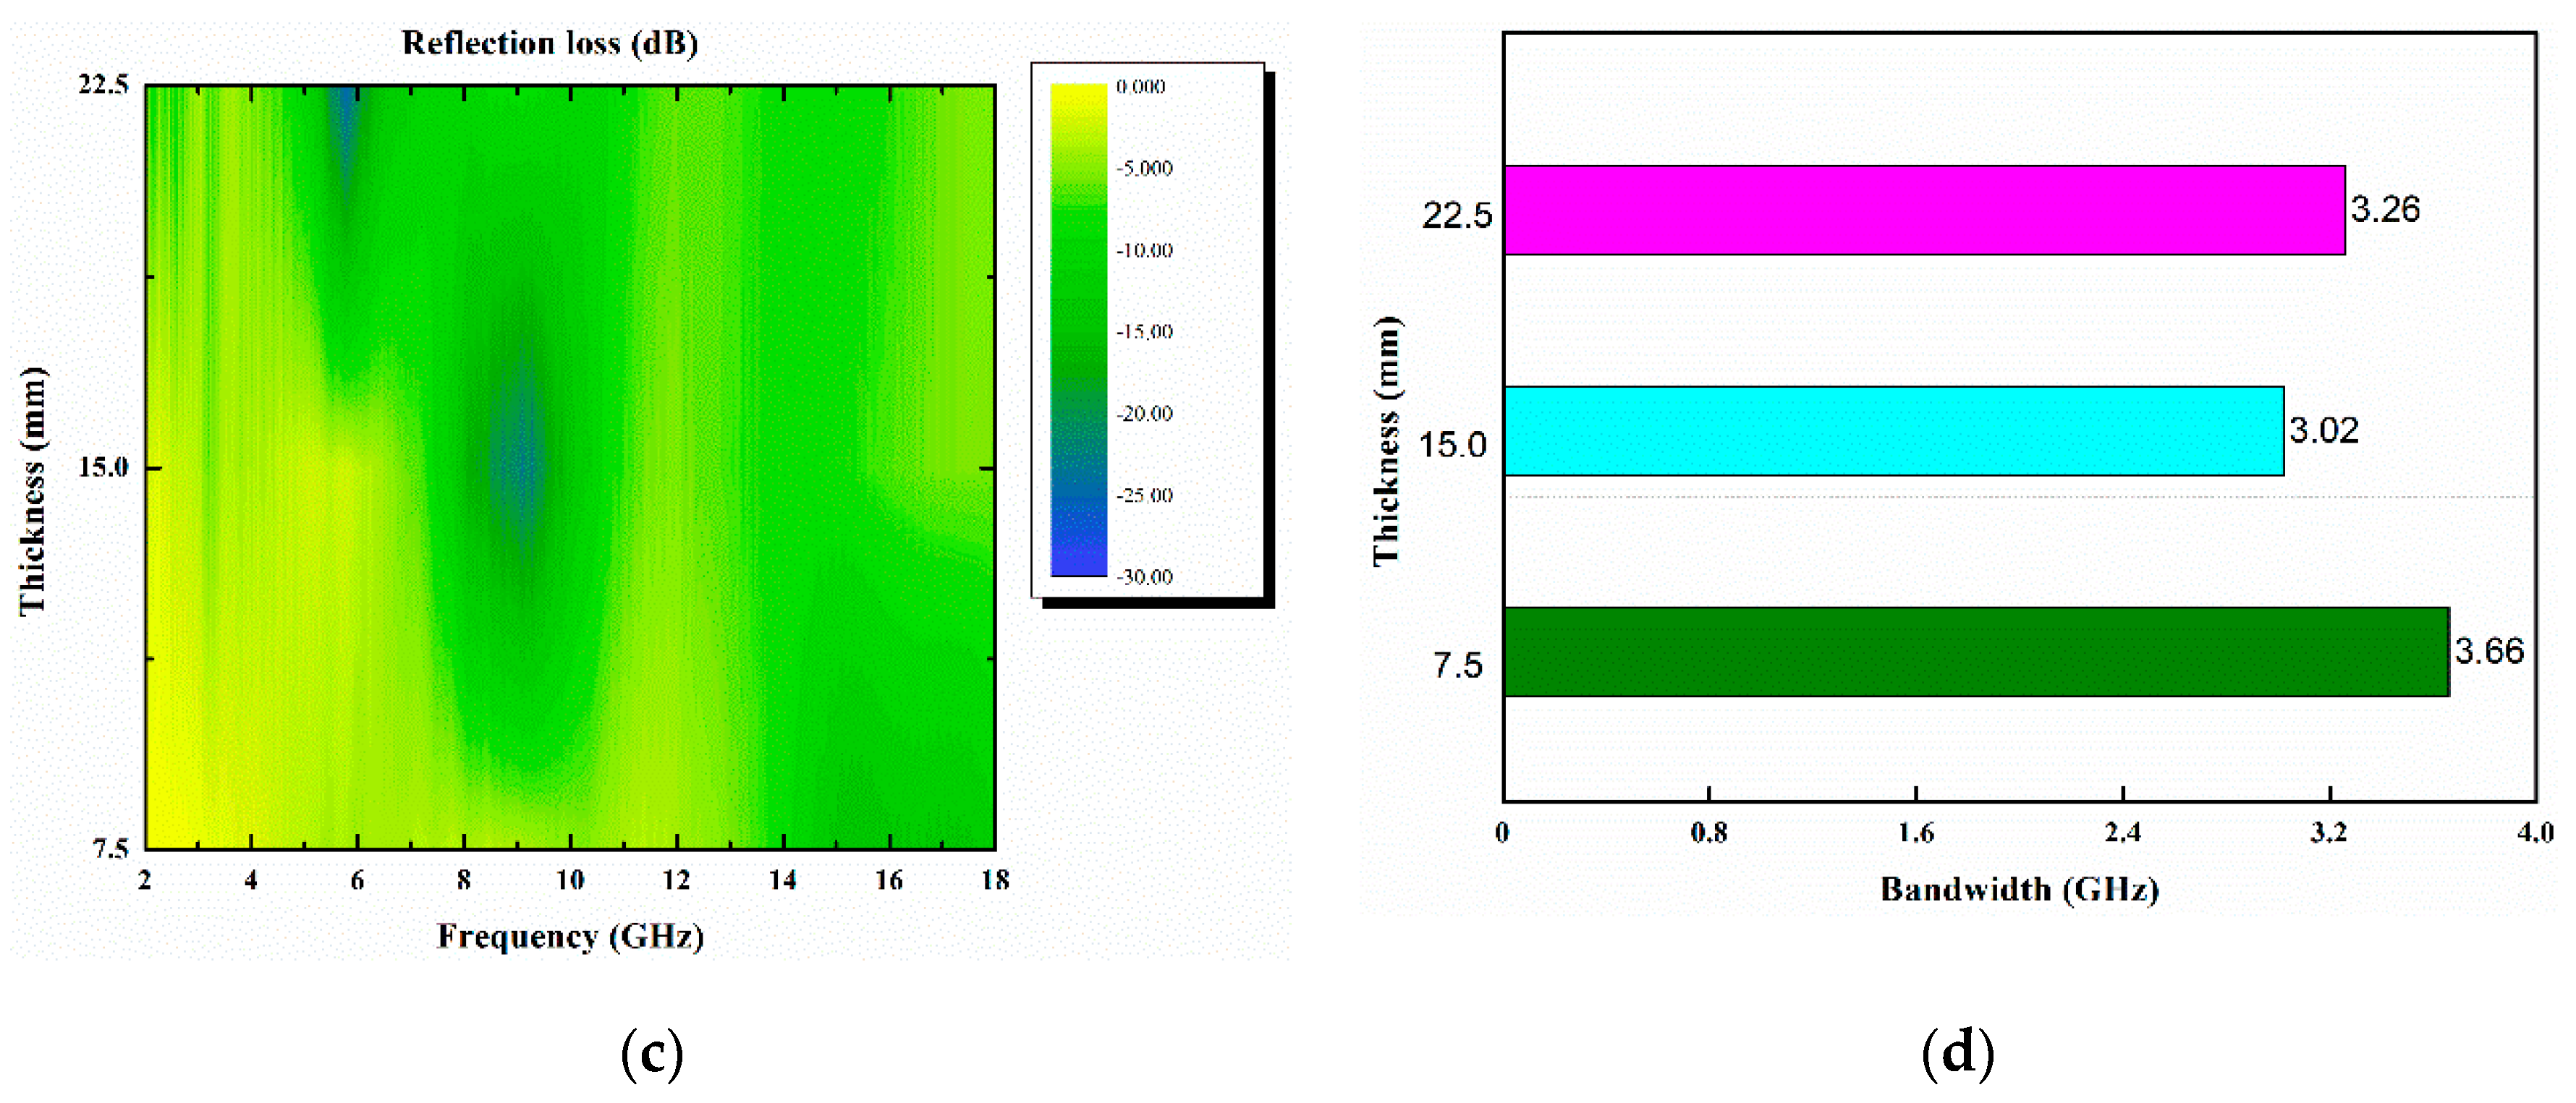
3.1. EM Properties
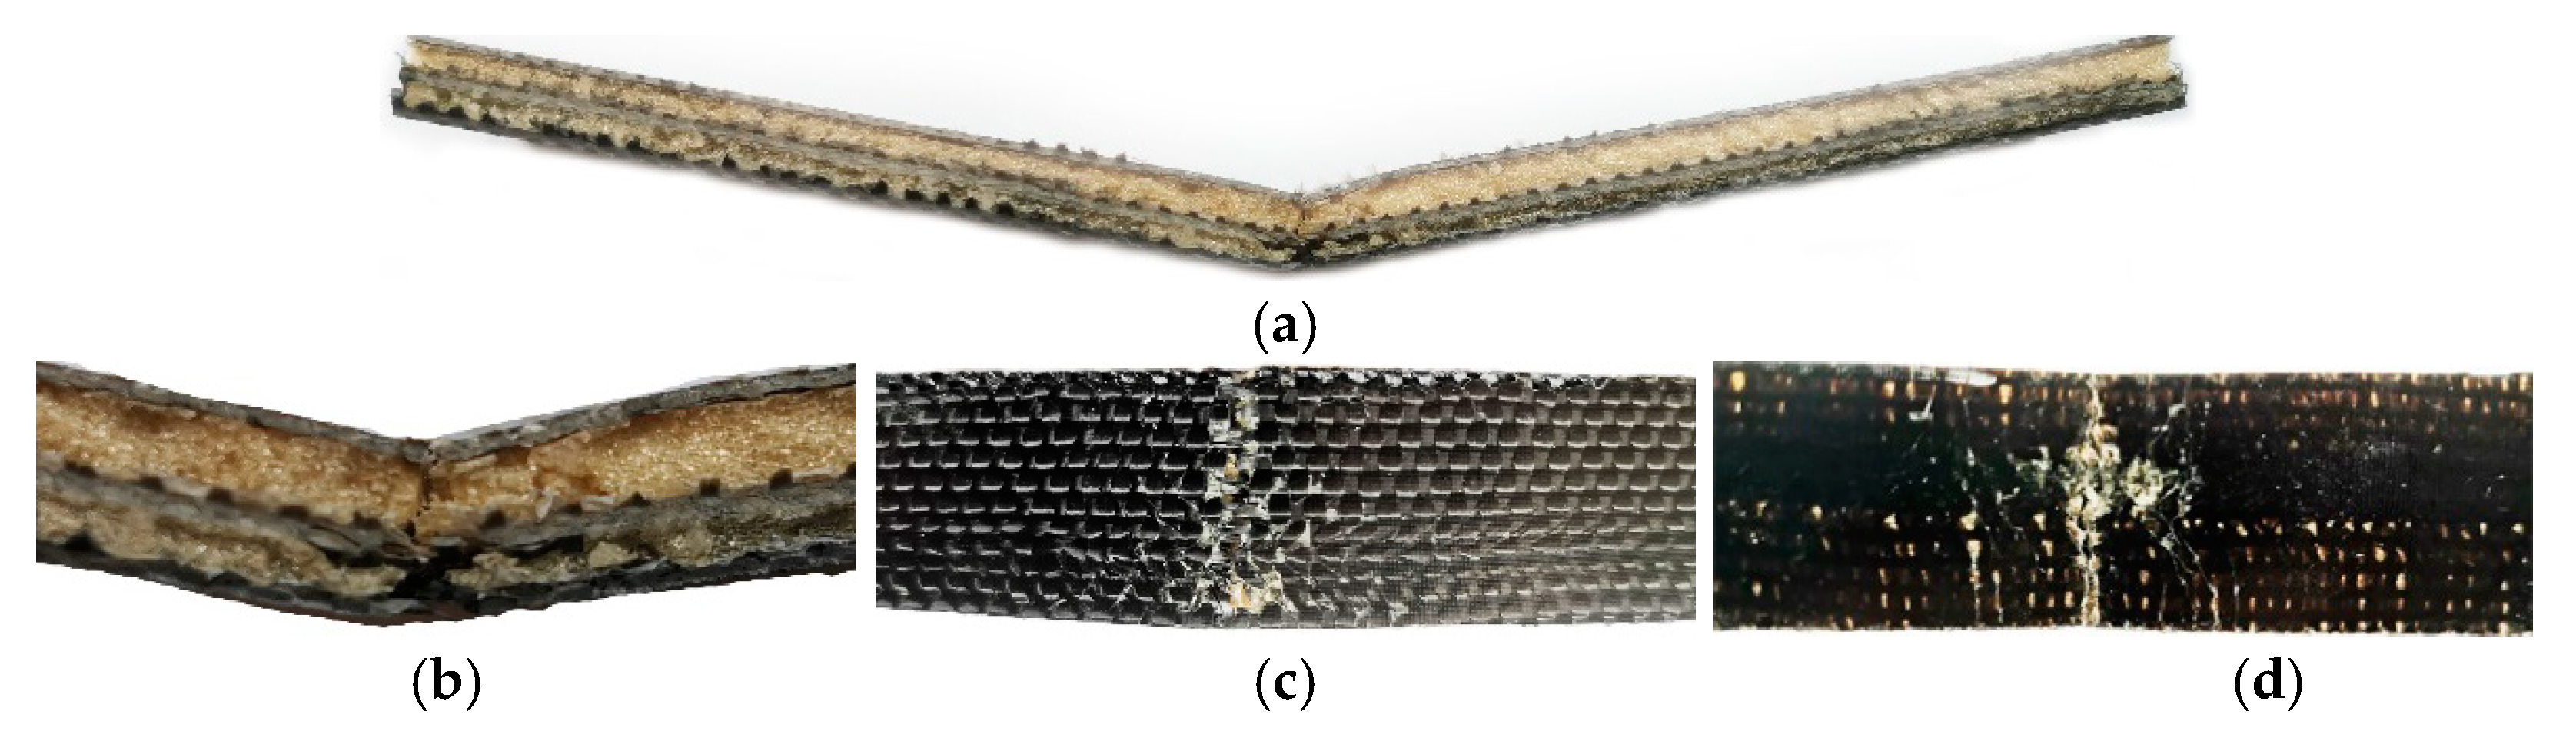
3.2. Bending Properties
3.3. Mechanical Properties and EM Properties Match

| Specimen | Mechanical Properties | EM Properties | |
|---|---|---|---|
| EAB (GHz) | |||
| S0 | 0 | 14% | 0.3 |
| S1 | −15.53% | 50.6% | 3.66 |
| S2 | 13.21% | 135% | 3.02 |
| S3 | −5.79% | 157% | 3.26 |
4. Conclusions
Author Contributions
Funding
Institutional Review Board Statement
Informed Consent Statement
Data Availability Statement
Conflicts of Interest
References
- Luo, H.; Chen, F.; Wang, X.; Dai, W.Y.; Xiong, Y.; Yang, J.J.; Gong, R. A novel two-layer honeycomb sandwich structure absorber with high-performance microwave absorption. Compos. Part A 2019, 119, 1–9. [Google Scholar] [CrossRef]
- Liu, W.D.; Lyu, L.H. Research Progress of Three-dimensional Woven Wave-absorbing Composite Materials. Cotton Text. Technol. 2020, 48, 81–84. [Google Scholar]
- Guo, X.S.; Chen, L.; Sun, H.M.; Gu, Z.Z. Design and development of irregular hexagonal honeycomb absorbing materials. Compos. Sci. Eng. 2018, 12, 67–71. [Google Scholar]
- Kim, P.C.; Lee, D.G. Composite sandwich constructions for absorbing the electromagnetic waves. Compos. Struct. 2009, 87, 161–167. [Google Scholar] [CrossRef]
- Li, W.C.; Xu, L.Y.; Zhang, X.; Gong, Y.; Ying, Y.; Yu, J.; Zheng, J.; Qiao, L.; Che, S. Investigating the effect of honeycomb structure composite on microwave absorption properties. Compos. Commun. 2020, 19, 182–188. [Google Scholar] [CrossRef]
- Wang, H.; Xiu, X.; Wang, Y.; Xue, Q.; Ju, W.B.; Che, W.Q.; Liao, S.; Jiang, H.; Tang, M.; Long, J.; et al. Paper-based composites as a dual-functional material for ultralight broadband radar absorbing honeycomb. Compos. Part B 2020, 202, 1–9. [Google Scholar] [CrossRef]
- Sun, P.C.; Wang, L.M.; Wang, T.; Huang, J.; Sha, X.W.; Chen, W. Structural optimization of the design of a double-layer absorbing honeycomb composite. J. Beijing Univ. Chem. Technol. 2019, 46, 58–64. [Google Scholar]
- Menta, V.G.K.; Vuppalapati, R.R.; Chandrashekhara, K. Manufacturing and mechanical performance evaluation of resin-infused honeycomb composites. J. Reinf. Plast. Compos. 2012, 31, 415–423. [Google Scholar] [CrossRef]
- Ji, G.F.; Ouyang, Z.Y.; Li, G.Q. Debonding and impact tolerant sandwich panel with hybrid foam core. Compos. Struct. 2013, 103, 143–150. [Google Scholar] [CrossRef]
- Xiong, J.; Zhang, M.; Stocchi, A. Mechanical behaviors of carbon fiber composite sandwich columns with three dimensional honeycomb cores under in-plane compression. Compos. Part B 2014, 60, 350–358. [Google Scholar] [CrossRef]
- Wei, F.; Li, D.D.; Li, J.L.; Li, J.Z.; Yuan, L.J.; Xue, L.L.; Sun, R.-J.; Meng, J.-G. Electromagnetic properties of three-dimensional woven carbon fiber fabric/epoxy composite. Text. Res. J. 2018, 88, 2353–2361. [Google Scholar]
- Xiao, B.Q.; Huang, Q.W.; Chen, H.X.; Chen, X.B.; Long, G.B. A fractal model for capillary flow through a single tortuous capillary with roughened surfaces in fibrous porous media. Fractals 2021, 29, 2150017. [Google Scholar] [CrossRef]
- Bayraktar, G.B.; Kianoosh, A.; Bilen, D. Fabrication of Woven Honeycomb Structures for Advanced Composites. Text. Leather Res. 2018, 1, 114–119. [Google Scholar] [CrossRef]
- Lv, L.H.; Huang, Y.L.; Cui, J.R. Bending Properties of Three-dimensional Honeycomb Sandwich Structure Composites: Experiment and Finite Element Method Simulation. Text. Res. J. 2018, 88, 2024–2031. [Google Scholar] [CrossRef]
- Zahid, B.; Jamshaid, H.; Rajput, A.W. Effect of Cell Size on Tensile Strength and Elongation Properties of Honeycomb Weave. Ind. Text. 2019, 70, 133–138. [Google Scholar] [CrossRef]
- Liu, L.; Duan, Y.; Ma, L. Microwave absorption properties of a wave-absorbing coating employing carbonyl-iron powder and carbon black. Appl. Surf. Sci. 2010, 257, 842–846. [Google Scholar] [CrossRef]
- Dai, X.H. Research on Electromagnetic Wave Absorption Performance of Honeycomb Structure Composites. Master’s Thesis, Dalian University of Technology, Dalian, China, June 2019. [Google Scholar]
- Matttsine, S.M.; Hock, K.M.; Liu, L. Shift of resonance frequency of long conducting fibers embedded in a composite. J. Appl. Phys. 2003, 94, 1146–1154. [Google Scholar] [CrossRef]
- Zhang, X.F. Study on Preparation and Properties of Structural Wave Absorbing Composite Materials via VARI Process. Master’s Thesis, Nanjing University of Aeronautics and Astronautics, Nanjing, China, March 2019. [Google Scholar]


| Thickness (mm) | Linear Density/Tex | Layer Number of Yarns | Weaving Density (Yarn/10 cm) | |
|---|---|---|---|---|
| Warp/Weft Yarns | Warp Density | Weft Density | ||
| 7.5 | 800 | 1 | 180 | 95 |
| 15 | 2 | 300 | ||
| 22.5 | 3 | 420 | ||
| Specimen | Mechanical Property | EM Properties | |
|---|---|---|---|
| Bending Strength (MPa) | RLmin (dB) | EAB (GHz) | |
| S0 | 106.88 | −11.4 | 0.3 |
| S1 | 90.28 | −15.06 | 3.66 |
| S2 | 121 | −23.5 | 3.02 |
| S3 | 101.09 | −25.7 | 3.26 |
Publisher’s Note: MDPI stays neutral with regard to jurisdictional claims in published maps and institutional affiliations. |
© 2021 by the authors. Licensee MDPI, Basel, Switzerland. This article is an open access article distributed under the terms and conditions of the Creative Commons Attribution (CC BY) license (https://creativecommons.org/licenses/by/4.0/).
Share and Cite
Lyu, L.-H.; Liu, W.-D.; Sun, B.-Z. Electromagnetic Wave-Absorbing and Bending Properties of Three-Dimensional Honeycomb Woven Composites. Polymers 2021, 13, 1485. https://doi.org/10.3390/polym13091485
Lyu L-H, Liu W-D, Sun B-Z. Electromagnetic Wave-Absorbing and Bending Properties of Three-Dimensional Honeycomb Woven Composites. Polymers. 2021; 13(9):1485. https://doi.org/10.3390/polym13091485
Chicago/Turabian StyleLyu, Li-Hua, Wen-Di Liu, and Bao-Zhong Sun. 2021. "Electromagnetic Wave-Absorbing and Bending Properties of Three-Dimensional Honeycomb Woven Composites" Polymers 13, no. 9: 1485. https://doi.org/10.3390/polym13091485
APA StyleLyu, L.-H., Liu, W.-D., & Sun, B.-Z. (2021). Electromagnetic Wave-Absorbing and Bending Properties of Three-Dimensional Honeycomb Woven Composites. Polymers, 13(9), 1485. https://doi.org/10.3390/polym13091485