Article

New Potentiometric Screen-Printed Platforms Modified with Reduced Graphene Oxide and Based on Man-Made Imprinted Receptors for Caffeine Assessment

by
Hisham S. M. Abd-Rabboh
1,2,
Abdel El-Galil E. Amr
3,4,*,
Abdulrahman A. Almehizia
3,
Ahmed M. Naglah
3,4 and
Ayman H. Kamel
2,5,*
1
Chemistry Department, Faculty of Science, King Khalid University, P.O. Box 9004, Abha 61413, Saudi Arabia
2
Department of Chemistry, Faculty of Science, Ain Shams University, Cairo 11566, Egypt
3
Pharmaceutical Chemistry Department, College of Pharmacy, Drug Exploration and Development Chair (DEDC), King Saud University, Riyadh 11451, Saudi Arabia
4
Applied Organic Chemistry Department, National Research Center, Dokki, Giza 12622, Egypt
5
Chemistry Department, College of Science, Sakhir 32038, Bahrain
*
Authors to whom correspondence should be addressed.
Polymers 2022, 14(10), 1942; https://doi.org/10.3390/polym14101942
Submission received: 14 March 2022 / Revised: 15 April 2022 / Accepted: 18 April 2022 / Published: 10 May 2022

Abstract

:
Caffeine is a psychoactive drug that is administered as a class II psychotropic substance. It is also considered a component of analgesics and cold medicines. Excessive intake of caffeine may lead to severe health damage or drug addiction problems. The assessment of normal caffeine consumption from abusive use is not conclusive, and the cut-off value for biological samples has not been established. Herein, new cost-effective and robust all-solid-state platforms based on potentiometric transduction were fabricated and successfully utilized for caffeine assessment. The platforms were modified with reduced graphene oxide (rGO). Tailored caffeine-imprinted polymeric beads (MIPs) based on methacrylic acid (MAA) and ethylene glycol dimethacrylate (EGDMA) were prepared, characterized, and used as recognition receptors in the presented potentiometric sensing devices. In 50 mM MES buffer, the sensors exhibited a slope response of 51.2 ± 0.9 mV/decade (n = 6, R2 = 0.997) over the linear range of 4.5 × 10⁻⁶–1.0 × 10⁻³ M with a detection limit of 3.0 × 10⁻⁶ M. They exhibited fast detection of caffeinium ions with less than 5 s response time (<5 s). The behavior of the presented sensors towards caffeinium ions over many common organic and inorganic cations was evaluated using the modified separate solution method (MSSM). Inter-day and intra-day precision for the presented analytical device was also evaluated. Successful applications of the presented caffeine sensors for caffeine determination in commercial tea and coffee and different pharmaceutical formulations were carried out. The data obtained were compared with those obtained by the standard liquid chromatographic approach. The presented analytical device can be considered an attractive tool for caffeine determination because of its affordability and vast availability, particularly when combined with potentiometric detection.

1. Introduction

Caffeine (1,3,7-trimethyl xanthine) is an alkaloid, commonly used as an ingredient in many foods, beverages, and medicines. It is widely consumed as a psychoactive substance and is commonly found in coffee, tea, chocolate, cocoa, and soft drinks. Depending on the dosage, caffeine can have positive or harmful effects on the consumer [1,2]. Caffeine is a psychoactive drug that is administered as a class II psychotropic substance. It is also considered a component of analgesics and cold medicines. It is widely consumed as an anesthetic as it acts to stimulate the central nervous system [3], stimulate gastric acid secretion [4], diuresis [5], and increase blood pressure [6]. Excessive caffeine consumption has serious effects on human health such as dehydration [7], prevention of DNA repair [8,9], prevention of mineral absorption, especially iron [10], cancer [11], heart disease [12], aging, and pregnancy problems [13]. The concentration of caffeine varies depending on the type and nature of the products consumed. In coffee, its concentration ranges from 36 to 804 mg/L; in chocolate, it ranges from 17 to 551 mg/L; in iced tea drinks, it ranges from 13 to 68 mg/L; in sports drinks, it ranges from 267 to 340 mg/L; and in coffee-based drinks, it ranges from 15 to 448 mg/L; and in dietary supplements, it ranges from 1002 to 1353 mg/L [14,15]. In the USA, the average caffeine consumption among adults between 1994 and 2005 rose from 196 mg/day to 211 mg/day, while the global average consumption is around 70 mg/day [16,17,18]. Drug abusers often mix caffeine with sodium benzoate to snort it, or they take it with other illicit drugs to enhance the stimulating effect. From here, the need to monitor potential caffeine abuse among those with a history of drug addiction and abuse is an important task. The excessive intake of caffeine may lead to severe health damage or drug addiction problems [19,20]. However, unlike traditional illicit drugs, the assessment of normal caffeine consumption from abusive use is not conclusive, and the cut-off value for biological samples has not been established [21,22].
Of all the above, it is imperative to control the concentration of caffeine and determine its quantity. The challenge of quantifying caffeine is associated with its low concentration in complex matrices. As a result, most current caffeine quantification techniques have their limitations and disadvantages. There are many techniques such as spectrophotometry [23], fluorometry [24], capillary electrophoresis [25], gas chromatography [26], high-performance liquid chromatography (HPLC) with UV or diode detection methods [27] and mass spectrometry [28,29,30,31,32,33,34,35]. Disadvantages of these techniques include the high cost of the apparatus used, complexity in technologies, more time-consuming, low sensitivity, and selectivity.
Electroanalytical methods of analysis have good characteristics, including low instrument cost, simplicity of operation, high sensitivity and selectivity, wide dynamic linear range, real-time determination, miniaturization, convenience, and ease of use [36,37]. However, as a serious limitation in voltammetric techniques, caffeine can be oxidized at high positive potentials. This may interfere with the electro-oxidations of other species that coexist in the background electrolyte [38,39,40,41].
Ion-selective electrodes (ISEs) are considered indispensable members of the family of electrochemical sensors with the ability to measure basic ionic species in complex sample matrices [42,43,44]. Potentiometry with ISEs is characterized as a non-destructive and passive analysis method that converts the ionic activity into potential without the need for additional stimulation. In addition, they are characterized by their simplicity, low cost, ease of miniaturization, timeliness, and reliability. ISEs have been widely adopted as an accurate option for rapid ion detection in multiple fields such as biomedicine [44,45,46], agriculture [47], environmental monitoring [48,49], and industrial analysis [43,50]. In recent years, rapid identification of ions ranging from environmental monitoring to bio-fluid analysis at the point of care has required powerful and robust analytical tools. This was driven by the development of materials science and processing technology. Solid-contact ion-selective electrodes (SC-ISEs) have shown great potential for routine and portable ion detection [51,52]. Introducing nanomaterials as ion-to-electron transducers with the adoption of various strategies to improve performance led to a significant boost in the development of SC-ISEs [53]. Besides, with the increase in miniaturization, flexibility, and reliability of SC-ISEs, the field has developed from the traditional potentiometric electrodes to the integrated sensing systems which have wider applications. Now, screen printing technology has been widely used to manufacture a new generation of electrochemical sensors characterized by their low cost, ease of use, and ease of disposal. This technology contributed greatly to establishing the route from the ‘laboratory to the market’. Due to their beneficial physical properties, such as disposability, simplicity, and rapid responses, these types of platforms have been successfully used for rapid analysis of both environmental pollutants [54,55] and biomedical molecules [37,56].
Molecularly imprinted polymers (MIPs) have seen a continuous development as sensing elements in bio-/chemo-sensors since the late 1990s [57]. MIPs are attractive not only for their recognition properties that are close to those of natural receptors and their availability for a wide range of targets but also for their superior chemical and physical stability compared to biological receptors. The field of molecularly imprinted polymer (MIP)-based chemosensors has been experiencing constant growth for several decades [58,59,60]. Since the beginning, their continuous development has been driven by the need for simple devices with optimum selectivity for the detection of various compounds in fields such as medical diagnosis, environmental and industrial monitoring, food, and toxicological analysis, and, more recently, the detection of traces of explosives or their precursors [61,62].
In this work, cost-effective, compact, and portable monitoring potentiometric sensors were manufactured. These sensors have been successfully applied to determine caffeine in different matrices. All-solid-state screen-printed potentiometric electrodes were fully designed, characterized, and proposed. The potentiometric analytical device integrates the indicator polymeric membrane caffeine-ISE with an Ag/AgCl reference electrode and a polyvinyl butyral (PVB) reference membrane. All potentiometric performances of the fabricated screen-printed sensors were investigated and evaluated.

2. Materials and Methods

2.1. Apparatus

All potential measurements were carried out using a mV/pH meter (PXSJ-216 INESA, Scientific Instrument Co., Ltd., Shanghai, China). Carbon screen-printed electrodes (SPEs) modified with multiwalled carbon nanotubes (MWCNTs) (Ref. 110CNT) were purchased from DropSens (Llanera, Asturias, Spain). The platforms were of ceramic substrate (L34 × W10 × H0.5 mm) and silver electrical contact. Millipore Milli-Q system (18.2 MΩ cm specific resistance) was used for obtaining de-ionized water. A scanning electron microscope (SEM) (JEOL JSM 6510lV, Osaka, Japan) was used for the characterization of MIP particles.

2.2. Reagents and Chemicals

High molecular weight poly (vinyl chloride) (PVC), 2-nitrophenyl octyl ether (o-NPOE), polyvinyl butyral (PVB), 2-(N-morpholino) ethane sulfonic acid (MES), caffeine, potassium tetrakis (4-chlorophenyl) borate (KTClPB), methyl acrylic acid (MAA), benzoyl peroxide (BPO) and ethylene glycol di-methacrylate acid (EGDMA 98%) were purchased from Sigma Aldrich (St. Louis, Missouri, MO, USA). Tetrahydrofuran (THF) and acetonitrile were obtained from Fluka AG (Buchs, Switzerland). Ag/AgCl ink (E2414) was purchased from Ercon (Wareham, MA, USA). Tablets containing caffeine were purchased from different Egyptian pharmacies. They were represented as Spasmomigran (Kahira Co., Cairo, Egypt), Cafergot (Novartis Co., Cairo, Egypt), Amigraine (Adco Co., Cairo, Egypt), and Samadril (Minaph Co., Egypt).
A stock 1.0 × 10⁻² M caffeine solution was prepared by dissolving the definite weight in 100 mL de-ionized water. All caffeine standard solutions (e.g., 1.0 × 10⁻⁷–1.0 × 10⁻² M) were prepared from the stock caffeine solution after dilution with 50 mM MES buffer solution of pH 5.0. All solutions were stored in the refrigerator.

2.3. Preparation of the Imprinted Beads

The imprinted polymers were prepared by mixing 0.5 mmol of caffeine (template) with 3.0 mmol of MAA (functional monomer) in a glass tube and left together for 1 h. 3.0 mmol of EGDMA (cross-linker) was then added and followed by adding 0.3 mmol of BPO (initiator). 15 mL of acetonitrile (porogenic solvent) was added to the mixture followed by sonication for 10 min until complete dissolution of all components. The solution was degassed with N2 gas for 15 min to expel all dissolved oxygen. The solution mixture was placed in an oil bath for 18 h at 70 °C for complete polymerization. The synthesized polymers were washed with methanolic solution till all un-reacted reactants were removed. Using Soxhlet, the templated caffeine molecule was removed from the MIP particles using a mixture of methanol/acetic acid (8:2, v/v). The washing solution was measured spectrometrically at λmax = 250 nm to check the complete removal of caffeine from the MIP particles. The particles were washed several times until there was no further detection of caffeine. The obtained MIPs were dried at ambient temperature before use. Non-imprinted polymers (NIPs) were also prepared in a similar way as the imprinted beads but with the exclusion of caffeine from the procedure.

2.4. Sensor Fabrication

The composition of the ion-sensing membrane (ISM) was of a total mass of 114 mg dissolved in 2.0 mL THF. The membrane was prepared via dispersing MIP or NIP particles (12 mg), 2 mg of (rGO), KTpClB (2.0 mg), plasticizer (49.0 mg), and PVC (49.0 mg). For the modified screen-printed electrodes (SPEs), about 5 μL of the ISM cocktail was applied onto the carbon orifice of the SPEs via the drop-casting method and left to dry. The membrane composition of the reference electrode contains 70 mg of NaCl and 78.1 mg of polyvinyl butyral (PVB) dissolved in 1 mL of methanol. A 20 µL of the reference membrane solution was drop cast on the Ag/AgCl ink electrode surface. The solid-state Ag/AgCl reference electrode was integrated with the potentiometric sensor into the screen-printed platform. A schematic representation of the designed sensors is shown in Figure 1.

3. Results and Discussion

3.1. MIPs Characterization

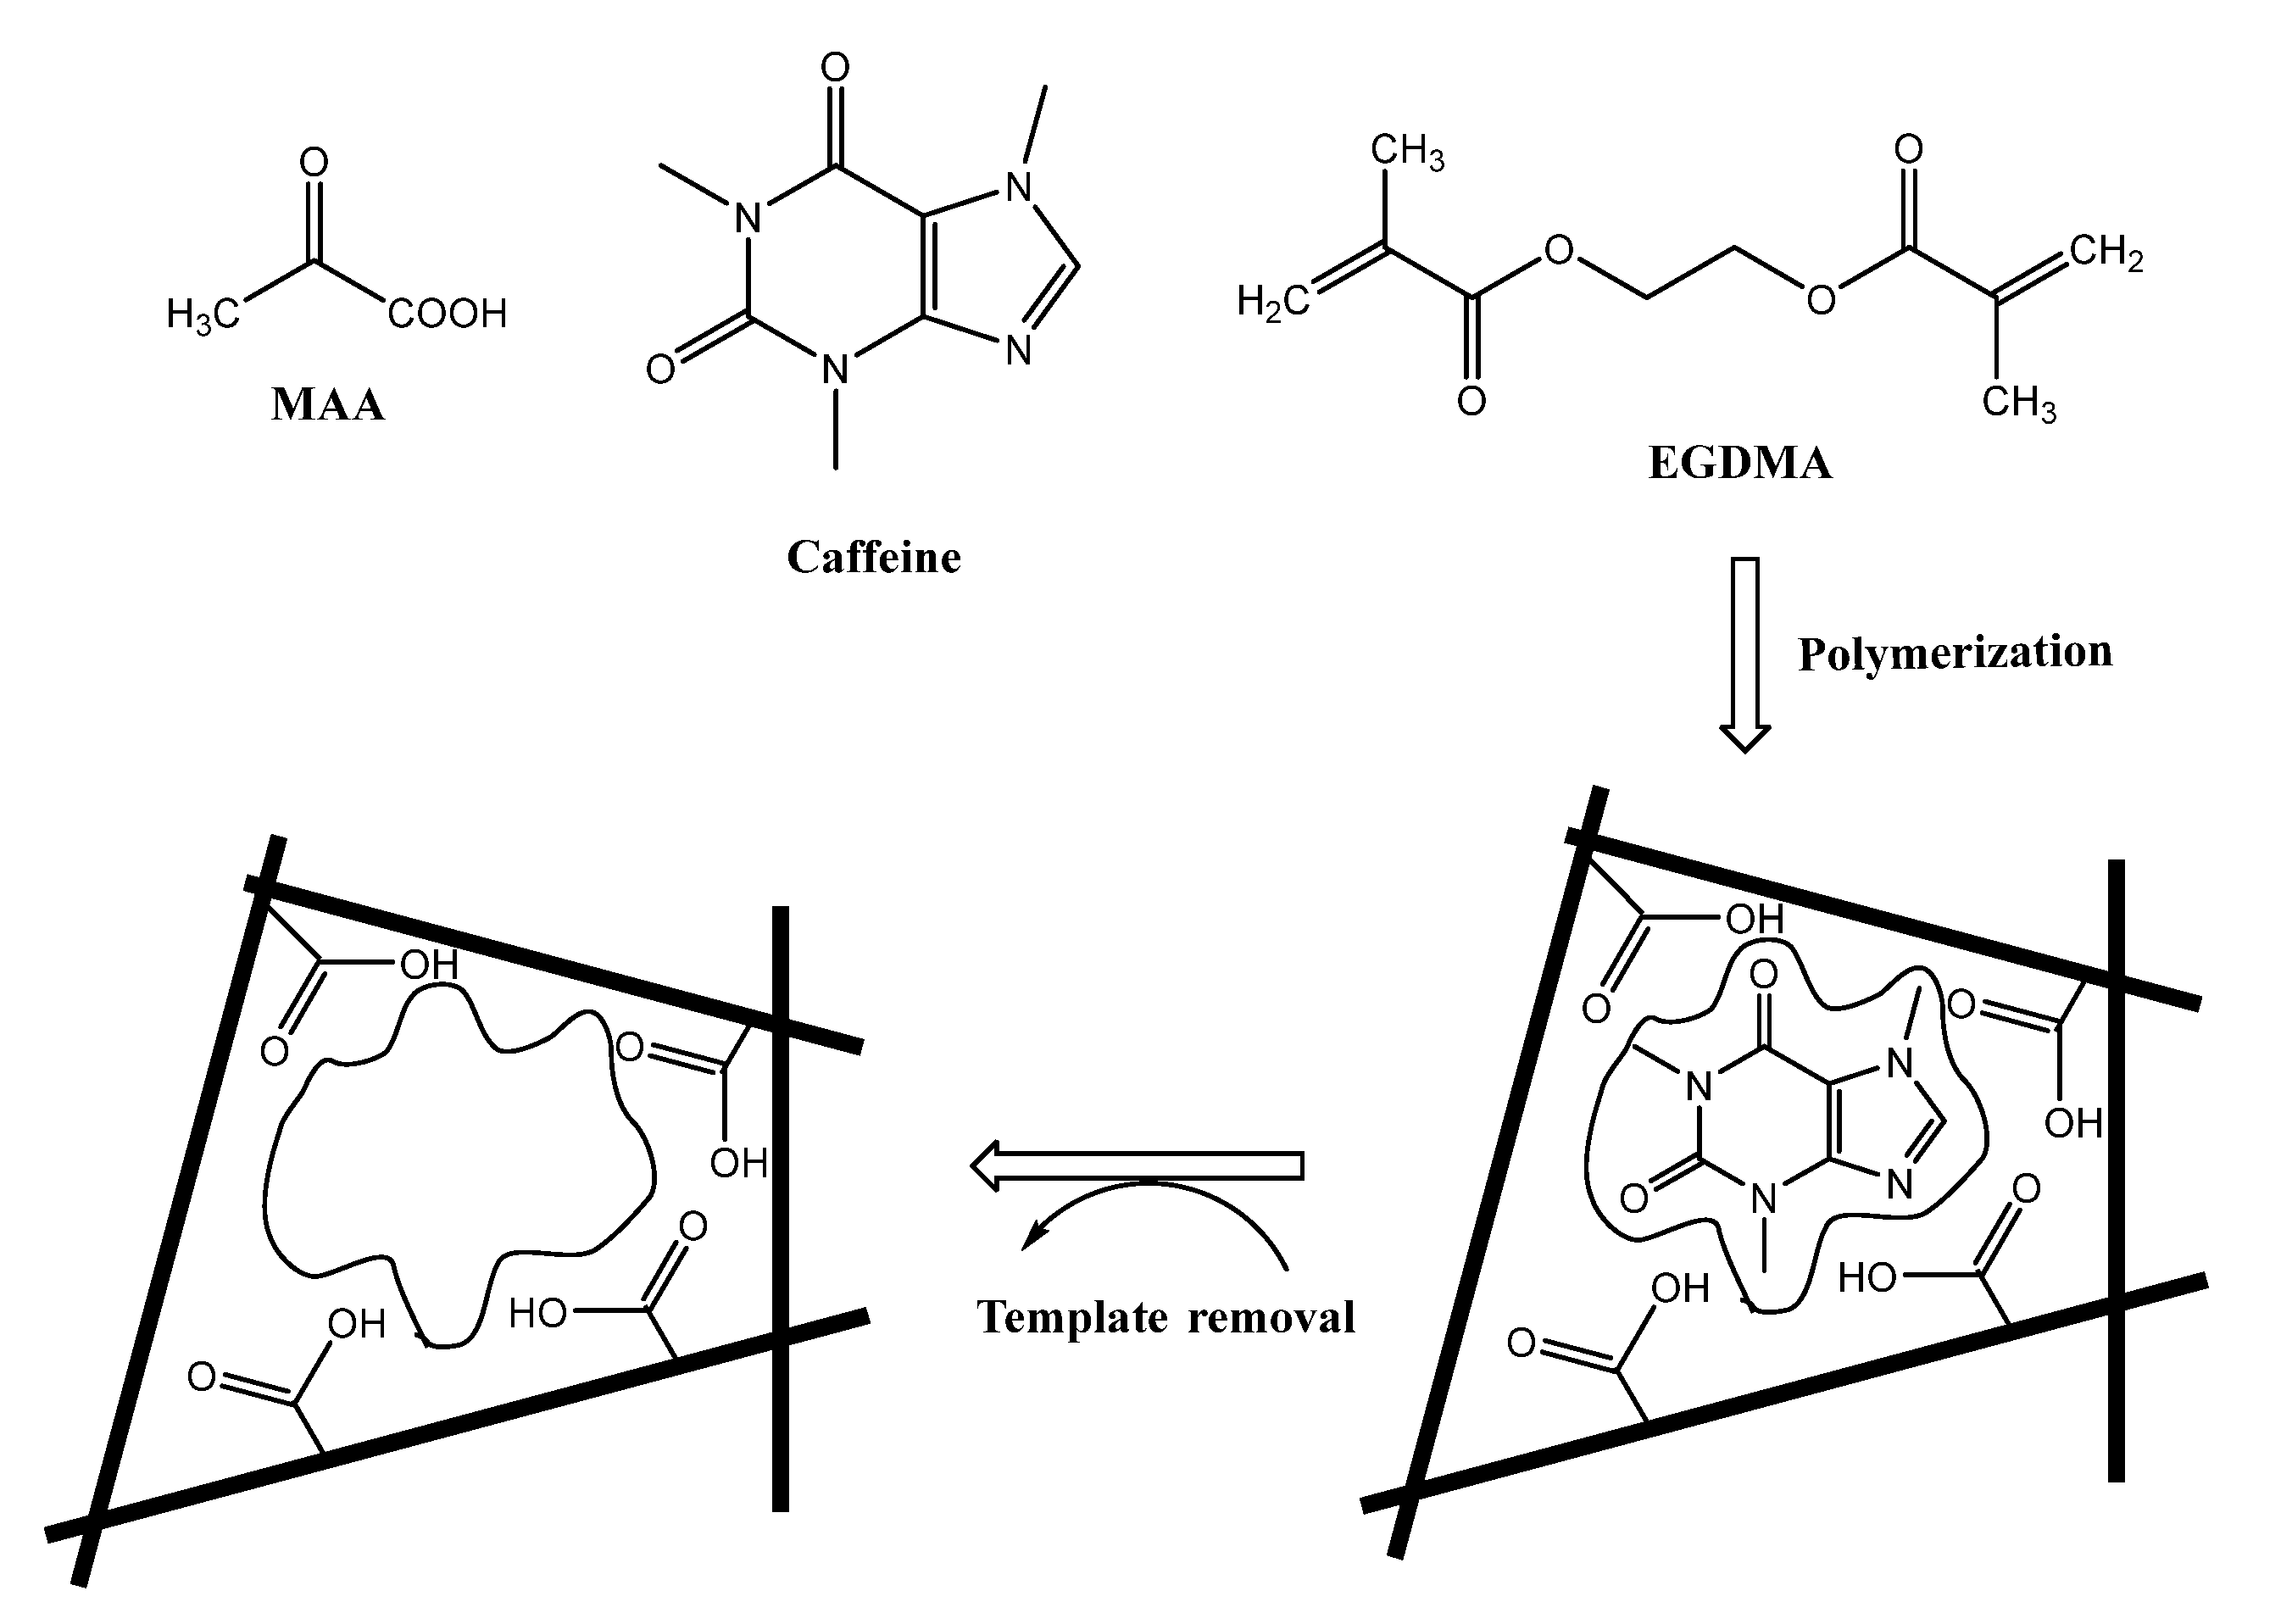
The caffeine-imprinted beads were synthesized using methacrylic acid (MAA) as an afunctional monomer and ethylene glycol dimethacrylate (EGDMA) as a cross-linker in the ration 0.5: 3: 3 for the template, monomer, and cross-linker, respectively. In the imprinting process, the interaction between the functional monomer and the templated molecule can be accomplished through: (1) Hydrogen bond formation between the carboxyl group (COOH) in MAA with either the carbonyl group or the tertiary amine in caffeine; (2) A π–π interaction between the π- bonds in the caffeine molecule and carbonyl groups in both MAA and EGDMA. These types of interactions enhance the binding affinity and specificity of the MIP towards caffein recognition [63]. Figure 2 represents a representation pathway for the imprinting process.
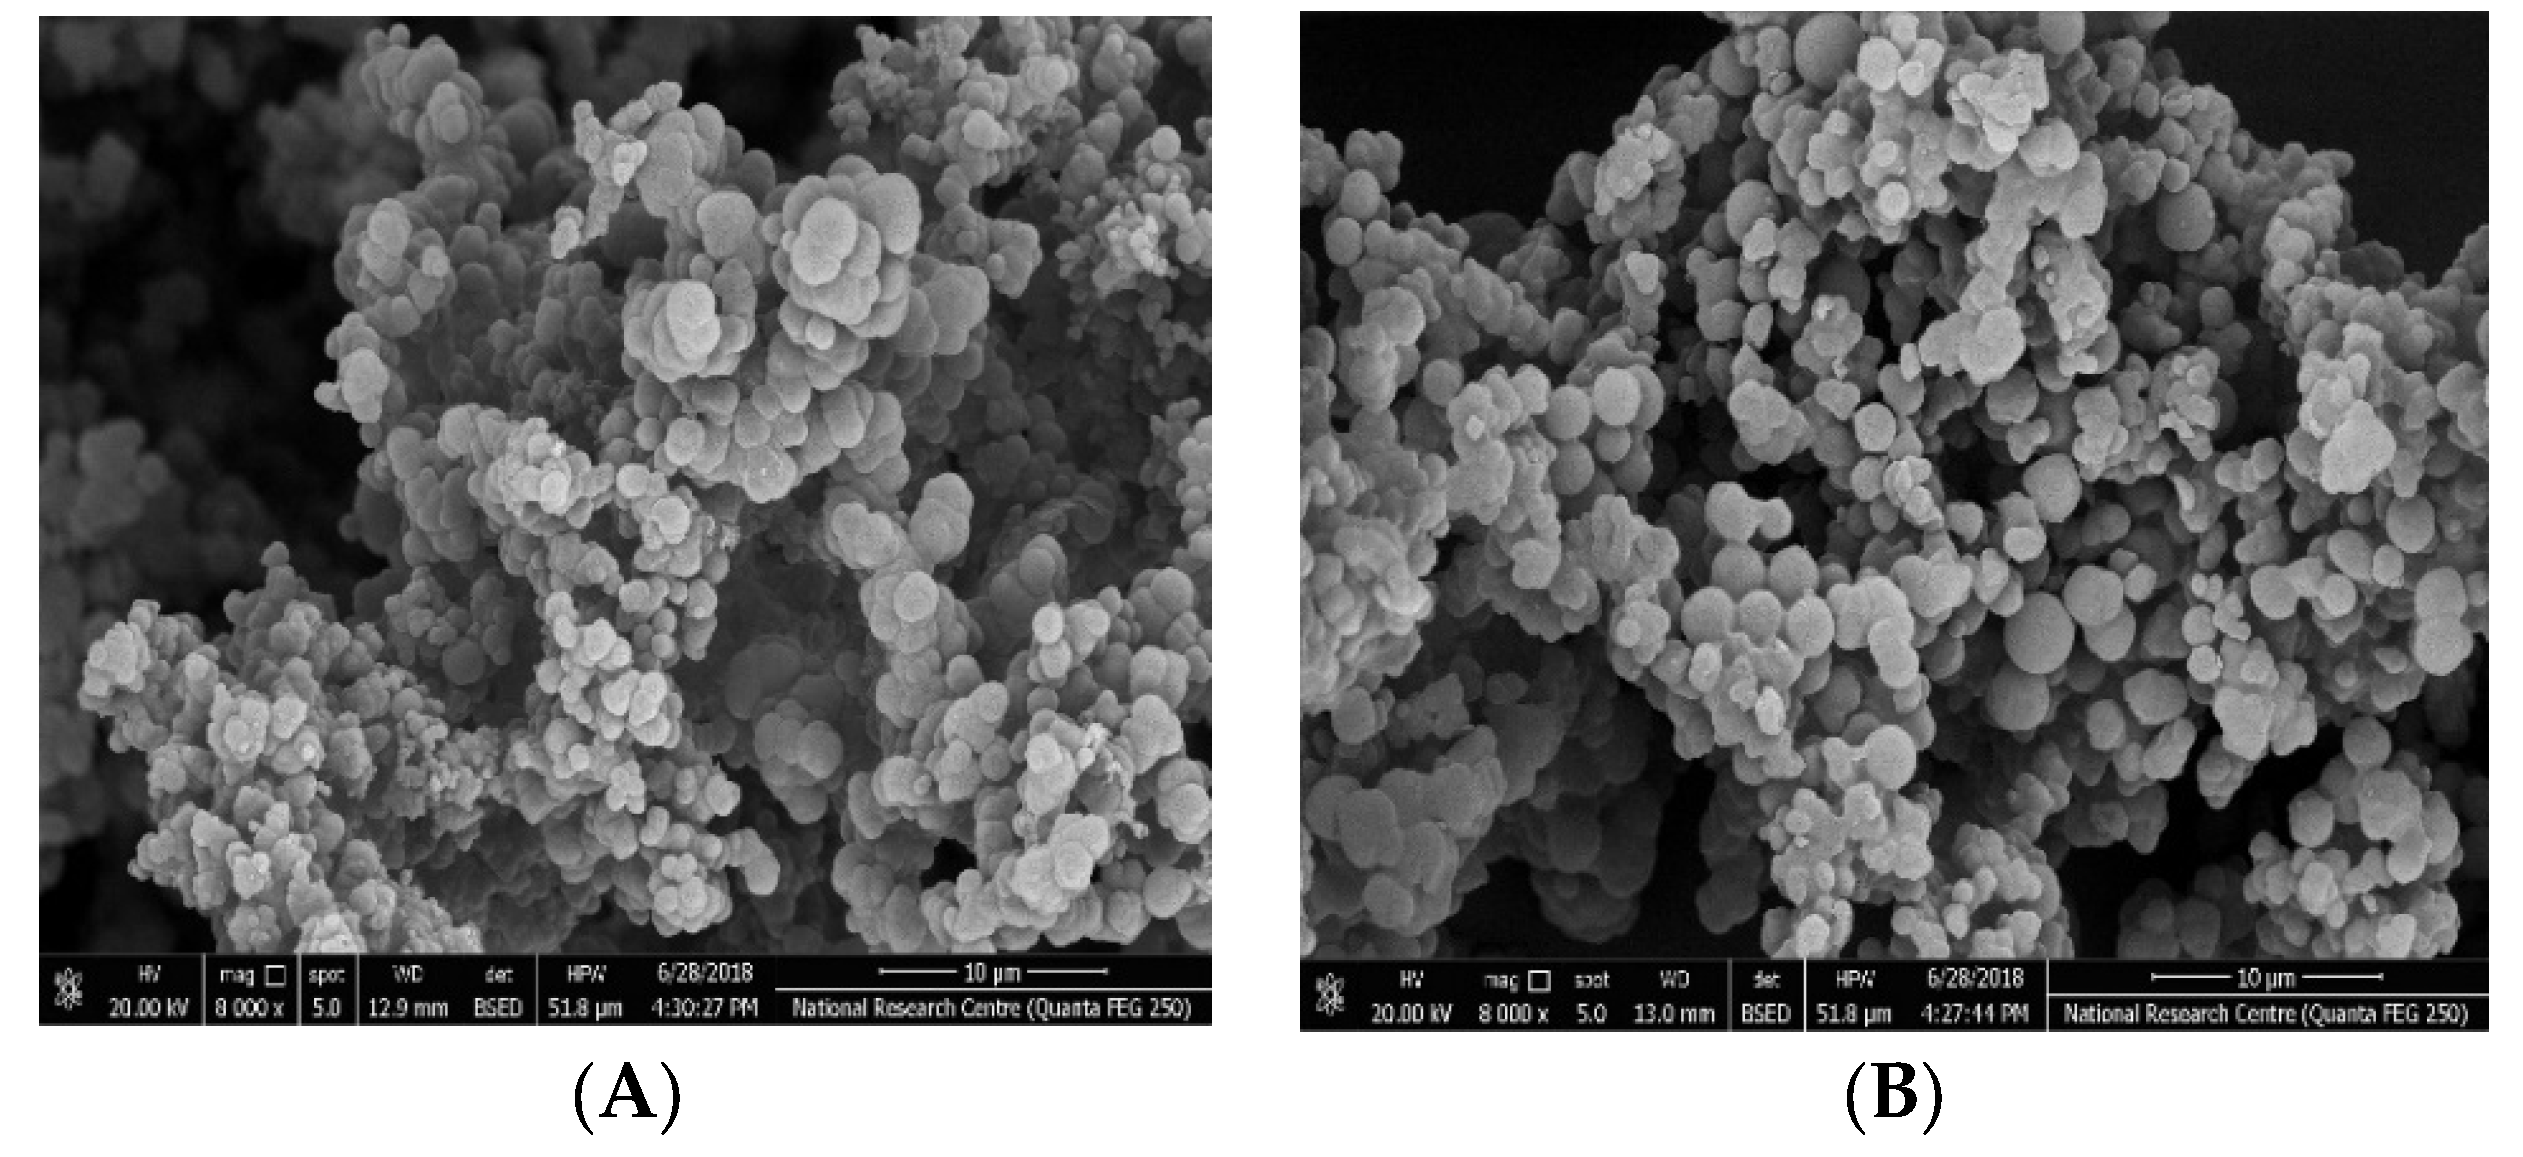
An investigation of the surface morphology of the synthesized polymeric beads was carried out using the scanning electron microscopy (SEM) technique. For the MIP beads, the SEM pictures showed a uniform, regular and semi-spherical shape with an average diameter of 300 nm. These beads were well dispersed in the plasticized PVC membrane. They could reduce the membrane resistance of the sensing membrane and create more recognition sites inside the membrane [63]. As the NIP beads were synthesized in a similar way as MIP beads but without a caffeine template, the morphological structure revealed a more regular, uniform, and spherical shape than MIPs beads. This can be attributed to the presence of caffeine template in the MIP beads. The SEM images for both MIPs and NIPs are presented in Figure 3.

3.2. Sensors’ Characteristics

The all-solid-state sensors based on either MIPs or NIPs exhibited a potentiometric response towards caffeine within the concentration range of 1.0 × 10⁻⁷ to 1.0 × 10⁻³ M caffeine at pH 5 (50 mM MES buffer). The time trace versus the potential response with the corresponding calibration curves is shown in Figure 4. For membrane composition optimization, different plasticizers namely o, NPOE, DOP, and DBS were examined. For sensors based on MIPs plasticized in o,NPOE, they exhibited a Nernstian response with a slope of 51.2 ± 0.9 mV/decade (n = 5, R2 = 0.997) over the concentration range of 4.5 × 10⁻⁶ to 1.0 × 10⁻³ M and a detection limit of 3.0 × 10⁻⁶ M. Sensors based on MIPs plasticized in DOP exhibited a Nernstian response with a slope of 43.6 ± 0.5 mV/decade (n = 5, R2 = 0.999) over the concentration range of 7.7 × 10⁻⁶ to 1.0 × 10⁻³ M and a detection limit of 4.0 × 10⁻⁶ M. The sensors’ membrane plasticized in DBS exhibited a potentiometric response with a slope of 45.4 ± 1.3 mV/decade (n = 5, R2 = 0.999) over the concentration range of 8.0 × 10⁻⁶ to 1.0 × 10⁻³ M and a detection limit of 4.5 × 10⁻⁶ M. For sensors based on NIPs, they exhibited a sub-Nernstian response with a slope of 28.1 ± 0.9 mV/decade (n = 5, R2 = 0.997) over the concentration range of 4.5 × 10⁻⁵–1.0 × 10⁻³ M, and a detection limit of 1.7 × 10⁻⁵ M. This can confirm the existence of binding sites in MIPs’ particles in the ion-sensing membrane. All the analytical features and the potentiometric response of the proposed sensors are summarized in Table 1.

3.3. Transduction Mechanism

In this work, both MWCNTs and rGO were introduced together as solid-contact materials during the manufacturing of the presented sensors. They can be considered as high surface area nanostructured materials that exhibit their ion-to-electron transduction properties, forming the electrical double layer at the polymeric ISE membrane/solid contact interface. The overall reaction includes mainly three equilibrium charge transfers at three boundaries or interfaces. At first, the reaction at the E-conducting substrate and solid-contact interface exhibits the electron transfer reaction. Secondly, an electrical double-layer (Edl) is formed between cations or anions coming from the ISE membrane and the electrical charges (either electrons or holes) that were formed in the porous structure of the solid-contact material. The potential at the E-conducting substrate and solid contact interface is very small (E ≈ 0). So, smost EDL capacitance-based SC materials are considered highly electronic conductive. At the solid contact/ion-selective membrane interface, there is no charge transfer reaction, but the exhibited potential was declined to double-layer capacitance as shown in Figure 5. Thirdly, an interfacial phase-boundary potential is formed at the interface between the attached ion-selective membrane and the aqueous solution. Thus, the exhibited potential EB confirms the Nernstian response toward the desired ion and emphasizes the thermodynamical potential of double-layer capacitance (Cdl)-based solid-contact ISEs.

3.4. Method Validation

Reliability, quality, and consistency of results are important features and evidence of analytical method validation that ensure results fitting for the same method under the same set of conditions and control parameters [64]. There are a number of ways to classify the method validation as the following:

3.4.1. Limit of Detection (LOD) and Linearity

The LOD parameter is defined as the lowest concentration noise with a certain degree of confidence. There are several ways to distinguish LOD depending on the signal-to-noise ratio. But in the case of potentiometric analysis, LOD can be determined from the cross point of the lines fitted to the linear segments of the emf vs. log ai curve as shown in Figure 4. The LOD is not a robust or rugged parameter and can be affected by minor changes in the analytical system (e.g., temperature, matrix effects, purity of reagents, instrumental conditions). Linearity definition exhibited from obtained signals, which are directly proportional to the concentration of analyte in the sample. The performance characteristics of the MIP/o,NPOE sensors exhibited a wide and linear dynamic range between 1.0×10⁻³–4.5 × 10⁻⁶ M with near-Nernstian slopes of 51.2 ± 0.9 mV/decade. The calibration plot with regression equation was found to be Y (mV) = 51.2 log [caffeine] + 131.6 with a correlation coefficient of 0.999 between the standard caffeine concentration and the potential measured in triplicates (n = 3). The detection limit of the presented sensor (DL) was found to be 3.0 × 10⁻⁶ M.

3.4.2. Reproducibility and Repeatability

The reproducibility (between-run or inter-assay variation) and repeatability (within-run or intra-assay variation) were evaluated for the proposed sensor. A standard caffeine sample (10 µg/mL) was measured to carry out these tests. The intra- and inter-day precision was below 0.59 and 0.84%, respectively. This confirmed the agreement between the results obtained by measuring the caffeine reference sample under different conditions with different sensor assemblies and different mV/meters at different times.

3.4.3. Trueness, Bias and Recovery

The meaning of trueness relates to the systematic error of a measurement system that is considered a closeness of agreement between the average of an infinite number of replicates measured quantity values and a reference quantity value. Bias definition is the agreement between the mean value of replicate measurements and the true value of the measured quantity [64].
Trueness and bias of the proposed sensor were examined by using six replicate measurements of 10 µg/mL caffeine as an internal quality control sample. Their values were calculated as in Equations (1) and (2):
Trueness% = X/µ × 100
Bias% = (X − µ)/µ × 100
where X is the mean of test results obtained for the reference sample and μ is the true value given for the reference sample.
The obtained trueness and bias were found to be 99.3 and 0.7%, respectively.
The recovery (%) of spiked caffeine samples was tested using six replicate measurements of spiked 1.5 µg/mL caffeine. The recovery (%) was found to be 99.4%.

3.4.4. Ruggedness and Robustness

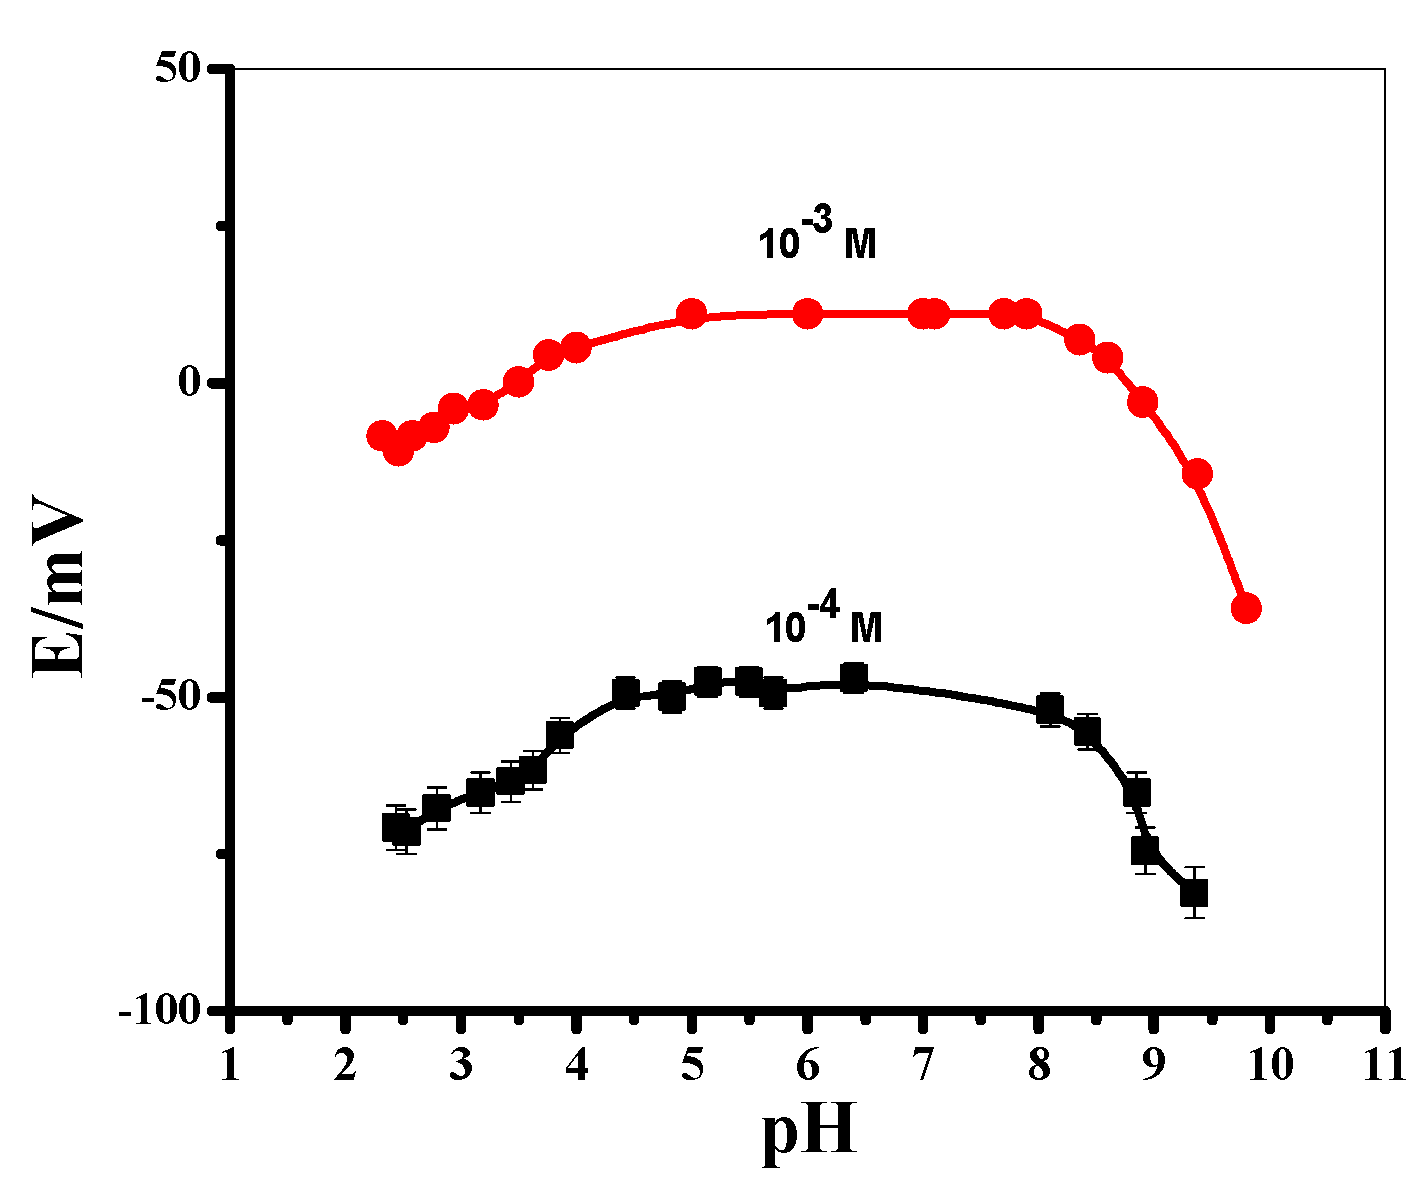
The term ruggedness in analytical methodology is considered the degree of reproducibility of obtained results of the same sample under varying test conditions. On the other hand, robustness is defined as the stability of the method against small variations of the intrinsic method parameters and variability of the sample matrix [64]. The potentiometric features of the proposed sensor were examined over a wide range of variable pH values [e.g., 2–10]. The test was performed using two concentrations of caffeine (10−3 and 10−4 M). The pH of the test solutions was adjusted after adding small aliquots of HCl and/or NaOH. The obtained potentiometric response of the presented sensor was recorded with its corresponding pH value of the test solution. Since the pKa of caffeine is 14.0, therefore caffeine will be in its cationic form at pH below this pKa value. As shown in Figure 6, it exhibited a different pH influence on the applied sensor properties that revealed the range of its stability over the pH range 4.3–8.5. At pH < 5.3, the potential response quickly declined. This can be attributed to the existence of di-valent or tri-valent caffeine cations in the solution that can decrease the potentiometric response. At pH > 8.5, the potential response quickly declined which can be attributed to the decrease of caffeine cation concentration due to the formation of some non-ionized caffeine. This wide range of stable potential readings revealed that a sophisticated, rugged, and durable potentiometric sensor was investigated. For further potentiometric studies of the applied sensor, a MES buffer of a 50 mM (pH 5) was chosen to be a working pH throughout.

3.5. Sensors’ Selectivity

The various interference attitudes that can present in the matrices during caffeine determination was investigated. The selectivity of the caffeine sensor was evaluated using the method presented by Bakker [i.e., the modified separate solution method (MSSM)] [65]. Different interfering species were tested which can coexist with caffeine in either its pharmaceutical forms or biological fluids. Among these species, there are salts of Na+, K+, Mg2+, and Ca2+ as cationic species. In addition, amino acids (alanine, arginine, and glycine), sugars (glucose and lactose), nicotine, chlorpheniramine, ephedrine, codeine, paracetamol, creatinine, camylofine and aspirin were added. The selectivity coefficients (log K potcaffeine, J) were calculated and are shown in Table 2. It was shown that there is no significant interference from the interfering ions on the potentiometric response of the presented sensor. The sensors offered high selectivity and high efficiency towards the determination of caffeine in real samples.

3.6. Chronopotentiometry and Electrochemical Impedance Spectroscopy (EIS) Measurements

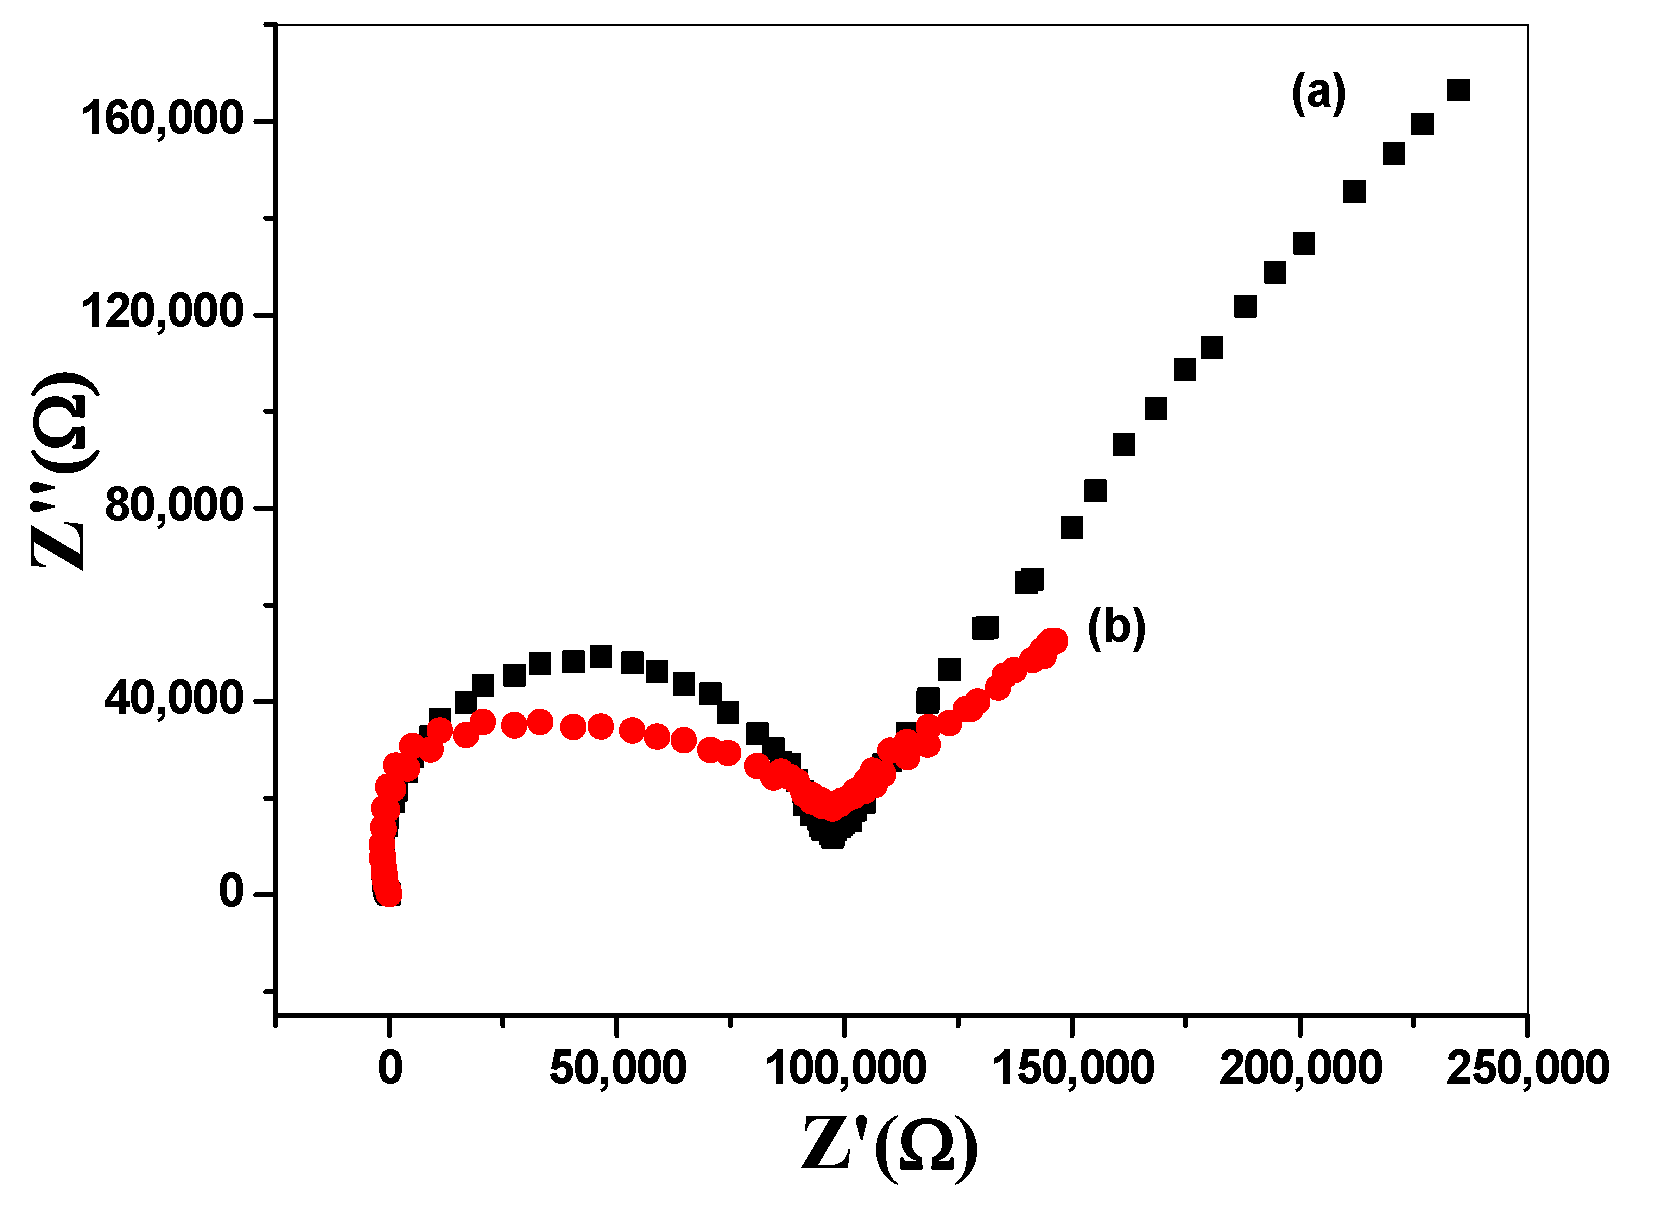
To evaluate the double-layer capacitance and membrane resistance, EIS measurements were carried out. The measurements were performed by using a one-compartment three-electrode cell using (NOVA 2.0 software; Metrohm Auto lap B.V. Utrecht, The Netherlands) attached with a reference electrode (Ag/AgCl/KCl (3 M) and Pt auxiliary electrode. The applied frequency range starts from 100 kHz to 0.1 Hz using a sinusoidal excitation signal with excitation amplitude of 10 mV. The applied method was carried out by using a solution of 10−3 M of caffeine in a 50 mM MES buffer, pH 5. As shown in Figure 7, the method exhibited the Nyquist plots (complex plane plots of –Z\\ vs. Z\) on the equivalent circuit models. The bulk resistance (Rb) of both the modified and non-modified electrodes were 0.1 ± 0.03 and 0.09 ± 0.0002 MΩ, respectively. The double-layer capacitances (Cdl) were measured at the low-frequency branch (semicircle) for both the modified and non-modified sensors and were found to be 9.3 ± 1.1 and 22.5 ± 1.4 µF, respectively.
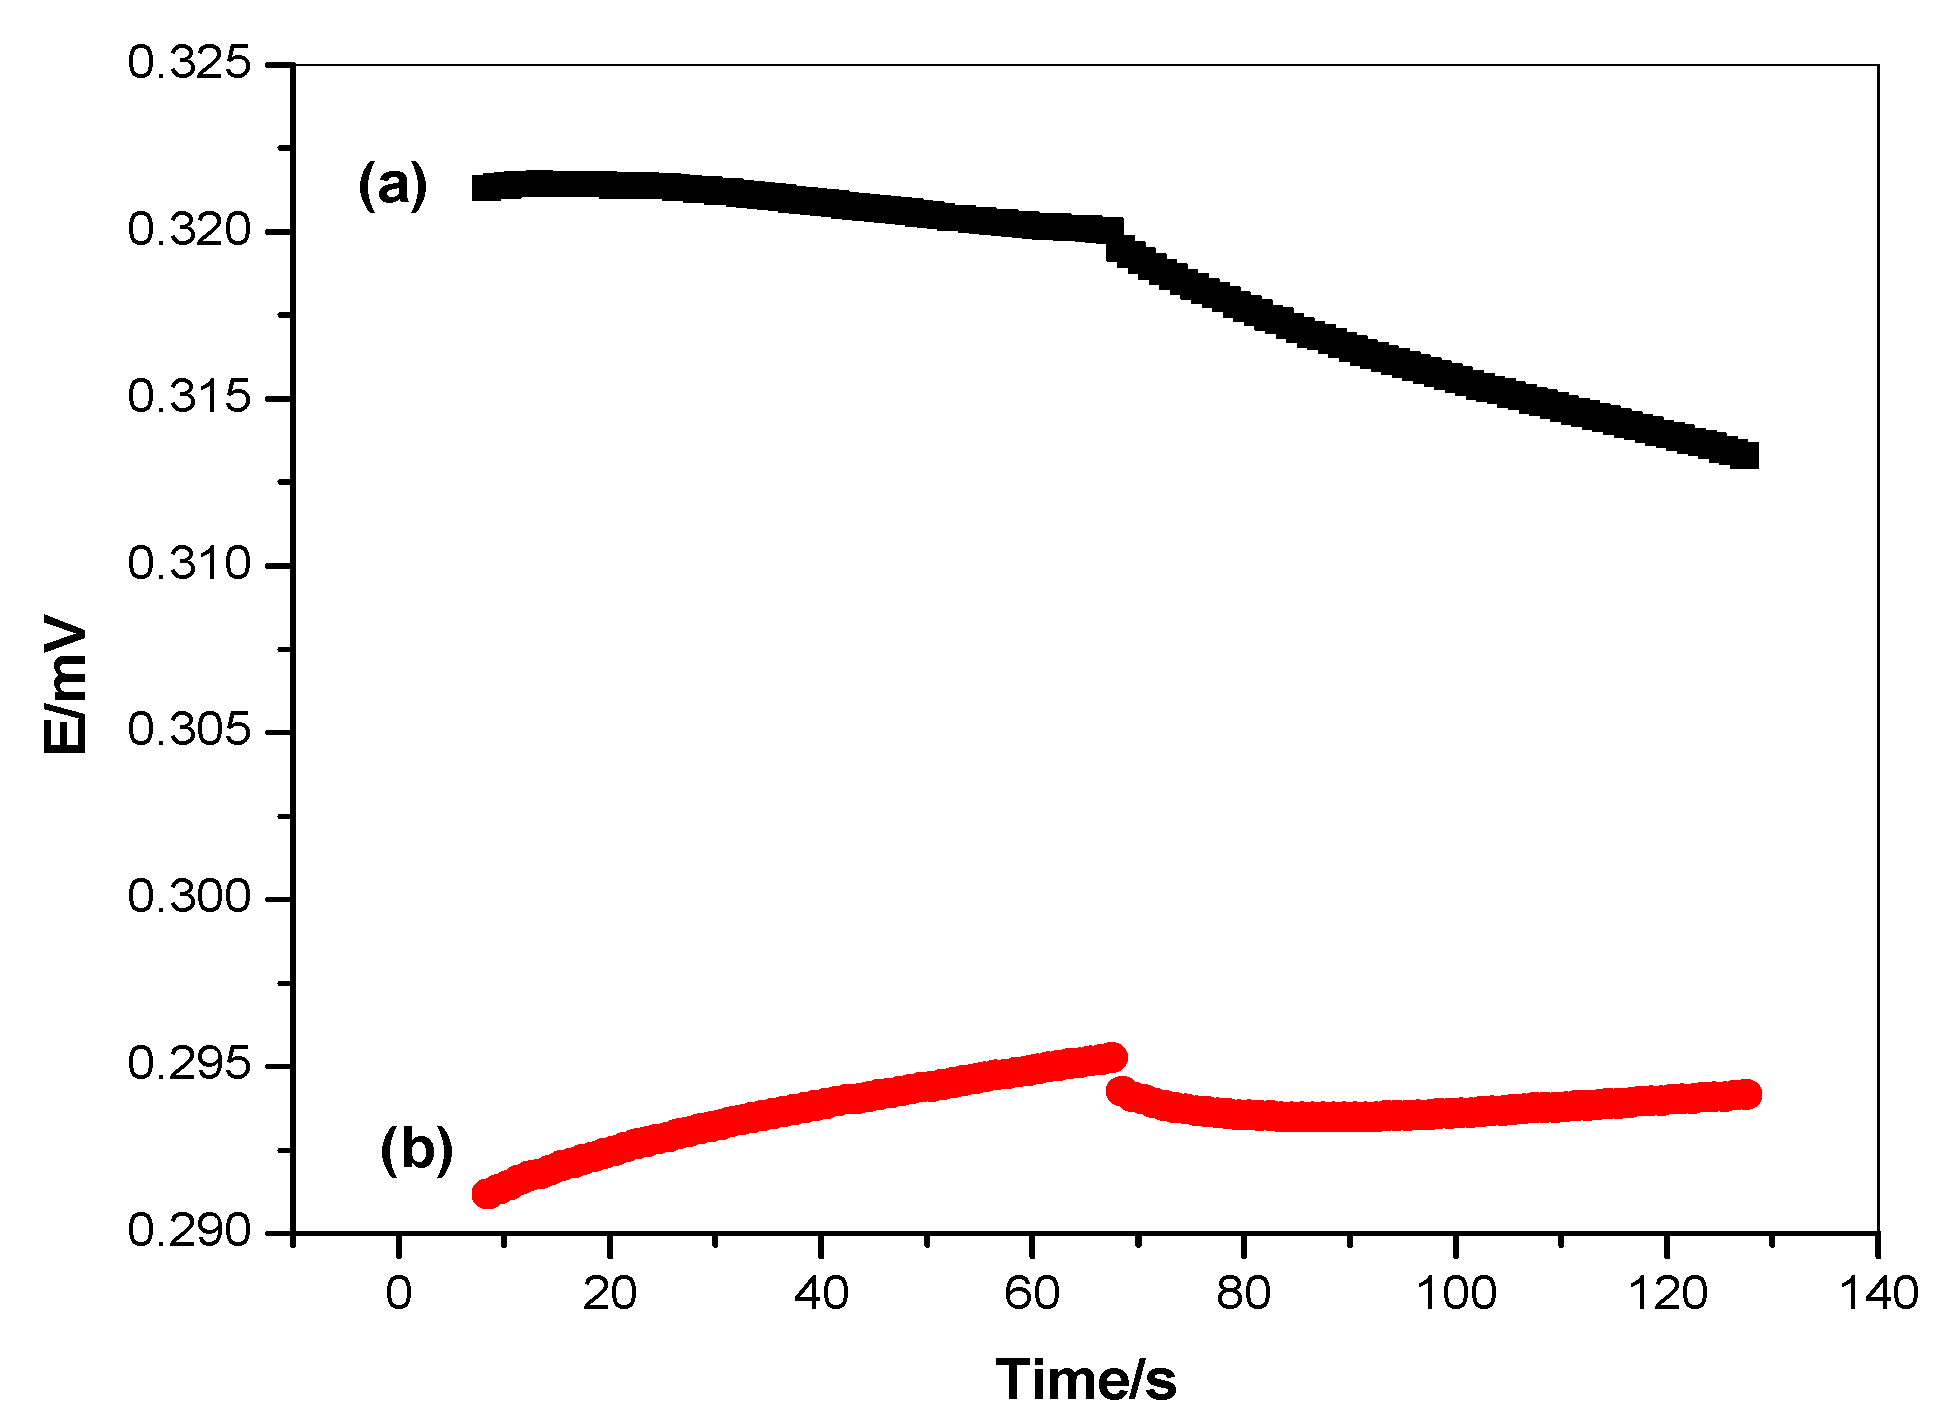
Short-term potential stability was evaluated via reverse-current chronopotentiometric measurements suggested by Bobacka [66]. The applied current was ± 1nA in both the anodic and cathodic directions for 60 s. The chronopotentiograms for both modified and non-modified sensors are shown in Figure 8. The potential drift (∆E/∆t) was found to be 97.7 and 41.6 µV/s for both the non-modified and modified caffeine sensors, respectively. These data show the incredibly increasing potential stability in the presence of the transducers. The capacitance double-layer [CL = I/(∆E/∆t)] was 10.2 ± 0.5 and 24.2 ± 0.7 µF for both the non-modified and modified caffeine sensors, respectively. All data obtained via the EIS and chronopotentimetric measurements reflect the effect of the lipophilicity of the solid-contact transducing material and the highest double-layer capacitance formed upon the insertion of the rGO layer between the ion-sensing membrane and the electronic conductor substrate. The results confirmed that the rGO based sensor type revealed high potential stability, good conductivity, and high compatibility with the caffeine membrane-based sensor for the determination of caffeine in its matrices.

3.7. Water-Layer Test

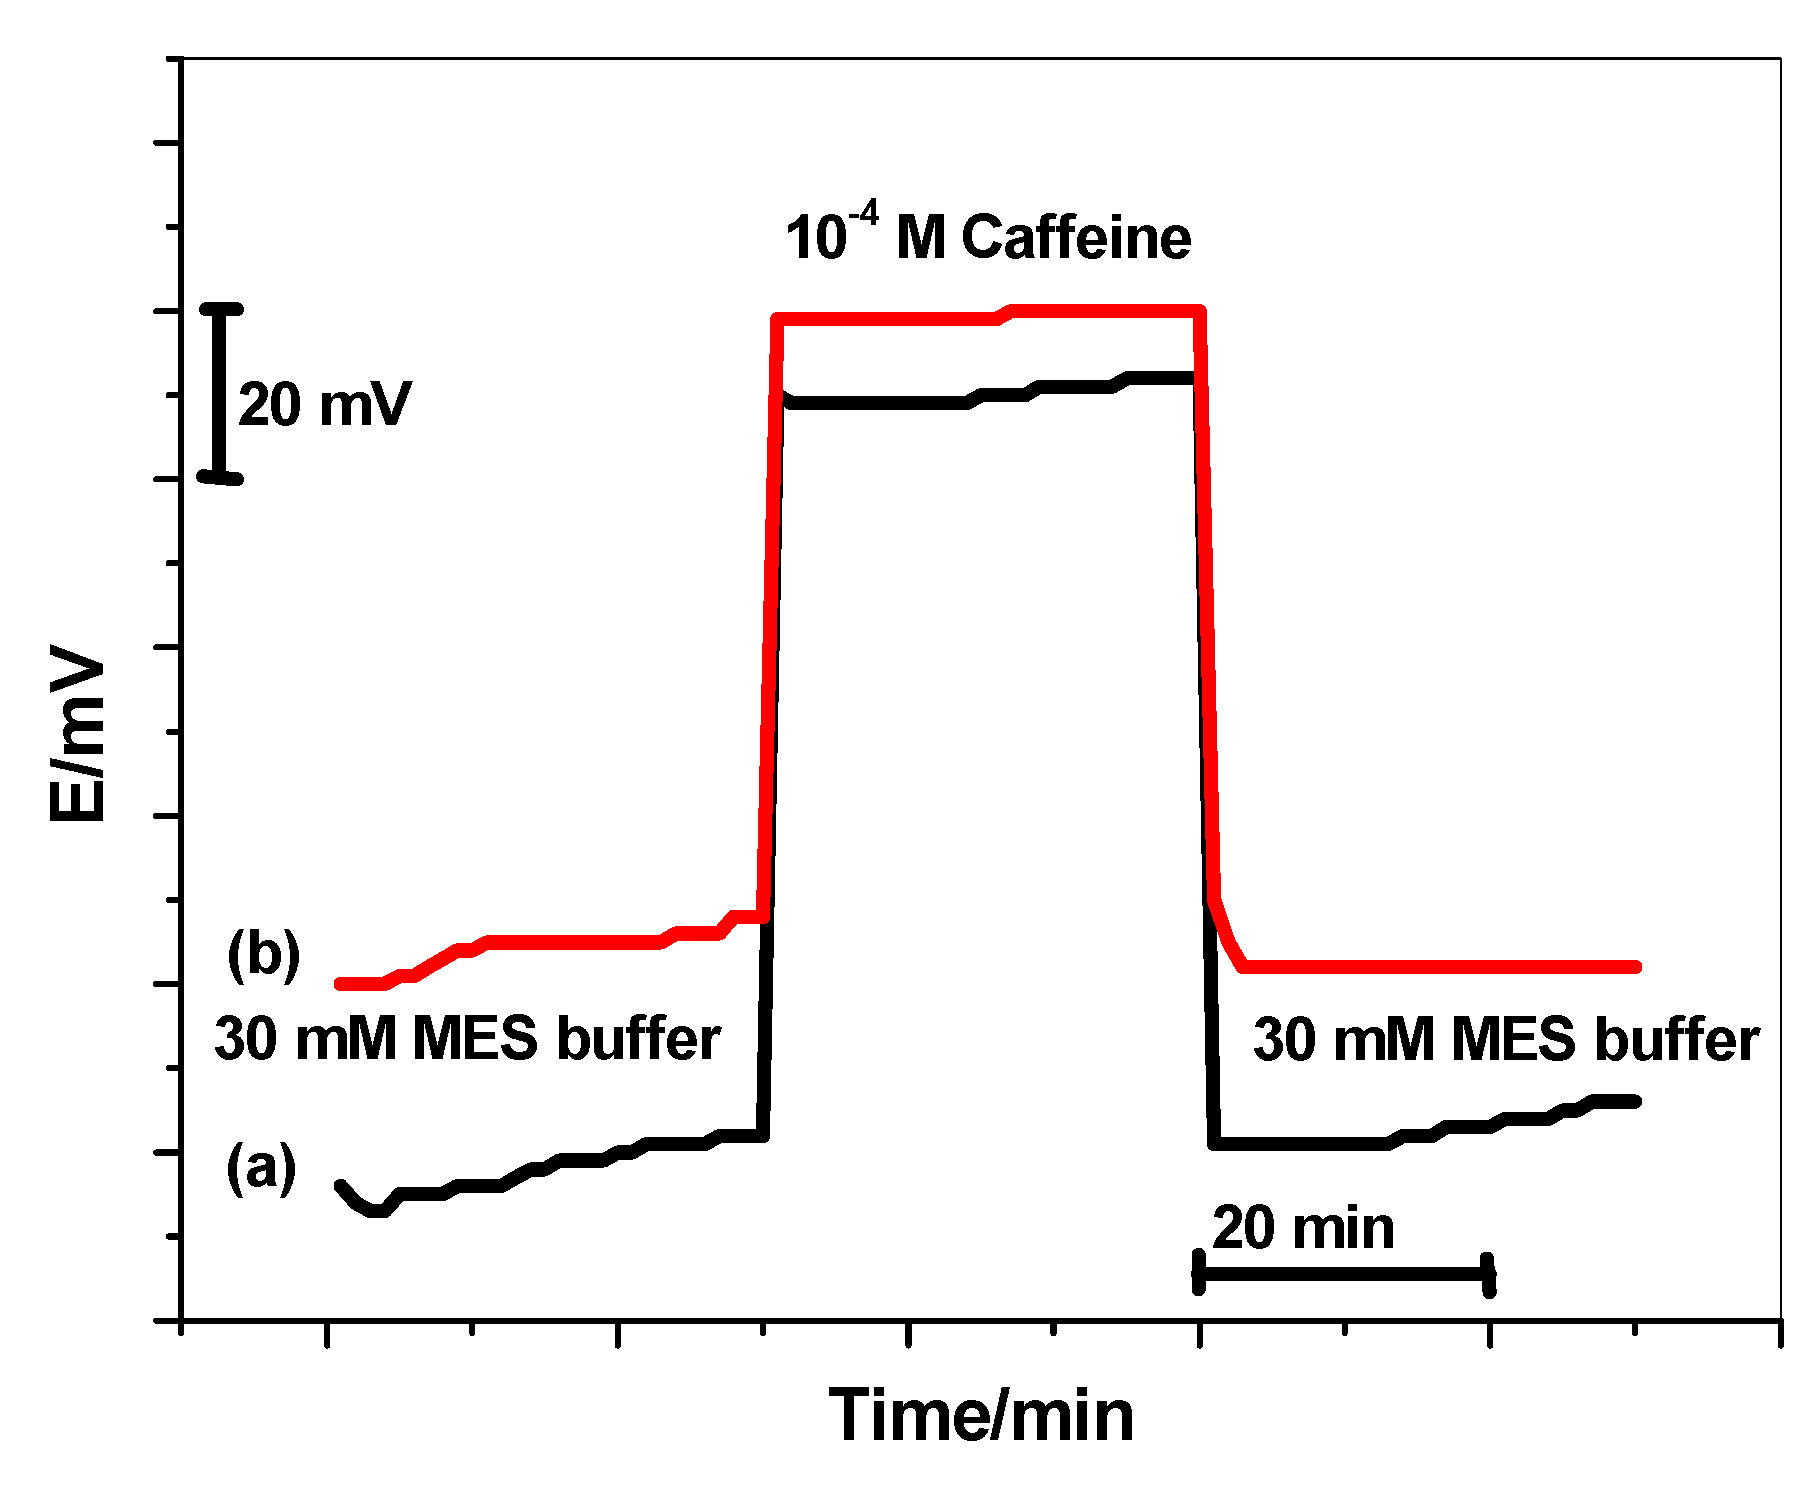
The prejudicial effect to the potential stability and lifetime of the proposed sensor was also investigated. The test was applied with both the sensors present and absent in the solid-contact materials. The sensors were first immersed in 30 mM of the MES buffer (pH 5) for 30 min and the potential was recorded during this interval of time. After that, they were immersed in 10−4 M of caffeine for another 30 min. and finally, they were immersed again in 30 mM of MES buffer (pH 5) for a further 30 min. As shown in Figure 9, there is an enhanced potential-stability for caffeine sensors when they were modified with the lipophilic rGO layer. There is a potential drift for the non-modified sensors. This reflects the existence of water-layer formation between the ion-sensing membrane and the electronic-conducting substrate.

3.8. Caffeine Assay in Different Pharmaceutical Formulations

Caffeine is present in different pharmaceutical dosages like tablets and capsules. For caffeine stock preparation, 10 tablet contents were weighed and the mean weight of the active ingredient was calculated per one tablet. The accurate weight of the powder corresponding to 0.194 g of caffeine was dissolved in 100 mL 50 mM MES buffer, pH 5 to obtain 10−2 M caffeine stock. The solution mixture was sonicated for 1 h to ensure complete dissolution of the active ingredient. The solution was filtered and was diluted to several concentrations of caffeine (10−3–10−5 M). After constructing the calibration plot, the potential recorded for these samples was introduced to the regression equation of the calibration curve and the amount of caffeine was then calculated.
As shown in Table 3, the recoveries of caffeine measurements by using the proposed potentiometric method were of the range 95.2 to 106.5%. The results obtained were compared with those obtained by the HPLC standard method [67]. The recoveries of this method were of the range 99.0 to 100.8%. F and t-student tests were utilised for the two methods and revealed no significant difference between them, confirming the successful applicability of the proposed sensor for the determination of caffeine.

4. Conclusions

A new potentiometric method of caffeine determination in its solutions is presented through screen-printed carbon electrodes, modified with reduced graphene oxide (rGO) which were used for the fabrication of the sensors. Tailored caffeine-imprinted polymers (MIPs) were synthesized using methacrylic acid (MAA) monomer and this has been used as an electroactive receptor for caffeine. The sensors revealed a Nernstian response with a slope of 51.2 ± 0.9 mV/decade (n = 6, R2 = 0.997) over the linear range of 4.5 × 10⁻⁶–1.0 × 10⁻³ M with a detection limit of 3.0 × 10⁻⁶ M. They exhibited fast detection of caffeinium ions with a response less than 5 s response time (<5 s). EIS and chronopotentiometric measurements were used to evaluate the potential-stability and double-layer capacity of the presented modified sensor. The double layer and potential drift of rGO based sensor were 24.2 ± 0.7 µF and 41.6 µV/s, respectively. The application to caffeine assessment in different pharmaceutical formulations was also successfully carried out. This reflects that the presented analytical device can be considered as an attractive tool for caffeine determination due to its affordability and vast availability, particularly when combined with potentiometric detection.

Author Contributions

The listed authors contributed to this work as follows: H.S.M.A.-R. and A.H.K. provided the concepts of the work, interpreted the results, performed the experimental part, and prepared the manuscript; A.H.K., H.S.M.A.-R., and A.E.-G.E.A. cooperated in the preparation of the manuscript; and A.H.K. and H.S.M.A.-R. performed the revision before submission. A.A.A. and A.M.N. obtained the financial support for the work. All authors have read and agreed to the published version of the manuscript.

Funding

This research was funded by the Deanship of Scientific Research, King Saud University for funding through Vice Deanship of Scientific Research Chairs. The Deanship of Scientific Research at King Khalid University for funding this work through the Research Group Program under grant number RGP.1/286/42.

Acknowledgments

The authors are grateful to the Deanship of Scientific Research, King Saud University for funding through Vice Deanship of Scientific Research Chairs. H.S.M.A.-R. extends his appreciation to the Deanship of Scientific Research at King Khalid University for funding this work through the Research Group Program under grant number RGP.1/286/42.

Conflicts of Interest

The authors declare that there are no conflicts of interest.

References

  1. Mitchell, D.C.; Knight, C.A.; Hockenberry, J.; Teplansky, R.; Hartman, T.J. Beverage caffeine intakes in the U.S. Food Chem. Toxicol. 2014, 63, 136–142. [Google Scholar] [CrossRef] [PubMed] [Green Version]
  2. Silva, A.C.; de Oliveira Ribeiro, N.P.; de Mello Schier, A.R.; Pereira, V.M.; Vilarim, M.M.; Pessoa, T.M.; Arias-Carrión, O.; Machado, S.; Nardi, A.E. Caffeine and suicide: A systematic review. CNS Neurol. Disord. Drug Targets 2014, 13, 937–944. [Google Scholar] [CrossRef] [PubMed]
  3. Szczepanik, J.C.; de Oliveira, P.A.; de Oliveira, J.; Mack, J.M.; Engel, D.F.; Rial, D.; Moreira, E.L.G.; de Bem, A.F.; Prediger, R.D. Caffeine Mitigates the Locomotor Hyperactivity in Middle-aged Low-density Lipoprotein Receptor (LDL r)-Knockout Mice. CNS Neurosci. Ther. 2016, 22, 420–422. [Google Scholar] [CrossRef]
  4. Liszt, K.I.; Ley, J.P.; Lieder, B.; Behrens, M.; Stoger, V.; Reiner, A.; Hochkogler, C.M.; Kock, E.; Marchiori, A.; Hans, J.; et al. Caffeine induces gastric acid secretion via bitter taste signaling in gastric parietal cells. Proc. Natl. Acad. Sci. USA 2017, 114, E6260–E6269. [Google Scholar] [CrossRef] [PubMed] [Green Version]
  5. Marx, B.; Scuvee, E.; Scuvee-Moreau, J.; Seutin, V.; Jouret, F. Mechanisms of caffeine-induced diuresis. Med. Sci. 2016, 32, 485–490. [Google Scholar]
  6. Teng, C.L.; Lim, W.Y.; Chua, C.Z.; Teo, R.S.K.; Lin, K.T.H.; Yeoh, J.C. Does a single cup of caffeinated drink significantly increase blood pressure in young adults? A randomised controlled trial. Aust. Fam. Physician 2016, 45, 65. [Google Scholar] [PubMed]
  7. Sheak, K.; Richards, A.; Greene, A. 434 myocardial infarct (mi) caused by low dose of caffeine in patient with unsuspected coronary artery anomaly. J. Investig. Med. 2018, 66, A246. [Google Scholar]
  8. Abusnina, A.; Lugnier, C. Therapeutic potentials of natural compounds acting on cyclic nucleotide phosphodiesterase families. Cell. Signal. 2017, 39, 55–65. [Google Scholar] [CrossRef]
  9. Ceja-Navarro, J.A.; Vega, F.E.; Karaoz, U.; Hao, Z.; Jenkins, S.; Lim, H.C.; Kosina, P.; Infante, F.; Northen, T.R.; Brodie, E.L. Gut microbiota mediate caffeine detoxification in the primary insect pest of coffee. Nat. Commun. 2015, 6, 7618. [Google Scholar] [CrossRef] [Green Version]
  10. Abbaspour, N.; Hurrell, R.; Kelishadi, R. Review on iron and its importance for human health. J. Res. Med. Sci. Off. J. Isfahan Univ. Med. Sci. 2014, 19, 164. [Google Scholar]
  11. Hashibe, M.; Galeone, C.; Buys, S.S.; Gren, L.; Boffetta, P.; Zhang, Z.F.; La Vecchia, C. Coffee, tea, caffeine intake, and the risk of cancer in the PLCO cohort. Br. J. Cancer 2015, 113, 809–816. [Google Scholar] [CrossRef] [PubMed] [Green Version]
  12. Mejia, E.G.D.; Ramirez-Mares, M.V. Impact of caffeine and coffee on our health. Trends Endocrinol. Metab. 2014, 25, 489–492. [Google Scholar] [CrossRef] [PubMed]
  13. Fulay, A.P.; Rifas-Shiman, S.L.; Oken, E.; Perng, W. Associations of the dietary approaches to stop hypertension (DASH) diet with pregnancy complications in Project Viva. Eur. J. Clin. Nutr. 2018, 72, 1385–1395. [Google Scholar] [CrossRef] [PubMed]
  14. Korekar, G.; Kumar, A.; Ugale, C. Occurrence, fate, persistence and remediation of caffeine: A review. Environ. Sci. Pollut. Res. 2020, 27, 34715–34733. [Google Scholar] [CrossRef]
  15. Rudolph, E.; Farbinger, A.; Konig, J. Determination of the caffeine contents of various food items within the Austrian market and validation of a caffeine assessment tool (CAT). Food Addit. Contam. Part A 2012, 29, 1849–1860. [Google Scholar] [CrossRef] [PubMed]
  16. Frary, C.D.; Johnson, R.K.; Wang, M.Q. Food sources and intakes of caffeine in the diets of persons in the United States. J. Am. Diet Assoc. 2005, 105, 110–113. [Google Scholar] [CrossRef] [PubMed]
  17. Fulgoni, V.L.; Keast, D.R.; Lieberman, H.R. Trends in intake and sources of caffeine in the diets of US adults: 2001–2010. Am. J. Clin. Nutr. 2015, 101, 1081–1087. [Google Scholar] [CrossRef]
  18. Nehlig, A. Interindividual differences in caffeine metabolism and factors driving caffeine consumption. Pharmacol. Rev. 2018, 70, 384–411. [Google Scholar] [CrossRef] [Green Version]
  19. Ogawa, N.; Ueki, H. Clinical importance of caffeine dependence and abuse. Psychiatry Clin. Neurosci. 2007, 61, 263–268. [Google Scholar] [CrossRef]
  20. Jain, S.; Srivastava, A.S.; Verma, R.P.; Maggu, G. Caffeine addiction: Need for awareness and research and regulatory measures. Asian J. Psychiatry 2019, 41, 73–75. [Google Scholar] [CrossRef]
  21. Dos Santos, M.K.F.; Gavioli, E.C.; Rosa, L.S.; de Paula Soares-Rachetti, V.; Lobão-Soares, B. Craving espresso: The dialetics in classifying caffeine as an abuse drug. Naunyn Schmiedebergs Arch. Pharmcol. 2018, 391, 1301–1318. [Google Scholar] [CrossRef] [PubMed]
  22. Heinz, A.; Daedelow, L.S.; Wackerhagen, C.; Di Chiara, G. Addiction theory matters- why there is no dependence on caffeine or antidepressant medication. Addict. Biol. 2020, 25, e12735. [Google Scholar] [CrossRef] [PubMed]
  23. Ahmad Bhawani, S.; Fong, S.S.; Mohamad Ibrahim, M.N. Spectrophotometric analysis of caffeine. Int. J. Anal. Chem. 2015, 2015, 170239. [Google Scholar] [CrossRef] [PubMed] [Green Version]
  24. Katayama, M.; Taniguchi, H. Fluorometric reactions of purines and determination of caffeine. Talanta 1989, 36, 1171–1175. [Google Scholar] [CrossRef]
  25. Maeso, N.; del Castillo, C.; Cornejo, L.; García-Acicollar, M.; Alguacil, L.F.; Barbas, C. Capillary electrophoresis for caffeine and pyroglutamate determination in coffees study of the in vivo effect on learning and locomotor activity in mice. J. Pharm. Biomed. Anal. 2006, 41, 1095–1100. [Google Scholar] [CrossRef] [PubMed]
  26. Xiong, J.; Chen, J.; He, M.; Hu, B. Simultaneous quantification of amphetamines, caffeine and ketamine in urine by hollow fiber liquid phase microextraction combined with gas chromatography-flame ionization detector. Talanta 2010, 82, 969–975. [Google Scholar] [CrossRef] [PubMed]
  27. Ponce-Rodríguez, H.D.; García-Robles, A.A.; Sáenz-González, P.; Verdú-Andrés, J.; Campíns-Falcó, P. On-line in-tube solid phase microextraction coupled to capillary liquid chromatography-diode array detection for the analysis of caffeine and its metabolites in small amounts of biological samples. J. Pharm. Biomed. Anal. 2020, 178, 112914. [Google Scholar] [CrossRef]
  28. Mizuno, A.; Uematsu, T.; Gotoh, S.; Katoh, E.; Nakashima, M. The measurement of caffeine concentration in scalp hair as an indicator of liver function. J. Pharm. Pharmcol. 1996, 48, 660–664. [Google Scholar] [CrossRef]
  29. Dussy, F.; Carson, N.; Hangartner, S.; Briellmann, T. Is one hair lock really representative? Drug Testing Anal. 2014, 6 (Suppl. 1), 5–8. [Google Scholar] [CrossRef] [Green Version]
  30. Meier, U.; Briellmann, T.; Scheurer, E.; Dussy, F. Distribution pattern of ethyl glucuronide and caffeine concentrations over the scalp of a single person in a forensic context. Drug Test. Anal. 2017, 9, 1594–1603. [Google Scholar] [CrossRef]
  31. De Kesel, P.M.; Lambert, W.E.; Stove, C.P. An optimized and validated SPE-LC-MS/ MS method for the determination of caffeine and paraxanthine in hair. Talanta 2015, 144, 62–70. [Google Scholar] [CrossRef] [PubMed] [Green Version]
  32. Musshoff, F.; Fels, H.; Carli, A.; Piombino-Mascali, D. The anatomical mummies of Mombello: Detection of cocaine, nicotine, and caffeine in the hair of psychiatric patients of the early 20th century. Forensic Sci. Int. 2017, 270, 20–24. [Google Scholar] [CrossRef] [PubMed]
  33. Bertol, E.; Vaiano, F.; Boscolo-Berto, R.; Fioravanti, A.; Palumbo, D.; Catalani, V.; Mari, F.; Patussi, V.; Serpelloni, G. Alcohol, caffeine, and nicotine consumption in adolescents: Hair analysis versus self-report. Am. J. Drug Alcohol Abus. 2017, 43, 341–349. [Google Scholar] [CrossRef] [PubMed]
  34. Wang, Y.H.; Mondal, G.; Butawan, M.; Bloomer, R.J.; Yates, C.R. Development of a liquid chromatography-tandem mass spectrometry (LC–MS/MS) method for characterizing caffeine, methylliberine, and theacrine pharmacokinetics in humans. J. Chromatogr. B 2020, 1155, 122278. [Google Scholar] [CrossRef] [PubMed]
  35. Jiang, S.; Zhong, Y.; Qiao, H.; Dia, B.; Chen, J.; Su, M. UPLC-MS/MS method for the simultaneous quantification of caffeine and illicit psychoactive drugs in hair using a single-step high-speed grinding extraction—Insights into a cut-off value for caffeine abuse. J. Pharm. Biomed. Anal. 2021, 209, 114489. [Google Scholar] [CrossRef]
  36. Filik, H.; Aslıhan Avan, A. Conducting polymer modified screen-printed carbon electrode coupled with magnetic solid phase microextraction for determination of caffeine. Food Chem. 2018, 242, 301–307. [Google Scholar] [CrossRef]
  37. Ashmawy, N.H.; Almehizia, A.A.; Youssef, T.A.; El-Galil, E.A.A.; Al-Omar, M.A.; Kamel, A.H. Novel Carbon/PEDOT/PSS-Based Screen-Printed Biosensors for Acetylcholine Neurotransmitter and Acetylcholinesterase Detection in Human Serum. Molecules 2019, 24, 1539. [Google Scholar] [CrossRef] [Green Version]
  38. Molaakbari, E.; Mostafavi, A.; Beitollahi, H. Simultaneous electrochemical determination of dopamine, melatonin, methionine and caffeine. Sens. Actuators B 2015, 208, 195–203. [Google Scholar] [CrossRef]
  39. Fernandes, D.M.; Silva, N.; Pereira, C.; Moura, C.; Magalhaes, J.M.; Bachiller-Baeza, B.; Rodríguez-Ramos, I.; Guerrero-Ruiz, A.; Delerue-Matos, C.; Freire, C. MnFe2O4@ CNT-N as novel electrochemical nanosensor for determination of caffeine, acetaminophen and ascorbic acid. Sens. Actuators B 2015, 218, 128–136. [Google Scholar] [CrossRef] [Green Version]
  40. Alpar, N.; Yardım, Y.; Sentürk, Z. Selective and simultaneous determination of total chlorogenic acids, vanillin and caffeine in foods and beverages by adsorptive stripping voltammetry using a cathodically pretreated boron-doped diamond electrode. Sens. Actuators B 2018, 257, 398–408. [Google Scholar] [CrossRef]
  41. Hallaj, R.; Soltani, E.; Mafakheri, S.; Ghadermazi, M. A surface-modified silicon carbide nanoparticles based electrochemical sensor for free interferences determination of caffeine in tea and coffee. Mater. Sci. Eng. B 2021, 274, 115473. [Google Scholar] [CrossRef]
  42. Kamel, A.H.; Sayour, H.E.M. Flow-through assay of quinine using solid contact potentiometric sensors based on molecularly imprinted polymers. Electroanalysis 2009, 21, 2701–2708. [Google Scholar] [CrossRef]
  43. Guerreiro, J.R.L.; Kamel, A.H.; Sales, M.G.F. FIA potentiometric system based on periodate polymeric membrane sensors for the assessment of ascorbic acid in commercial drinks. Food Chem. 2010, 120, 934. [Google Scholar] [CrossRef] [Green Version]
  44. Kamel, A.H.; Galal, H.R.; Hana, A.A. Novel planar chip biosensors for potentiometric immunoassay of acid phosphatase activity based on the use of ion association complexes as novel electroactive materials. Int. J. Electrochem. Sci. 2014, 9, 5776–5787. [Google Scholar]
  45. Kamel, A.H.; Amr, A.E.; Galal, H.R.; Al-Omar, M.A.; Almehizia, A.A. Screen-Printed Sensor Based on Potentiometric Transduction for Free Bilirubin Detection as a Biomarker for Hyperbilirubinemia Diagnosis. Chemosensors 2020, 8, 86. [Google Scholar] [CrossRef]
  46. Hassan, S.S.M.; Elnemma, E.M.; Mohamed, A.H. Novel biomedical sensors for flow injection potentiometric determination of creatinine in human serum. Electroanalysis 2005, 17, 2246–2253. [Google Scholar] [CrossRef]
  47. Abdalla, N.S.; Youssef, M.A.; Algarni, H.; Awwad, N.S.; Kamel, A.H. All Solid-State Poly (Vinyl Chloride) Membrane Potentiometric Sensor Integrated with Nano-Beads Imprinted Polymers for Sensitive and Rapid Detection of Bispyribac Herbicide as Organic Pollutant. Molecules 2019, 24, 712. [Google Scholar] [CrossRef] [Green Version]
  48. Kamel, A.H.; Kalifa, M.E.; Abd El-Maksoud, S.A.; Elgendy, F.A. Fabrication of novel sensors based on a synthesized acyclic pyridine derivative ionophore for potentiometric monitoring of copper. Anal. Methods 2014, 6, 7814–7822. [Google Scholar] [CrossRef]
  49. Hassan, S.S.M.; Amr, A.E.; Elbehery, N.H.A.; Al-Omar, M.A.; Kamel, A.H. Non-equilibrium potential responses towards neutral orcinol using all-solid-state potentiometric sensors integrated with molecularly imprinted polymers. Polymers 2019, 11, 1232. [Google Scholar] [CrossRef] [Green Version]
  50. Kamel, A.H.; Galal, H.R. MIP-Based Biomimetic Sensors for Static and Hydrodynamic Potentiometric Transduction of Sitagliptin in Biological fluids. Int. J. Electrochem. Sci. 2014, 9, 4361–4373. [Google Scholar]
  51. Yan, R.; Qiu, S.; Tong, L.; Qian, Y. Review of progresses on clinical applications of ion selective electrodes for electrolytic ion tests: From conventional ISEs to graphene-based ISEs. Chem. Speciat. Bioavailab. 2016, 28, 72–77. [Google Scholar] [CrossRef] [Green Version]
  52. Cuartero, M.; Crespo, G.A. All-solid-state potentiometric sensors: A new wave for in situ aquatic research. Curr. Opin. Electrochem. 2018, 10, 98–106. [Google Scholar] [CrossRef]
  53. Yin, T.; Qin, W. Applications of nanomaterials in potentiometric sensors. Trends Anal. Chem. 2013, 51, 79–86. [Google Scholar] [CrossRef]
  54. Kamel, A.H.; Amr, A.E.; Al-Omar, M.A.; Almehizia, A.A. Solid-State Membrane Sensors Based on Man-Tailored Biomimetic Receptors for Selective Recognition of Isoproturon and Diuron Herbicides. Membranes 2020, 10, 279. [Google Scholar] [CrossRef] [PubMed]
  55. Abd-Rabboh, H.S.M.; Kamel, A.H. Novel potentiometric screen-printed carbon electrodes for bisphenol S detection in commercial plastic samples. Anal. Sci. 2020, 36, 1359–1364. [Google Scholar] [CrossRef] [PubMed]
  56. Abd-Rabboh, H.S.M.; Amr, A.E.; Almehizia, A.A.; Kamel, A.H. Paper-Based Potentiometric Device for Rapid and Selective Determination of Salicylhydroxamate as a Urinary Struvite Stone Inhibitor. ACS Omega 2021, 6, 27755–27762. [Google Scholar] [CrossRef]
  57. Ye, L.; Haupt, K. Molecularly imprinted polymers as antibody and receptor mimics for assays, sensors and drug discovery. Anal. Bioanal. Chem. 2004, 378, 1887–1897. [Google Scholar] [CrossRef]
  58. Özcan, N.; Karaman, C.; Atar, N.; Karaman, O.; Yola, M.L. A Novel Molecularly Imprinting Biosensor Including Graphene Quantum Dots/Multi-Walled Carbon Nanotubes Composite for Interleukin-6 Detection and Electrochemical Biosensor Validation. ECS J. Solid State Sci. Technol. 2020, 9, 121010. [Google Scholar] [CrossRef]
  59. Karimi-Maleh, H.; Yola, M.L.; Atar, N.; Orooji, Y.; Karimi, F.; Kumar, P.S.; Rouhi, J.; Baghayeri, M. A novel detection method for organophosphorus insecticide fenamiphos: Molecularly imprinted electrochemical sensor based on core-shell Co3O4@MOF-74 nanocomposite. J. Colloid Interface Sci. 2021, 592, 174–185. [Google Scholar] [CrossRef]
  60. Karaman, C.; Karaman, O.; Atar, N.; Yola, M.L. A molecularly imprinted electrochemical biosensor based on hierarchical Ti2Nb10O29 (TNO) for glucose detection. Microchim. Acta 2022, 189, 24–34. [Google Scholar] [CrossRef]
  61. Özcan, A.; Atar, N.; Yola, M.L. Enhanced surface plasmon resonance (SPR) signals based on immobilization of core-shell nanoparticles incorporated boron nitride nanosheets: Development of molecularly imprinted SPR nanosensor for anticancer drug, etoposide. Biosens. Bioelectron. 2019, 130, 293–298. [Google Scholar] [CrossRef] [PubMed]
  62. Yola, M.L.; Atar, N. Development of molecular imprinted sensor including graphitic carbon nitride/N-doped carbon dots composite for novel recognition of epinephrine. Compos. Part B Eng. 2019, 175, 107113. [Google Scholar] [CrossRef]
  63. Liang, R.N.; Song, D.A.; Zhang, R.M.; Qin, W. Potentiometric sensing of neutral species based on a uniform-sized molecularly imprinted polymer as a receptor. Angew. Chem. Int. Ed. 2010, 49, 2556–2559. [Google Scholar] [CrossRef] [PubMed]
  64. Meesters, R.; Voswinkel, S. Bioanalytical method development and validation: From the USFDA 2001 to the USFDA 2018 Guidance for Industry. J. Appl. Bioanal. 2018, 4, 67–73. [Google Scholar] [CrossRef]
  65. Bakker, E. Determination of Improved Selectivity Coefficients of Polymer Membrane Ion-Selective Electrodes by Conditioning with a Discriminated Ion. J. Electrochem. Soc. 1996, 143, L83–L85. [Google Scholar] [CrossRef]
  66. Bobacka, J. Potential stability of all-solid-state ion-selective electrodes using conducting polymers as ion-to-electron transducers. Anal. Chem. 1999, 71, 4932–4937. [Google Scholar] [CrossRef]
  67. USP-NF Standard; USP30-NF25. US Pharmacopoeial Convention, Inc.: Rockville, MD, USA, 2007.
Figure 1. Schematic design of homemade screen-printed fabrication.
Polymers 14 01942 g001
Figure 2. A schematic representation for the imprinting process.
Polymers 14 01942 g002
Figure 3. SEM images of (A) MIPs and (B) NIPs.
Polymers 14 01942 g003
Figure 4. Calibration plot for caffeine sensors in different membrane plasticizers.
Polymers 14 01942 g004
Figure 5. Response mechanisms for the SC-ISEs. Electric-double-layer (EDL) capacitance-based SC-ISEs with MWCNT and rGO as solid-contact transducer.
Polymers 14 01942 g005
Figure 6. The effect of pH on the potentiometric response of the MIP/oNPOE membrane-based sensor.
Polymers 14 01942 g006
Figure 7. EIS measurements of (a) non-modified and (b) modified caffeine-ISEs.
Polymers 14 01942 g007
Figure 8. Chronopotentiometry measurements of the applied sensor; (a) non-modified and (b) modified caffeine-ISEs.
Polymers 14 01942 g008
Figure 9. Water-layer tests for (a) non-modified, and (b) modified caffeine-ISEs.
Polymers 14 01942 g009
Table 1. The analytical features and the potentiometric response of the proposed sensors.
ParametersMIP/o,NPOEMIP/DOPMIP/DBSNIP/o,NPOE
Slope (mv/decade)51.2 ± 0.943.6 ± 0.545.4 ± 1.328.1 ± 0.9
Detection limit, (M)3.0 × 10−64.0 × 10−64.5 × 10−61.7 × 10−5
Correlation coefficient (r2)0.9970.9990.9990.997
Linear range, (mol/L)4.5 × 10−6 to 1.0 × 10−37.7 × 10−6 to 1.0 × 10−38.0 × 10−6 to 1.0 × 10−34.5 × 10−5–1.0 × 10⁻³
Response time, (s)<5<5<5<5
pH range4.3–8.54.3–8.54.3–8.54.3–8.5
Precision, (%)1.71.60.61.2
Accuracy, (%)99.099.999.499.2
Standard deviation, (mv)±2.4±2.9±1.2±2.6
Table 2. The selectivity coefficients (log K pot caffeine, J) of the proposed sensor.
Interfering Ionlog K pot caffeine, J ±SD *
K+−4.9± 0.1
Na+−5.8 ± 0.4
Mg2+−5.3 ± 0.3
Ca2+−5.2 ± 0.1
Arginine−5.1 ± 0.2
Alanine−4.3 ± 0.3
Glycine−4.6 ± 0.4
Nicotine−3.3 ± 0.2
Glucose−5.4 ± 0.1
Lactose−5.2 ± 0.4
Aspirin−3.3 ± 0.2
Codeine−3.1 ± 0.7
Paracetamol−3.4 ± 0.5
Creatinine−3.7 ± 0.1
Camylofine−2.9 ± 0.3
Ephedrine−2.4 ± 0.1
Chlorpheniramine−3.05 ± 0.3
* ±SD (standard deviation) (n = 3).
Table 3. Caffeine assessment in different pharmaceutical formulations using the proposed caffeine-based sensor.
Pharmaceutical Product and SourceNominal Content Taken, mg/TabletFound, mg/Tablet ab F-Testb t-Student Test
Proposed MethodRecovery%
±SD
Reference Method
[67]
Recovery%
±SD
Pirafene caffeine, Memphis Co., Egypt2021.3 ± 0.6106.5 ± 0.420.1 ± 0.4100.5 ± 0.52.21.6
Allergex caffeine, Eipico Co., Egypt5048.9 ± 0.997.8 ± 0.649.5 ± 0.599.0 ± 0.79.30.3
Alertin, Pharco Co., Egypt2019.5 ± 2.297.5 ± 1.519.8 ± 0.299.0 ± 0.92.63.6
Vegaskine d, Alexandria Co., Egypt2523.8 ± 1.395.2 ± 1.125.2 ± 0.7100.8 ± 0.26.72.2
a Mean of three replicate measurements ± standard deviation (SD), b F and t-Student tests at 95% confidence level values are 19.00 and 4.3, respectively.
Publisher’s Note: MDPI stays neutral with regard to jurisdictional claims in published maps and institutional affiliations.