
One-Pot Synthesis of SnO2-rGO Nanocomposite for Enhanced Photocatalytic and Anticancer Activity


 , ,
, ,  and
and 
Abstract
:1. Introduction
2. Experimental Section
2.1. Materials and Reagents
2.2. Synthesis of Graphene Oxide and Reduced Graphene Oxide
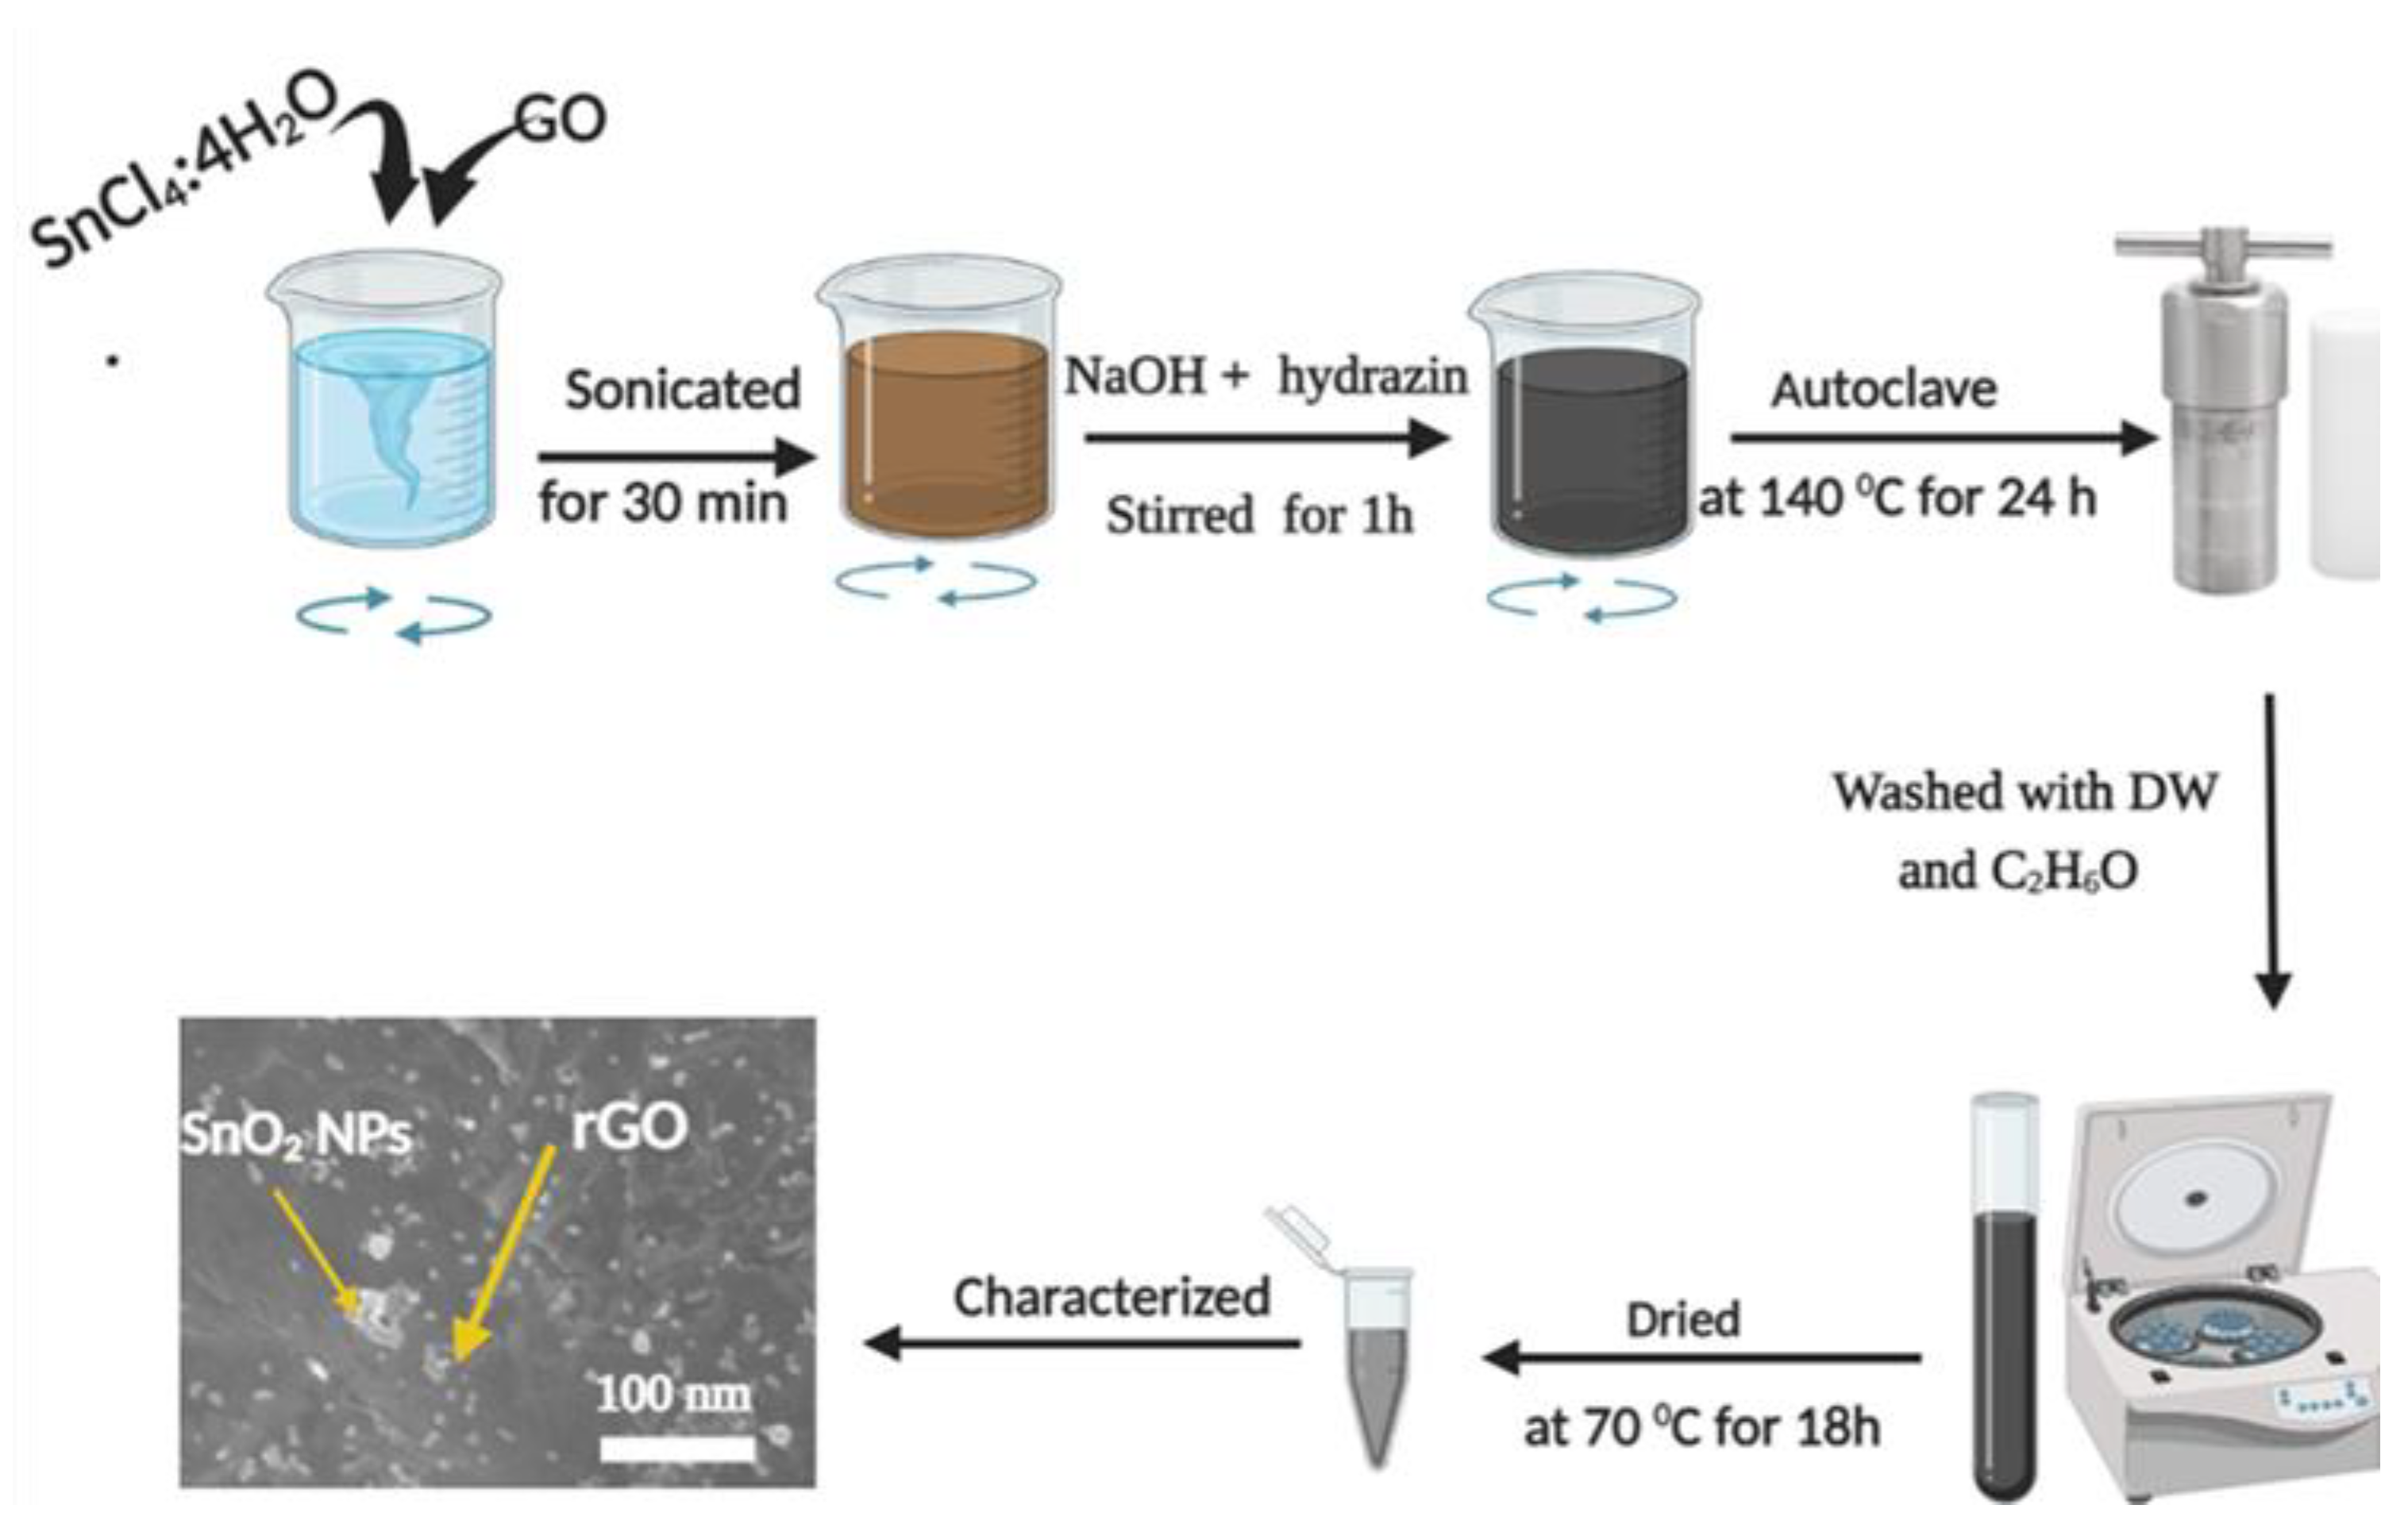
2.3. Synthesis of SnO2-rGO Nanocomposites
2.4. Characterization Techniques
2.5. Cell Culture
2.6. Exposure Protocol
2.7. Cell Viability
2.8. Photocatalytic Evaluation
3. Results and Discussion
3.1. Crystallographic Study
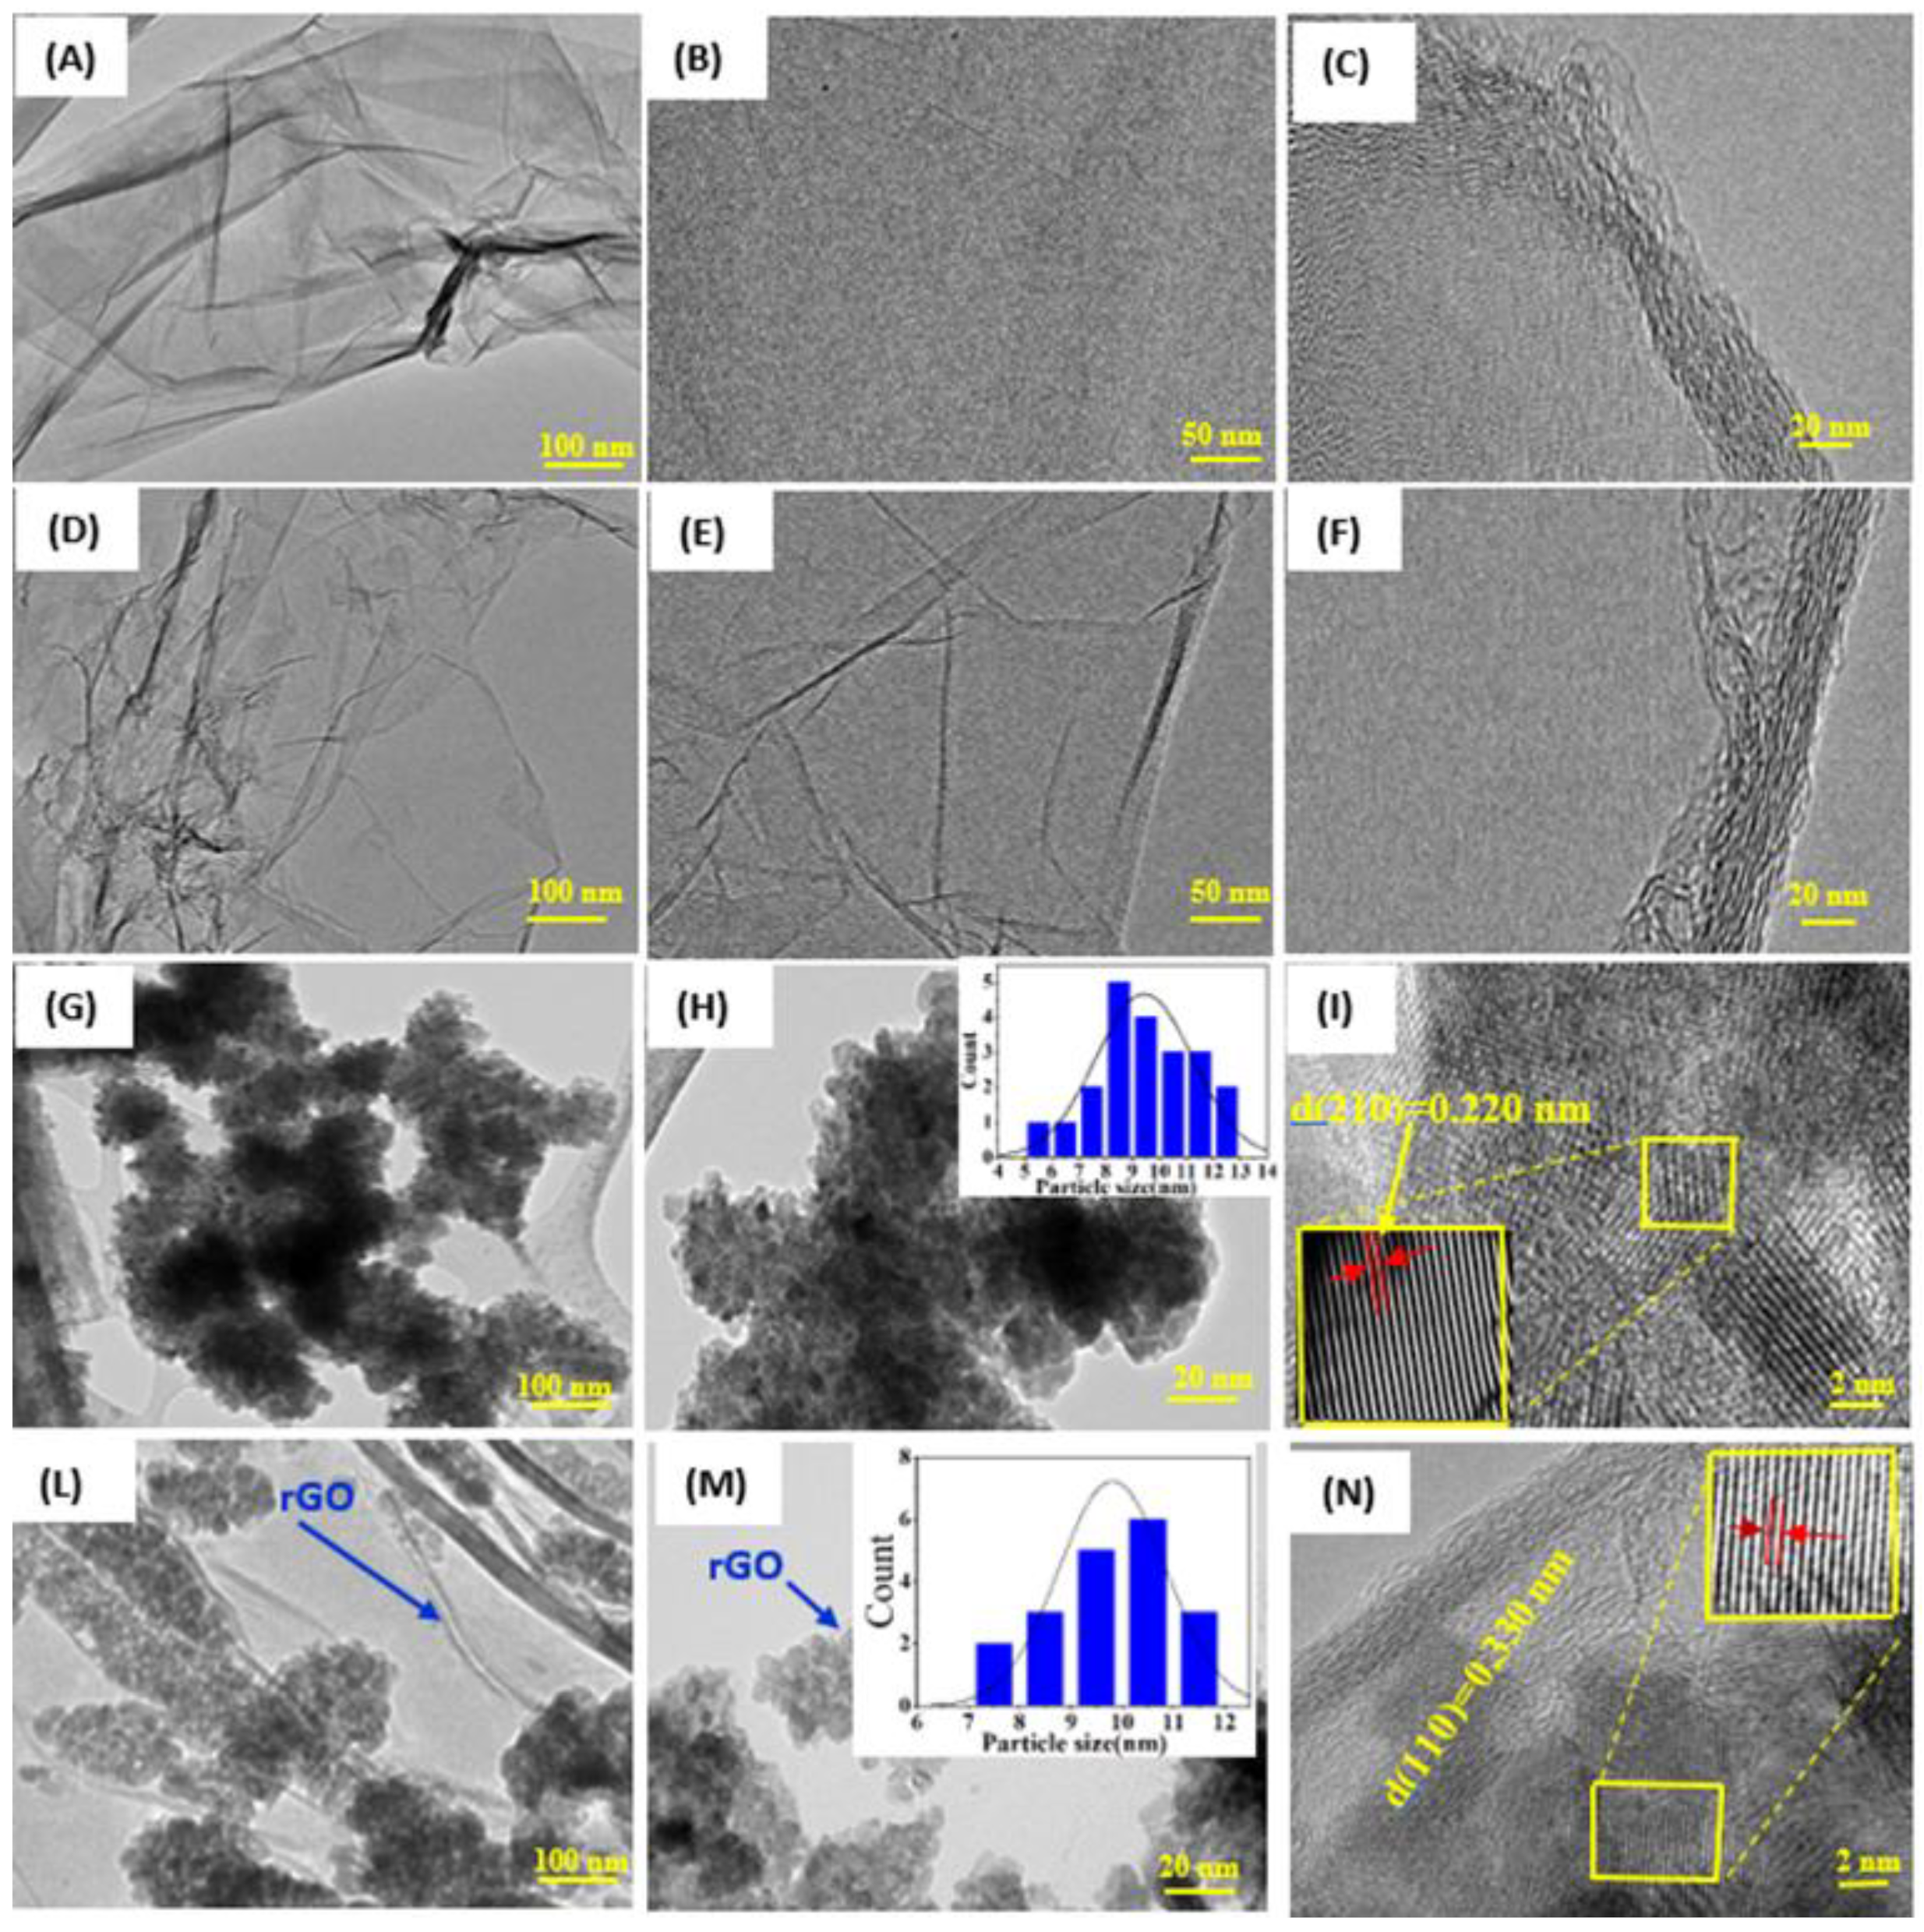
3.2. Morphological Study
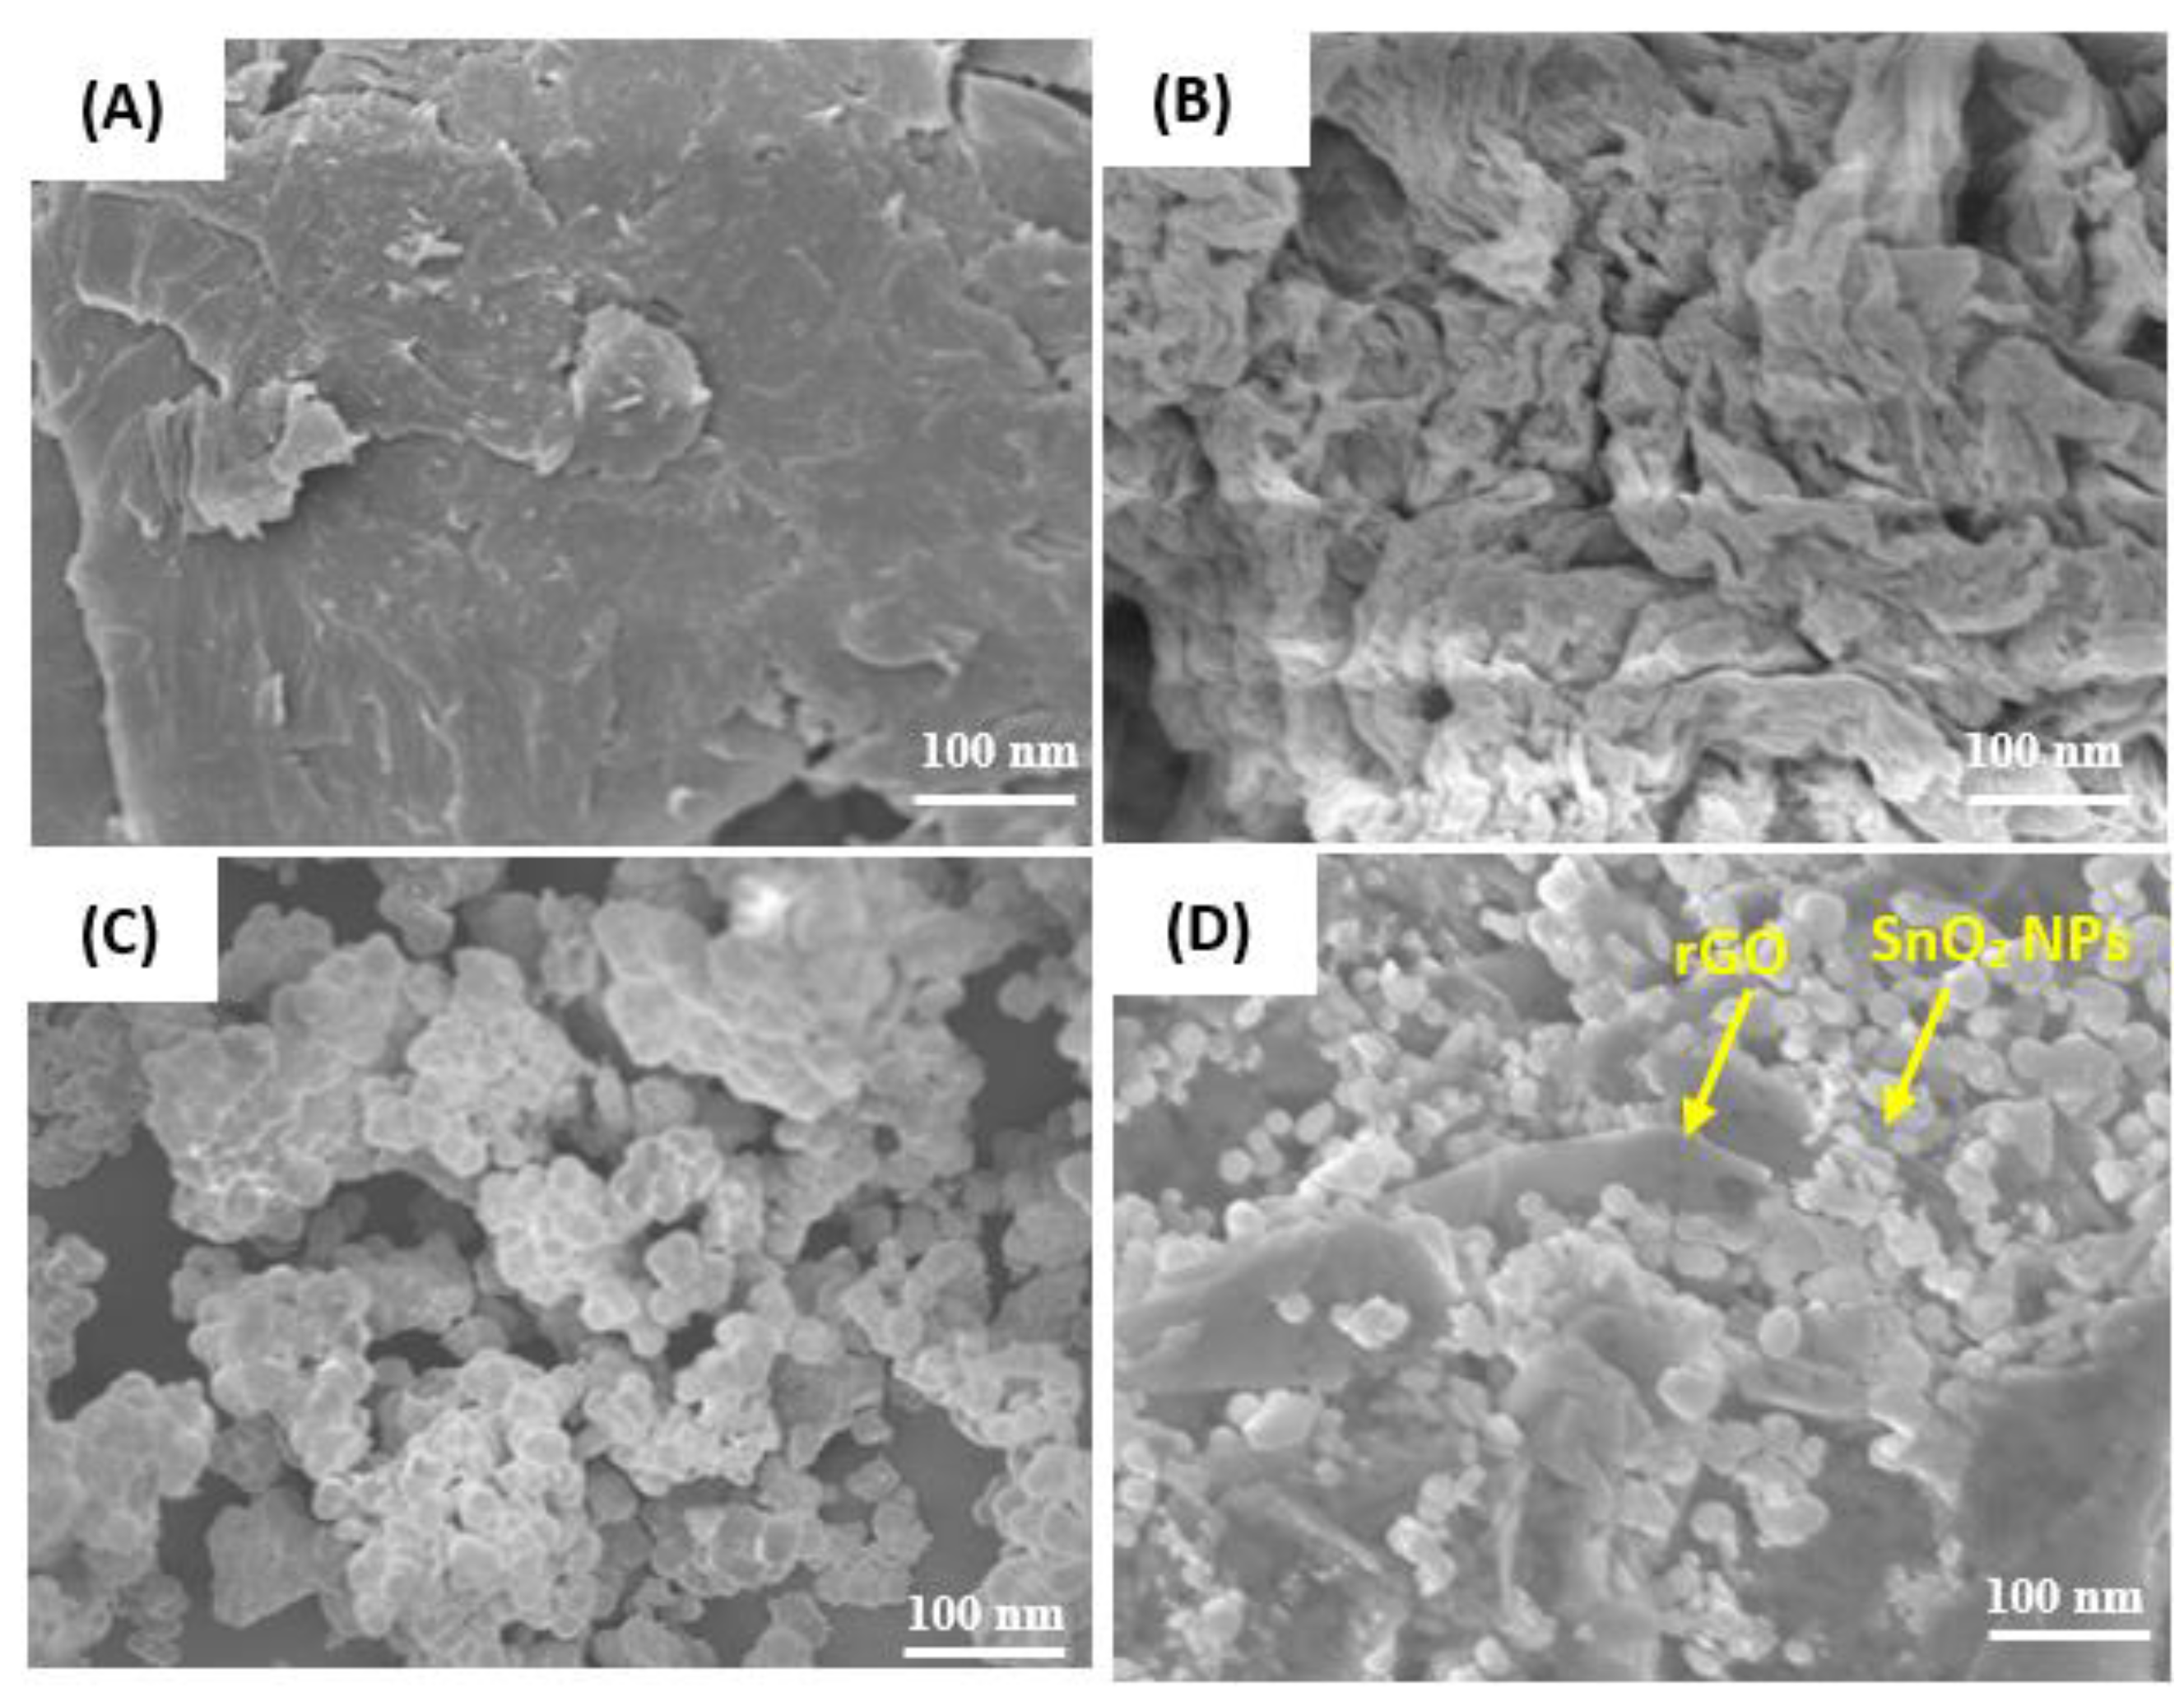
3.3. SEM Study
3.4. XPS Study
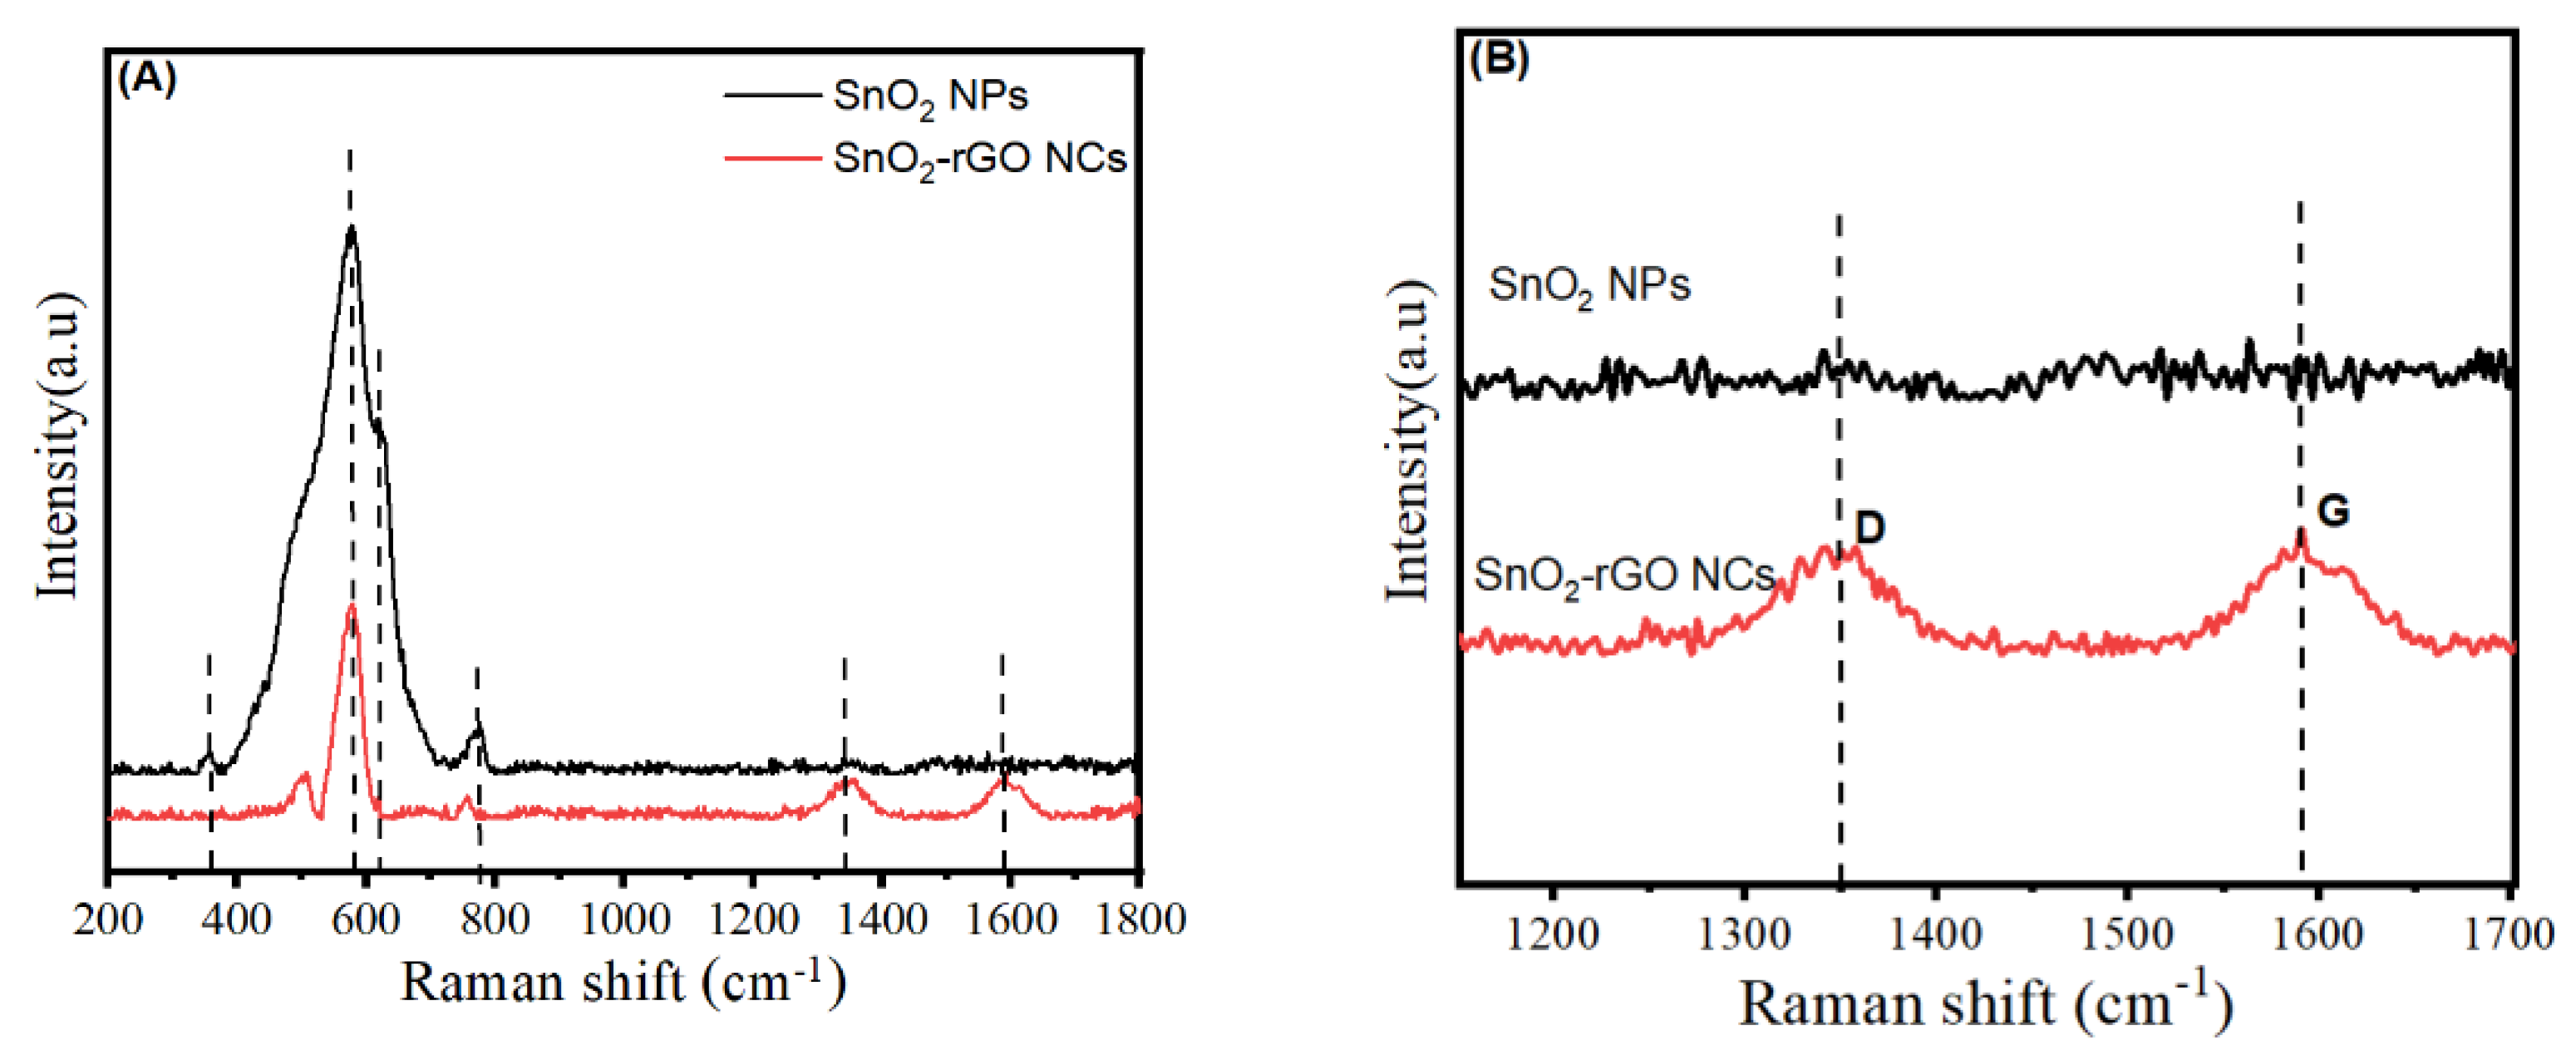
3.5. Raman Analysis
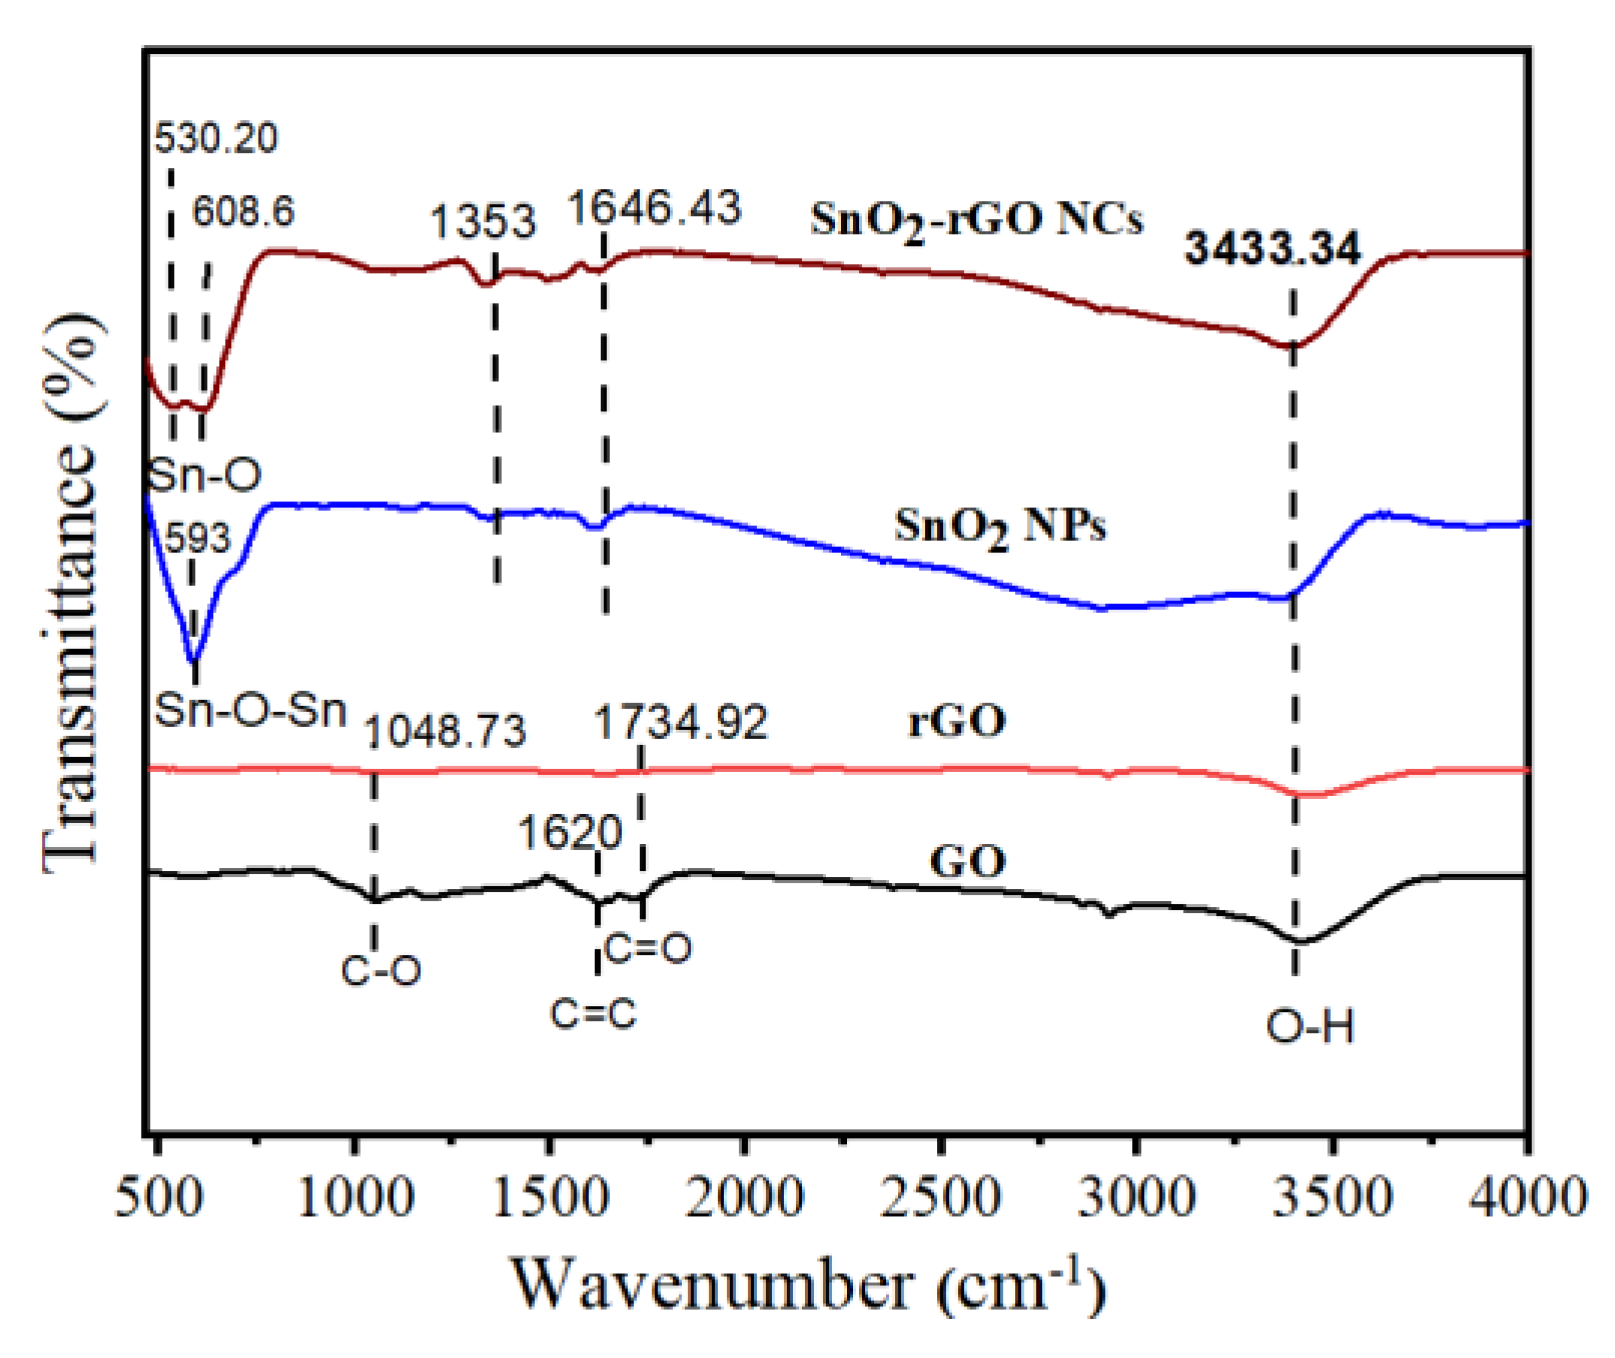
3.6. FTIR Study
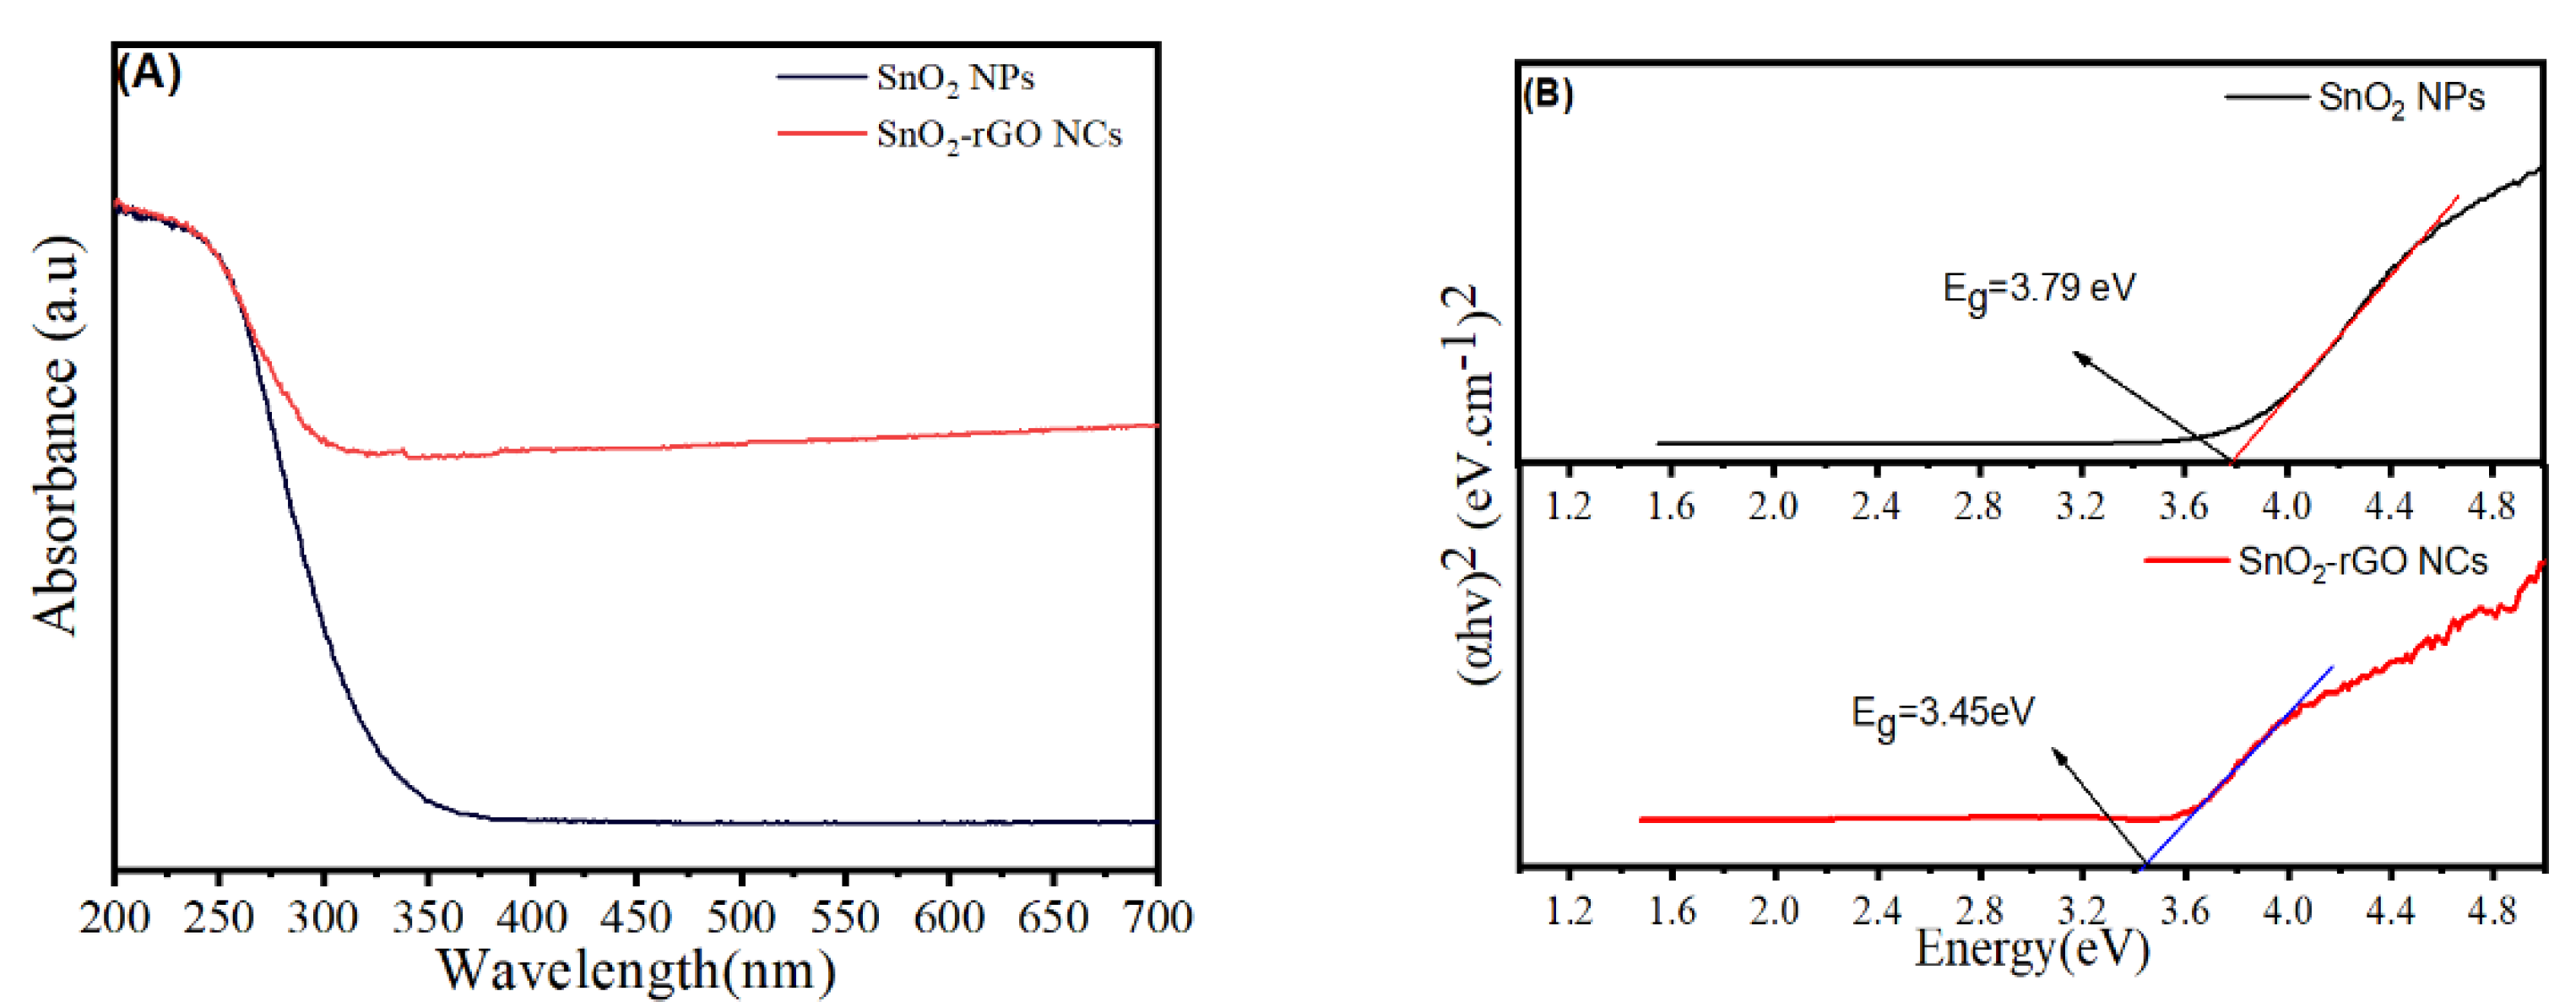
3.7. Optical Study
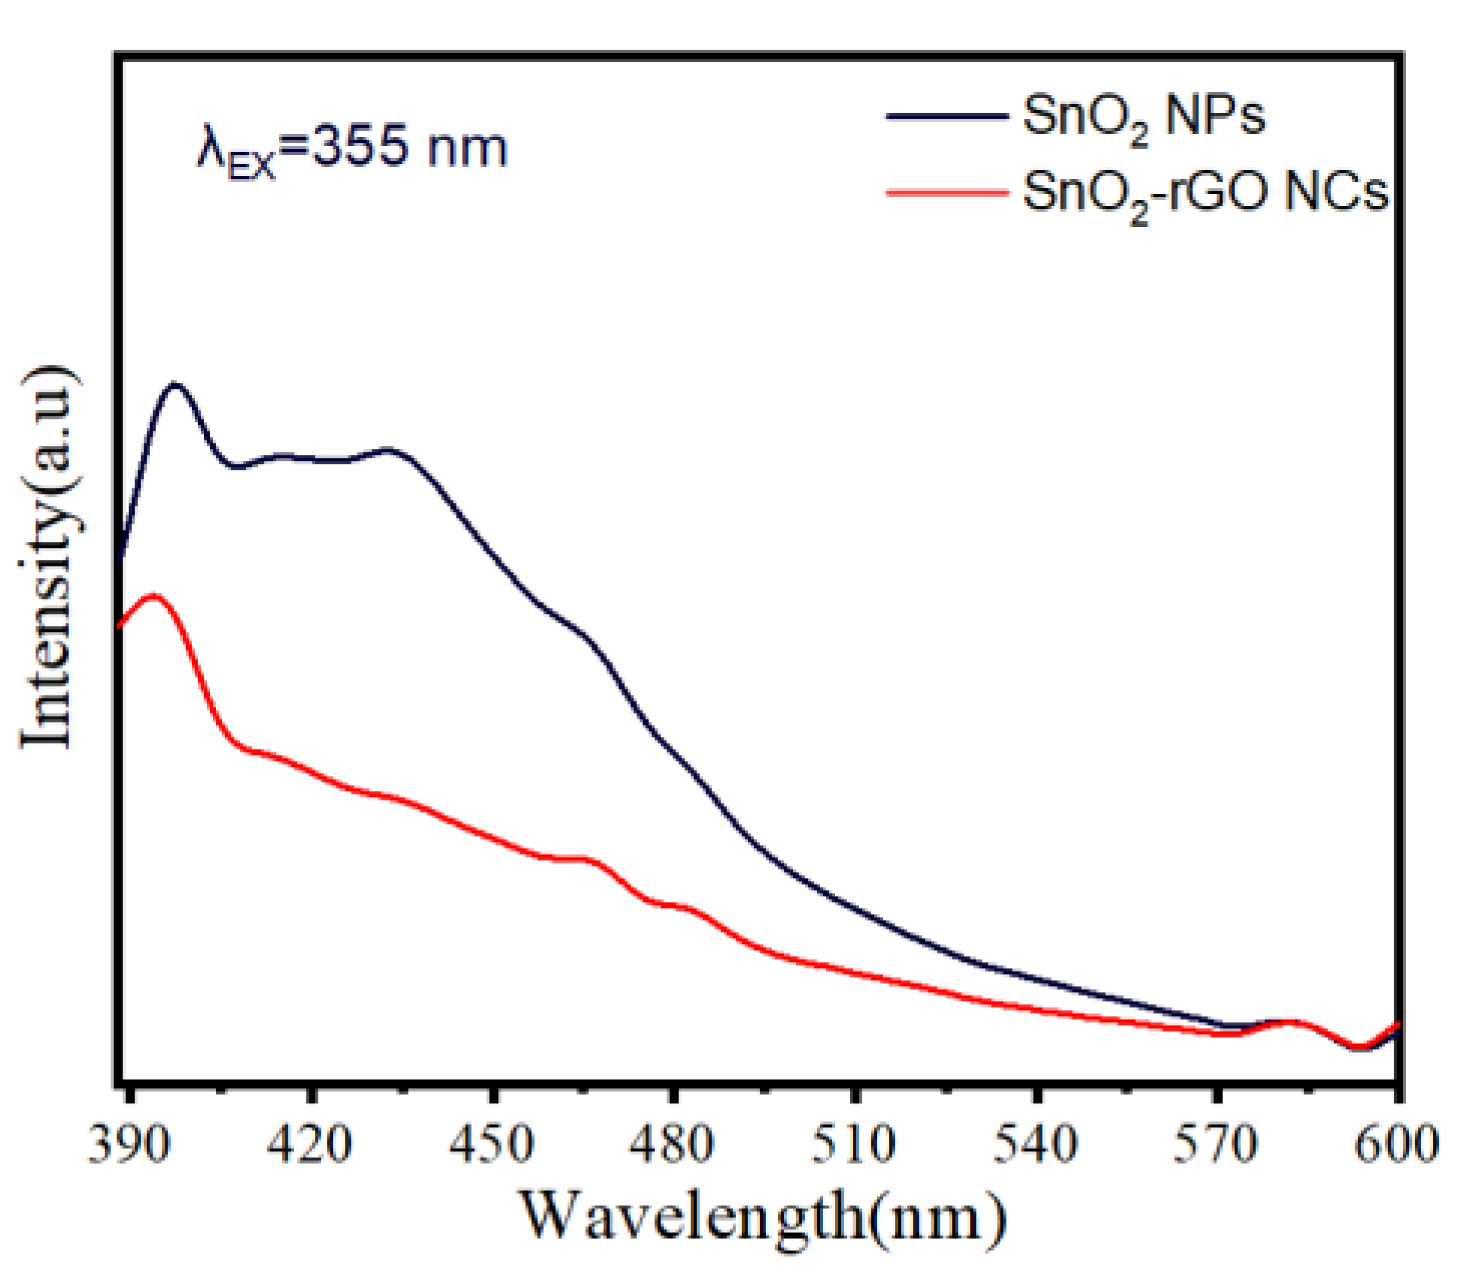
3.8. Photoluminescence (PL)
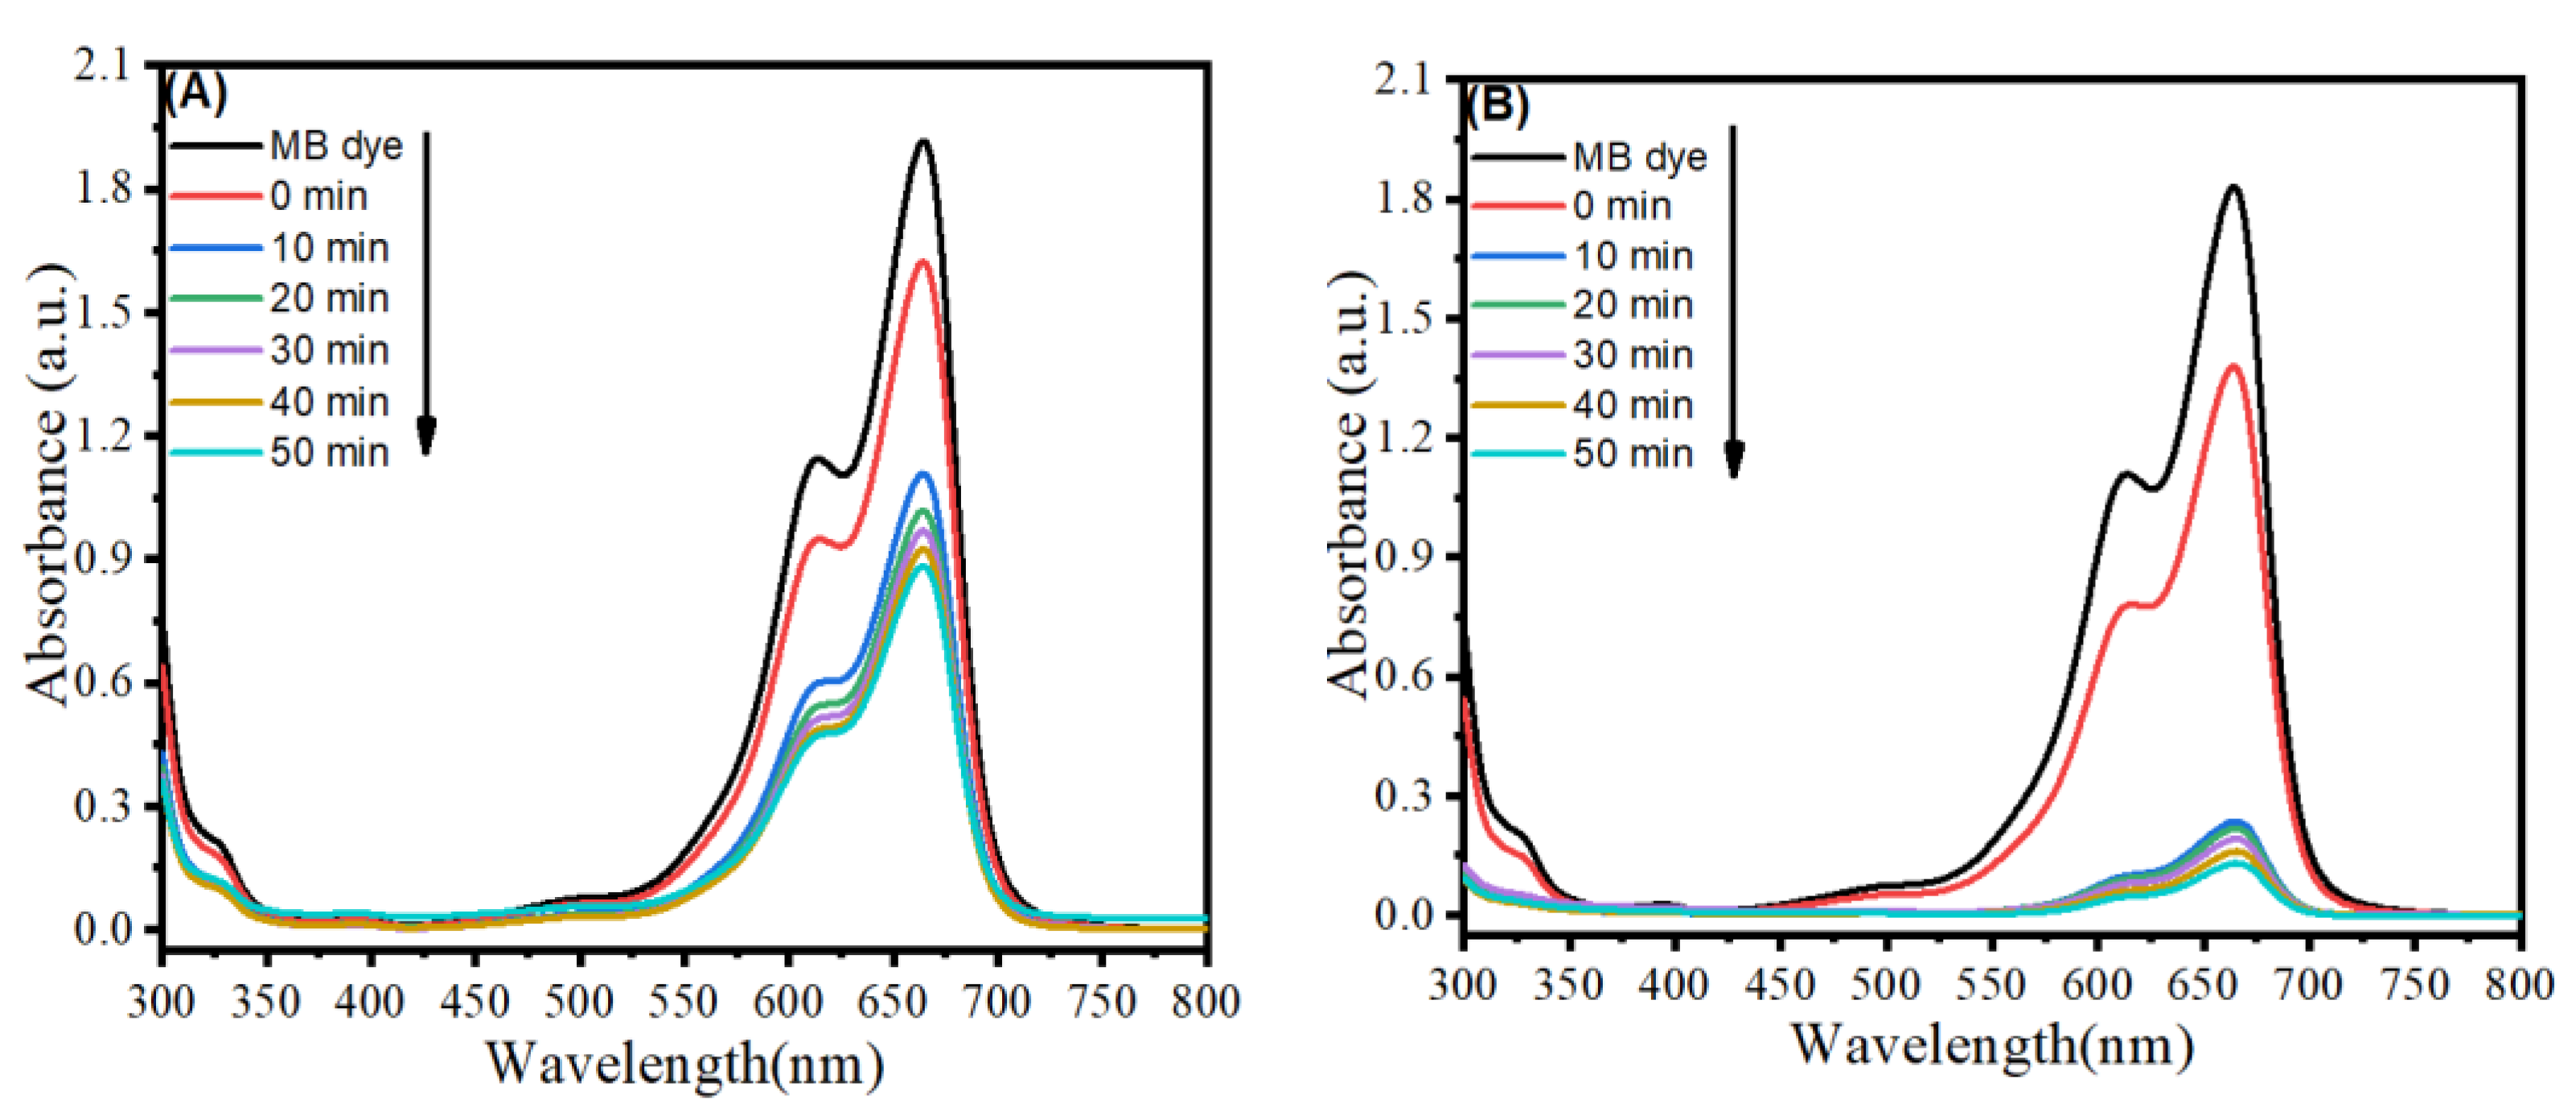
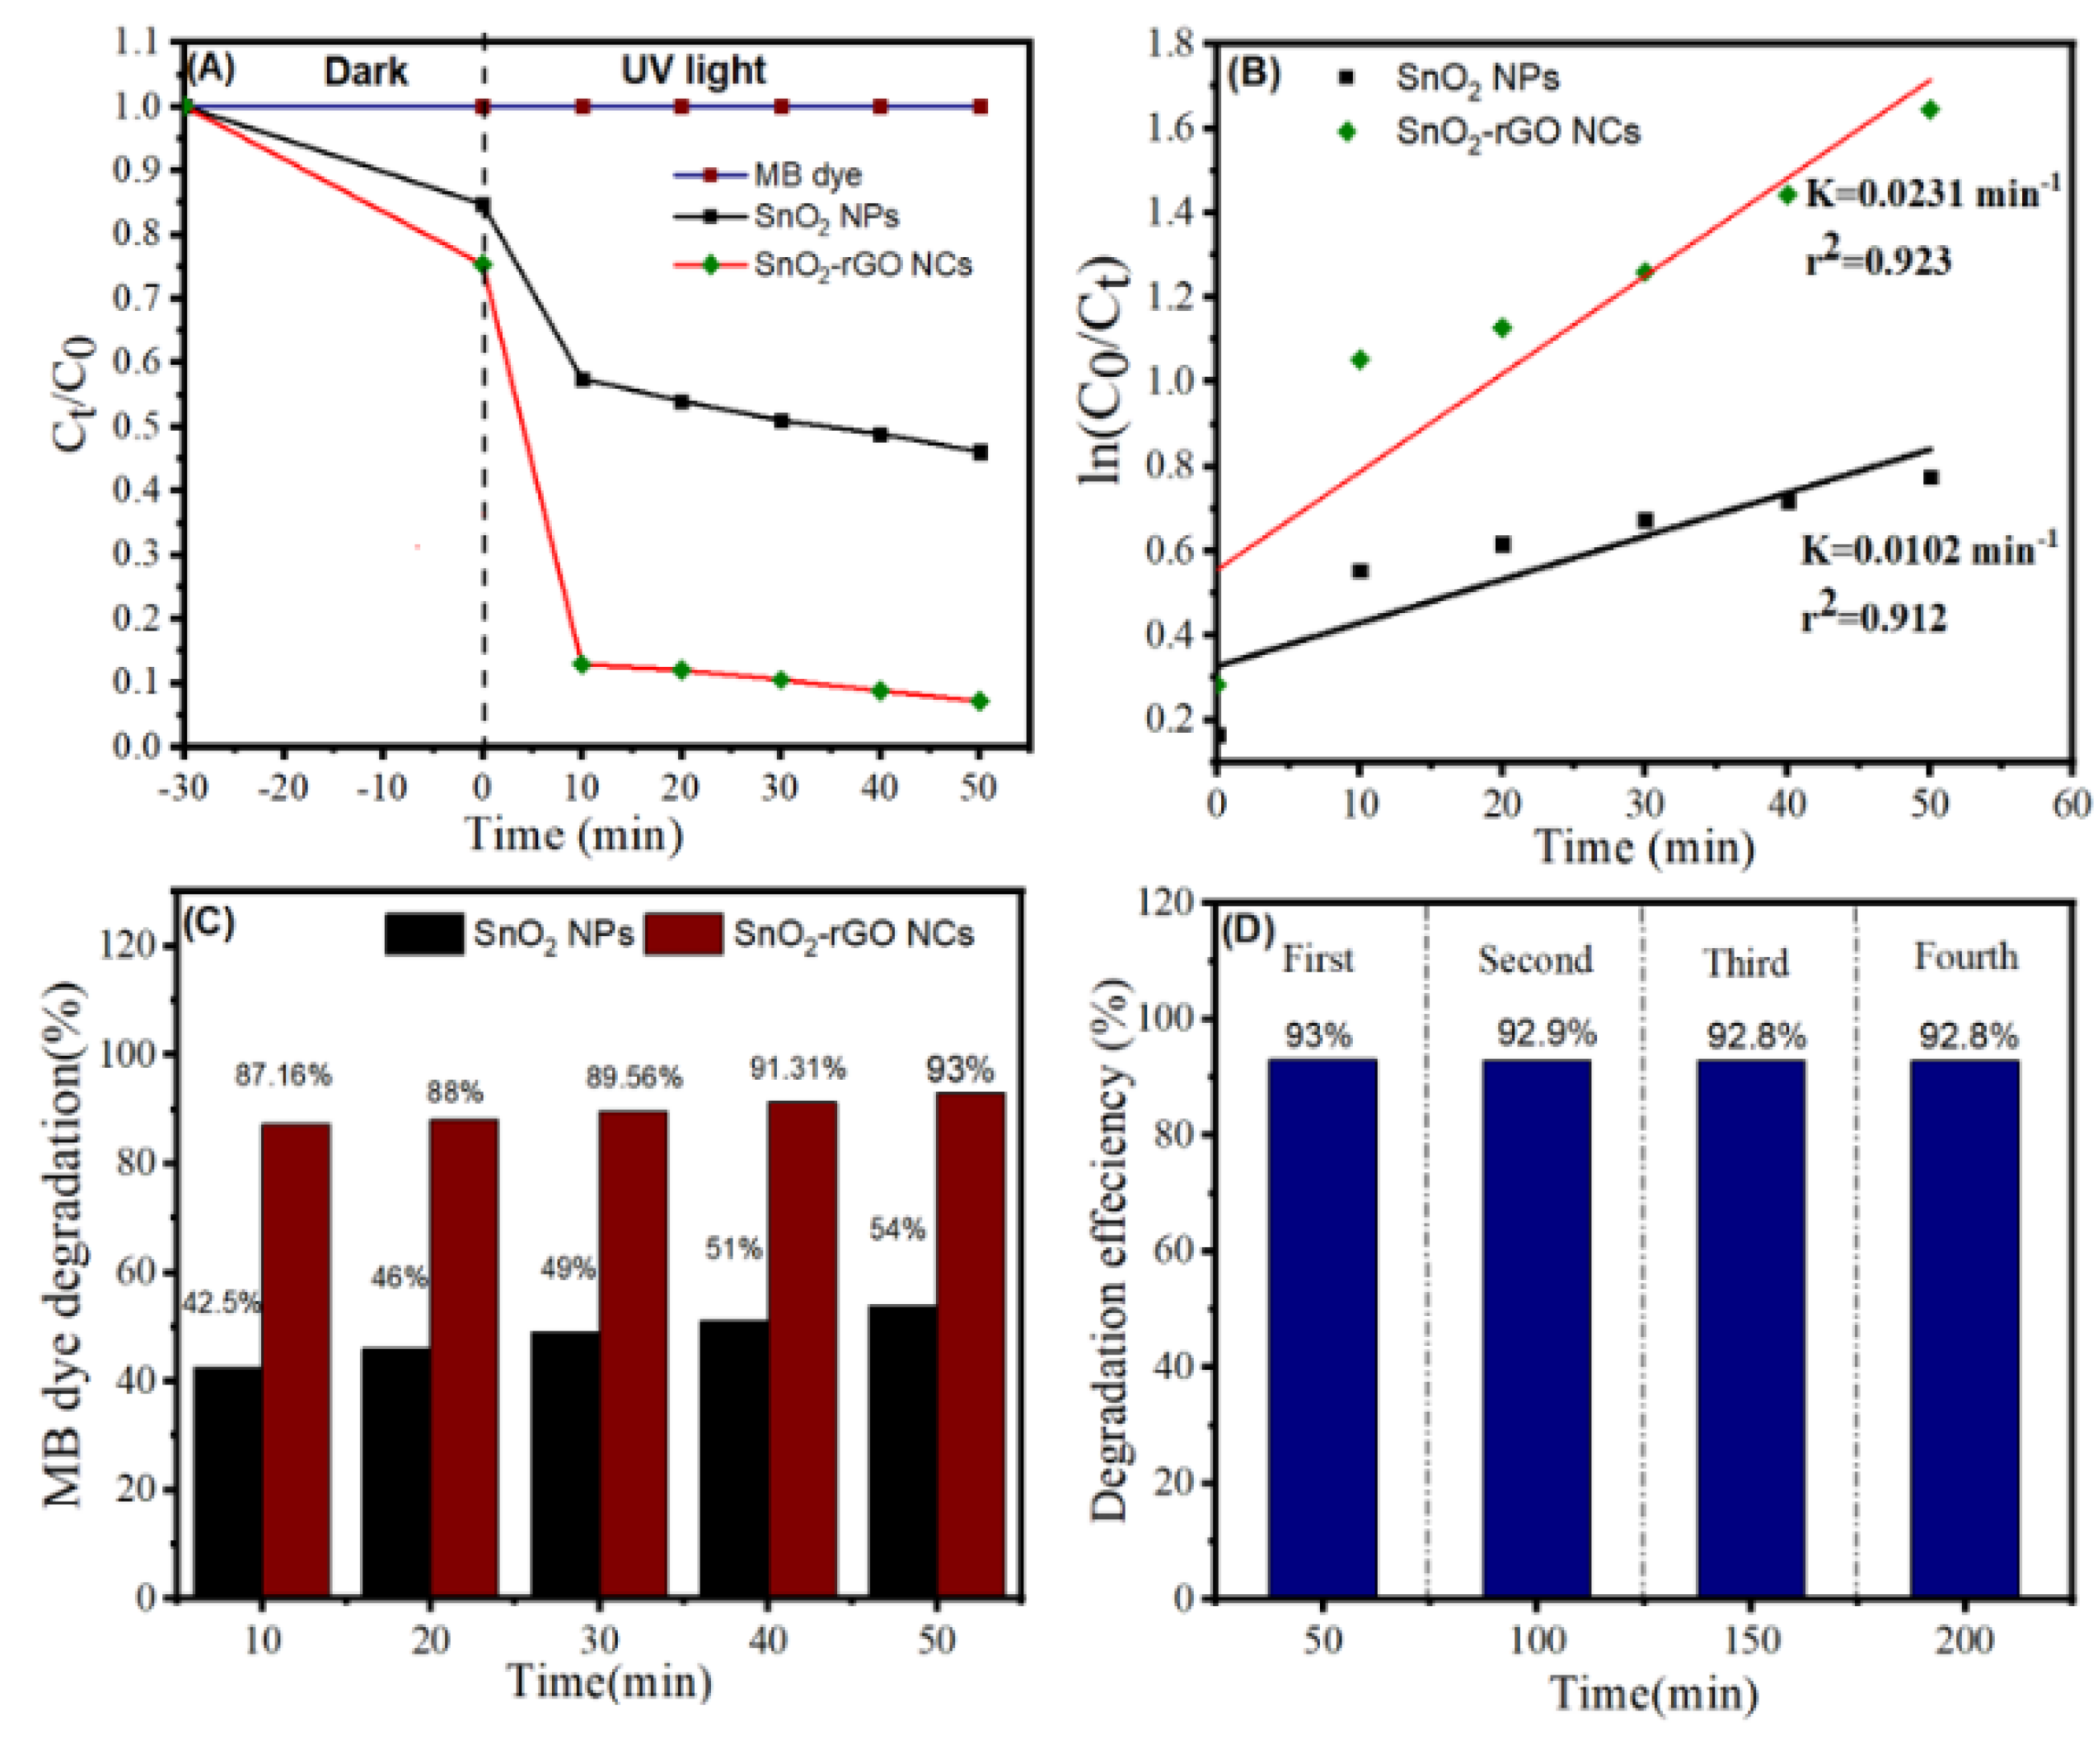
3.9. Photocatalytic Study
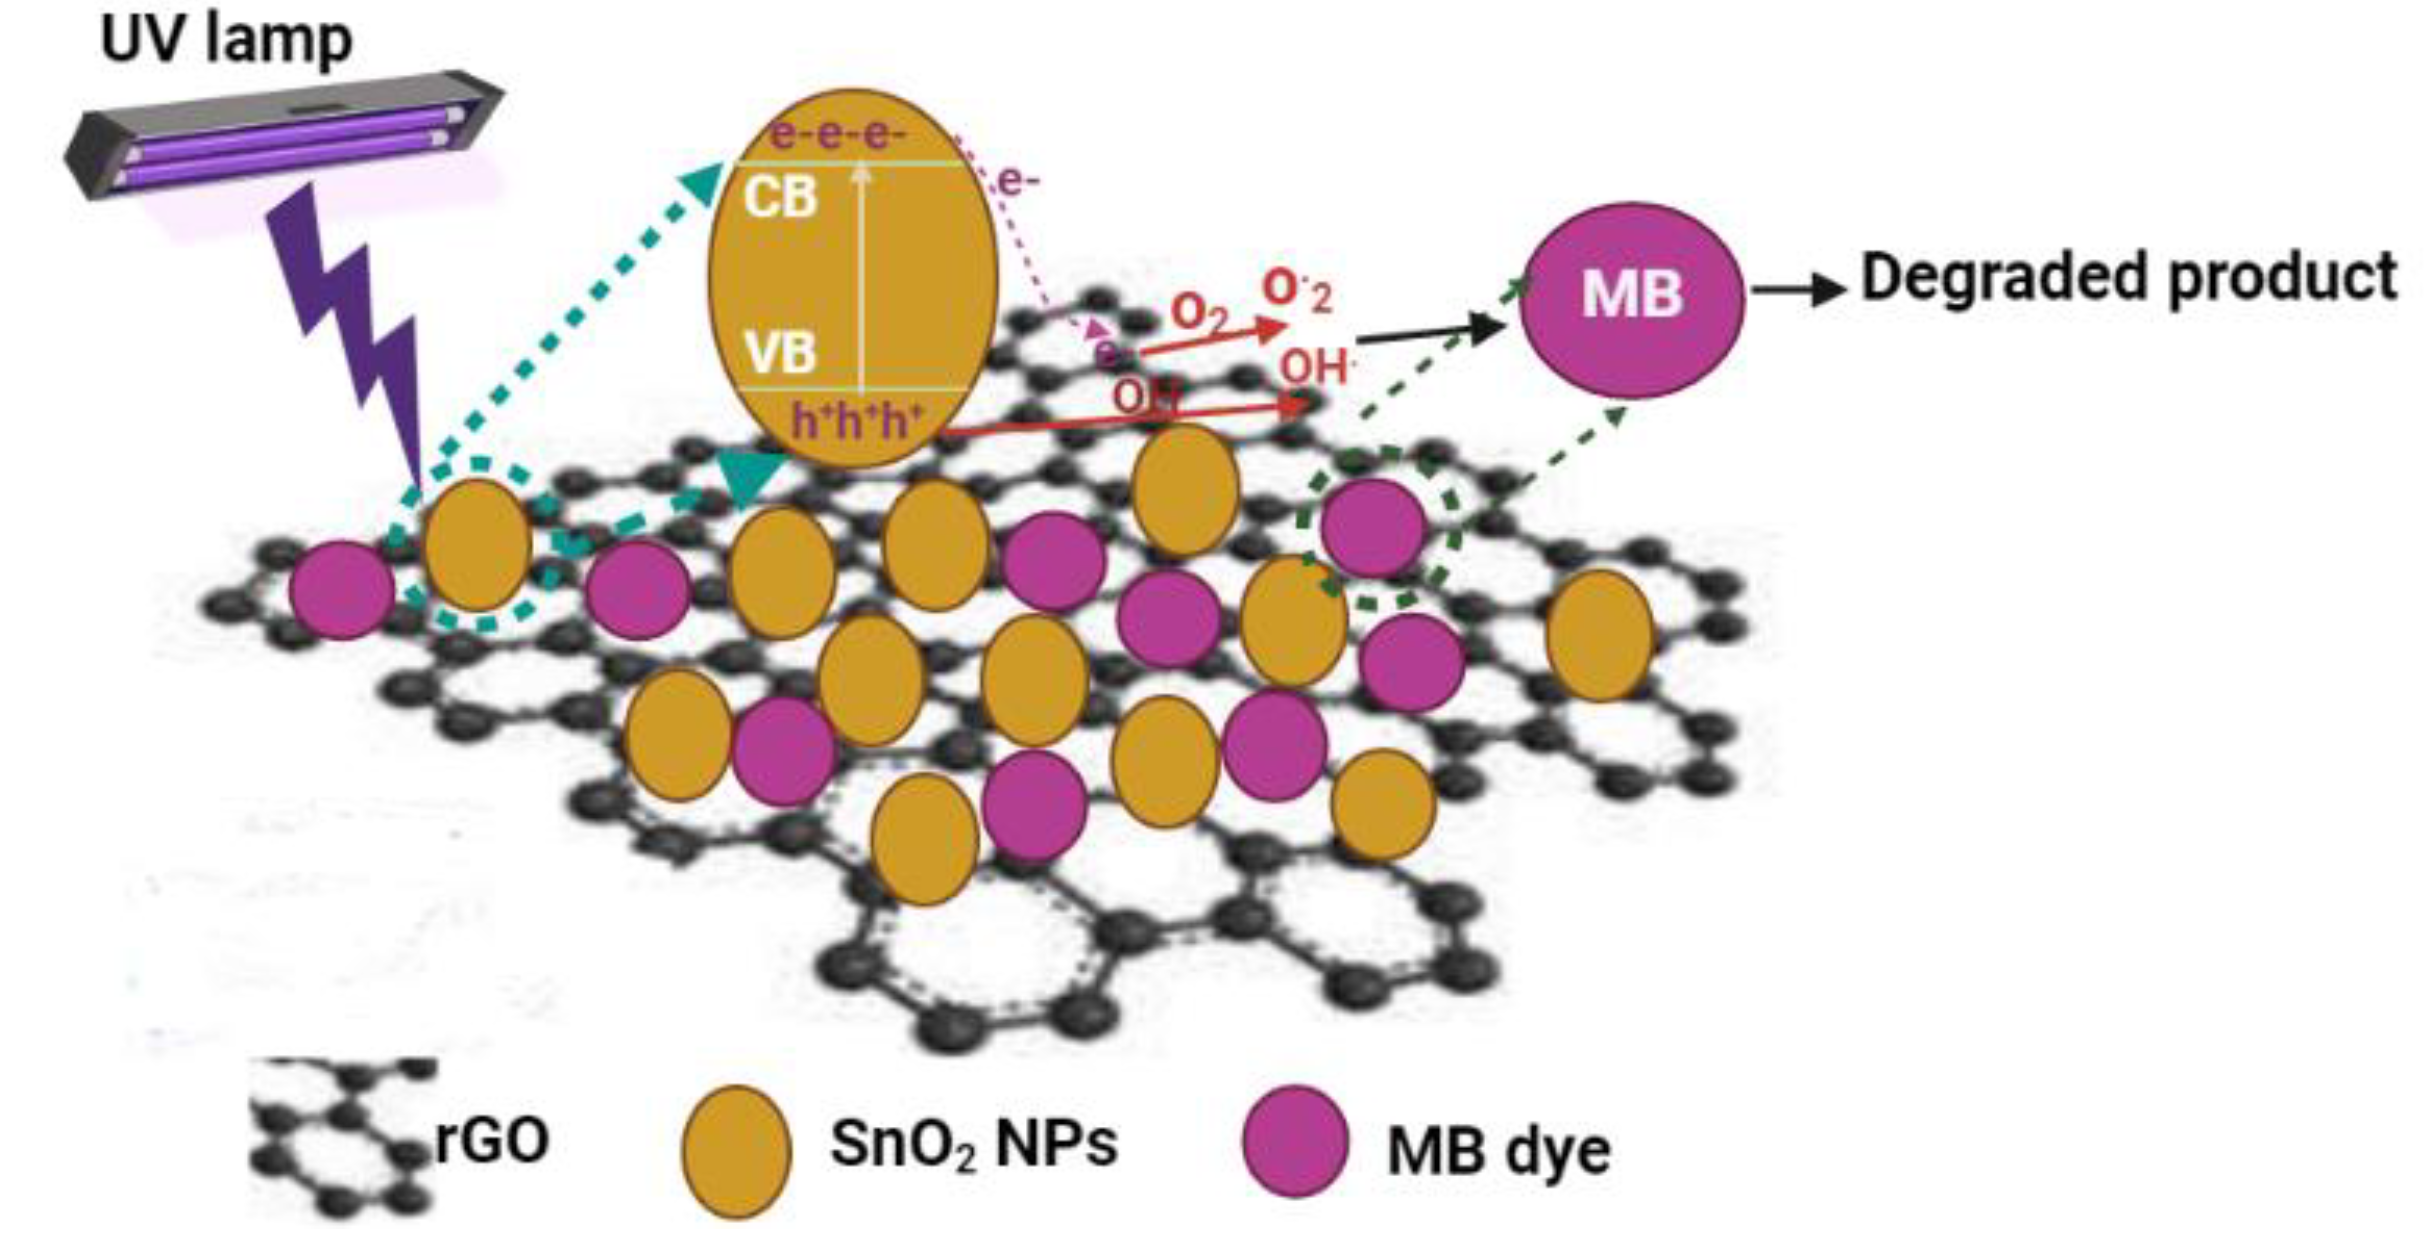
3.10. Mechanism of Photocatalysis
3.11. Anticancer Study
4. Conclusions
Author Contributions
Funding
Institutional Review Board Statement
Informed Consent Statement
Data Availability Statement
Conflicts of Interest
References
- Bray, F.; Ferlay, J.; Soerjomataram, I.; Siegel, R.L.; Torre, L.A.; Jemal, A. Global cancer statistics 2018: GLOBOCAN estimates of incidence and mortality worldwide for 36 cancers in 185 countries. CA Cancer J. Clin. 2018, 68, 394–424. [Google Scholar] [CrossRef] [PubMed] [Green Version]
- Ahamed, M.; Akhtar, M.J.; Khan, M.A.M.; Alhadlaq, H.A. Enhanced anticancer performance of eco-friendly-prepared Mo-ZnO/RGO nanocomposites: Role of oxidative stress and apoptosis. ACS Omega 2022, 7, 7103–7115. [Google Scholar] [CrossRef] [PubMed]
- Giofrè, S.V.; Tiecco, M.; Celesti, C.; Patanè, S.; Triolo, C.; Gulino, A.; Spitaleri, L.; Scalese, S.; Scuderi, M.; Iannazzo, D. Eco-friendly 1,3-dipolar cycloaddition reactions on graphene quantum dots in natural deep eutectic solvent. Nanomaterials 2020, 10, 2549. [Google Scholar] [CrossRef] [PubMed]
- Huang, L.; Sun, Y.; Mahmud, S.; Liu, H. Biological and environmental applications of silver nanoparticles synthesized using the aqueous extract of ginkgo biloba leaf. J. Inorg. Organomet. Polym. Mater. 2020, 30, 1653–1668. [Google Scholar] [CrossRef]
- Liu, Y.; Huang, L.; Mahmud, S.; Liu, H. Gold nanoparticles biosynthesized using ginkgo biloba leaf aqueous extract for the decolorization of azo-dyes and fluorescent detection of Cr(VI). J. Clust. Sci. 2020, 31, 549–560. [Google Scholar] [CrossRef]
- Singh, M.P.; Sirohi, P.; Afzal, S. Biosynthesis zinc oxide nanoparticles using senna occidentalis leaf extract and evaluation of their cytotoxic effect on SW480 colon cancer cell line. Res. Sq. 2022, 1–20. [Google Scholar] [CrossRef]
- Spitaleri, L.; Nicotra, G.; Zimbone, M.; Contino, A.; Maccarrone, G.; Alberti, A.; Gulino, A. Fast and efficient sun light photocatalytic activity of Au_ZnO core-shell nanoparticles prepared by a one-pot synthesis. ACS Omega 2019, 4, 15061–15066. [Google Scholar] [CrossRef] [Green Version]
- Sharma, D.K.; Shukla, S.; Sharma, K.K.; Kumar, V. A Review on ZnO: Fundamental properties and applications. Mater. Today Proc. 2020, 49, 3028–3035. [Google Scholar] [CrossRef]
- Liu, X.; Zhai, H.; Wang, P.; Zhang, Q.; Wang, Z.; Liu, Y.; Dai, Y.; Huang, B.; Qin, X.; Zhang, X. Synthesis of a WO 3 photocatalyst with high photocatalytic activity and stability using synergetic internal Fe3+ doping and superficial Pt loading for ethylene degradation under visible-light irradiation. Catal. Sci. Technol. 2019, 9, 652–658. [Google Scholar] [CrossRef]
- Zeng, J.; Wu, M.; Lan, S.; Li, J.; Zhang, X.; Liu, J.; Liu, X.; Wei, Z.; Zeng, Y. Facile preparation of biocompatible Ti2O3 nanoparticles for second near-infrared window photothermal therapy. J. Mater. Chem. B 2018, 6, 7889–7897. [Google Scholar] [CrossRef]
- Kar, A.; Olszówka, J.; Sain, S.; Sloman, S.R.I.; Montes, O.; Fernández, A.; Pradhan, S.K.; Wheatley, A.E.H. Morphological effects on the photocatalytic properties of SnO2 nanostructures. J. Alloys Compd. 2019, 810, 151718. [Google Scholar] [CrossRef]
- Firooz, A.A.; Mahjoub, A.R.; Khodadadi, A.A. Preparation of SnO2 nanoparticles and nanorods by using a hydrothermal method at low temperature. Mater. Lett. 2008, 62, 1789–1792. [Google Scholar] [CrossRef]
- Li, Y.; Guo, Y.; Tan, R.; Cui, P.; Li, Y.; Song, W. Synthesis of SnO2 nano-sheets by a template-free hydrothermal method. Mater. Lett. 2009, 63, 2085–2088. [Google Scholar] [CrossRef]
- Viet, P.V.; Thi, C.M.; Hieu, L. Van the high photocatalytic activity of SnO2 nanoparticles synthesized by hydrothermal method. J. Nanomater. 2016, 2016, 4231046. [Google Scholar] [CrossRef] [Green Version]
- Kim, S.P.; Choi, M.Y.; Choi, H.C. Photocatalytic activity of SnO2 nanoparticles in methylene blue degradation. Mater. Res. Bull. 2016, 74, 85–89. [Google Scholar] [CrossRef]
- Shams, M.; Guiney, L.M.; Huang, L.; Ramesh, M.; Yang, X.; Hersam, M.C.; Chowdhury, I. Environmental science nano paper influence of functional groups on the degradation of graphene oxide nanomaterials. Environ. Sci. Nano 2019, 6, 2203. [Google Scholar] [CrossRef]
- Shyamala, R.; Gomathi Devi, L. Reduced graphene oxide/SnO2 nanocomposites for the photocatalytic degradation of rhodamine B: Preparation, characterization, photosensitization, vectorial charge transfer mechanism and identification of reaction intermediates. Chem. Phys. Lett. 2020, 748, 137385. [Google Scholar] [CrossRef]
- Balsamo, S.A.; Fiorenza, R.; Condorelli, M.; Pecoraro, R.; Brundo, M.V.; Lo Presti, F.; Sciré, S. One-pot synthesis of TiO2-rGO photocatalysts for the degradation of groundwater pollutants. Materials 2021, 14, 5938. [Google Scholar] [CrossRef]
- Raslan, A.; Saenz del Burgo, L.; Ciriza, J.; Luis Pedraz, J. Graphene oxide and reduced graphene oxide-based scaffolds in regenerative medicine. Int. J. Pharm. 2020, 580, 119226. [Google Scholar] [CrossRef]
- Ahamed, M.; Javed Akhtar, M.; Majeed Khan, M.A.; Alhadlaq, H.A. Facile green synthesis of ZnO-RGO nanocomposites with enhanced anticancer efficacy. Methods 2022, 199, 28–36. [Google Scholar] [CrossRef]
- Zhu, J.; Zhu, T.; Zhou, X.; Zhang, Y.; Lou, X.W.; Chen, X.; Zhang, H.; Hng, H.H.; Yan, Q. Facile Synthesis of Metal Oxide/Reduced Graphene Oxide Hybrids with High Lithium Storage Capacity and Stable Cyclability. Nanoscale 2011, 3, 1084–1089. [Google Scholar] [CrossRef] [PubMed]
- Zhu, W.K.; Cong, H.P.; Yao, H.B.; Mao, L.B.; Asiri, A.M.; Alamry, K.A.; Marwani, H.M.; Yu, S.H. Bioinspired, ultrastrong, highly biocompatible, and bioactive natural polymer/graphene oxide nanocomposite films. Small 2015, 11, 4298–4302. [Google Scholar] [CrossRef] [PubMed]
- Hoon Suh, D.; Park, S.K.; Nakhanivej, P.; Kang, S.W.; Park, H.S. Microwave synthesis of SnO2 nanocrystals decorated on the layer-by-layer reduced graphene oxide for an application into lithium ion battery anode. J. Alloys Compd. 2017, 702, 636–643. [Google Scholar] [CrossRef]
- Yousefimehr, F.; Jafarirad, S.; Salehi, R.; Zakerhamidi, M.S. Facile fabricating of RGO and Au/RGO nanocomposites using Brassica oleracea var. gongylodes biomass for non-invasive approach in cancer therapy. Sci. Rep. 2021, 11, 11900. [Google Scholar] [CrossRef] [PubMed]
- Khan, M.A.M.; Khan, W.; Ahamed, M.; Alhazaa, A.N. Investigation on the structure and physical properties of Fe3O4/RGO nanocomposites and their photocatalytic application. Mater. Sci. Semicond. Process. 2019, 99, 44–53. [Google Scholar] [CrossRef]
- Chen, J.; Wei, D.; Liu, L.; Nai, J.; Liu, Y.; Xiong, Y.; Peng, J.; Mahmud, S.; Liu, H. Green synthesis of konjac glucomannan templated palladium nanoparticles for catalytic reduction of Azo compounds and hexavalent chromium. Mater. Chem. Phys. 2021, 267, 124651. [Google Scholar] [CrossRef]
- Bansode, S.R.; Khare, R.T.; Jagtap, K.K.; More, M.A.; Koinkar, P. One step hydrothermal synthesis of SnO2-RGO nanocomposite and its field emission studies. Mater. Sci. Semicond. Process. 2017, 63, 90–96. [Google Scholar] [CrossRef]
- Matthew, J. Surface Analysis by Auger and X-Ray Photoelectron Spectroscopy; Briggs, D., Grant, J.T., Eds.; IMPublications: Chichester, UK; SurfaceSpectra: Manchester, UK, 2003; ISBN 1-901019-04-7. [Google Scholar]
- Nurzulaikha, R.; Lim, H.N.; Harrison, I.; Lim, S.S.; Pandikumar, A.; Huang, N.M.; Lim, S.P.; Thien, G.S.H.; Yusoff, N.; Ibrahim, I. Graphene/SnO2 nanocomposite-modified electrode for electrochemical detection of dopamine. Sens. Bio-Sens. Res. 2015, 5, 42–49. [Google Scholar] [CrossRef] [Green Version]
- Pham, V.T.; le Trung, H.; Tran, N.K.; Chu Manh, H.; Nguyen Duc, H.; Tran Thi Quynh, H.; Pham, T.H. Hydrothermal synthesis, structure, and photocatalytic properties of SnO2/RGO nanocomposites with different GO concentrations. Mater. Res. Express 2018, 5, 095506. [Google Scholar] [CrossRef]
- Priyadharsan, A.; Vasanthakumar, V.; Karthikeyan, S.; Raj, V.; Shanavas, S.; Anbarasan, P.M. Multi-functional properties of ternary CeO2/SnO2/RGO nanocomposites: Visible light driven photocatalyst and heavy metal removal. J. Photochem. Photobiol. A Chem. 2017, 346, 32–45. [Google Scholar] [CrossRef]
- Navazani, S.; Shokuhfar, A.; Hassanisadi, M.; Askarieh, M.; Di Carlo, A.; Agresti, A. Facile synthesis of a SnO2@rGO nanohybrid and optimization of its methane-sensing parameters. Talanta 2018, 181, 422–430. [Google Scholar] [CrossRef] [PubMed]
- Drzymała, E.; Gruzeł, G.; Depciuch, J.; Budziak, A.; Kowal, A.; Parlinska-Wojtan, M. Structural, chemical and optical properties of SnO2 NPs obtained by three different synthesis routes. J. Phys. Chem. Solids 2017, 107, 100–107. [Google Scholar] [CrossRef]
- Ahmad, S.; Ahmad, A.; Khan, S.; Ahmad, S.; Khan, I.; Zada, S.; Fu, P. Algal extracts based biogenic synthesis of reduced graphene oxides (RGO) with enhanced heavy metals adsorption capability. J. Ind. Eng. Chem. 2019, 72, 117–124. [Google Scholar] [CrossRef]
- Zhang, B.; Zhang, C.; Liu, B.; Zhou, X.; Huang, G. Anchoring SbxOy/SnO2 nano-heterojunction on reduced graphene oxide as lithium ion batteries anodes with remarkable rate performance and excellent cycle stability. Ionics 2021, 27, 4205–4216. [Google Scholar] [CrossRef]
- Ahamed, M.; Akhtar, M.J.; Khan, M.A.M.; Alhadlaq, H.A. SnO2-doped ZnO/reduced graphene oxide nanocomposites: Synthesis, characterization, and improved anticancer activity via oxidative stress pathway. Int. J. Nanomed. 2021, 16, 89–104. [Google Scholar] [CrossRef]
- Gulino, A. Structural and electronic characterization of self-assembled molecular nanoarchitectures by X-ray photoelectron spectroscopy. Anal. Bioanal. Chem. 2013, 405, 1479–1495. [Google Scholar] [CrossRef]
- Tian, R.; Zhang, Y.; Chen, Z.; Duan, H.; Xu, B.; Guo, Y.; Kang, H.; Li, H.; Liu, H. The effect of annealing on a 3D SnO2/graphene foam as an advanced lithium-ion battery anode. Sci. Rep. 2016, 6, 19195. [Google Scholar] [CrossRef] [Green Version]
- Pi, S.; Zhang, X.; Cui, H.; Chen, D.; Zhang, G.; Xiao, S.; Tang, J. Facile fabrication of Au nanoparticles/Tin oxide/reduced graphene oxide ternary nanocomposite and its high-performance SF6 decomposition components sensing. Front. Chem. 2019, 7, 476. [Google Scholar] [CrossRef] [Green Version]
- Al-Gaashani, R.; Najjar, A.; Zakaria, Y.; Mansour, S.; Atieh, M.A. XPS and structural studies of high quality graphene oxide and reduced graphene oxide prepared by different chemical oxidation methods. Ceram. Int. 2019, 45, 14439–14448. [Google Scholar] [CrossRef]
- Jiang, S.; Huang, R.; Zhu, W.; Li, X.; Zhao, Y.; Gao, Z.; Gao, L.; Zhao, J. Free-standing SnO2@rGO anode via the anti-solvent-assisted precipitation for superior lithium storage performance. Front. Chem. 2019, 7, 878. [Google Scholar] [CrossRef]
- Bhangare, B.; Ramgir, N.S.; Jagtap, S.; Debnath, A.K.; Muthe, K.P.; Terashima, C.; Aswal, D.K.; Gosavi, S.W.; Fujishima, A. XPS and kelvin probe studies of SnO2/RGO nanohybrids based NO2 sensors. Appl. Surf. Sci. 2019, 487, 918–929. [Google Scholar] [CrossRef]
- Wang, X.; Wang, X.; Di, Q.; Zhao, H.; Liang, B.; Yang, J. Mutual effects of fluorine dopant and oxygen vacancies on structural and luminescence characteristics of F doped SnO2 nanoparticles. Materials 2017, 10, 1398. [Google Scholar] [CrossRef] [PubMed] [Green Version]
- Rahimi, A.; Kazeminezhad, I.; Mousavi Ghahfarokhi, S.E. Synthesis and investigation of SnS2/RGO nanocomposites with different GO concentrations: Structure and optical properties, photocatalytic performance. J. Mater. Sci. Mater. Electron. 2018, 29, 4449–4456. [Google Scholar] [CrossRef]
- Du, F.; Yang, B.; Zuo, X.; Li, G. Dye-sensitized solar cells based on low-cost nanoscale SnO2@RGO composite counter electrode. Mater. Lett. 2015, 158, 424–427. [Google Scholar] [CrossRef]
- Akada, K.; Terasawa, T.O.; Imamura, G.; Obata, S.; Saiki, K. Control of work function of graphene by plasma assisted nitrogen doping. Appl. Phys. Lett. 2014, 104, 131602. [Google Scholar] [CrossRef]
- Khan, M.A.M.; Khan, W.; Ahamed, M.; Ahmed, J.; Al-Gawati, M.A.; Alhazaa, A.N. Silver-decorated cobalt ferrite nanoparticles anchored onto the graphene sheets as electrode materials for electrochemical and photocatalytic applications. ACS Omega 2020, 5, 31076–31084. [Google Scholar] [CrossRef] [PubMed]
- Wang, Y.; Ding, J.; Liu, Y.; Liu, Y.; Cai, Q.; Zhang, J. SnO2@reduced graphene oxide composite for high performance lithium-ion battery. Ceram. Int. 2015, 41, 15145–15152. [Google Scholar] [CrossRef]
- Guo, W.; Zhou, Q.; Zhang, J.; Fu, M.; Radacsi, N.; Li, Y. Hydrothermal synthesis of Bi-Doped SnO2/RGO nanocomposites and the enhanced gas sensing performance to benzene. Sens. Actuators B Chem. 2019, 299, 126959. [Google Scholar] [CrossRef]
- Orek, C.; Gündüz, B.; Kaygili, O.; Bulut, N. Electronic, optical, and spectroscopic analysis of TBADN organic semiconductor: Experiment and theory. Chem. Phys. Lett. 2017, 678, 130–138. [Google Scholar] [CrossRef]
- Mani, R.; Vivekanandan, K.; Subiramaniyam, N.P. Photocatalytic activity of different organic dyes by using pure and fe doped SnO2 nanopowders catalyst under UV light irradiation. J. Mater. Sci. Mater. Electron. 2017, 28, 13846–13852. [Google Scholar] [CrossRef]
- Van Tuan, P.; Tuong, H.B.; Tan, V.T.; Thu, L.H.; Khoang, N.D.; Khiem, T.N. SnO2/reduced graphene oxide nanocomposites for highly efficient photocatalytic degradation of methylene blue. Opt. Mater. 2022, 123, 111916. [Google Scholar] [CrossRef]
- Sujatmiko, F.; Sahroni, I.; Fadillah, G.; Fatimah, I. Visible light-responsive photocatalyst of SnO2/RGO prepared using pometia pinnata leaf extract. Open Chem. 2021, 19, 174–183. [Google Scholar] [CrossRef]
- Ali, G.; Zaidi, S.J.A.; Abdul Basit, M.; Park, T.J. Synergetic performance of systematically designed G-C3N4/RGO/SnO2 nanocomposite for photodegradation of rhodamine-B dye. Appl. Surf. Sci. 2021, 570, 151140. [Google Scholar] [CrossRef]
- Gomari, N.; Kazeminezhad, I.; Ghahfarokhi, S.E.M. Impact of morphology evolution of ZnSn(OH)6 microcubes on photocatalytic activity of ZnSn(OH)6/SnO2/RGO ternary nanocomposites for efficient degradation of organic pollutants. Opt. Mater. 2021, 113, 110878. [Google Scholar] [CrossRef]
- Nenavathu, B.P.; Kandula, S.; Verma, S. Visible-light-driven photocatalytic degradation of safranin-T dye using functionalized graphene oxide nanosheet (FGS)/ZnO nanocomposites. RSC Adv. 2018, 8, 19659–19667. [Google Scholar] [CrossRef] [Green Version]
- Al-Rawashdeh, N.A.F.; Allabadi, O.; Aljarrah, M.T. Photocatalytic activity of graphene oxide/zinc oxide nanocomposites with embedded metal nanoparticles for the degradation of organic dyes. ACS Omega 2020, 5, 28046–28055. [Google Scholar] [CrossRef]
- Tian, H.; Wan, C.; Xue, X.; Hu, X.; Wang, X. Effective electron transfer pathway of the ternary TiO2/RGO/Ag nanocomposite with enhanced photocatalytic activity under visible light. Catalysts 2017, 7. [Google Scholar] [CrossRef]
- Asgharian, M.; Mehdipourghazi, M.; Khoshandam, B.; Keramati, N. Photocatalytic degradation of methylene blue with synthesized RGO/ZnO/Cu. Chem. Phys. Lett. 2019, 719, 1–7. [Google Scholar] [CrossRef]
- Shih, K.-Y.; Kuan, Y.-L.; Wang, E.-R. One-step microwave-assisted synthesis and visible-light photocatalytic activity enhancement of BiOBr/RGO nanocomposites for degradation of methylene blue. Materials 2021, 14, 4577. [Google Scholar] [CrossRef]
- Li, B.; Shao, X.; Liu, T.; Shao, L.; Zhang, B. Construction of metal/WO2.72/RGO ternary nanocomposites with optimized adsorption, photocatalytic and photoelectrochemical properties. Appl. Catal. B Environ. 2016, 198, 325–333. [Google Scholar] [CrossRef]
- Tammina, S.K.; Mandal, B.K.; Ranjan, S.; Dasgupta, N. Cytotoxicity study of piper nigrum seed mediated synthesized SnO2 nanoparticles towards colorectal (HCT116) and lung cancer (A549) cell lines. J. Photochem. Photobiol. B Biol. 2017, 166, 158–168. [Google Scholar] [CrossRef] [PubMed]
- Ahamed, M.; Akhtar, M.J.; Khan, M.A.M.; Alaizeri, Z.A.M.; Alhadlaq, H.A. Evaluation of the cytotoxicity and oxidative stress response of CeO2-RGO nanocomposites in human lung epithelial A549 cells. Nanomaterials 2019, 9, 1709. [Google Scholar] [CrossRef] [PubMed] [Green Version]


| Properties | SnO2 NPs | SnO2-rGO NCs |
|---|---|---|
| XRD size (nm) | 7.64 | 7.98 |
| TEM size (nm) | 9.42 | 9.84 |
| Optical bandgap (eV) | 3.79 | 3.45 |
| Sample | Model Dye Pollutant | Reaction Time | Degradation Efficiency (%) | Concentration of MB | Source of Light | Reference |
|---|---|---|---|---|---|---|
| SnO2-rGO NCs | Methylene blue (MB) | 50 min | 93% | 10 ppm | UV irradiation | This work |
| ZnO/GONCs | Methylene blue (MB) | 40 min | 100% | 10 ppm | Sunlight irradiation | [57] |
| TiO2/rGO/Ag NCs | Methylene blue (MB) | 120 min | 91.2% | 10 ppm | UV irradiation | [58] |
| rGO/ZnO/Cu | Methylene blue (MB) | 60 min | 95.14% | 5 ppm | Sunlight irradiation | [59] |
| BiOBr/rGO NCs | Methylene blue (MB) | 75 min | 96% | 7 ppm | Sunlight irradiation | [60] |
| Au/WO2.72/ rGONCs | Methylene blue (MB) | 60 min | 91.2% | 10 ppm | Sunlight irradiation | [61] |
| Samples | Human Liver Cancer (HepG2) Cells | Human Lung Cancer (A549) Cells |
|---|---|---|
| SnO2 NPs | 160.97 μg/mL | 153.13 μg/mL |
| SnO2-rGO NCs | 100 μg/mL | 95.72 μg/mL |
Publisher’s Note: MDPI stays neutral with regard to jurisdictional claims in published maps and institutional affiliations. |
© 2022 by the authors. Licensee MDPI, Basel, Switzerland. This article is an open access article distributed under the terms and conditions of the Creative Commons Attribution (CC BY) license (https://creativecommons.org/licenses/by/4.0/).
Share and Cite
Alaizeri, Z.M.; Alhadlaq, H.A.; Aldawood, S.; Akhtar, M.J.; Ahamed, M. One-Pot Synthesis of SnO2-rGO Nanocomposite for Enhanced Photocatalytic and Anticancer Activity. Polymers 2022, 14, 2036. https://doi.org/10.3390/polym14102036
Alaizeri ZM, Alhadlaq HA, Aldawood S, Akhtar MJ, Ahamed M. One-Pot Synthesis of SnO2-rGO Nanocomposite for Enhanced Photocatalytic and Anticancer Activity. Polymers. 2022; 14(10):2036. https://doi.org/10.3390/polym14102036
Chicago/Turabian StyleAlaizeri, ZabnAllah M., Hisham A. Alhadlaq, Saad Aldawood, Mohd Javed Akhtar, and Maqusood Ahamed. 2022. "One-Pot Synthesis of SnO2-rGO Nanocomposite for Enhanced Photocatalytic and Anticancer Activity" Polymers 14, no. 10: 2036. https://doi.org/10.3390/polym14102036
APA StyleAlaizeri, Z. M., Alhadlaq, H. A., Aldawood, S., Akhtar, M. J., & Ahamed, M. (2022). One-Pot Synthesis of SnO2-rGO Nanocomposite for Enhanced Photocatalytic and Anticancer Activity. Polymers, 14(10), 2036. https://doi.org/10.3390/polym14102036