
Influence of the Web Formation of a Basic Layer of Medical Textiles on Their Functionality


Abstract
:1. Introduction
2. Theoretical Part
2.1. Requirements and Materials
2.2. Medical Masks and Multilayer Textiles
2.3. Overview of Research in the Field of Medical Textiles
3. Materials and Methods
3.1. Presentation of the Materials Analysed
3.2. Fibre Diameter
3.3. Thickness
3.4. Mass
3.5. Composition of the Raw Material
3.6. Image of Materials Used on SEM Microscope
3.7. Tensile Properties
3.8. Water Vapour Permeability
3.9. Air Permeability
3.10. Porosity
3.11. Thermal Conductivity
3.12. Statistical Analysis
4. Results
4.1. Fibre Diameter
4.2. Thickness and Mass
4.3. Display of Used Materials on SEM Microscope
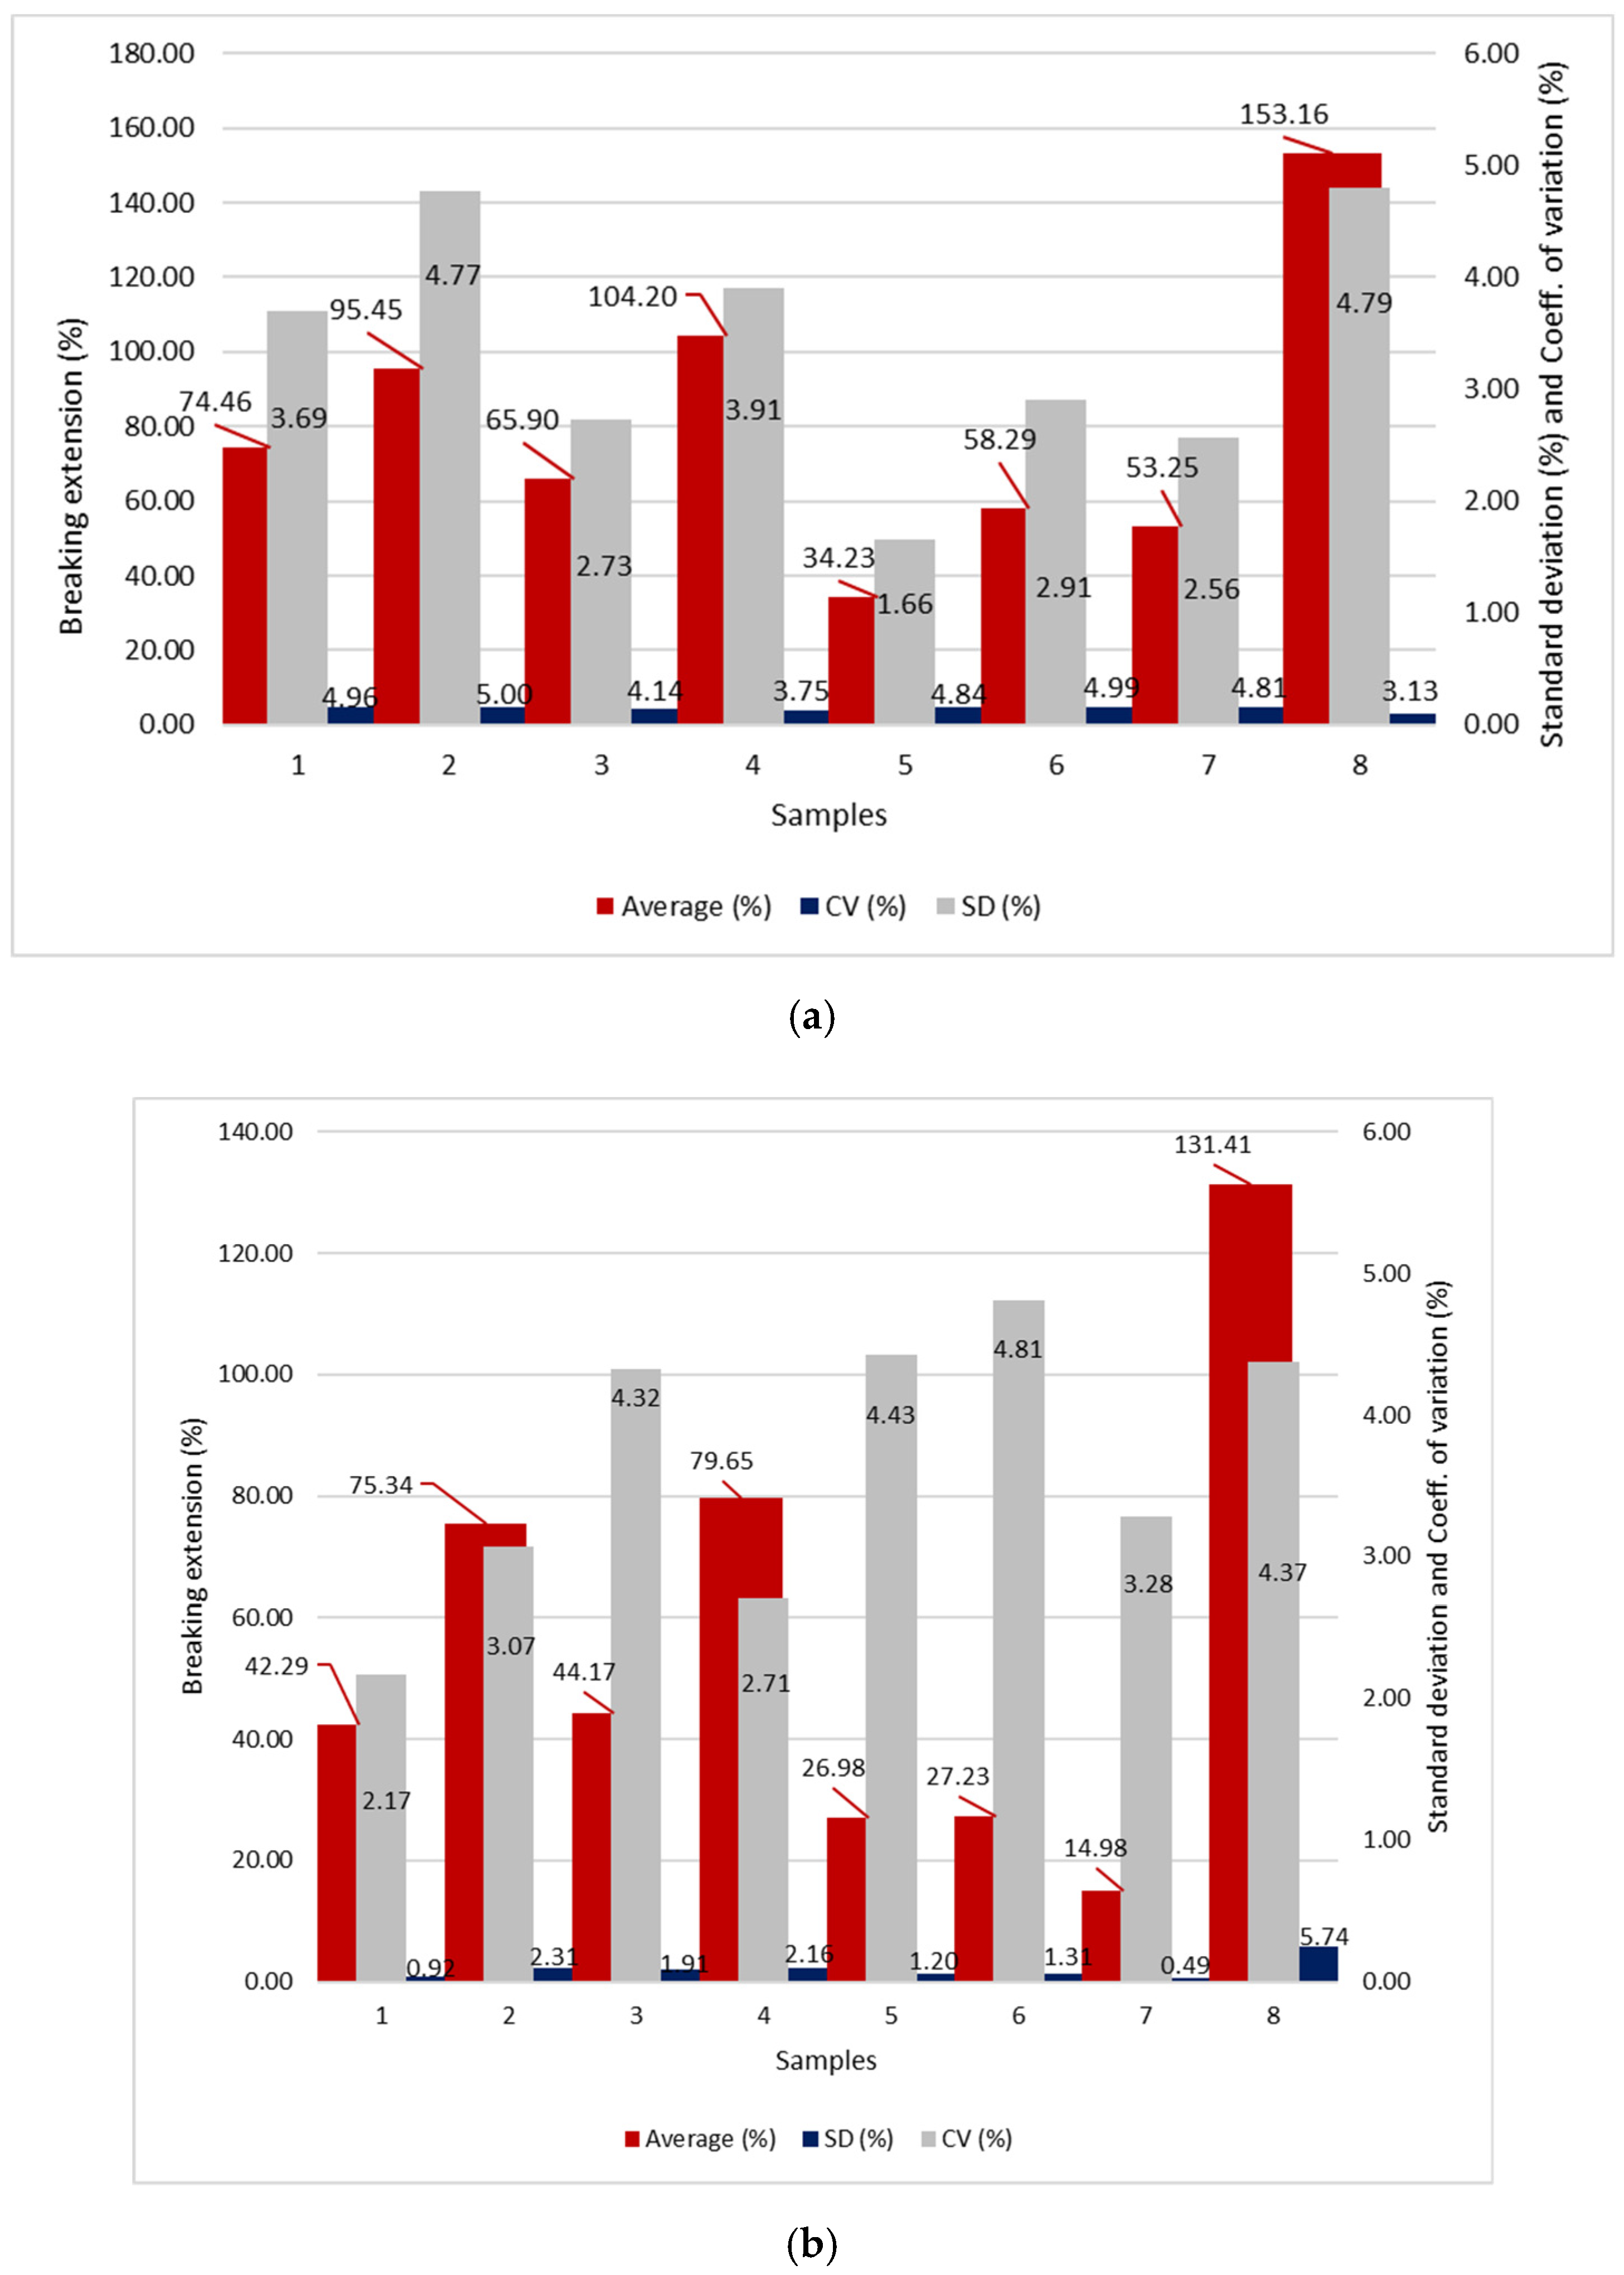
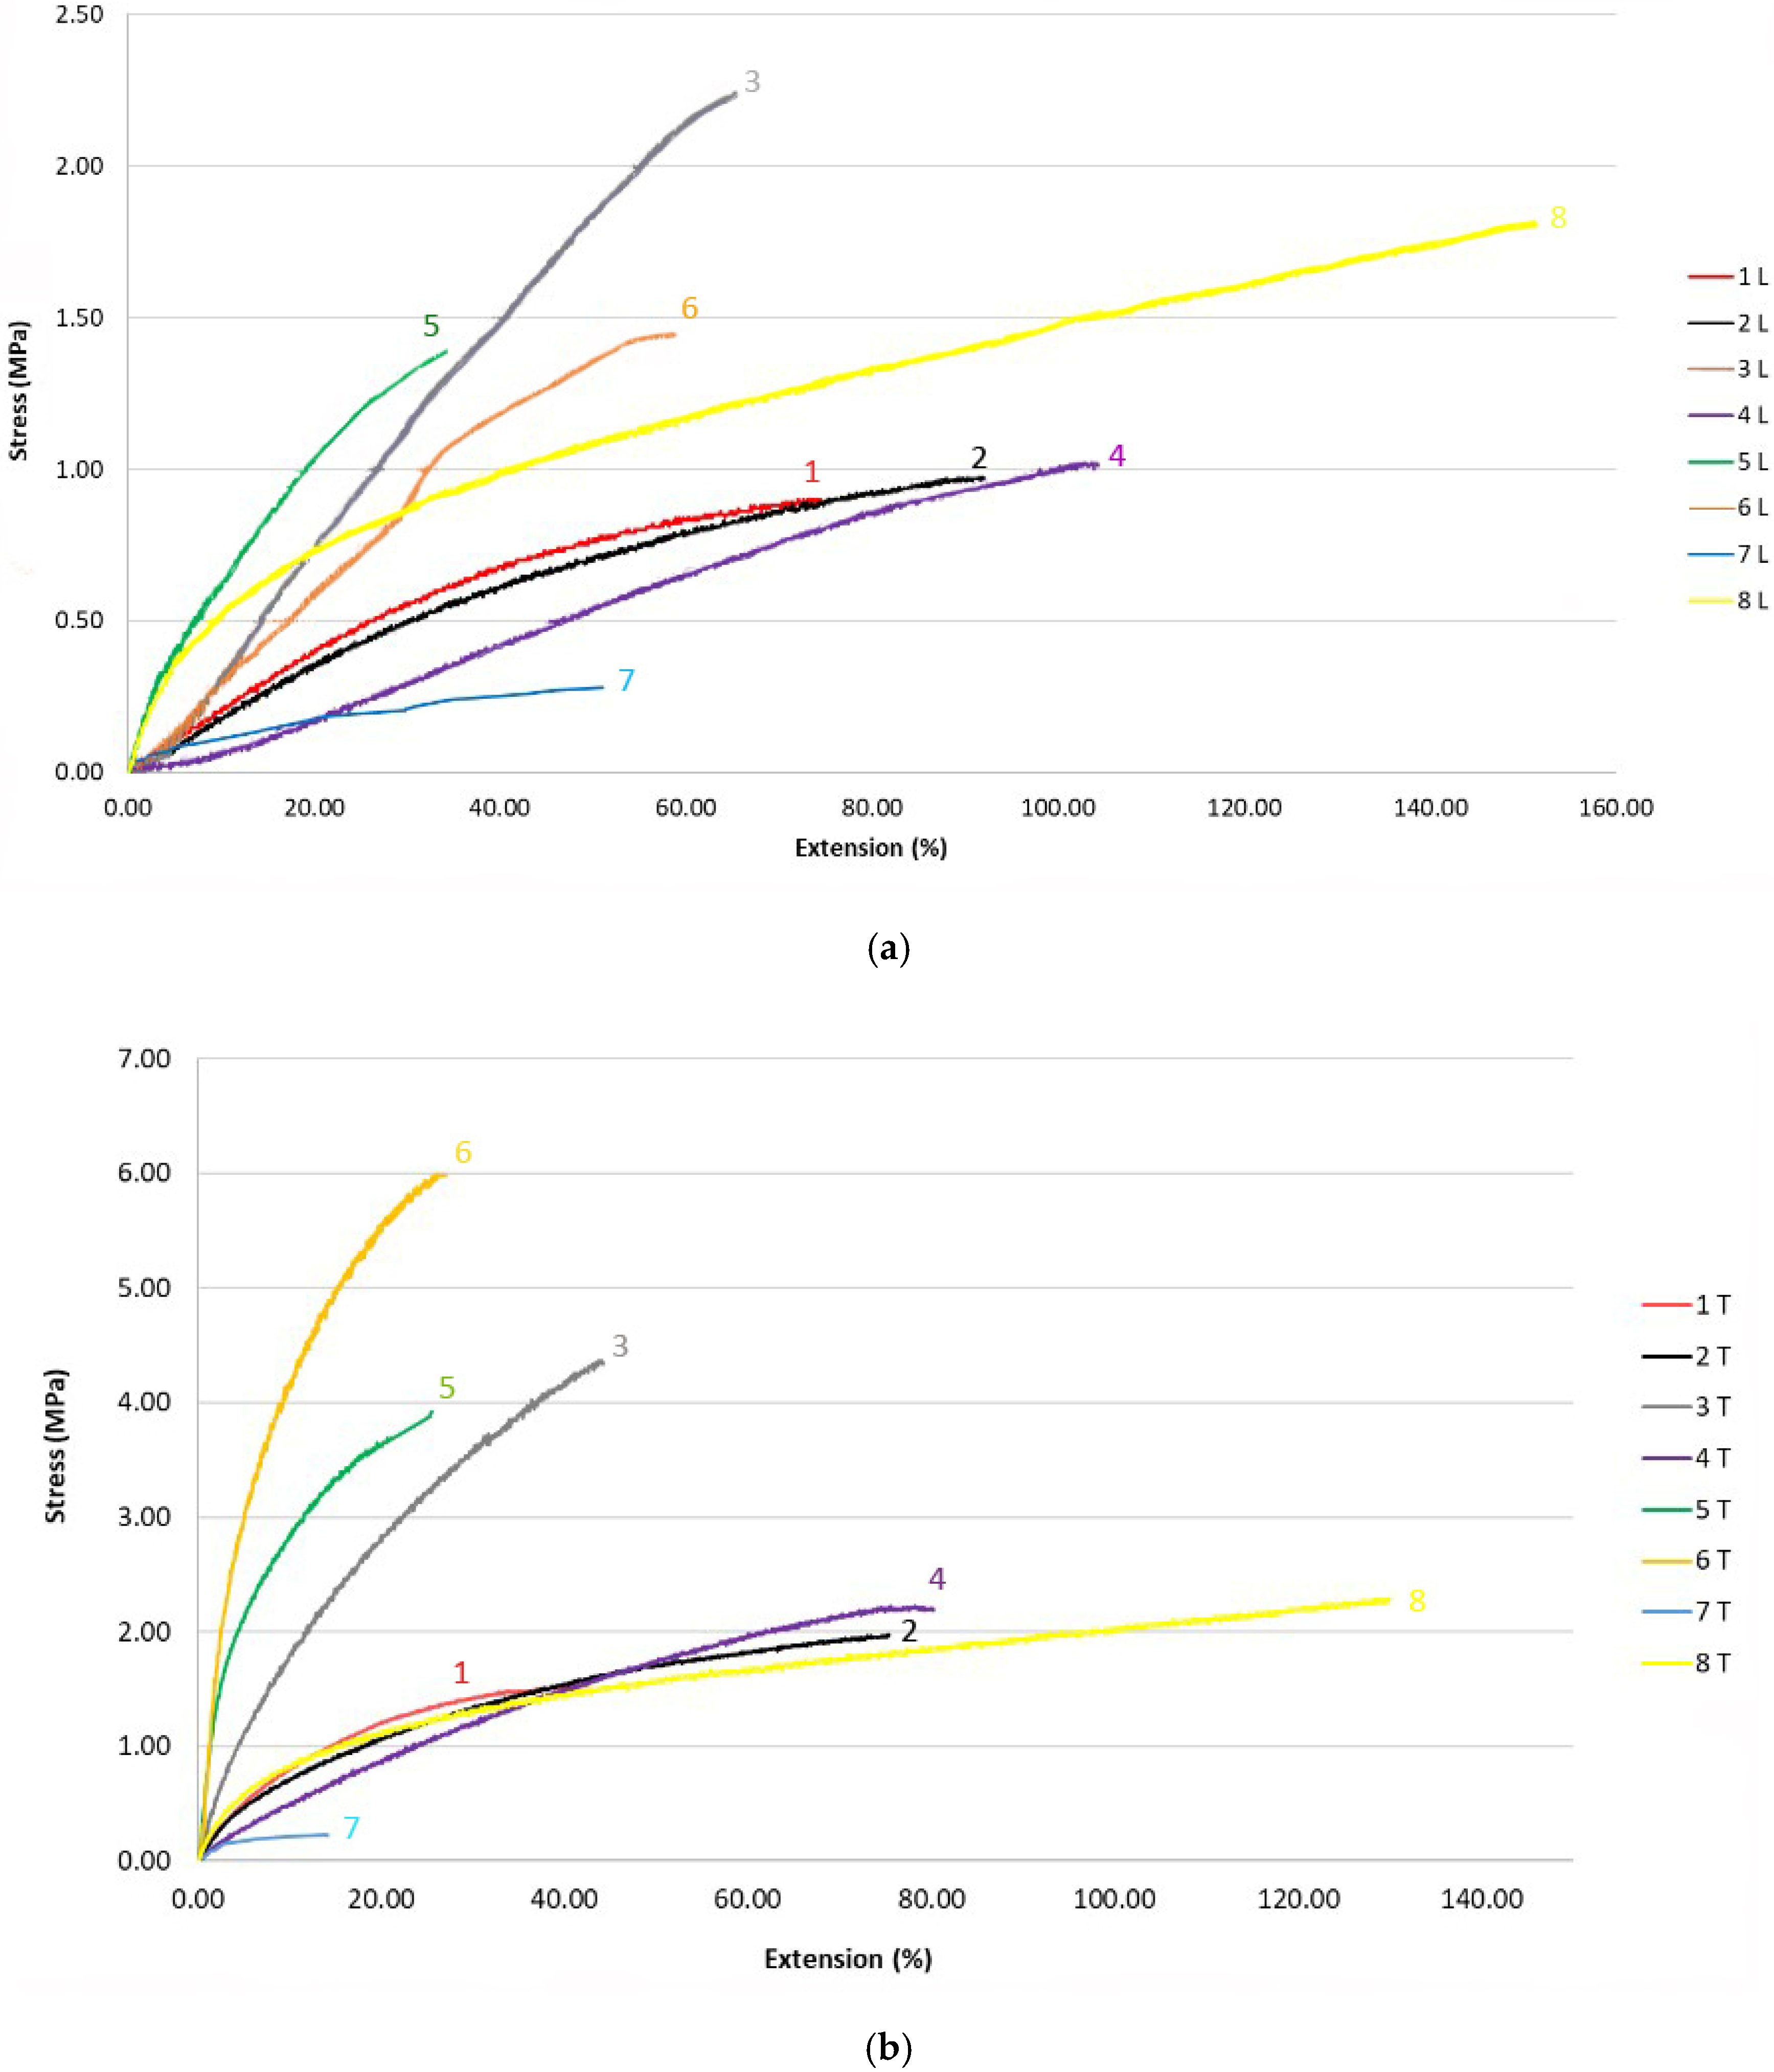
4.4. Breaking Stress and Extension
4.5. Water Vapour Permeability and Air Permeability
4.6. Porosity
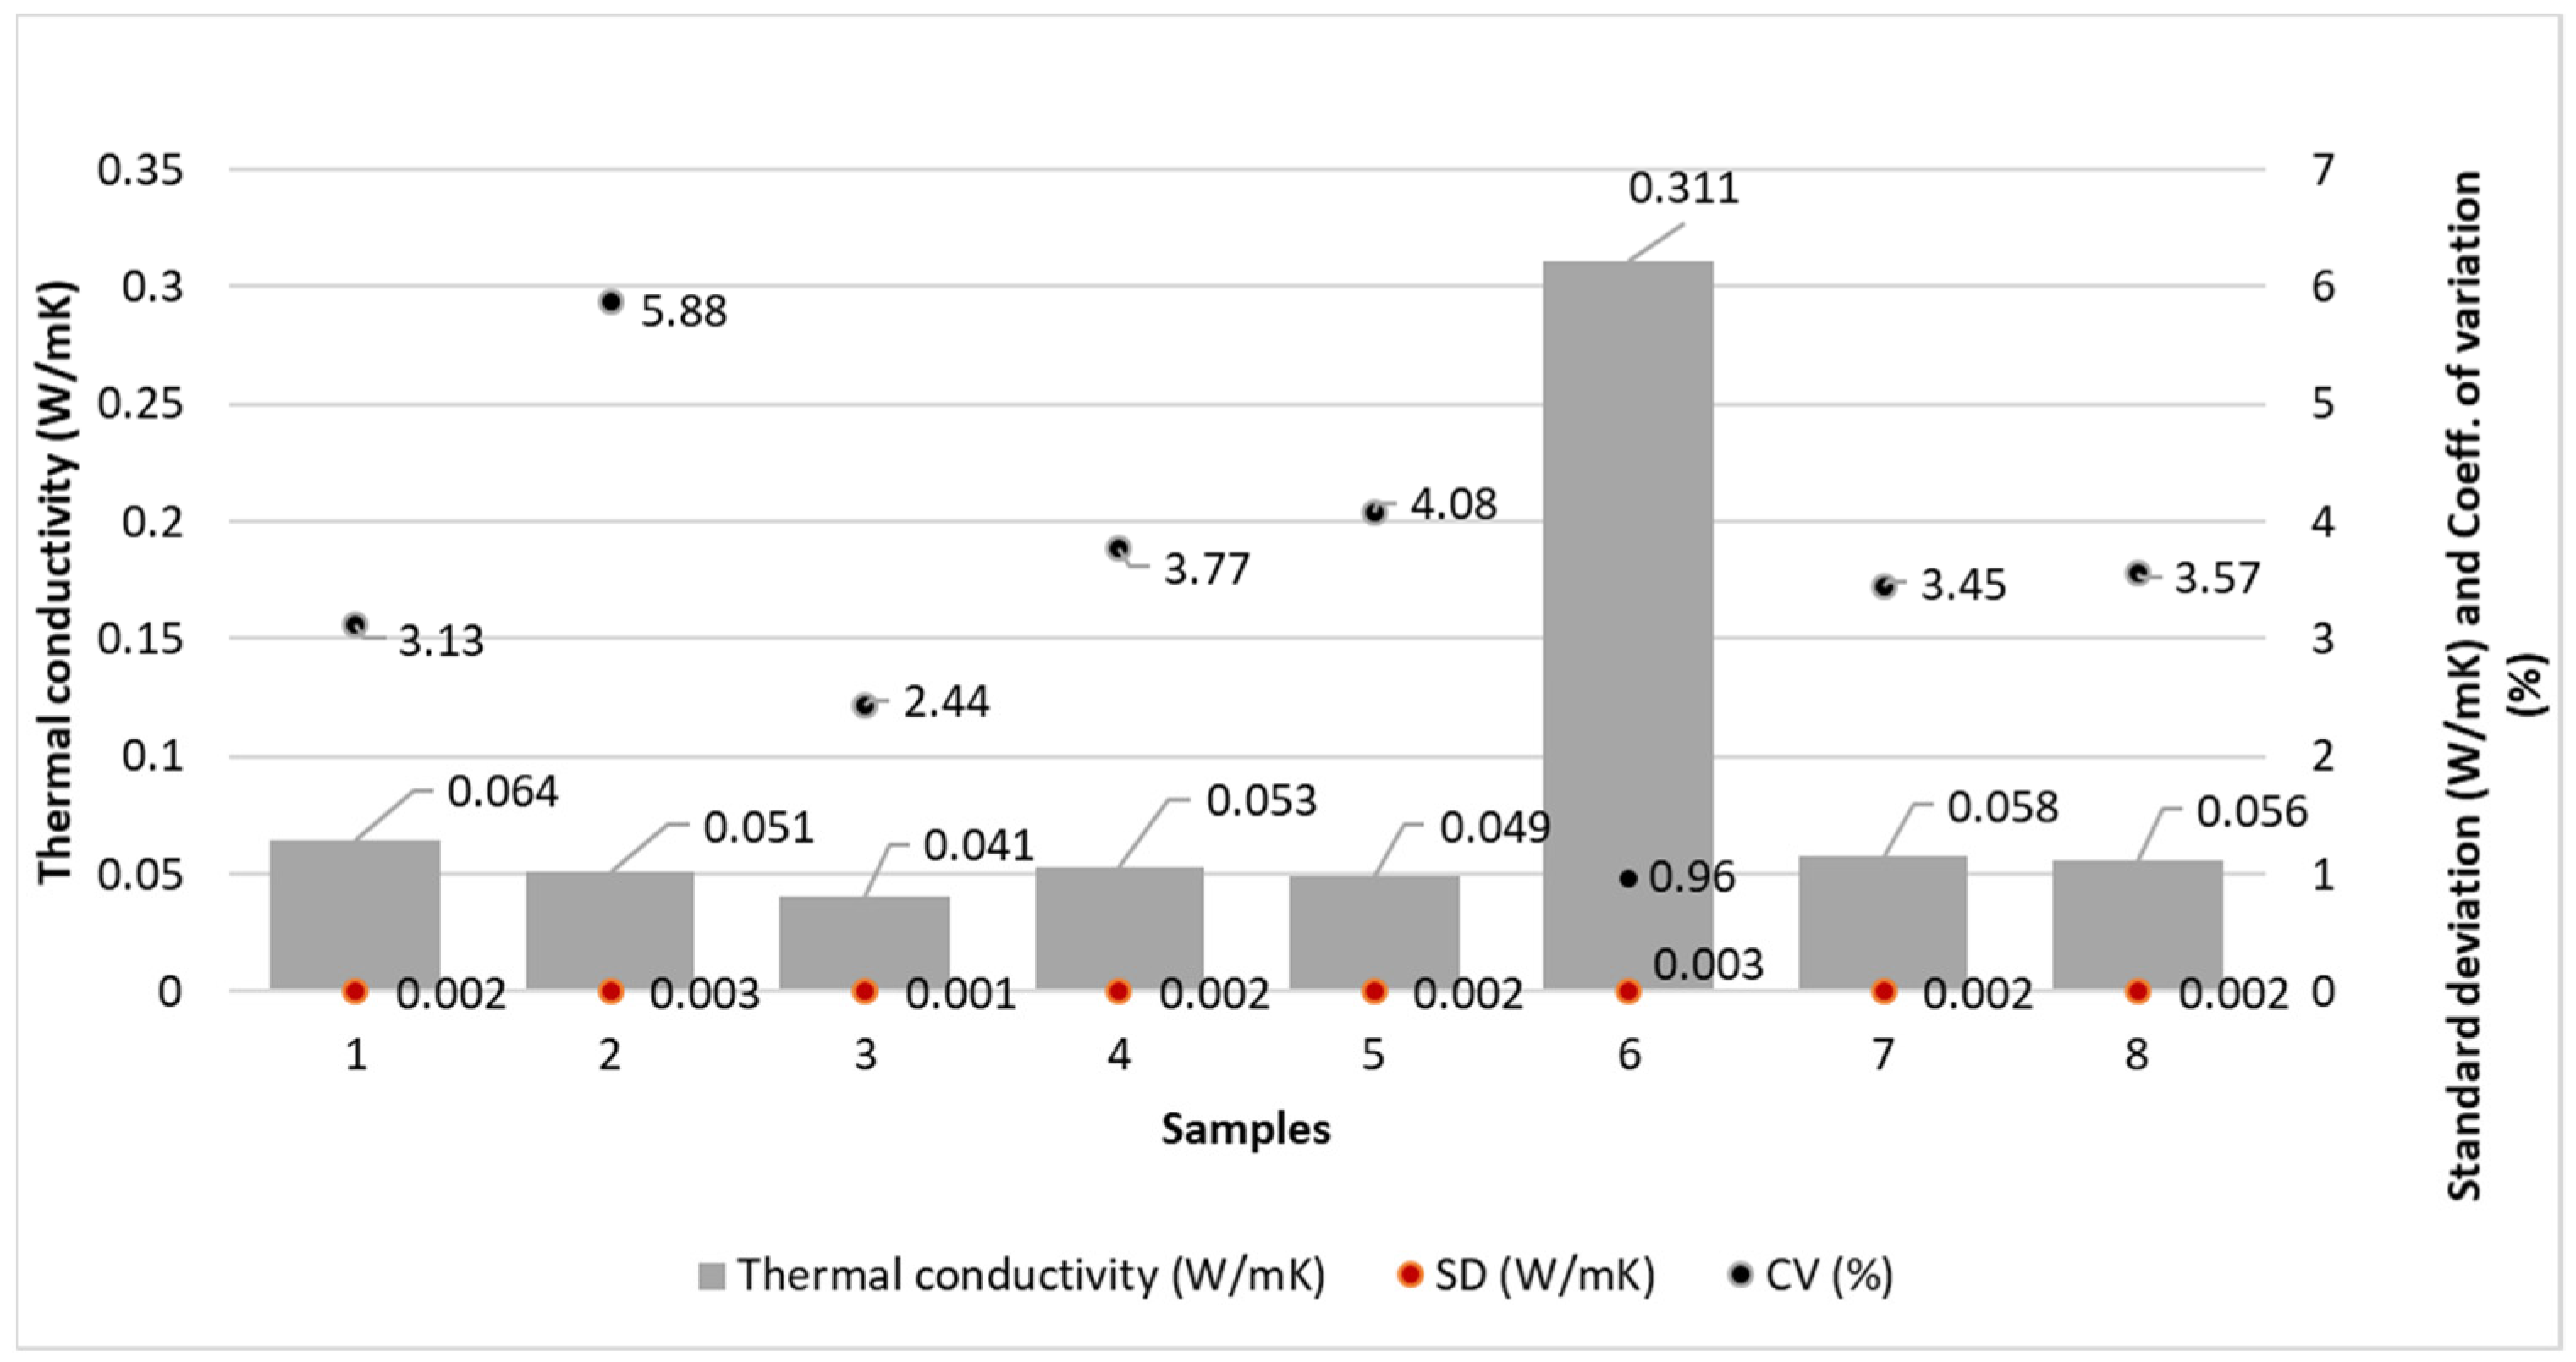
4.7. Thermal Conductivity
4.8. Statistical Analysis
5. Discussion
5.1. The Discussion of Fibre Diameter Results
5.2. The Discussion of Thickness and Mass Results
5.3. The Discussion of Breaking Stress and Extension Results
5.4. The Discussion of Water Vapour Permeability Results
5.5. The Discussion of Porosity Results
5.6. The Discussion of Thermal Conductivity Results
6. Conclusions
Author Contributions
Funding
Institutional Review Board Statement
Informed Consent Statement
Data Availability Statement
Conflicts of Interest
References
- Rohani, A.; Nouri, A. Advances in Functional and Protective Textiles, 1st ed.; Woodhead Publishing Limited: Oxford, UK, 2020; pp. 291–310. [Google Scholar]
- Gericke, A.; Venkataraman, M.; Militky, J.; Steyn, H.; Vermaas, J. Unmasking the Mask: Investigating the Role of Physical Properties in the Efficacy of Fabric Masks to Prevent the Spread of the COVID-19 Virus. Materials 2021, 14, 7756. [Google Scholar] [CrossRef] [PubMed]
- Song, G. Improving Comfort in Clothing, 1st ed.; Woodhead Publishing Limited: Oxford, UK, 2011; pp. 114–134. [Google Scholar]
- Horrocks, A.R.; Subhash, C.A. Handbook of Technical Textiles, 2nd ed.; Woodhead Publishing Limited: Cambridge, UK, 2016; pp. 135–164. [Google Scholar]
- Morris, H.; Murray, R. Non-implantable medical textiles. In Book Medical Textiles, 1st ed.; CRC Press: New Delhi, India, 2021; p. 38. [Google Scholar]
- Qin, Y. Medical Textile Materials, 1st ed.; Elsevier: London, UK, 2016; pp. 13–22. [Google Scholar]
- Shahjalal, M.; Mridha, J.H.; Hasan, S.M.; Alam, A.M.R. Medical Textiles: Application of implantable medical textiles. Glob. J. Med. Res. 2019, 19, 1–6. [Google Scholar]
- Guru, R.; Kumar, A.; Grewal, D.; Kumar, R. To Study the Implantable and Non-Implantable Application in Medical Textile, 1st ed.; IntechOpen Limited: London, UK, 2022; pp. 1–14. [Google Scholar]
- Parvin, F.; Islam, S.; Urmy, Z.; Ahmed, S. A study on the textile materials applied in human medical treatment. Eur. J. Physiother. 2020, 1, 56–80. [Google Scholar]
- Somkuwar, V.; Kumar, B. Textiles for Functional Application, 1st ed.; IntechOpen Limited: London, UK, 2021; pp. 195–209. [Google Scholar]
- Kaira, J.; Lightner, N.J.; Taiar, R. Advances in Human Factors and Ergonomics in Healthcare and Medical Devices, 1st ed.; Springer: Cham, Switzerland, 2021; pp. 619–639. [Google Scholar]
- Karthik, T.; Karan, P.C.P.; Rathinamoorthy, R. Nonwovens: Process, Structure, Properties and Applications, 1st ed.; CRC Press: New Delhi, India, 2017; pp. 1–87. [Google Scholar]
- Chapman, R. Application of Nonwovens in Technical Textiles, 1st ed.; Woodhead Publishing Limited: Cambridge, UK, 2010; pp. 3–16. [Google Scholar]
- Albrecht, W.; Fuchs, H.; Kittelmann, W. Nonwoven Fabrics: Raw Materials, Manufacture, Applications, Characteristics, 1st ed.; Wiley-VCH: Weinheim, Germany, 2003; pp. 15–96. [Google Scholar]
- Šaravanja, A.; Pušić, T.; Dekanić, T. Microplastics in Wastewater by Washing Polyester Fabrics. Materials 2022, 15, 2683. [Google Scholar] [CrossRef] [PubMed]
- Battegazzore, D.; Cravero, F.; Frache, A. Is it Possible to Mechanical Recycle the Materials of the Disposable Filtering Masks? Polymers 2020, 12, 2726. [Google Scholar] [CrossRef] [PubMed]
- Chennell, P.; Feschet, C.E.; Sautou, V.; Mailhot, J.B. Preparation of ordered mesoporous and macroporous thermoplastic polyurethane surfaces for potential medical applications. J. Biomater. Appl. 2018, 32, 1317–1328. [Google Scholar] [CrossRef] [PubMed]
- Ahmed, F.; Ahmad, I.; Munir, S. Developments in health care and medical textiles. Pak. J. Nutr. 2014, 13, 780–783. [Google Scholar] [CrossRef]
- Wibisono, Y.; Fadila, C.R.; Saiful, S.; Bilad, M.R. Facile Approaches of Polymeric Face Masks Reuse and Reinforcements for Micro-Aerosol Droplets and Viruses Filtration: A Review. Polymers 2020, 12, 2516. [Google Scholar] [CrossRef] [PubMed]
- Chellamani, K.P.; Veerashubramanian, D.; Balaji, R.S.V. Surgical Face Masks: Manufacturing Methods and Classification. J. Acad. Ind. Res. 2013, 2, 320–324. [Google Scholar]
- Yekrang, J.; Semnani, D.; Seyghalani, A.; Razavi, S. A novel biodegradable micro-nano tubular knitted structure of PGA braided yarns and PCL nanofibres applicable as esophagus prosthesis. Indian J. Fiber Text. Res. 2017, 42, 264–270. [Google Scholar]
- Gokarneshan, N.A. Review of some recent breaktroughts in medical textiles research. Curr. Trends Fash. Technol. Text. Eng. 2018, 2, 1–5. [Google Scholar]
- Chen, X.; Hou, D.; Wang, L.; Zhang, Q.; Zou, J.; Sun, G. Antibacterial Surgical Silk Sutures Using a High-Performance Slow-Release Carrier Coating System. ACS Appl. Mater. Interfaces 2015, 40, 394–403. [Google Scholar] [CrossRef] [PubMed]
- Zhang, G.; Liu, Y.; Morikawa, H.; Chen, Y. Application of ZnO nanoparticles to enhance the antimicrobial activity and ultraviolet protective property of bamboo pulp fabric. Cellulose 2013, 20, 1877–1884. [Google Scholar] [CrossRef]
- Gorjanc, D.S. Nonwoven textiles at Techtextil 2019. Tekstilec 2020, 63, 56–66. [Google Scholar]
- ISO 9073-2; Textiles-Test Methods for Nonwovens—Part 2: Determination of Thickness. ISO: Geneva, Switzerland, 1995.
- ISO 9073-1; Textiles-Test Methods for Nonwovens—Part 1: Determination of Mass per Unit Area. ISO: Geneva, Switzerland, 1989.
- ISO 9073-3; Textiles-Test Methods for Nonwovens—Part 3: Determination of Tensile Strenght and Elongation. ISO: Geneva, Switzerland, 1989.
- ASTM:E96:E96M; Standard Test Methods for Water Vapor Transmission of Materials. ASTM: West Conshohocken, PA, USA, 2016.
- ISO 9237; Textiles—Determination of Permeability of Fabrics to Air. ISO: Geneva, Switzerland, 1995.
- Jakšić, D.; Jakšić, N. Assessment of porosity of flat textile fabrics. Text. Res. J. 2007, 77, 105–110. [Google Scholar] [CrossRef]
- Hu, J. Fabric Testing, 1st ed.; CRC Press: Washington, DC, USA, 2008; pp. 90–251. [Google Scholar]
- Wang, L. Performance Testing of Textiles: Methods, Technology and Applications, 1st ed.; Elsevier: Cambridge, MA, USA, 2016; pp. 129–152. [Google Scholar]
- Yong, L.; Jian, L.; Xian, L.; Bei, W. Test and analysis of the porosity of cotton fiber assembly. J. Eng. Fibers Fabr. 2021, 16, 1–7. [Google Scholar] [CrossRef]
- DIN 52 612; Testing of Thermal Insulating Materials; Determination of Thermal Conductivity by the Guarded Hot Plate Apparatus; Test Procedure and Evaluation. DIN: Berlin, Germany, 1979.
- Nagla, J.R. Statistics for Textile Engineers, 1st ed.; Woodhead Publishing Limited: New Delhi, India, 2014; pp. 5–90. [Google Scholar]


| Sample | Raw Material Composition | Type of Base Layer |
|---|---|---|
| 1 | PP/PE | Single layer spunbond process—S |
| 2 | PP/PE | Two-layer spunbond process—SS |
| 3 | PP | Three-layer spunbond process—SSS |
| 4 | PP | Three-layer spunbond process—SSS |
| 5 | PP | Five-layer composite of spunbond and meltblown processes—SSMMS |
| 6 | PP | Five-layer composite of spunbond and meltblown processes—SSMMS |
| 7 | PE | Single layer meltblown process—MB |
| 8 | PU | Single layer meltblown process—MB |
| Sample | Fibre Diameter | ||
|---|---|---|---|
| Average Value [μm] | Standard Deviation (SD) [μm] | Coefficient of Variation (CV) [%] | |
| Spunbond process | |||
| 1 | 19.34 | 1.021 | 5.28 |
| 2 | 19.57 | 0.594 | 3.03 |
| 3 | 11.53 | 0.427 | 3.70 |
| 4 | 17.46 | 0.602 | 3.45 |
| SSMMS process | |||
| 5 | |||
| A | 2.40 | 0.08 | 3.33 |
| B | 17.41 | 0.69 | 3.99 |
| 6 | |||
| A | 1.86 | 0.022 | 1.18 |
| B | 12.84 | 0.462 | 3.59 |
| Meltblown process | |||
| 7 | 2.81 | 0.074 | 2.64 |
| 8 | 3.55 | 0.12 | 3.59 |
| Sample | Thickness | Mass | ||||
|---|---|---|---|---|---|---|
| Average [Mm] | Standard Deviation; SD [Mm] | Coefficient of Variation; CV [%] | Average Mass [G] | Mass per Unit Area [G/M2] | Coefficient of Variation; CV [%] | |
| Spunbond process | ||||||
| 1 | 0.366 | 0.013 | 3.50 | 1.70 | 30.91 | 0.61 |
| 2 | 0.236 | 0.016 | 6.77 | 1.45 | 26.36 | 1.15 |
| 3 | 0.116 | 0.008 | 6.90 | 0.73 | 13.27 | 0.73 |
| 4 | 0.216 | 0.014 | 6.48 | 1.42 | 25.82 | 0.49 |
| SSMMS process | ||||||
| 5 | 0.142 | 0.010 | 7.04 | 0.84 | 15.27 | 1.23 |
| 6 | 0.063 | 0.0007 | 1.10 | 0.42 | 7.64 | 0.77 |
| Meltblown process | ||||||
| 7 | 0.186 | 0.006 | 3.22 | 1.53 | 27.82 | 0.43 |
| 8 | 0.172 | 0.006 | 3.49 | 2.57 | 46.73 | 0.52 |
| Sample | Display of Samples at 25× Magnification | Display of Samples at 2000× Magnification |
|---|---|---|
| 1 | 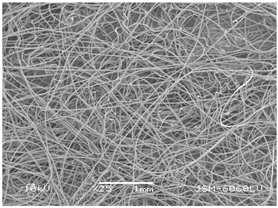 |  |
| 2 | 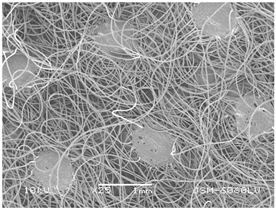 |  |
| 3 |  | 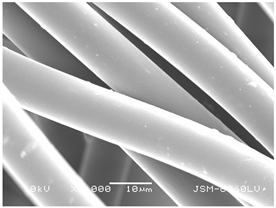 |
| 4 | 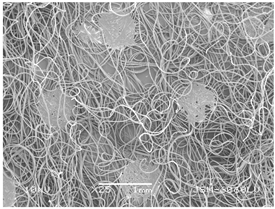 |  |
| 5 |  |  |
| 6 | 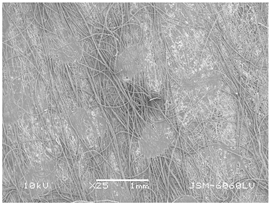 |  |
| 7 | 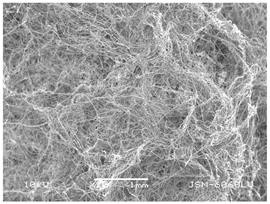 | 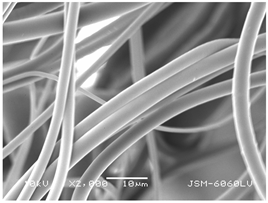 |
| 8 | 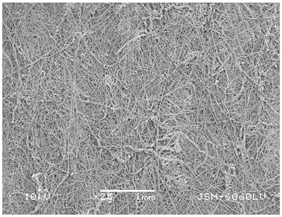 |  |
| Porosity Parameters | Samples | |||||||
|---|---|---|---|---|---|---|---|---|
| 1 | 2 | 3 | 4 | 5 | 6 | 7 | 8 | |
| Average pore diameter (µm) | 114.84 | 66.85 | 73.78 | 184.70 | 135.31 | 133.91 | 198.59 | 23.99 |
| Openness of surface (%) | 20.95 | 7.92 | 30.97 | 45.19 | 47.68 | 29.85 | 70.77 | 3.17 |
| Bubble point (µm) | 816 | 667 | 397 | 612 | 408 | 358 | 1049 | 90 |
| ANOVA for Breaking Stress Results | ||||||
|---|---|---|---|---|---|---|
| Source of Variation | SS | df | MS | F | p-value | F-crit |
| Between Groups (technology of web formation process) | 15.43 | 3 | 7.77 | 3.60 | 0.045 | 3.467 |
| ANOVA for Breaking Extension Results | ||||||
| Source of Variation | SS | df | MS | F | p-value | F-crit |
| Between Groups (technology of web formation process) | 25147.9 | 2 | 12573.9 | 3.91 | 0.036 | 3.467 |
| ANOVA for Water Vapour Permeability Results | ||||||
| Source of Variation | SS | df | MS | F | p-value | F-crit |
| Between Groups (technology of web formation process) | 42.7 | 2 | 21.3 | 2.67 | 0.123 | 4.257 |
| ANOVA for Air Permeability Results | ||||||
| Source of Variation | SS | df | MS | F | p-value | F-crit |
| Between Groups (technology of web formation process) | 1665.9 | 2 | 832.9 | 37.145 | 4.48⋅10−5 | 4.256 |
| ANOVA for Thermal Conductivity Results | ||||||
| Source of Variation | SS | df | MS | F | p-value | F-crit |
| Between Groups (technology of web formation process) | 0.041 | 2 | 0.02 | 1 | 0.12 | 4.256 |
| ANOVA for Porosity-Openness of Surface Results | ||||||
| Source of Variation | SS | df | MS | F | p-value | F-crit |
| Between Groups (technology of web formation process) | 365.8 | 2 | 182.9 | 0.29 | 0.75 | 4.25 |
Publisher’s Note: MDPI stays neutral with regard to jurisdictional claims in published maps and institutional affiliations. |
© 2022 by the authors. Licensee MDPI, Basel, Switzerland. This article is an open access article distributed under the terms and conditions of the Creative Commons Attribution (CC BY) license (https://creativecommons.org/licenses/by/4.0/).
Share and Cite
Čepič, G.; Gorjanc, D.Š. Influence of the Web Formation of a Basic Layer of Medical Textiles on Their Functionality. Polymers 2022, 14, 2258. https://doi.org/10.3390/polym14112258
Čepič G, Gorjanc DŠ. Influence of the Web Formation of a Basic Layer of Medical Textiles on Their Functionality. Polymers. 2022; 14(11):2258. https://doi.org/10.3390/polym14112258
Chicago/Turabian StyleČepič, Gracija, and Dunja Šajn Gorjanc. 2022. "Influence of the Web Formation of a Basic Layer of Medical Textiles on Their Functionality" Polymers 14, no. 11: 2258. https://doi.org/10.3390/polym14112258