Abstract
Nanocomposite polymer films are a very diverse research field due to their many applications. The search for low-cost, versatile methods, producing regulated properties of the final products, has thus become extremely relevant. We have previously reported a bulk-scale process, dispersing granulated metal oxide nanoparticles, of both unary and multi-component nature, in a low-density polyethylene (LDPE) polymer matrix, establishing a reference in the produced films’ optical properties, due to the high degree of homogeneity and preservation of the primary particle size allowed by this method. In this work, unmodified, free-standing particles, namely zinc oxide (), titanium dioxide (), aluminum oxide (), and silicon dioxide () are blended directly with LDPE, and the optical properties of the fabricated films are compared to those of films made using the granulation process. The direct blending process evidently allows for control of the secondary particle size and ensures a homogeneous dispersion of the particles, albeit to a lesser extent than the granulation process. Despite the secondary particle size being comparatively larger than its granulated counterpart, the process still provides a regulated degree of deagglomeration of the free-standing oxide particles, so it can be used as a low-cost alternative. The regulation of the secondary particle size tunes the transmission and reflection spectra, in both unary and mixed oxide compositions. Finally, the direct blending process exhibits a clear ability to tune the energy band gap in mixed oxides.
1. Introduction
Advances in nanotechnology have led to the development of new fabrication techniques incorporating nanomaterials of different shapes and sizes embedded in bulk polymer hosts [1,2,3,4,5,6,7]. The synergy results between particles and matrix have been found to have profound effects on the end products’ optical properties [8,9,10,11,12]. More importantly, controlling the main parameters of the fabrication process, such as the size, shape, concentration, and spatial distribution of the dispersoid, as well as its blending into the polymer matrix, allows a direct regulation of the materials’ properties [13,14,15,16,17].
Within this framework, in previously published work [18], bulk quantities of unary and mixed deagglomerated oxide particles of predetermined composition were homogeneously dispersed in low-density polyethylene (LDPE) films. A multi-stage granulation process was designed to establish the utmost uniform oxide dispersion in the film while regulating the primary and secondary size of the particles. Given the homogeneous dispersion, the capability to control both the primary and secondary particle size of the oxides provides the means for a tailored optical performance. In particular, it was shown that by using predetermined amounts of mixed granulated oxides, a film could be fabricated with a made-to-order optical performance, characterized by a predefined energy band gap and transmission fraction value. The latter could be adjusted anywhere in between the transmission fraction values of its corresponding pure oxides when used on an individual basis.
Even though the tailored optical performance of the LDPE film is of unequivocal value and the applications are numerous, its realization is dependent on the primary and secondary oxide particle sizes that are obtained through a granulation process that might be prohibitive in cost.
Hence, this work reports results on an alternative approach using the same unary and mixed unmodified, free-standing oxide particles. However, in this case, the dispersion is achieved by blending them directly with LDPE. Despite its limitation in achieving a high degree of homogeneity and its inability to control the primary particle size, this process provides a regulated, albeit limited, deagglomeration capability of the free-standing oxide particles.
This technique can be used as a low-cost alternative for controlling the transmission of the films, especially when compared directly to the standardized transmission of films with granulated particles. More specifically, the LDPE films fabricated by direct mixing of the oxides exhibit lower transmission than their granulated counterparts, due to their larger secondary particle size. Hence, a comparative study between the two techniques allows for a generalized and direct evaluation of the optical performance of the films produced by the direct mixing of free-standing particles, opening up new methods for improvement.
2. Sample Preparation and Characterization
2.1. Materials
A bulk-scale process is implemented for the production of nanostructured film composites comprising single and mixed oxide particle formulations dispersed in an LDPE matrix. The choice of LDPE as a hosting material for the dispersed nanoparticles was based on its optical properties allowing for a wide range of applications [19,20,21,22], its low cost, and its compatibility with established fabrication processes. As shown in Table 1, four types of free-standing metal oxides, namely (Sigma-Aldrich, Darmstadt, Germany), (Sigma-Aldrich and Alfa Aesar, Karlsruhe, Germany), (Sigma-Aldrich), and (Alfa Aesar, SSNano, Houston, TX, USA and Sigma-Aldrich) were embedded in LDPE, either in single or mixed formulation. The embedded single-oxide formulations are classified into three categories, depending on their free-standing particle size range: (i) less than 100 nm, (ii) between 0.1 and 1 m, and (iii) between 1 and 10 m.

Table 1.
Free-standing size of , , , and particles embedded in single or mixed formulation in LDPE.
Four single oxide formulations (i.e., , and ) of all sizes, and three 1:1 equimolar mixed oxide formulations, where each formulation comprised a mixture of two single oxides (i.e., --, and -) were used to produce twelve films of free-standing particles, embedded in LDPE. The aforementioned single oxides, with the exception of , were used in unary and mixed composition to produce granulated particles, which were subsequently embedded in the LDPE matrix, producing six additional films. Finally, a film of neat LDPE was fabricated for reference.
2.2. Free-Standing Single and Mixed Oxides
Each type of free-standing oxide formulation was blended with LDPE through an extrusion pelletizing process [23]. This was implemented by an AXON BX-18 bench extruder that was set up for pelletizing, producing 13 masterbatches, including one of neat LDPE. The masterbatches contained the active ingredient (i.e., as defined by the type of oxide formulation) in a predetermined proportion, which was set at by mass (20 g of active ingredient blended with 80 g of LDPE). The three mixed-oxide masterbatches were fabricated using the same composition, by blending by mass 1:1 equimolar mixtures of two single oxides (i.e., --, and -), as given in Table 2. It is noted that the oxides used for this purpose belong to the smallest free-standing particle range (< 100 nm) of Table 1.
Table 2.
Mass composition per 1–1 equimolar type of mixed oxide. Nanoparticle free-standing size is 12 nm, 40–50 nm, and 25 nm for , , and , respectively.
Each masterbatch was subsequently blended at by mass with LDPE, through an extrusion film-blowing process [24] that was implemented by the aforementioned AXON BX-18 bench extruder, which was set up with a film-blowing head. As the masterbatch proportion in the film was set at (i.e., 100 g of masterbatch in 900 g of LDPE), the active ingredient in the film was reduced to by mass (i.e., 20 g of the dispersoid in 980 g of LDPE). It is finally noted that the films have a thickness of 70 m.
2.3. Granulated Single and Mixed Oxides
Three of the as-received oxide formulations, as shown in Table 1, were suspended, on an individual basis, in water by using poly(acrylic acid) dispersant (PAA). The oxides used for this purpose belong to the particle range < 100 nm. The as-suspended particles were deagglomerated by applying ball and/or planetary milling and then were wet-sieved at 45 m before being forced through a nozzle in the presence of liquid nitrogen to yield granulated particles (granules) in the range of 20–300 m that were subsequently freeze-dried in vacuum at mbar and −16 °C.
The mixed oxide formulations (i.e., --, and -) of the granulated type were also fabricated using combinations of free-standing oxide particles. The granulation of mixed oxides was obtained in a manner comparable to that used for single oxides, with the utmost attention given to obtaining the mutual suspension of the free-standing oxides in water via the use of PAA. Following the initial extrusion pelletizing process, the granulated particles were dispersed in LDPE through a film-blowing process.
It is noted that for both techniques, incorporating either free-standing or granulated particles, the extrusion process was identical, with the temperature kept at 250 °C, in order to ensure the stability of poly(acrylic acid) in the granulated samples [25]. The granulation technique described herein is a hybrid approach [18] between direct solvent blending [26,27,28] and direct melt blending [26,29,30]. A detailed report of the 19 films produced incorporating both techniques is given in Table 3.
Table 3.
Detailed account of nanocomposite films produced, indicating active material, particle size, and type of embedded dispersoid.
2.4. Sample Characterization
The fabricated films were morphologically and optically characterized using a wide variety of techniques. The use of a Zeiss Axiolab 5 microscope (Zeiss, Oberkochen, Germany), in transmission mode, with an A-Plan, , objective lens allowed for direct imaging of the films and particle dispersion in the matrix.
Roughness evaluation was achieved through AFM measurements using a Brüker Multimode device (VEECO Multimode, Santa Barbara, CA, USA), equipped with a Nanoscope III controller. The polymer film surface was investigated in intermittent (tapping) mode, under ambient conditions.
The chemical signature of the samples was investigated through Raman spectra, collected using an i-Raman Plus spectrometer (B&W TEK Inc., Plainsboro, NJ, USA). The excitation source was a diode laser (785 nm) with a maximum output power of 300 mW.
The chemical composition measurements were complemented using a theta–theta diffractometer (Rigaku Ultima IV, Tokyo, Japan) equipped with a tube, operated at 40 kV and 40 mA, using a parallel X-ray beam (, nm) conditioned by an X-ray mirror. The patterns were collected in Bragg–Brentano scans in the range of – , with step and speed of /min.
Finally, UV-Vis-IR transmission and diffuse reflection spectra of the samples and reference material (spectolon) were recorded in the 250–2500 nm range using a Perkin Elmer Lambda 1050+ spectrophotometer (Perkin Elmer, Waltham, MA, USA), incorporating an integrated sphere setup (scan speed of 548 nm/min, slit width of nm).
3. Results and Discussion
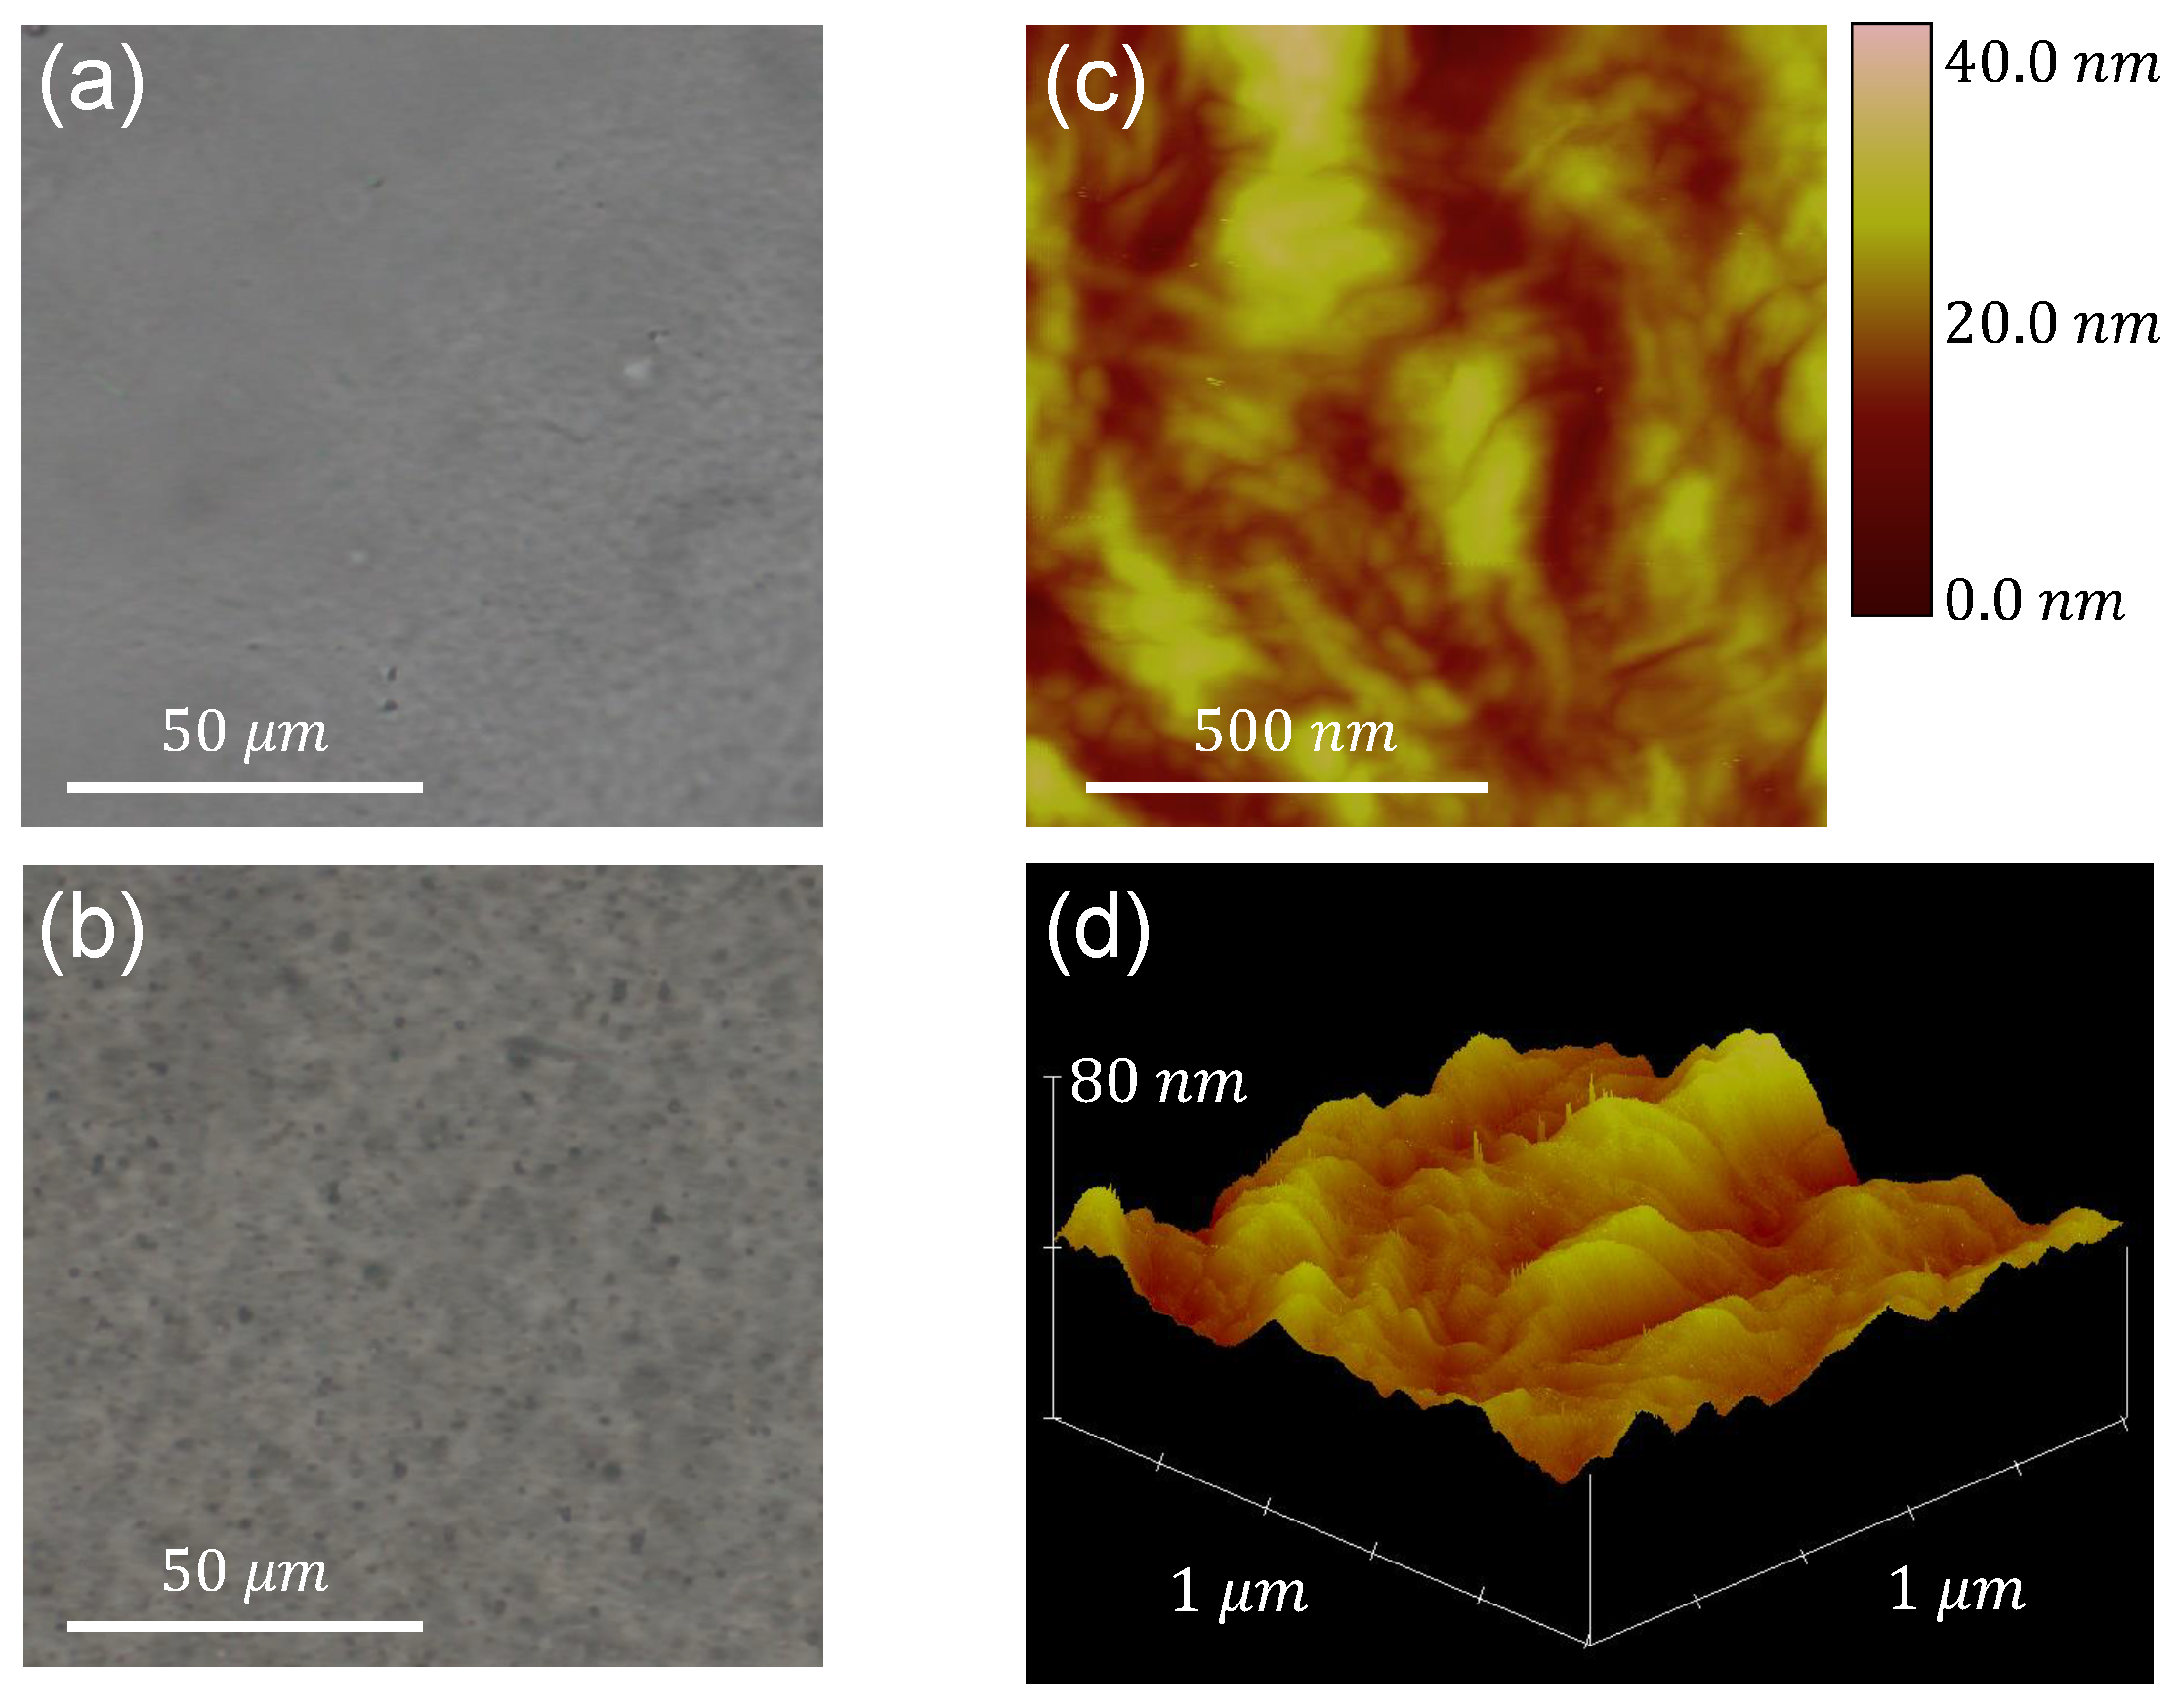
The image acquisition of metal oxides embedded in the films is done using the optical microscope, albeit only for the case of the larger particle sizes. In Figure 1a,b, the neat LDPE film and a film containing (< 5 m) particles, respectively, are depicted, providing an initial assessment of the particles’ dispersion inside the polymer matrix.

Figure 1.
Optical microscope images of (a) neat LDPE and (b) the film containing (< 5 m). (c) AFM image with colorscale indicating z-coordinate values and (d) 3D plot of z-coordinate for a surface of size m, of the film containing (< 5 m).
The roughness of each film’s surface is subsequently characterized by means of AFM measurements. A phase image and a 3D plot of the z-coordinate of the film’s surface acquired through this technique are presented in Figure 1c,d, respectively, for the case of the aforementioned sample. Characterization of the roughness of the film’s surface is achieved by determining the (arithmetic average) and (root mean square) roughnesses. Both parameters are calculated using the measurements of the z-coordinate (height) of the surface as follows [31]:
where is the distance from the average surface level, and N is the number of points. The roughness values are calculated for all samples, and it is concluded that the direct blending technique produces films with very similar surface morphology, regardless of the type and size of dispersoid embedded in the polymer. As an example, the values extracted for all -containing samples and neat LDPE, calculated from m images, are presented in Table 4.
Table 4.
Roughness values of composite films and neat LDPE.
Each sample chemical signature has been verified via complementary Raman and XRD techniques. Raman shift lines, in the range of 800–3100 cm, of the (< 5 m) containing film are depicted in Figure 2a, after fluorescence background subtraction. The observed lines correspond to LDPE and are in very good agreement with the literature [32,33,34,35,36]. The 1060 cm and 1126 cm lines arise from vibrations of the asymmetric and symmetric -C-C stretching, respectively. The characteristic line at 1292 cm, corresponding to the - twisting vibrational mode in the polyethylene crystalline phase, is also clearly resolved. Additional lines at 1415 cm, 1437 cm, and 1458 cm are associated to one wagging and two scissoring modes of the - groups, respectively. Finally, the two lines observed at 2845 cm and 2873 cm are attributed to asymmetric and symmetric stretching, respectively.
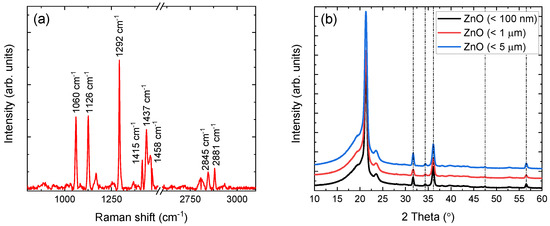
Figure 2.
(a) Raman shift lines of LDPE in (< 5 m) containing film, with an axis break for clarity. (b) XRD patterns of dispersoids embedded in LDPE. Nanoparticle sizes of < 100 nm (black), < 1 m (red), and < 5 m (blue) are shifted vertically for clarity.
Although the polymer percentage in each sample allows the direct observation of Raman shift lines, this is not the case for the dispersoid, whose percentage is significantly lower (i.e., ). For this reason, the XRD patterns of all the -containing films were acquired and are shown in Figure 2b. In addition to the characteristic peaks of LDPE, also presented in previous work [18], all samples yield the characteristic peaks of hexagonal at , , , , and [37]. The FWHM values of all peaks (excluding the peak at , which overlaps with an LDPE peak), without any processing, lie in the range between and , indicating crystallite sizes between 20 nm and 26 nm according to the Scherrer formula [38]. This latter result, confirmed further by initial spectroscopic analysis, is currently under study and will be presented in future work.
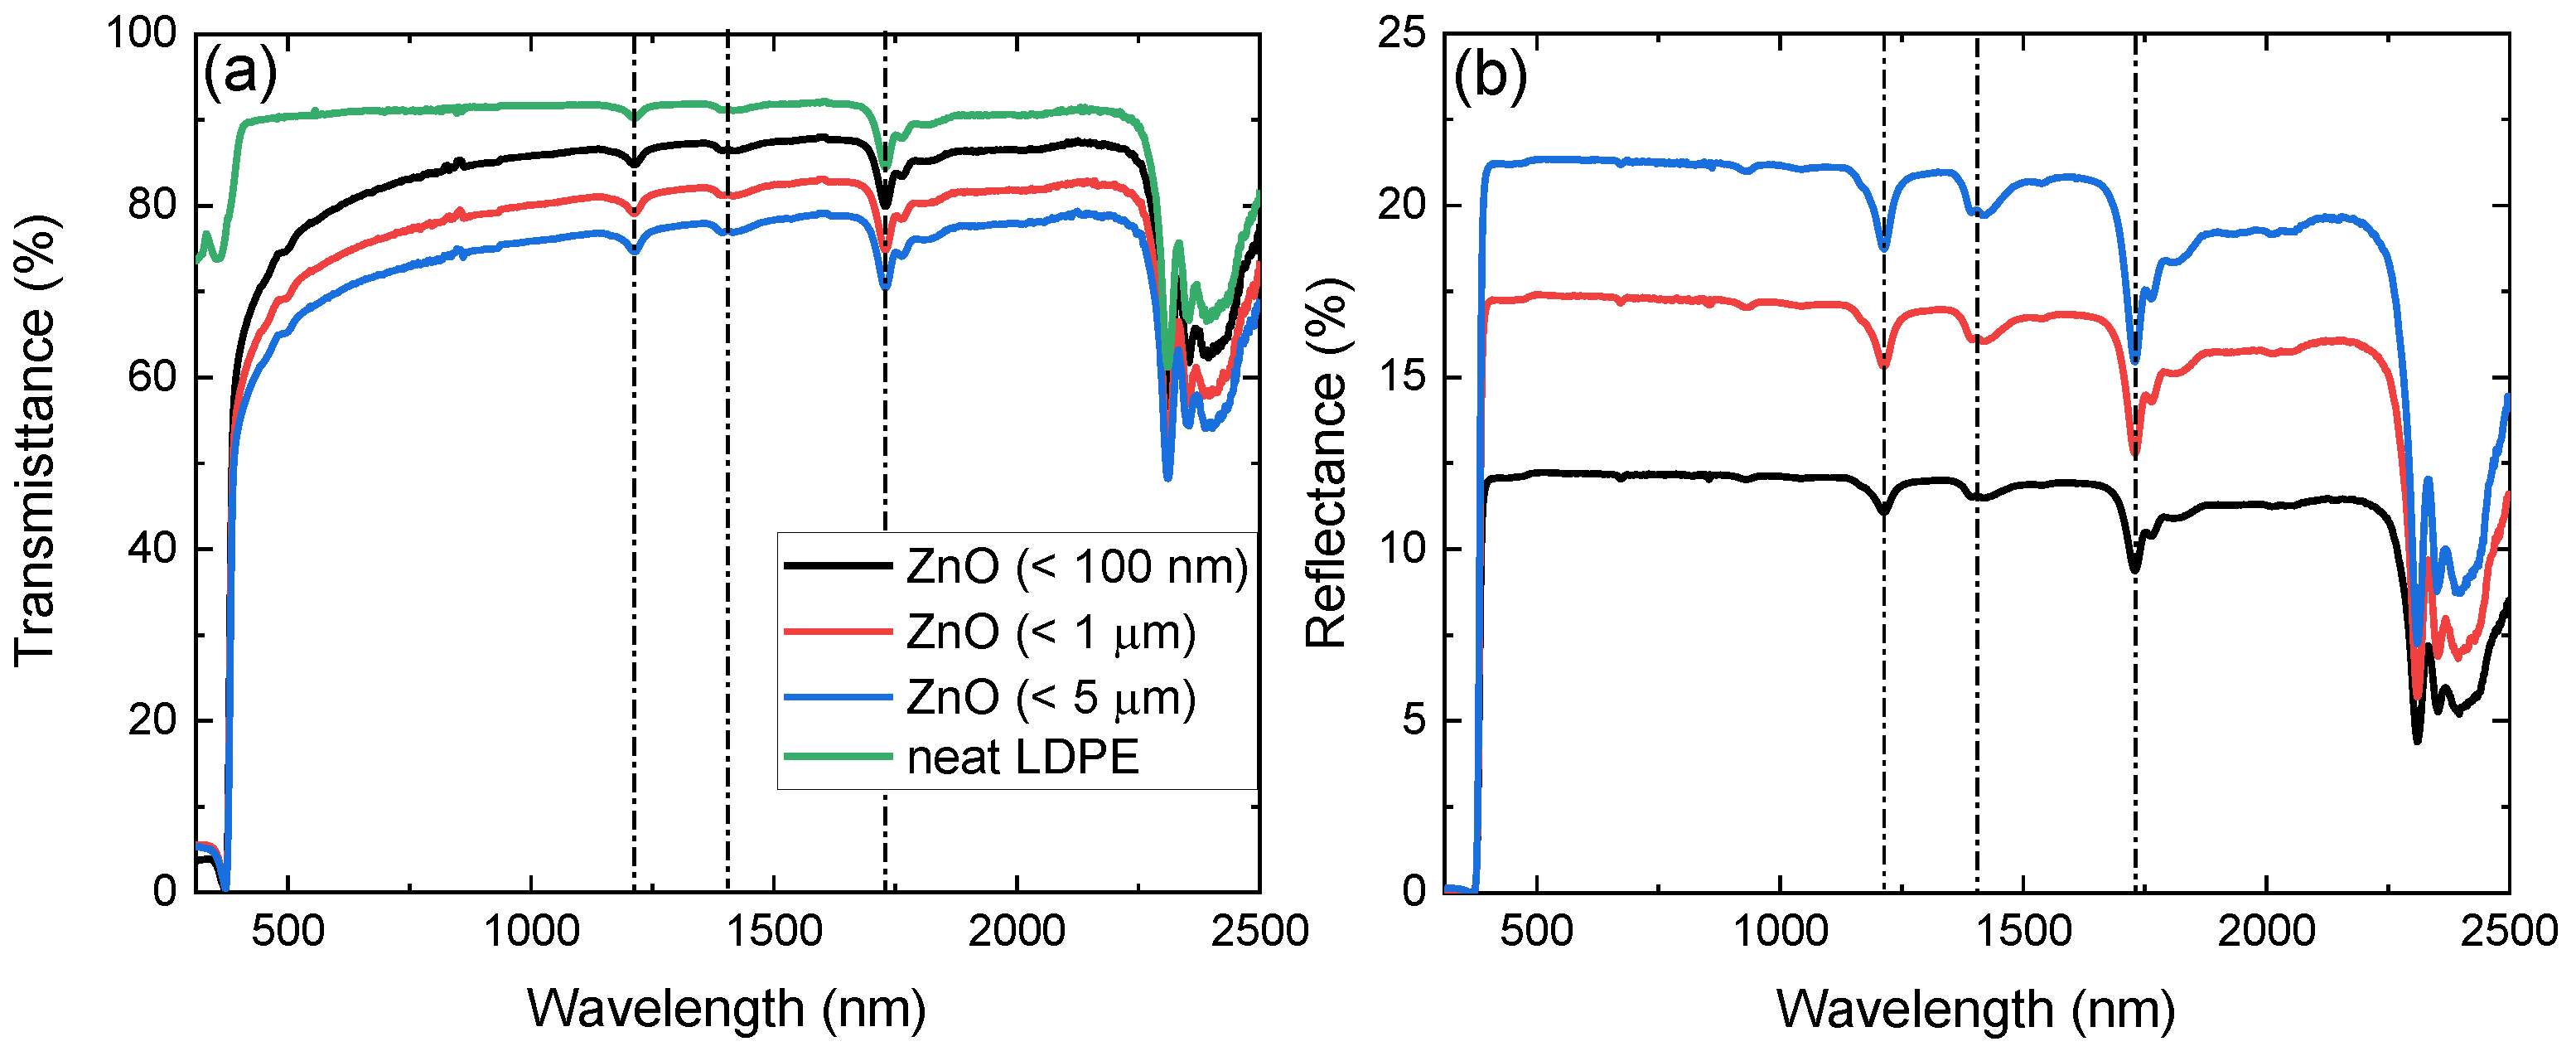
The experimentally acquired transmission and reflection spectra of the produced nanocomposite films are depicted in Figure 3a,b, respectively. Spectra below 310 nm are not presented due to low signal-to-noise ratio originating from high absorption. Neat LDPE spectra are also shown in Figure 3a, while they are omitted in Figure 3b for clarity. The characteristic absorption features of LDPE at 1192 nm, 1394 nm, and 1730 nm are present in both transmission and reflection spectra of the nanocomposite samples [39]. While neat LDPE exhibits a high transmission plateau, a clear decrease of the transmission signal is observed with increasing free-standing particle size embedded in LDPE. This is further confirmed through the reflection spectra, where for the dispersoids of 5 m size, the lower transmittance and, correspondingly, higher reflectance is a direct result of their larger effective cross-section. Furthermore, with the exception of the band gap region becoming dominant below 400 nm, the spectra exhibit similar morphological characteristics with neat LDPE, as also pointed out in previous work [18]. It is noted that comparison between films containing free-standing and particles of different sizes yields extremely similar results.
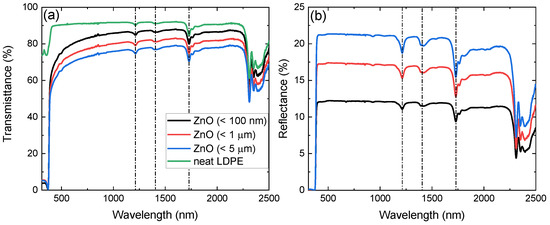
Figure 3.
(a) Transmittance of neat LDPE (green) and of free-standing particle size of < 100 nm (black), < 1 m (red), and < 5 m (blue) embedded in LDPE from 310 nm to 2500 nm. (b) Reflectance of the latter with the exception of neat LDPE, omitted for clarity. The dash-dot lines in the spectra denote the absorption peaks of LDPE.
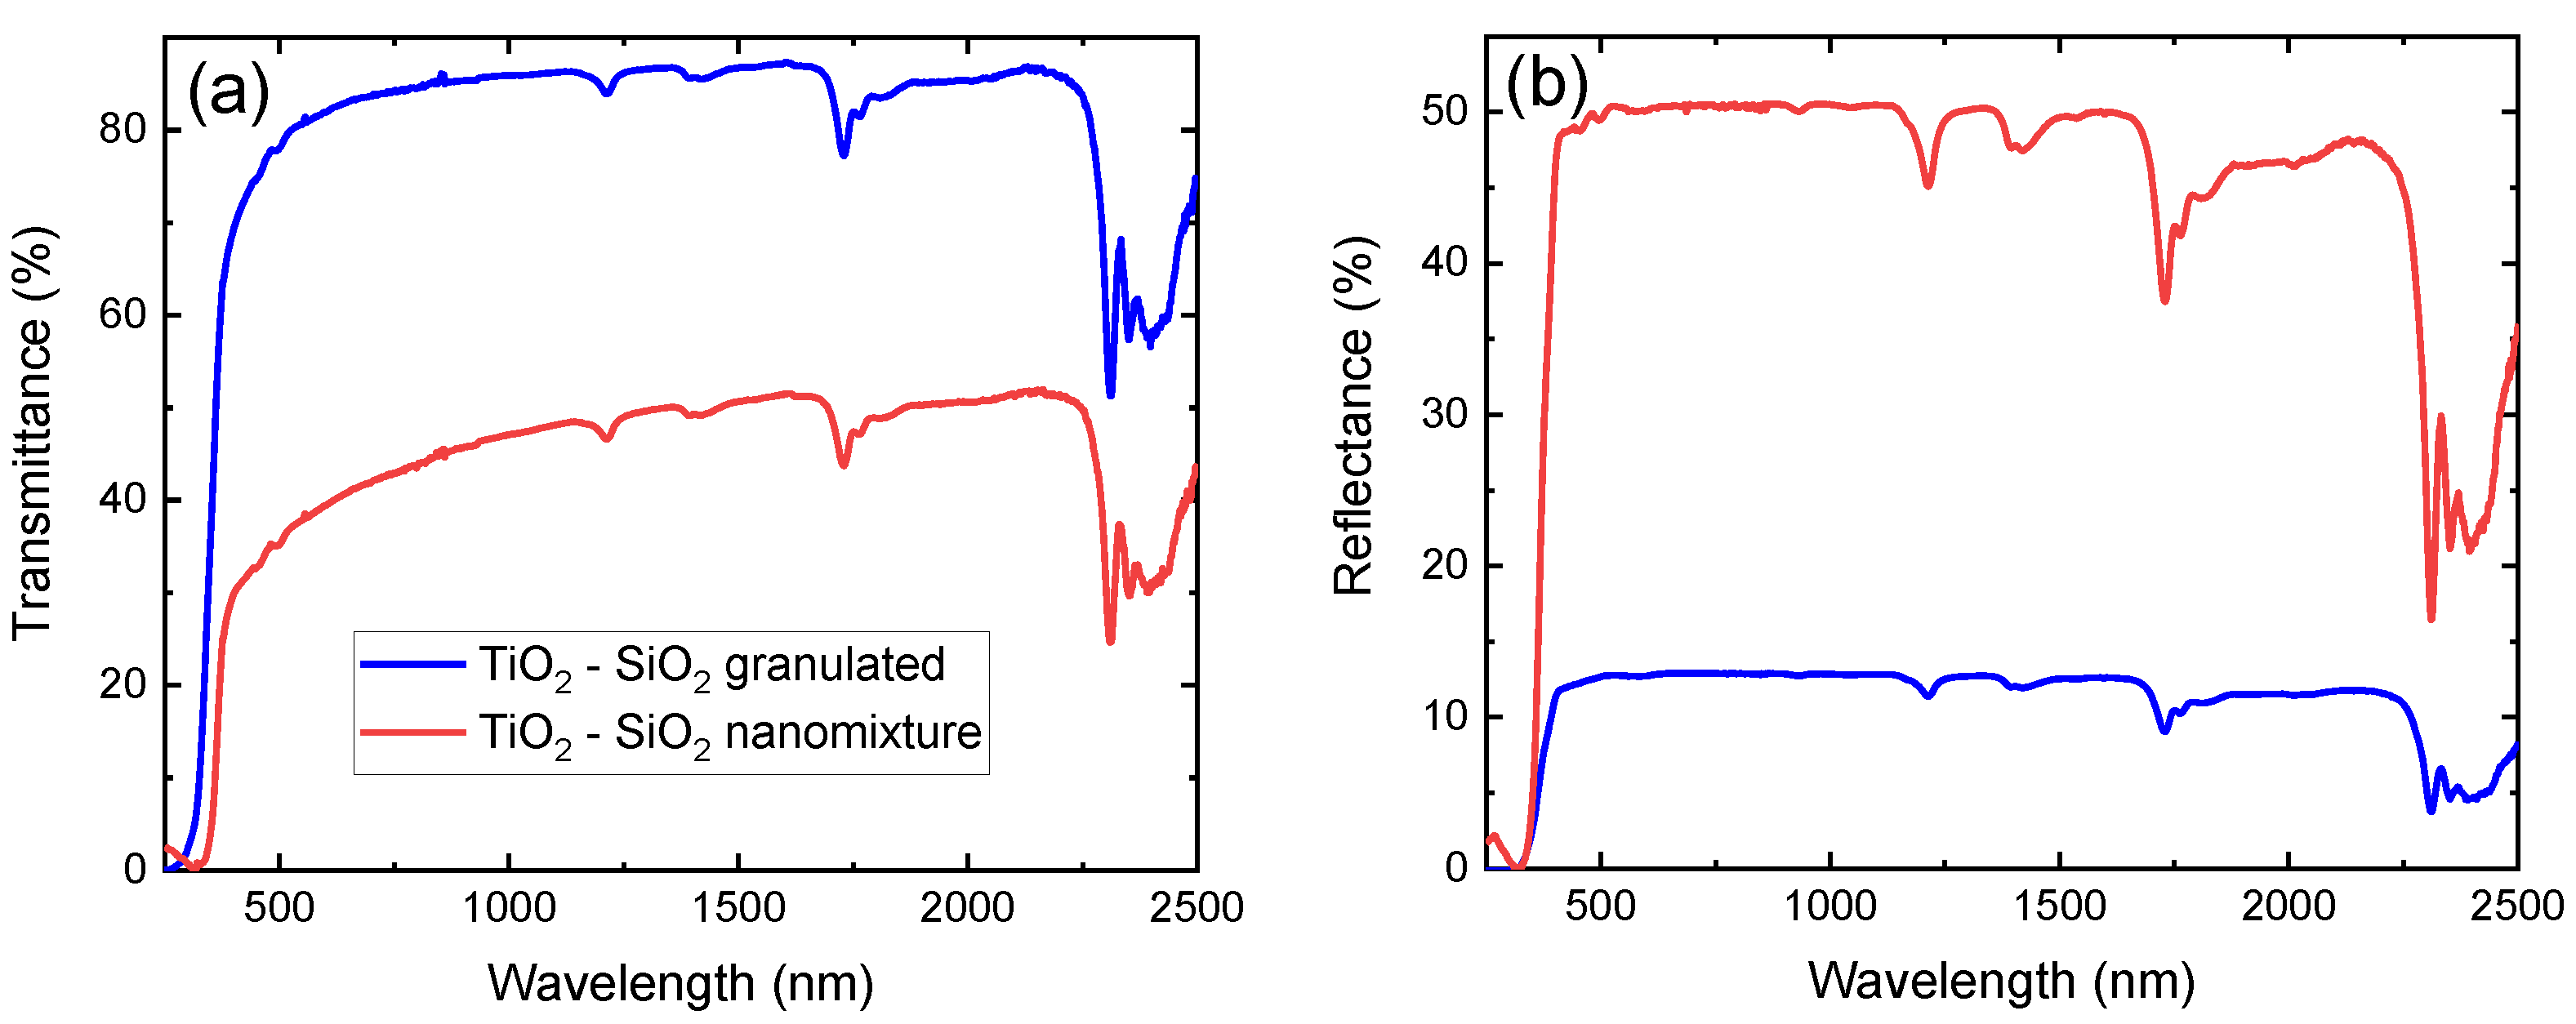
Nanocomposite films of unary and mixed composition, fabricated with the use of both techniques, are here used for a direct comparison of their optical performance. In Figure 4a,b, the transmission and reflection spectra, respectively, of --containing samples are presented in the 250 nm–2500 nm range. The absorption features of neat LDPE are in excellent agreement with previous works [18,39], while the interaction of the films with light is significantly stronger for the sample containing a nanomixture of free-standing particles. This is observed in the entire spectral range under investigation, with the notable exception of the band gap region. It is therefore concluded that the secondary particles have a significantly larger cross-section, and thus their dispersion should be significantly less homogeneous. The results are similar in the case of pure and --containing films produced by both fabrication techniques.
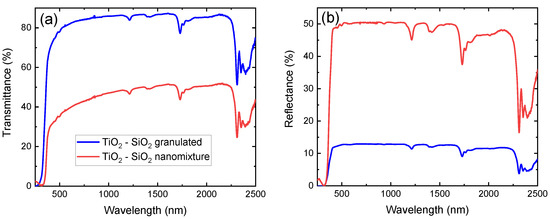
Figure 4.
(a) Transmittance and (b) reflectance of - nanoparticles of nanomixed (red) and granulated (blue) nature embedded in low-density polyethylene (LDPE) from 250 nm to 2500 nm.
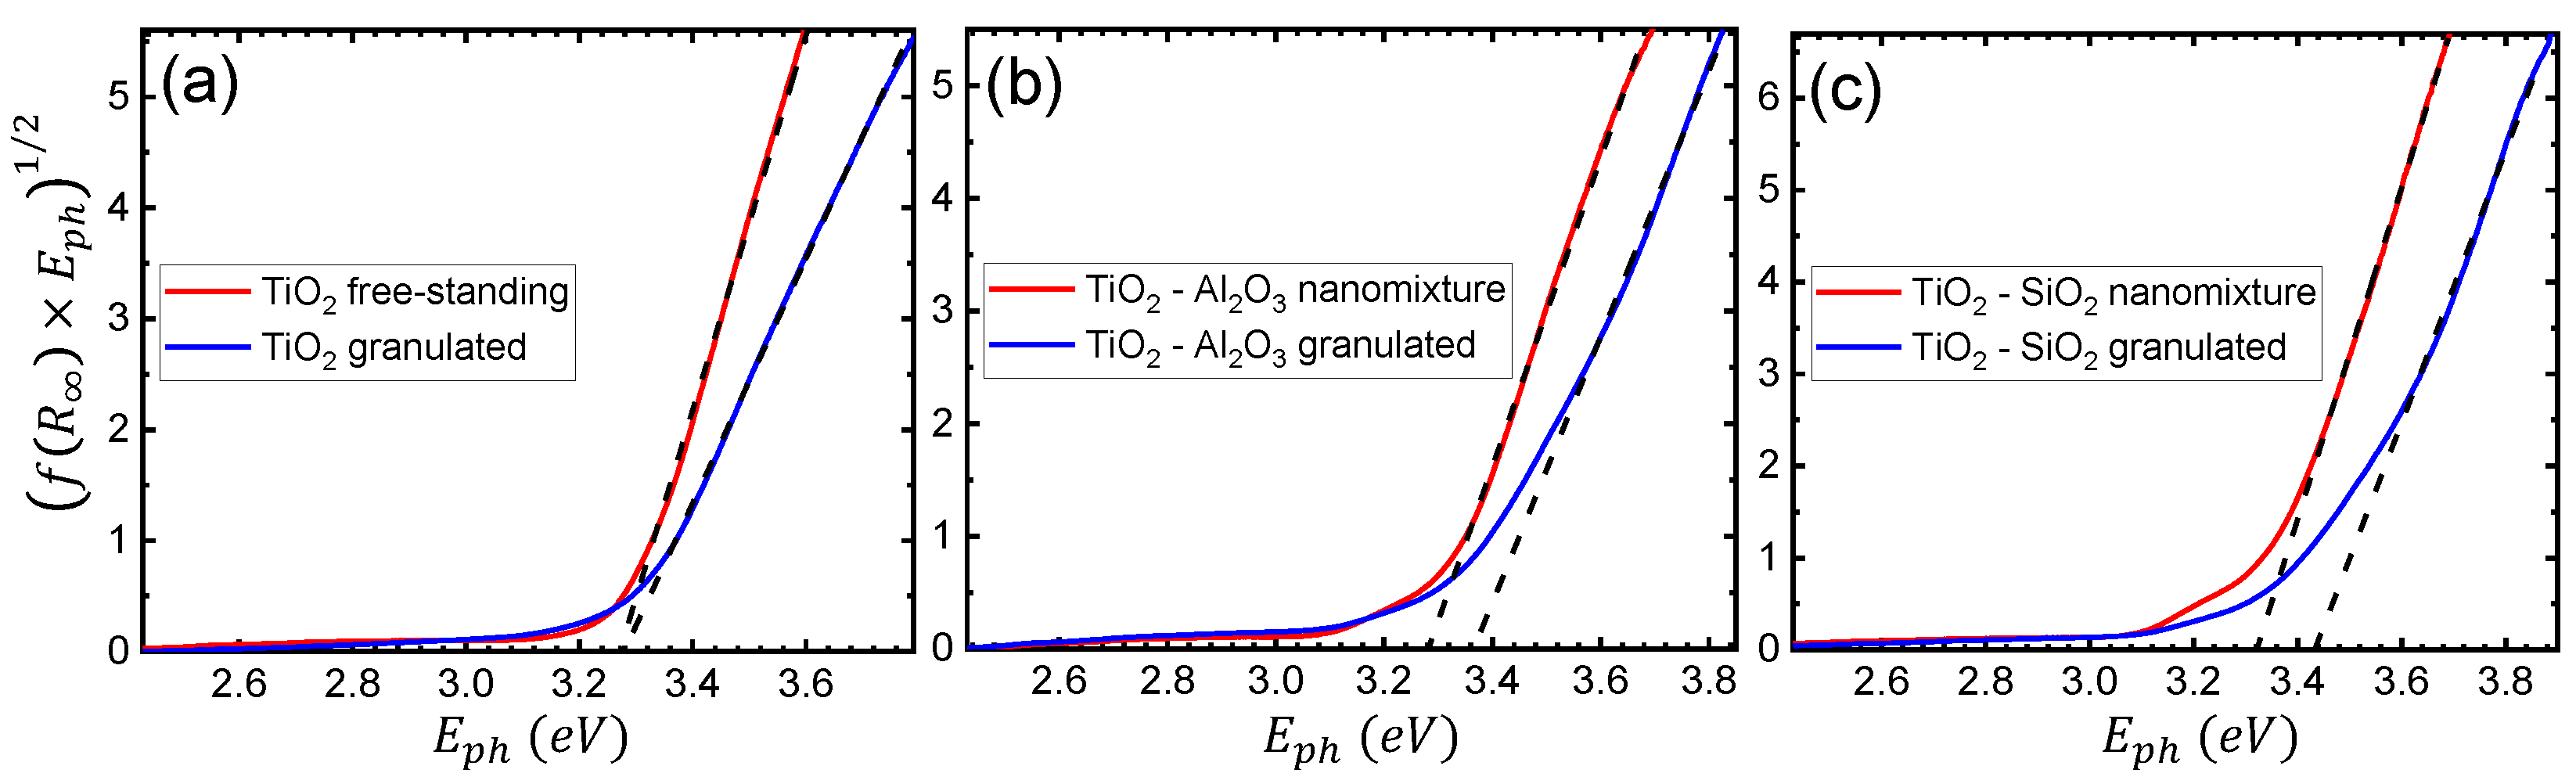
Further analysis focused on the theoretical extraction of the primary size of the particles in the samples produced by both techniques. The pseudoabsorbance was thus calculated through the Kubelka–Munk function , using the following formula [40,41]:
where and , are the reflectance of the sample and reference material, respectively. The results presented in this case are based on higher resolution measurements of diffuse reflectance, in the 250–710 nm range, with a slit width of nm. Tauc plots for the , -, and - samples, of both free-standing and granulated nanoparticles, are presented in Figure 5a–c, respectively. Following the indirect transition for anatase , the Tauc formula here takes the following form [41]:
where A is an energy-independent constant, and and are the photon and band gap energies, respectively. Hence, the energy band gap of each material was estimated using the intersection value of the horizontal energy axis with the linear fit of the function of Equation (3) [41,42]. In the case of pure , the extracted band gap is eV and eV for the free-standing and granulated cases, respectively, indicating similar results for both fabrication techniques. However, for the films containing free-standing and granulated - particles, the calculation yields eV and eV, respectively. The observed difference is attributed to the smaller primary size of the granulated particles.
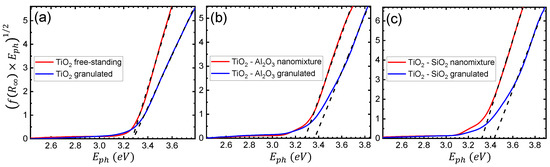
Figure 5.
Tauc plots of the diffuse reflectance spectrum with linear fits (black dashed lines) for (a) , (b) -, and (c) - nanoparticles of both free-standing (nanomixture) and granulated nature. The intersection point of each linear fit with the horizontal axis corresponds to the extracted energy band gap .
The difference is even more pronounced for -, where the band gaps were determined to be eV and eV for the free-standing and granulated cases, respectively. It is therefore concluded that, especially in the case of mixed oxides, the granulation process results in a significantly smaller primary size of the nanoparticles, due to the quantum size effect [43,44,45]. Furthermore, even though in both the free-standing and granulated cases, the addition of and leads to, correspondingly, a higher energy band gap with respect to pure , the difference in the case of the granulated nanoparticles is more profound. A more efficient and controllable tuning of the end product’s optical properties is exhibited in the granulated case, due to the direct synergy of the two species. Such findings were verified by measurements on films containing , , and - nanoparticles, omitted here for brevity.
The production of nanocomposite polymer films via the granulation technique entails that both single and mixed oxide granules are made up of a spatially random distribution of particles that adhere indiscriminately to each other by virtue of the poly(acrylic acid) that is adsorbed on their surface. Given that these granules are made up of particles that adhere to each other, once under the continuous exertion of uniform pressure, they start to disintegrate progressively into smaller fragments that are simultaneously and unrestrictedly dispersed into the polymeric matrix. As the extrusion process evolves, the fragmentation continues until all particles are released into the LDPE, preserving their primary size. Therefore, for a given composition and primary particle size of a dispersoid, the granulation technique establishes a standard for comparative evaluation from which the changes in optical performance can be measured, as both the primary and secondary particle sizes are diversified. In the case of free-standing particles, regulation of the dynamics (i.e., pressure, temperature, number of cycles) of the extrusion process, as well as a study focusing on the effect of the secondary size of the dispersoids on transmission and reflection spectra, are expected to lead to further optimization of their optical performance. Furthermore, complementary characterization techniques, such as spectroscopic ellipsometry [46,47] for the extraction of complex refractive index values, and photoluminescence [48] for the determination of sample aging, can lead to a more comprehensive mapping of their properties.
4. Conclusions
In this work, a comparative study has been conducted between nanocomposite polymer films containing unary and mixed oxide compositions produced by free-standing and granulated dispersoids, using the latter as a standard. The results show that the films produced using free-standing particles are less homogeneous due to the evidently larger cross-section of the dispersoid’s secondary size, as exhibited in optical transmission and reflection measurements for both unary and mixed compositions. Furthermore, the primary size of the dispersoids has been found to be larger, specifically in the case of mixed oxides, while a less direct interaction of the involved species is indicated through band gap energy extraction.
The critical achievement of the granulated method was the optical properties tailoring capability, due to the predetermined proportions of the mixed oxides, which were, in turn, characterized necessarily by a uniform secondary and primary particle size distribution. In the framework of this work, however, it is shown that the tailoring capability can be further enhanced by regulating the secondary size of free-standing oxide particles. This parameter provides complementary control of the optical properties both in the energy band gap region and, predominantly, in the VIS-IR range.
It is concluded that a tuning effect of the optical properties is feasible, albeit less controlled than in the standard granulated state, through this low-cost, free-standing particle technique. This can be proven sufficient on a per-application basis, such as optical coatings for glass surfaces and optical elements, optical filters, and sensors.
Author Contributions
Conceptualization, S.C. and N.C.A.; methodology, S.C. and N.C.A.; formal analysis, S.C., N.C.A., V.L.-L.G., E.B., L.K. and B.D.; investigation, S.C., N.C.A., V.L.-L.G., E.B., L.K., B.D., J.E.-R., L.L. and A.S.; resources, S.C. and N.C.A.; writing-original draft preparation, S.C. and N.C.A.; writing-review and editing, S.C., N.C.A., V.L.-L.G., E.B., L.K., B.D., J.E.-R., L.L. and A.S.; supervision, S.C. and N.C.A.; project administration, S.C. and N.C.A.; funding acquisition, S.C. and N.C.A. All authors have read and agreed to the published version of the manuscript.
Funding
This research was supported by the Sorbonne University Abu Dhabi Research Council, project “Smart Optical Films”, and the Cyprus Research Promotion Foundation grant TECHNOLOGIA/YLIKA/0609(BIE)/06.
Institutional Review Board Statement
Not applicable.
Informed Consent Statement
Not applicable.
Data Availability Statement
The data presented in this study are available upon request from the corresponding authors.
Acknowledgments
We would like to acknowledge A.N. Chimaris and G.R. Makris for significant technical contributions.
Conflicts of Interest
The authors declare no conflict of interest.
References
- Nugroho, F.A.A.; Darmadi, I.; Cusinato, L.; Susarrey-Arce, A.; Schreuders, H.; Bannenberg, L.J.; da Silva Fanta, A.B.; Kadkhodazadeh, S.; Wagner, J.B.; Antosiewicz, T.J.; et al. Metal–polymer hybrid nanomaterials for plasmonic ultrafast hydrogen detection. Nat. Mater. 2019, 18, 489–495. [Google Scholar] [CrossRef] [PubMed] [Green Version]
- Park, W.; Shin, H.; Choi, B.; Rhim, W.K.; Na, K.; Keun Han, D. Advanced hybrid nanomaterials for biomedical applications. Prog. Mater. Sci. 2020, 114, 100686. [Google Scholar] [CrossRef]
- Sobiech, M.; Bujak, P.; Luliński, P.; Pron, A. Semiconductor nanocrystal–polymer hybrid nanomaterials and their application in molecular imprinting. Nanoscale 2019, 11, 12030–12074. [Google Scholar] [CrossRef] [PubMed]
- Dmitrenko, M.; Chepeleva, A.; Liamin, V.; Mazur, A.; Semenov, K.; Solovyev, N.; Penkova, A. Novel Mixed Matrix Membranes Based on Polyphenylene Oxide Modified with Graphene Oxide for Enhanced Pervaporation Dehydration of Ethylene Glycol. Polymers 2022, 14, 691. [Google Scholar] [CrossRef] [PubMed]
- Hassan, M.; Dave, K.; Chandrawati, R.; Dehghani, F.; Gomes, V.G. 3D printing of biopolymer nanocomposites for tissue engineering: Nanomaterials, processing and structure-function relation. Eur. Polym. J. 2019, 121, 109340. [Google Scholar] [CrossRef]
- Mohamed, M.G.; Kuo, S.W. Functional Polyimide/Polyhedral Oligomeric Silsesquioxane Nanocomposites. Polymers 2019, 11, 26. [Google Scholar] [CrossRef] [Green Version]
- Abdel-Gawad, N.M.K.; El Dein, A.; Mansour, D.E.; Ahmed, H.; Darwish, M.M.F.; Lehtonen, M. PVC nanocomposites for cable insulation with enhanced dielectric properties, partial discharge resistance and mechanical performance. High Volt. 2020, 5, 463–471. [Google Scholar] [CrossRef]
- Pastoriza-Santos, I.; Kinnear, C.; Pérez-Juste, J.; Mulvaney, P.; Liz-Marzán, L.M. Plasmonic polymer nanocomposites. Nat. Rev. Mater. 2018, 3, 375–391. [Google Scholar] [CrossRef]
- Satulu, V.; Mitu, B.; Ion, V.; Marascu, V.; Matei, E.; Stancu, C.; Dinescu, G. Combining Fluorinated Polymers with Ag Nanoparticles as a Route to Enhance Optical Properties of Composite Materials. Polymers 2020, 12, 1640. [Google Scholar] [CrossRef]
- Soliman, T.; Vshivkov, S. Effect of Fe nanoparticles on the structure and optical properties of polyvinyl alcohol nanocomposite films. J. Non-Cryst. Solids 2019, 519, 119452. [Google Scholar] [CrossRef]
- Wu, C.; Danh, K.; Nakagaito, A. Effects of cellulose nanofiber on the thermal, mechanical, and optical properties of triacetate cellulose nanocomposites. Express Polym. Lett. 2020, 14, 467–476. [Google Scholar] [CrossRef]
- Poulose, A.M.; Shaikh, H.; Anis, A.; Alhamidi, A.; Kumar, N.S.; Elnour, A.Y.; Al-Zahrani, S.M. Effect of Compatibilizer on the Persistent Luminescence of Polypropylene/Strontium Aluminate Composites. Polymers 2022, 14, 1711. [Google Scholar] [CrossRef] [PubMed]
- Cheng, Y.; Bai, L.; Yu, G.; Zhang, X. Effect of Particles Size on Dielectric Properties of Nano-ZnO/LDPE Composites. Materials 2019, 12, 5. [Google Scholar] [CrossRef] [PubMed] [Green Version]
- Rajesh, K.; Crasta, V.; Rithin Kumar, N.B.; Shetty, G.; Rekha, P.D. Structural, optical, mechanical and dielectric properties of titanium dioxide doped PVA/PVP nanocomposite. J. Polym. Res. 2019, 26, 99. [Google Scholar] [CrossRef]
- Heiba, Z.K.; Mohamed, M.B. Effect of annealed and Mg-doped nano ZnO on physical properties of PVA. J. Mol. Struct. 2019, 1181, 507–517. [Google Scholar] [CrossRef]
- Liu, Y.; Fan, F.; Tan, X. SiO2 NPs-PQ/PMMA Photopolymer Material Doped with a High-Concentration Photosensitizer for Holographic Storage. Polymers 2020, 12, 816. [Google Scholar] [CrossRef] [PubMed] [Green Version]
- Franciszczak, P.; Taraghi, I.; Paszkiewicz, S.; Burzyński, M.; Meljon, A.; Piesowicz, E. Effect of Halloysite Nanotube on Mechanical Properties, Thermal Stability and Morphology of Polypropylene and Polypropylene/Short Kenaf Fibers Hybrid Biocomposites. Materials 2020, 13, 4459. [Google Scholar] [CrossRef]
- Angastiniotis, N.C.; Christopoulos, S.; Petallidou, K.; Efstathiou, A.M.; Othonos, A.; Koutsokeras, L. Controlling the optical properties of nanostructured oxide-based polymer films. Sci. Rep. 2021, 11, 16009. [Google Scholar] [CrossRef]
- Pogreb, R.; Finkelshtein, B.; Shmukler, Y.; Musina, A.; Popov, O.; Stanevsky, O.; Yitzchaik, S.; Gladkikh, A.; Shulzinger, A.; Streltsov, V.; et al. Low-density polyethylene films doped with europium(III) complex: Their properties and applications. Polym. Adv. Technol. 2004, 15, 414–418. [Google Scholar] [CrossRef]
- Raj, B.; K., U.S.; Siddaramaiah. Low-density polyethylene/starch blend films for food packaging applications. Adv. Polym. Technol. 2004, 23, 32–45. [Google Scholar] [CrossRef]
- Al-Helal, I.; Picuno, P.; Alsadon, A.A.; Ibrahim, A.; Shady, M.; Abdel-Ghany, A.M. Effect of Shape, Orientation and Aging of a Plastic Greenhouse Cover on the Degradation Rate of the Optical Properties in Arid Climates. Appl. Sci. 2022, 12, 2709. [Google Scholar] [CrossRef]
- Mansour, D.E.; M. K. Abdel-Gawad, N.; El Dein, A.; Ahmed, H.; Darwish, M.M.F.; Lehtonen, M. Recent Advances in Polymer Nanocomposites Based on Polyethylene and Polyvinylchloride for Power Cables. Materials 2020, 14, 66. [Google Scholar] [CrossRef] [PubMed]
- Vervaet, C.; Baert, L.; Remon, J.P. Extrusion-spheronisation A literature review. Int. J. Pharm. 1995, 116, 131–146. [Google Scholar] [CrossRef]
- Abeykoon, C.; McMillan, A.; Nguyen, B.K. Energy efficiency in extrusion-related polymer processing: A review of state of the art and potential efficiency improvements. Renew. Sustain. Energy Rev. 2021, 147, 111219. [Google Scholar] [CrossRef]
- Dubinsky, S.; Grader, G.S.; Shter, G.E.; Silverstein, M.S. Thermal degradation of poly(acrylic acid) containing copper nitrate. Polym. Degrad. Stab. 2004, 86, 171–178. [Google Scholar] [CrossRef]
- Loste, J.; Lopez-Cuesta, J.M.; Billon, L.; Garay, H.; Save, M. Transparent polymer nanocomposites: An overview on their synthesis and advanced properties. Prog. Polym. Sci. 2019, 89, 133–158. [Google Scholar] [CrossRef]
- Cui, L.; Huang, C.; Xia, H.; Qiu, Y.; Ni, Q.Q. Transparent ultraviolet-shielding composite films made from dispersing pristine zinc oxide nanoparticles in low-density polyethylene. Nanotechnol. Rev. 2020, 9, 1368–1380. [Google Scholar] [CrossRef]
- Horti, N.C.; Kamatagi, M.D.; Patila, N.R.; Sannaikar, M.S.; Inamdar, S.R. Synthesis and optical properties of copper oxide nanoparticles: Effect of solvents. J. Nanophotonics 2020, 14, 046010. [Google Scholar] [CrossRef]
- Cai, L.; Peng, Y.; Xu, J.; Zhou, C.; Zhou, C.; Wu, P.; Lin, D.; Fan, S.; Cui, Y. Temperature Regulation in Colored Infrared-Transparent Polyethylene Textiles. Joule 2019, 3, 1478–1486. [Google Scholar] [CrossRef]
- Parameswaranpillai, J.; Hameed, N.; Kurian, T.; Y.u, Y. (Eds.) Introduction to Nanomaterials and Nanocomposites. In Nanocomposite Materials: Synthesis, Properties and Applications; CRC Press: Boca Raton, FL, USA, 2020. [Google Scholar] [CrossRef]
- Nowicki, B. Multiparameter representation of surface roughness. Wear 1985, 102, 161–176. [Google Scholar] [CrossRef]
- Kotula, A.P.; Meyer, M.W.; De Vito, F.; Plog, J.; Hight Walker, A.R.; Migler, K.B. The rheo-Raman microscope: Simultaneous chemical, conformational, mechanical, and microstructural measures of soft materials. Rev. Sci. Instrum. 2016, 87, 105105. [Google Scholar] [CrossRef] [PubMed]
- Allen, V.; Kalivas, J.H.; Rodriguez, R.G. Post-Consumer Plastic Identification Using Raman Spectroscopy. Appl. Spectrosc. 1999, 53, 672–681. [Google Scholar] [CrossRef]
- Sato, H.; Shimoyama, M.; Kamiya, T.; Amari, T.; Šašic, S.; Ninomiya, T.; Siesler, H.W.; Ozaki, Y. Raman spectra of high-density, low-density, and linear low-density polyethylene pellets and prediction of their physical properties by multivariate data analysis. J. Appl. Polym. Sci. 2002, 86, 443–448. [Google Scholar] [CrossRef]
- Da Silva, D.J.; Wiebeck, H. Using PLS, iPLS and siPLS linear regressions to determine the composition of LDPE/HDPE blends: A comparison between confocal Raman and ATR-FTIR spectroscopies. Vib. Spectrosc. 2017, 92, 259–266. [Google Scholar] [CrossRef]
- Da Silva, D.J.; Parra, D.F.; Wiebeck, H. Applying confocal Raman spectroscopy and different linear multivariate analyses to sort polyethylene residues. Chem. Eng. J. 2021, 426, 131344. [Google Scholar] [CrossRef]
- Ahsbahs, H.; Sowa, H. High-pressure X-ray investigation of zincite ZnO single crystals using diamond anvils with an improved shape. J. Appl. Crystallogr. 2006, 39, 169–175. [Google Scholar] [CrossRef]
- Langford, J.I.; Wilson, A.J.C. Scherrer after sixty years: A survey and some new results in the determination of crystallite size. J. Appl. Crystallogr. 1978, 11, 102–113. [Google Scholar] [CrossRef]
- Moshtaghi, M.; Knaeps, E.; Sterckx, S.; Garaba, S.; Meire, D. Spectral reflectance of marine macroplastics in the VNIR and SWIR measured in a controlled environment. Sci. Rep. 2021, 11, 5436. [Google Scholar] [CrossRef]
- Kubelka, P. New Contributions to the Optics of Intensely Light-Scattering Materials. Part I. J. Opt. Soc. Am. 1948, 38, 448–457. [Google Scholar] [CrossRef]
- Aydin, C.; Abd El-sadek, M.; Zheng, K.; Yahia, I.; Yakuphanoglu, F. Synthesis, diffused reflectance and electrical properties of nanocrystalline Fe-doped ZnO via sol-gel calcination technique. Opt. Laser Technol. 2013, 48, 447–452. [Google Scholar] [CrossRef] [Green Version]
- Makuła, P.; Pacia, M.; Macyk, W. How To Correctly Determine the Band Gap Energy of Modified Semiconductor Photocatalysts Based on UV - Vis Spectra. J. Phys. Chem. Lett. 2018, 9, 6814–6817. [Google Scholar] [CrossRef] [PubMed] [Green Version]
- Delley, B.; Steigmeier, E.F. Size dependence of band gaps in silicon nanostructures. Appl. Phys. Lett. 1995, 67, 2370–2372. [Google Scholar] [CrossRef]
- Lin, H.; Huang, C.; Li, W.; Ni, C.; Shah, S.I.; Tseng, Y.H. Size dependency of nanocrystalline TiO2 on its optical property and photocatalytic reactivity exemplified by 2-chlorophenol. Appl. Catal. B Environ. 2006, 68, 1–11. [Google Scholar] [CrossRef]
- Li, D.; Song, H.; Meng, X.; Shen, T.; Sun, J.; Han, W.; Wang, X. Effects of Particle Size on the Structure and Photocatalytic Performance by Alkali-Treated TiO2. Nanomaterials 2020, 10, 546. [Google Scholar] [CrossRef] [Green Version]
- Kostruba, A.; Stetsyshyn, Y.; Vlokh, R. Method for determination of the parameters of transparent ultrathin films deposited on transparent substrates under conditions of low optical contrast. Appl. Opt. 2015, 54, 6208–6216. [Google Scholar] [CrossRef]
- Losurdo, M.; Bruno, G.; Irene, E.A. Anisotropy of optical properties of conjugated polymer thin films by spectroscopic ellipsometry. J. Appl. Phys. 2003, 94, 4923–4929. [Google Scholar] [CrossRef]
- Alshehawy, A.M.; Mansour, D.E.A.; Ghali, M.; Lehtonen, M.; Darwish, M.M.F. Photoluminescence Spectroscopy Measurements for Effective Condition Assessment of Transformer Insulating Oil. Processes 2021, 9, 732. [Google Scholar] [CrossRef]

Publisher’s Note: MDPI stays neutral with regard to jurisdictional claims in published maps and institutional affiliations. |
© 2022 by the authors. Licensee MDPI, Basel, Switzerland. This article is an open access article distributed under the terms and conditions of the Creative Commons Attribution (CC BY) license (https://creativecommons.org/licenses/by/4.0/).