1. Introduction
The addition of short fibers to rubber can improve some of its properties, as well as the processing performance [
1,
2,
3]. Since the 1970s, people have conducted a lot of research on different short fibers, such as cellulose fibers, glass fibers, nylon fibers, polyester fibers, carbon fibers, and aramid fiber-reinforced skeleton materials. The improvement in rubber performance by different staple fibers also varies. Aramid fibers have high strength, a high modulus, high-temperature resistance, and excellent cutting and chemical corrosion [
4]. Cutting aramid fibers into short fibers of specific gauge lengths and adding them to hybrid rubber to prepare hybrid rubber/fiber composites can improve the tearing properties and wear resistance and reduce the rolling resistance of the composites [
5]. Some companies have used aramid fibers to prepare tires with better performance than existing technologies.
Zhang Yong [
6] studied the application of aramid staple fibers in mud-tire tread rubber. The results showed the following: compared with the rubber without aramid staple fibers, the coking time and good vulcanization time of the rubber with the addition of aramid staple fibers were slightly extended, and the vulcanization reversion time was shortened; the cutting and puncture resistance of the vulcanized rubber was significantly improved, the loss factor was reduced, and the shear temperature rise was decreased dramatically; the best performance was achieved when the amount of aramid staple fibers was 3 phr; and the durability performance of the finished tire increased with the increase in the amount of aramid staple fibers.
Xiao Jianbin [
7] studied the effect of the addition of aramid staple fibers on the properties of natural rubber/fiber composites. The results showed the following: under the same mixing process conditions, the performance of the rubber/fiber composites improved and then decreased as the amount of aramid staple fibers added increased; the mechanical properties and the abrasion performance were the best when 3 phr of aramid staple fibers was added; the addition of aramid staple fibers reduced the thermal conductivity of the rubber; and the addition of aramid staple fibers improved the anti-slip performance and rolling resistance of the tread using rubber/fiber composites. The effects of the fiber length and fiber mass fraction on the transverse and longitudinal tensile properties of AFRC have also been investigated. Results have shown that the transverse and longitudinal tensile strengths of AFRC increase with the increase in the fiber mass fraction, and the longitudinal tensile strength is generally higher than the transverse tensile strength; the overall performance of AFRC is better when the fiber mass fraction is 4%, and the length is 3 mm.
Based on the secondary development of Python-ABAQUS, Liu Xia [
8] generated a two-dimensional representative volume element of random aramid fiber-reinforced rubber composites considering the non-ideal interface between aramid fibers and the rubber matrix. Liu Xia applied periodic boundary conditions to the numerical model of aramid fiber-reinforced rubber composite (AFRC) for simulation analysis, combining this with uniaxial tensile experiments to study the effect of the fiber volume fraction on the tensile properties of AFRC. Liu Xia used the cohesion model to describe the mechanical behavior of the interface and analyzed the impact of interface properties on the axial tensile properties of AFRC. The results showed that, in the weak interfacial stiffness region, the effective elastic modulus of AFRC decreased with the increase in the fiber volume fraction. In the vital interface region, the effective elastic modulus of AFRC increased with the increase in the fiber volume fraction. The macroscopic effective elastic modulus measured in AFRC with different fiber contents can predict the cohesive force model parameters of the non-ideal interface through the stiffness modulus curve.
Liu Long [
9] used a silane coupling agent for surface grafting modification of plain-woven Arlene fibers. He studied the effect of surface modification on the interlayer bonding properties and impact resistance of Arlene fiber/rubber matrix composites. FT-IR was used to analyze the surface of the modified aramid fibers, the modification principle was studied, and SEM was used to analyze the surface microstructure of the modified aramid fibers. The results showed that the interlaminar binding force and the peak impact load of the rubber matrix composite among threads were increased by 42% and 33.06%, respectively, after the surface modification. It was also shown that the improvement of the fiber surface had a positive effect on the low-speed impact resistance, which provides a new idea for the progress of the impact resistance of ARPA fiber/rubber matrix composites, and is of great significance for the application of composite materials in a complex environment.
Pang Li [
10] studied the effect of modified aramid staple fibers of different lengths on the vulcanization characteristics, mechanical properties, and DIN friction properties of carbon nanotube-reinforced NR/BR composites, analyzing the friction surface using a stereo microscope. The results showed that when 1 mm aramid fibers were added under the same conditions, the tensile strength and elongation at break of the compound were better and the abrasion was higher; when 3 mm aramid fibers were added, the combination had 100% tensile stress, better tear strength, and lower wear.
As the rubber mixing equipment is continuously used for production in the factory, the internal mixer has a long working time and a high working intensity, which will inevitably bring about the wear of the end face of the internal mixer. The end face is an integral part of the closed mixing chamber, and the wear of the end face will cause the gap between the mixing room and the end face to increase. The increase in the opening leads to the phenomenon of material leakage [
11,
12,
13,
14]. With the intensification of the leakage, the gap between the end face of the mixer and the mixing chamber will further increase, thus forming negative feedback. This phenomenon not only makes the formula ratio inaccurate but also leads to a decrease in the mixing effect and a reduction in the performance of the compounded rubber. This paper used aramid fibers as a filler, and aramid fiber/rubber composites were prepared by mechanical blending. The influence of different ratios of aramid fiber/rubber composites on the friction and wear of the end face of the internal mixer was analyzed.
2. Experiment
2.1. Chemical Composition
The chemical composition of the prepared samples is shown in
Table 1.
Highly dispersible RFL pre-impregnated aramid staple fibers were used (1.5D length 3 mm, Qingdao-Sanxiong Fiber Technology Co., Qingdao, China).
2.2. Sample Preparation
2.2.1. Natural Rubber (NR) Plasticizing
Natural rubber is a hard-to-mix substance in the mixer. To facilitate the mixing process, it was necessary to open the mixer for plasticizing. Before plasticizing, the mixer was washed to reduce the influence of roller impurities on the rubber performance [
15]. Natural rubber (NR) was plasticized by an opening mill (BL-6157, Baolun Precision Testing Instrument Co., Dongguan, China). During the plasticizing process, the cooling water temperature was set to 40–50 °C. Finally, the steps of the process were as follows: rubber breaking 4 times (roller distance 4 mm)
→10 times thin (roller distance 0.5 mm)
→2 times (roller distance 3 mm) [
16,
17,
18,
19,
20,
21]
. 2.2.2. Preparation of the Mixed Rubber
The mixing process was carried out in a dense mixer (XSM-500, Shanghai Kechuang Rubber, and Plastic Machinery Equipment Co., Shanghai, China); the rotor speed and cooling water temperature were set to 70 r/min and 40 °C, respectively. Moreover, the filling coefficient and upper-plug pressure were set to 0.65 and 0.6 MPa, respectively. Then, the plasticizer was cut into thin strips for easy feeding. The preparation process of the mixed rubber is shown in
Table 2.
The glue was plasticized in the open mixer after passing three times, and the triangle bag was rolled five times. Finally, the roller distance of the mixer was set to 10 mm to obtain a smooth surface on the sample.
2.3. Performance Test
2.3.1. Rubber Processing Performance
The rubber processing performance was tested using the RPA 2000 (Rubber processing performance analyzer, Alpha Company, USA) test. During the experiment, the scanning frequency, scanning strain range, and temperature were set to 0.01 Hz, 0.28–40%, and 60 °C, respectively [
22,
23,
24,
25,
26,
27,
28,
29]. The dynamic modulus G’ curve with strain was obtained. Moreover, the following indicators were calculated during the experiment:
(1) Payne effect: The Payne effect refers to the phenomenon that the dynamic modulus of a filled rubber decreases sharply with increasing strain. This effect reflects the distribution of the cross-linking network inside the rubber. Generally, the higher the Payne effect, the denser the cross-linking network inside the rubber, and the worse the filler dispersity [
30,
31,
32,
33,
34,
35].
(2) Silanization reaction index: G’ and strain obtained by the silica multi-path stable cooling method were calculated to obtain the silanization reaction index. The calculation method of the silanization reaction index is shown in
Table 3. The calculation method of the silanization reaction is shown in
Figure 1.
2.3.2. CSM Friction and Wear Test
Circular rubber samples with a diameter of 100 mm were prepared by cutting the rubber sample with a smooth surface with the CSM (CSM- Friction and wear testing machine, Tribometer company, Switzerland) mold. After calibrating the CSM friction and wear tester, the parameters of the CSM were set according to the mixing process parameters. The pressure, speed, and friction time were set to 5 N, 70 r/min, and 30 min, respectively. To accurately simulate the mixing situation of the mixer, a metal grinding head was used in the CSM test, which was consistent with the end face of the mixer. Studies have shown that metal wear increases significantly at high temperatures in the mixing process [
36,
37,
38,
39,
40,
41,
42,
43,
44,
45]. Accordingly, the CSM temperature was set at 150 °C to observe the wear effect better. The configuration of the CSM is presented in
Figure 2.
2.3.3. Three-Dimensional Morphology of Metal
A 3D scanner (LEXT OLS5000, Olympus, Japan) was used to analyze the surface of the test sample after scanning, and the variation in the morphology and volume of the sample before and after wear was obtained.
2.3.4. Dispersion Test
The vulcanized rubber was cut out into a new section, and the cut section was tested using the dispersibility tester (Carbon black dispersing meter, Alpha Company, Hudson, OH, USA). The dispersibility value was obtained according to the ASTM D7723 standard.
3. Silanization Reaction Mechanism
In all experiments, TESPT was used as the silane coupling agent.
Figure 3 illustrates the chemical composition and molecular structure of TESPT.
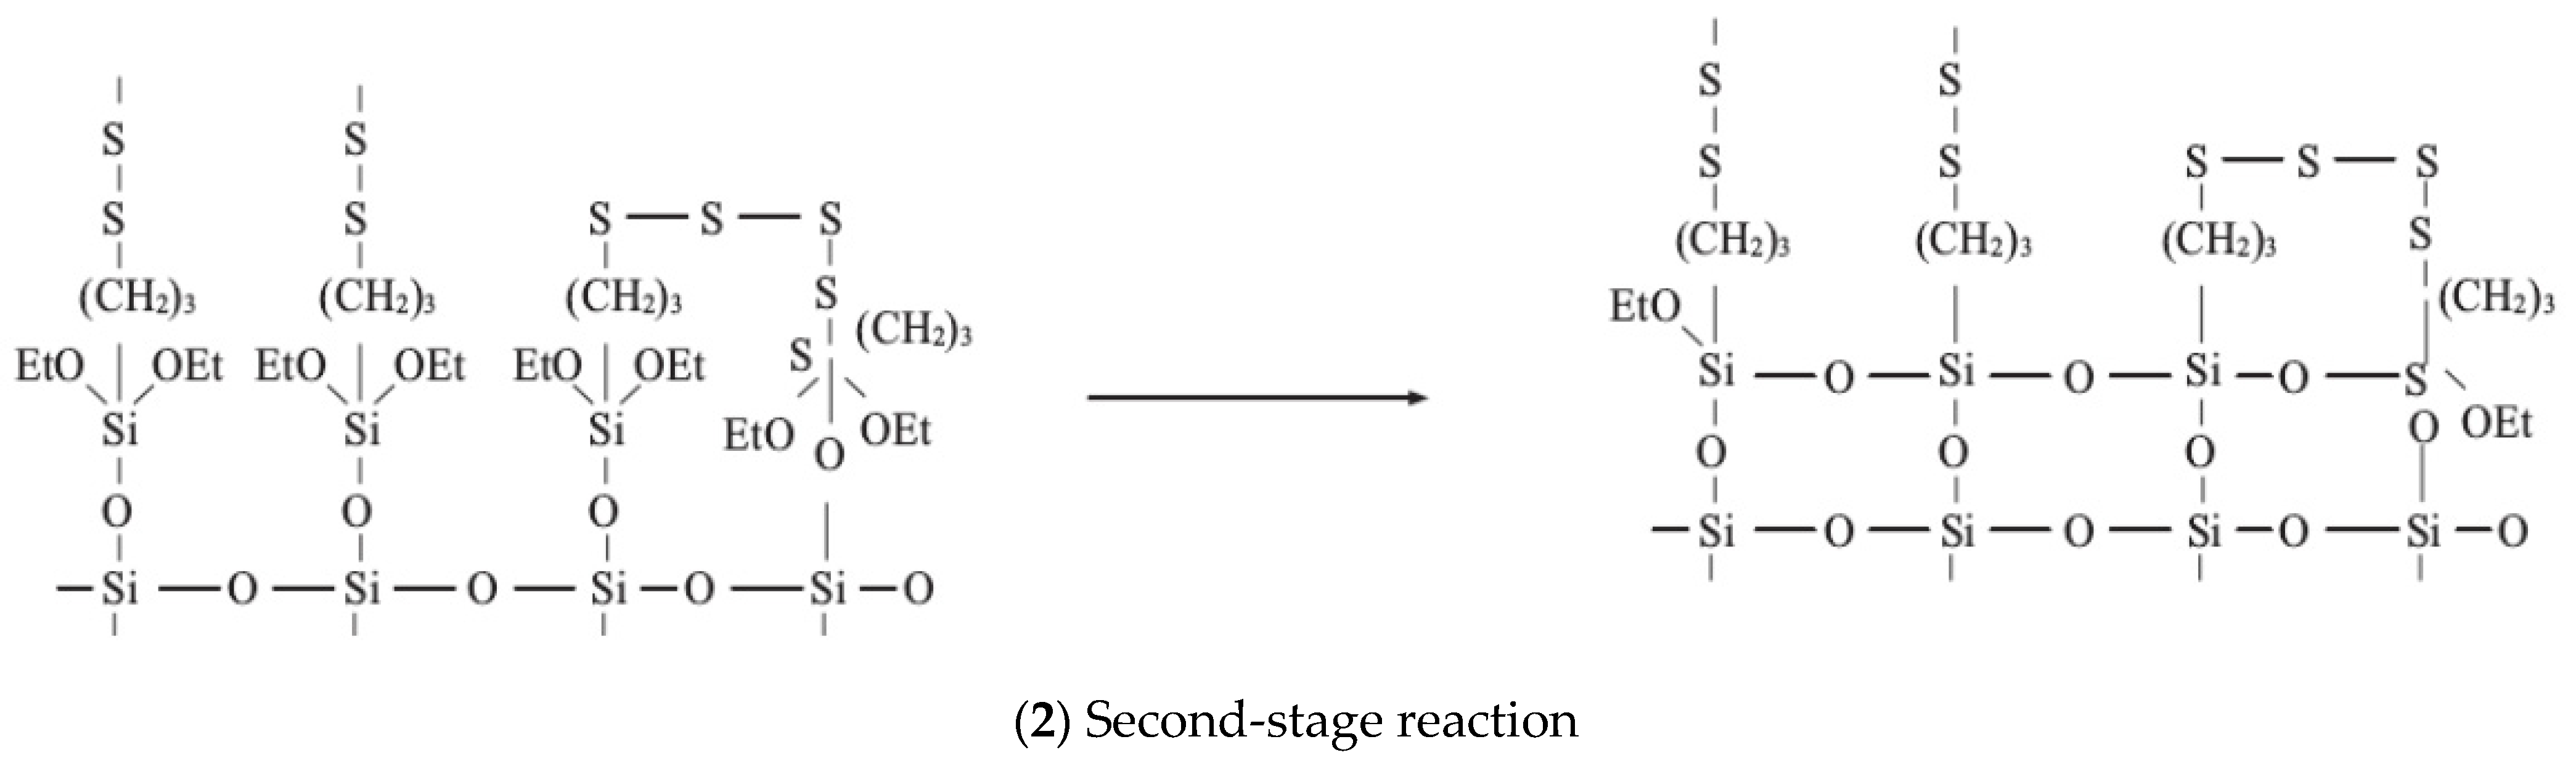
The silanization reaction between TESPT and silica can be divided into two steps, as shown in
Figure 4.
(1) First-stage reaction: In the first stage, the alkoxy group of TESPT dealcoholizes with the Si-OH group of silica, and the Si-OR group in TESPT hydrolyzes and forms a free Si-OH group. Accordingly, the dehydration condensation of the -Oh group starts on the silica surface.
(2) Second-stage reaction: The condensation reaction between adjacent silane coupling agents chemically bound to the surface of white carbon black.
In the second mixing stage, the mixing chamber temperature increases, and the mixer is closed. The high-temperature ethanol–water mixed steam cannot overflow in the mixer under the high-temperature environment of the mixing chamber. Therefore, the corrosion wear induced by the high-temperature steam should be considered in the friction and wear of the end face. However, the mixer is a massive device that can hardly be disassembled. Subsequently, the ethanol–water vapor produced in the mixing process cannot be measured directly. The silanization reaction index is commonly used to characterize the silanization reaction degree in the rubber industry. To accurately simulate the mixing situation of the mixer during the friction test, high-temperature ethanol–water mixed vapor was sprayed on the mixing rubber and metal surface according to the silanization reaction.
4. Experimental Results
4.1. Analysis of Rubber Processing
4.1.1. Payne Effect
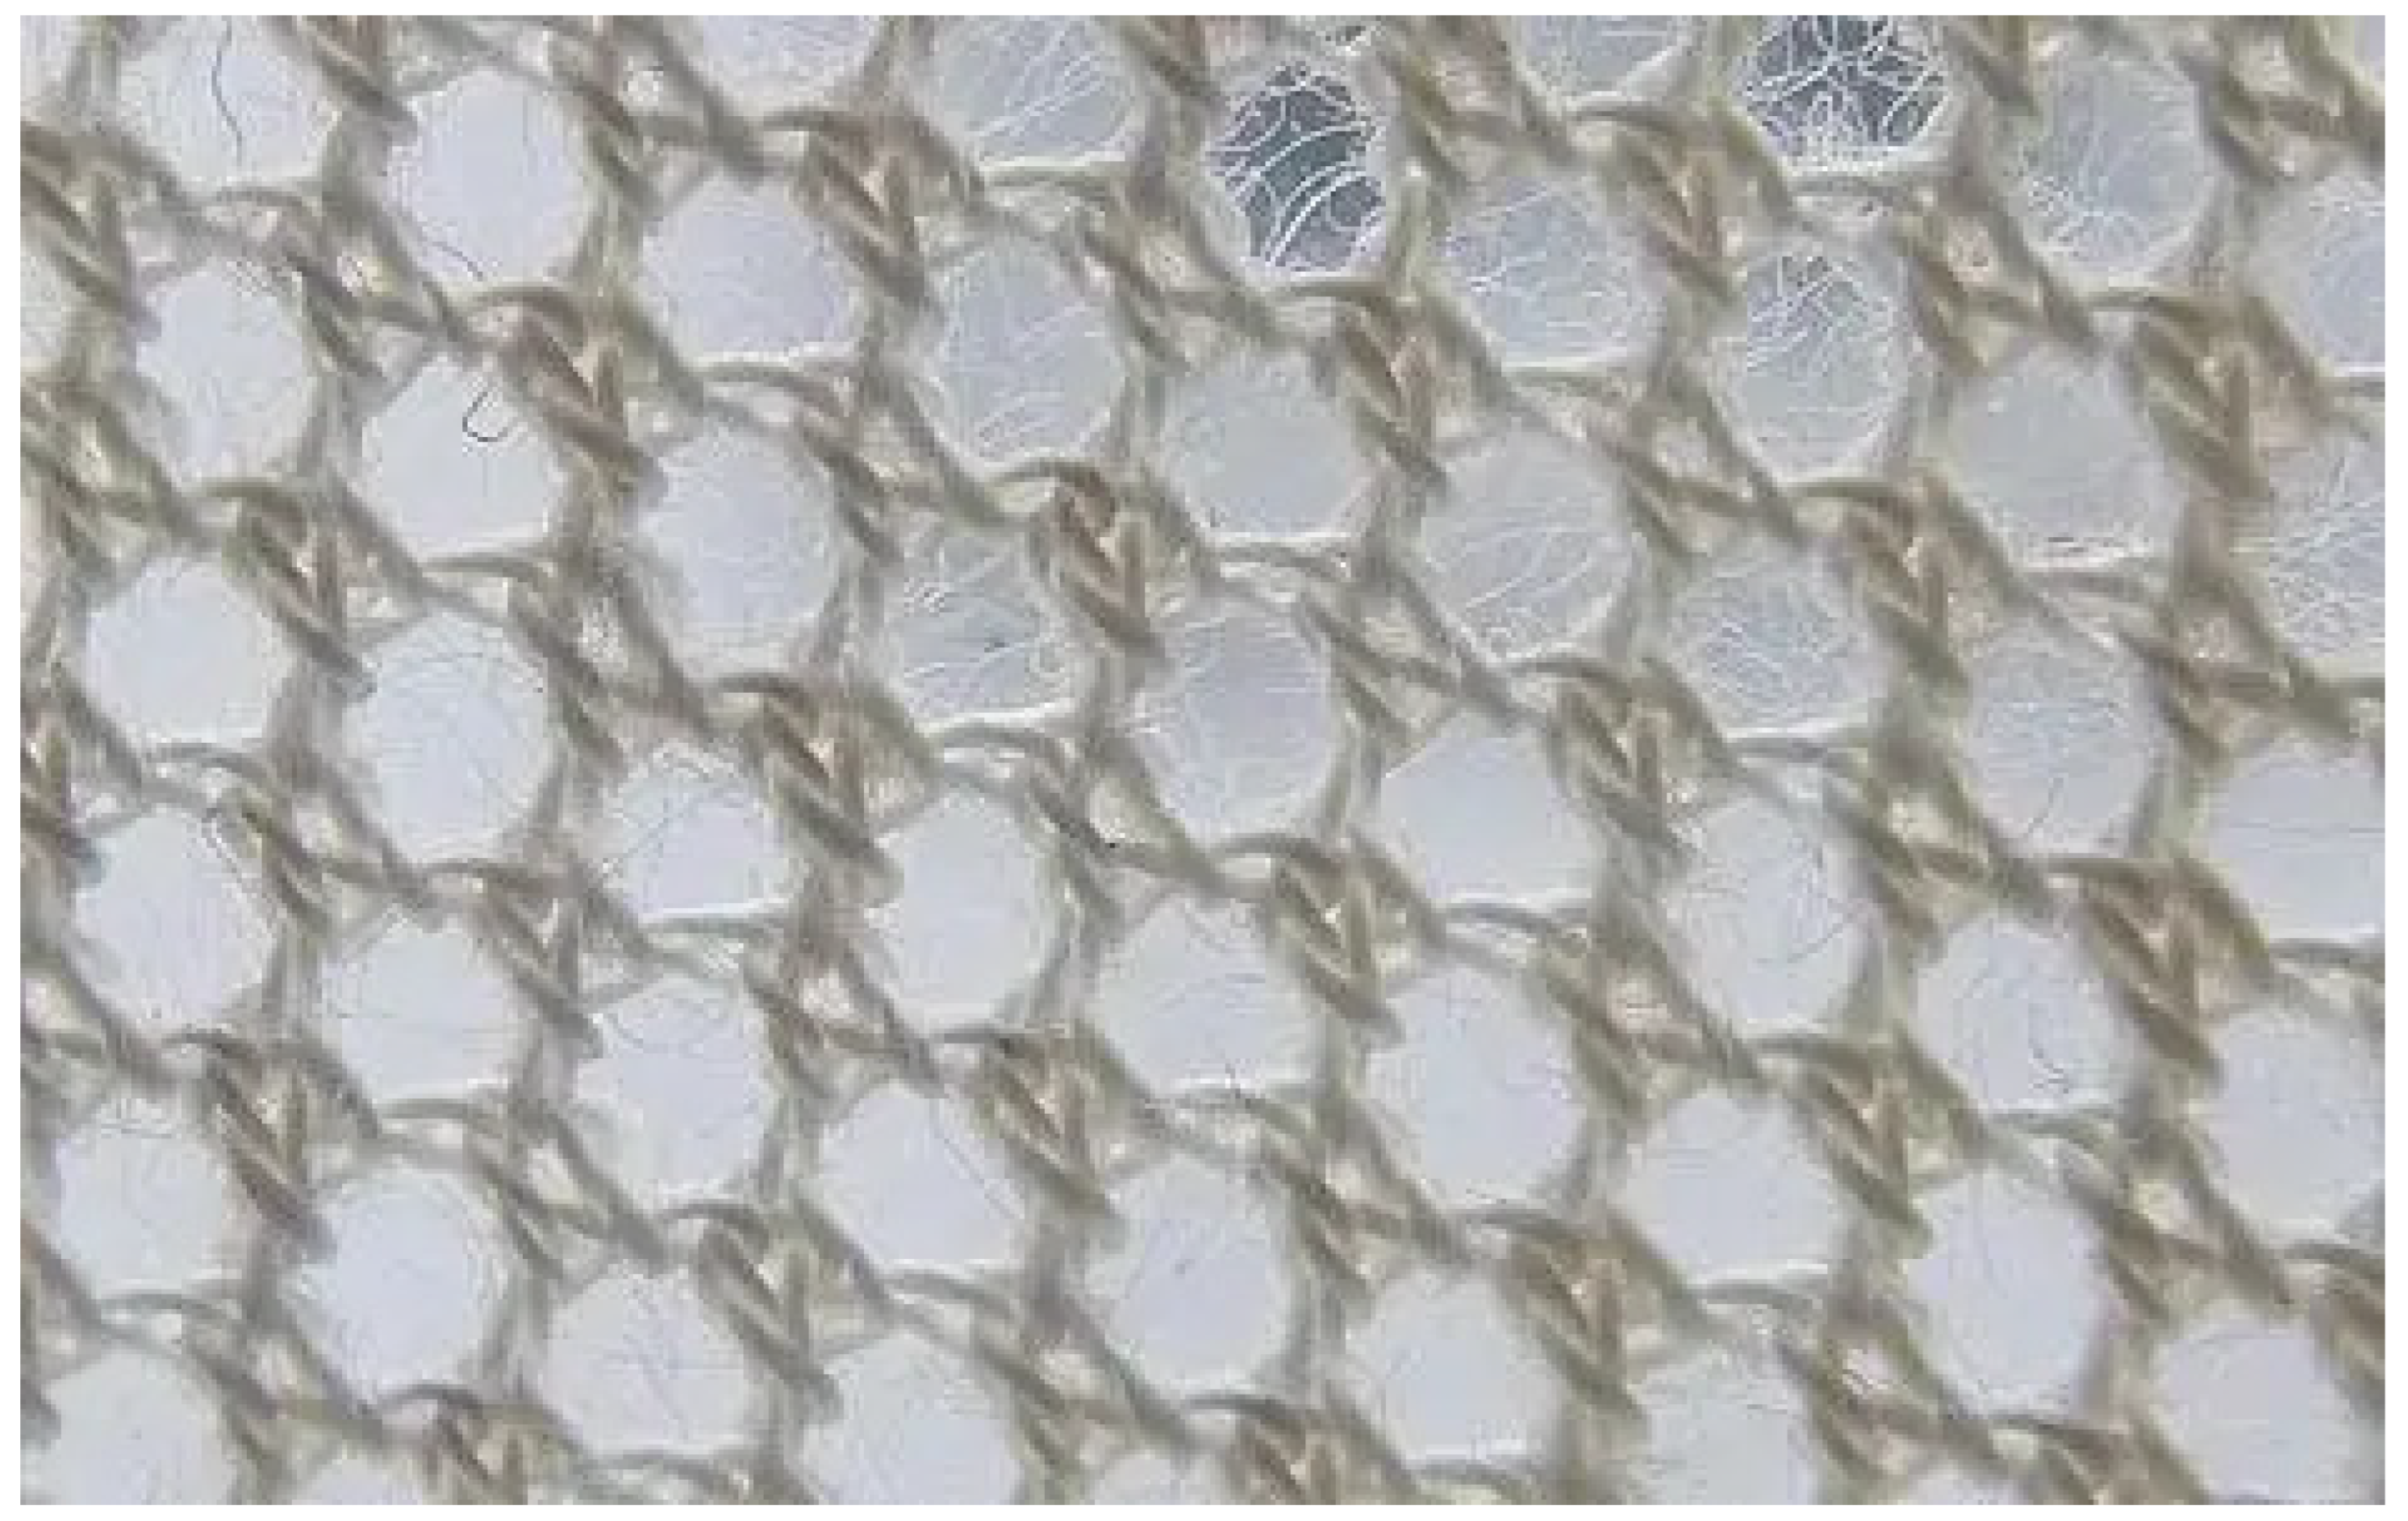
Figure 5 shows the Payne effect of five types of blends. This experiment used high-dispersion RFL pre-impregnated aramid staple fibers (1.5D length 3 mm). The aramid fiber is a new high-tech synthetic fiber with super high strength, a high modulus, high-temperature resistance, acid resistance, and alkali resistance. It is lightweight and has other excellent properties: it is 5–6 times stronger than steel wire, its modulus is 2–3 times that of steel wire or glass fiber, its toughness is 2 times that of steel wire, and its weight is only about 1/5 of that of steel wire. The microstructure of the aramid fiber is shown in
Figure 6. The aramid fiber has a vast surface area, and its surface can adsorb SiO
2 particles, which promotes the dispersion of SiO
2 particles.
No aramid fibers were added to the C1 formulation. There was no adsorption of aramid fibers on SiO2 particles to further promote the dispersion of SiO2 particles, so the silanization reaction was low, and the Payne effect was significant.
As the addition of aramid fibers continued, the surface area of aramid fibers within the compound increased and the adsorbed SiO2 particles increased. Therefore, the Payne effect of the C3 and C4 formulations of the compounding rubber continued to decrease. When the amount of aramid fibers added was 3 phr, the Payne effect of the compound was the smallest, and the SiO2 particle dispersion was the best at this time. As the addition of aramid fibers continued, agglomeration between the aramid fibers occurred, reducing the aramid fibers’ surface area within the compound. Therefore, the dispersion of SiO2 particles combined with 4 phr of aramid fibers decreased, and the Payne effect increased.
4.1.2. Rubber Dispersion Test
Figure 7 shows the dispersion image of the rubber, and the dispersion value is presented in
Table 4. The rubber dispersion test mainly focuses on SiO
2 particle aggregates, so rubber dispersion corresponds to the Payne effect.
4.2. Silanization Reaction Index
The silanization reaction degree of the rubber is shown in
Figure 8 and
Table 5. The silanization reaction degree reflects the compound’s dispersion of SiO
2 particles. It was found that when the amount of aramid fibers in the combination increased gradually, more SiO
2 particles could be absorbed, and the dispersion of SiO
2 particles increased. Accordingly, the silanization reaction degree gradually increased. When the amount of aramid fibers in the compound exceeded 3 phr, the agglomeration phenomenon occurred, decreasing the aramid fibers’ absorbable surface area. Meanwhile, the aggregate of aramid fiber particles had a large volume and was dispersed in the mixing glue, which hindered the dispersion of SiO
2 particles. Therefore, the degree of the silanization reaction of the compound with 4 phr of aramid fibers decreased.
In the field of the rubber industry, the silanization reaction index is commonly used to characterize the product qualitatively. High-temperature ethanol–water mixed vapor was sprayed on the mixing rubber and the metal surface to simulate the mixing process in the friction test. The spray flow rate was in proportion to the degree of the silanization reaction. Considering the ratio of the silanization reaction index in the present study, 150 °C ethanol–water mixed vapor was sprayed at 1:1.13:1.21:1.39:1.22.
4.3. CSM Friction and Wear Test
4.3.1. Average Friction Coefficient
Figure 9 shows the average friction coefficient measured in the CSM experiment.
Aramid fibers have a friction reduction property, mainly from their unique structure. As the amount of aramid fibers in the compound increased, the friction coefficient of the compound on the metal gradually decreased. Meanwhile, the absorbed SiO2 particles on the surface of the aramid fiber particles promoted the dispersion of SiO2 particles. Accordingly, the distribution of SiO2 particles improved, and the accumulation of SiO2 particles in the compound decreased, thereby reducing the compound friction on the metal. When the amount of aramid fibers in the combination exceeded 3 phr, the aramid fiber particles agglomerated, decreasing the absorbable surface area of the aramid fiber particles. The greater the accumulation, the lower the antifriction property of the aramid fibers, which increases the average friction coefficient of the mixing glue on the metal.
4.3.2. Three-Dimensional Morphology of the Metal Grinding Head
Figure 10 shows the surface morphology of the metal grinding head with ten times magnification, and
Figure 11 shows the three-dimensional morphology of the metal grinding head surface with ten times magnification. From
Figure 10 and
Figure 11, it can be seen that the three-dimensional shape of the metal surface of the C1 formulation had more areas of color deepening after rubbing, which indicates that the volume loss of the metal grinding head was greater. The C2, C3, and C4 formulations of the compounding rubber before and after rubbing the three-dimensional shape of the metal surface had a minor color change, indicating that the metal’s volume loss was reduced. The color-deepening area increased for the C5 formulation, which suggests that the abrasion of the metal increased for the C5 formulation relative to the C4 formulation.
4.3.3. Height Profiles before and after Friction
Figure 12 shows the height profile of the metal grinding head before and after friction. It was observed that the metal surface height profile subjected to the C1 rubber composition changed significantly. The surface height profile after friction was flattened, and more spikes appeared. Variations in the metal surface height profile of the C2 and C3 pieces were less than those of C1, and the lowest variations were achieved with the C4 arrangement. This may be attributed to the absorption of SiO
2 particles on the surface of aramid fiber particles, which promoted the dispersion of SiO
2 particles and reduced the SiO
2 agglomeration. This is because agglomerated SiO
2 particles have high hardness and a strong character, intensifying metal wear.
Meanwhile, as the amount of aramid fibers in the rubber compound increased, friction further reduced, and the metal wear weakened. When the amount of aramid fibers in the combination exceeded 3 phr, the aramid fiber particles agglomerated, decreasing the adsorbable surface area of the aramid fiber particles. The aggregated aramid fiber particles were relatively large and were dispersed in the mixing glue, hindering the dispersion of SiO2 particles and increasing the number of SiO2 particle aggregates. Therefore, the compound with 4 phr of aramid fibers had high metal wear.
4.3.4. Change in Metal Volume before and after Friction
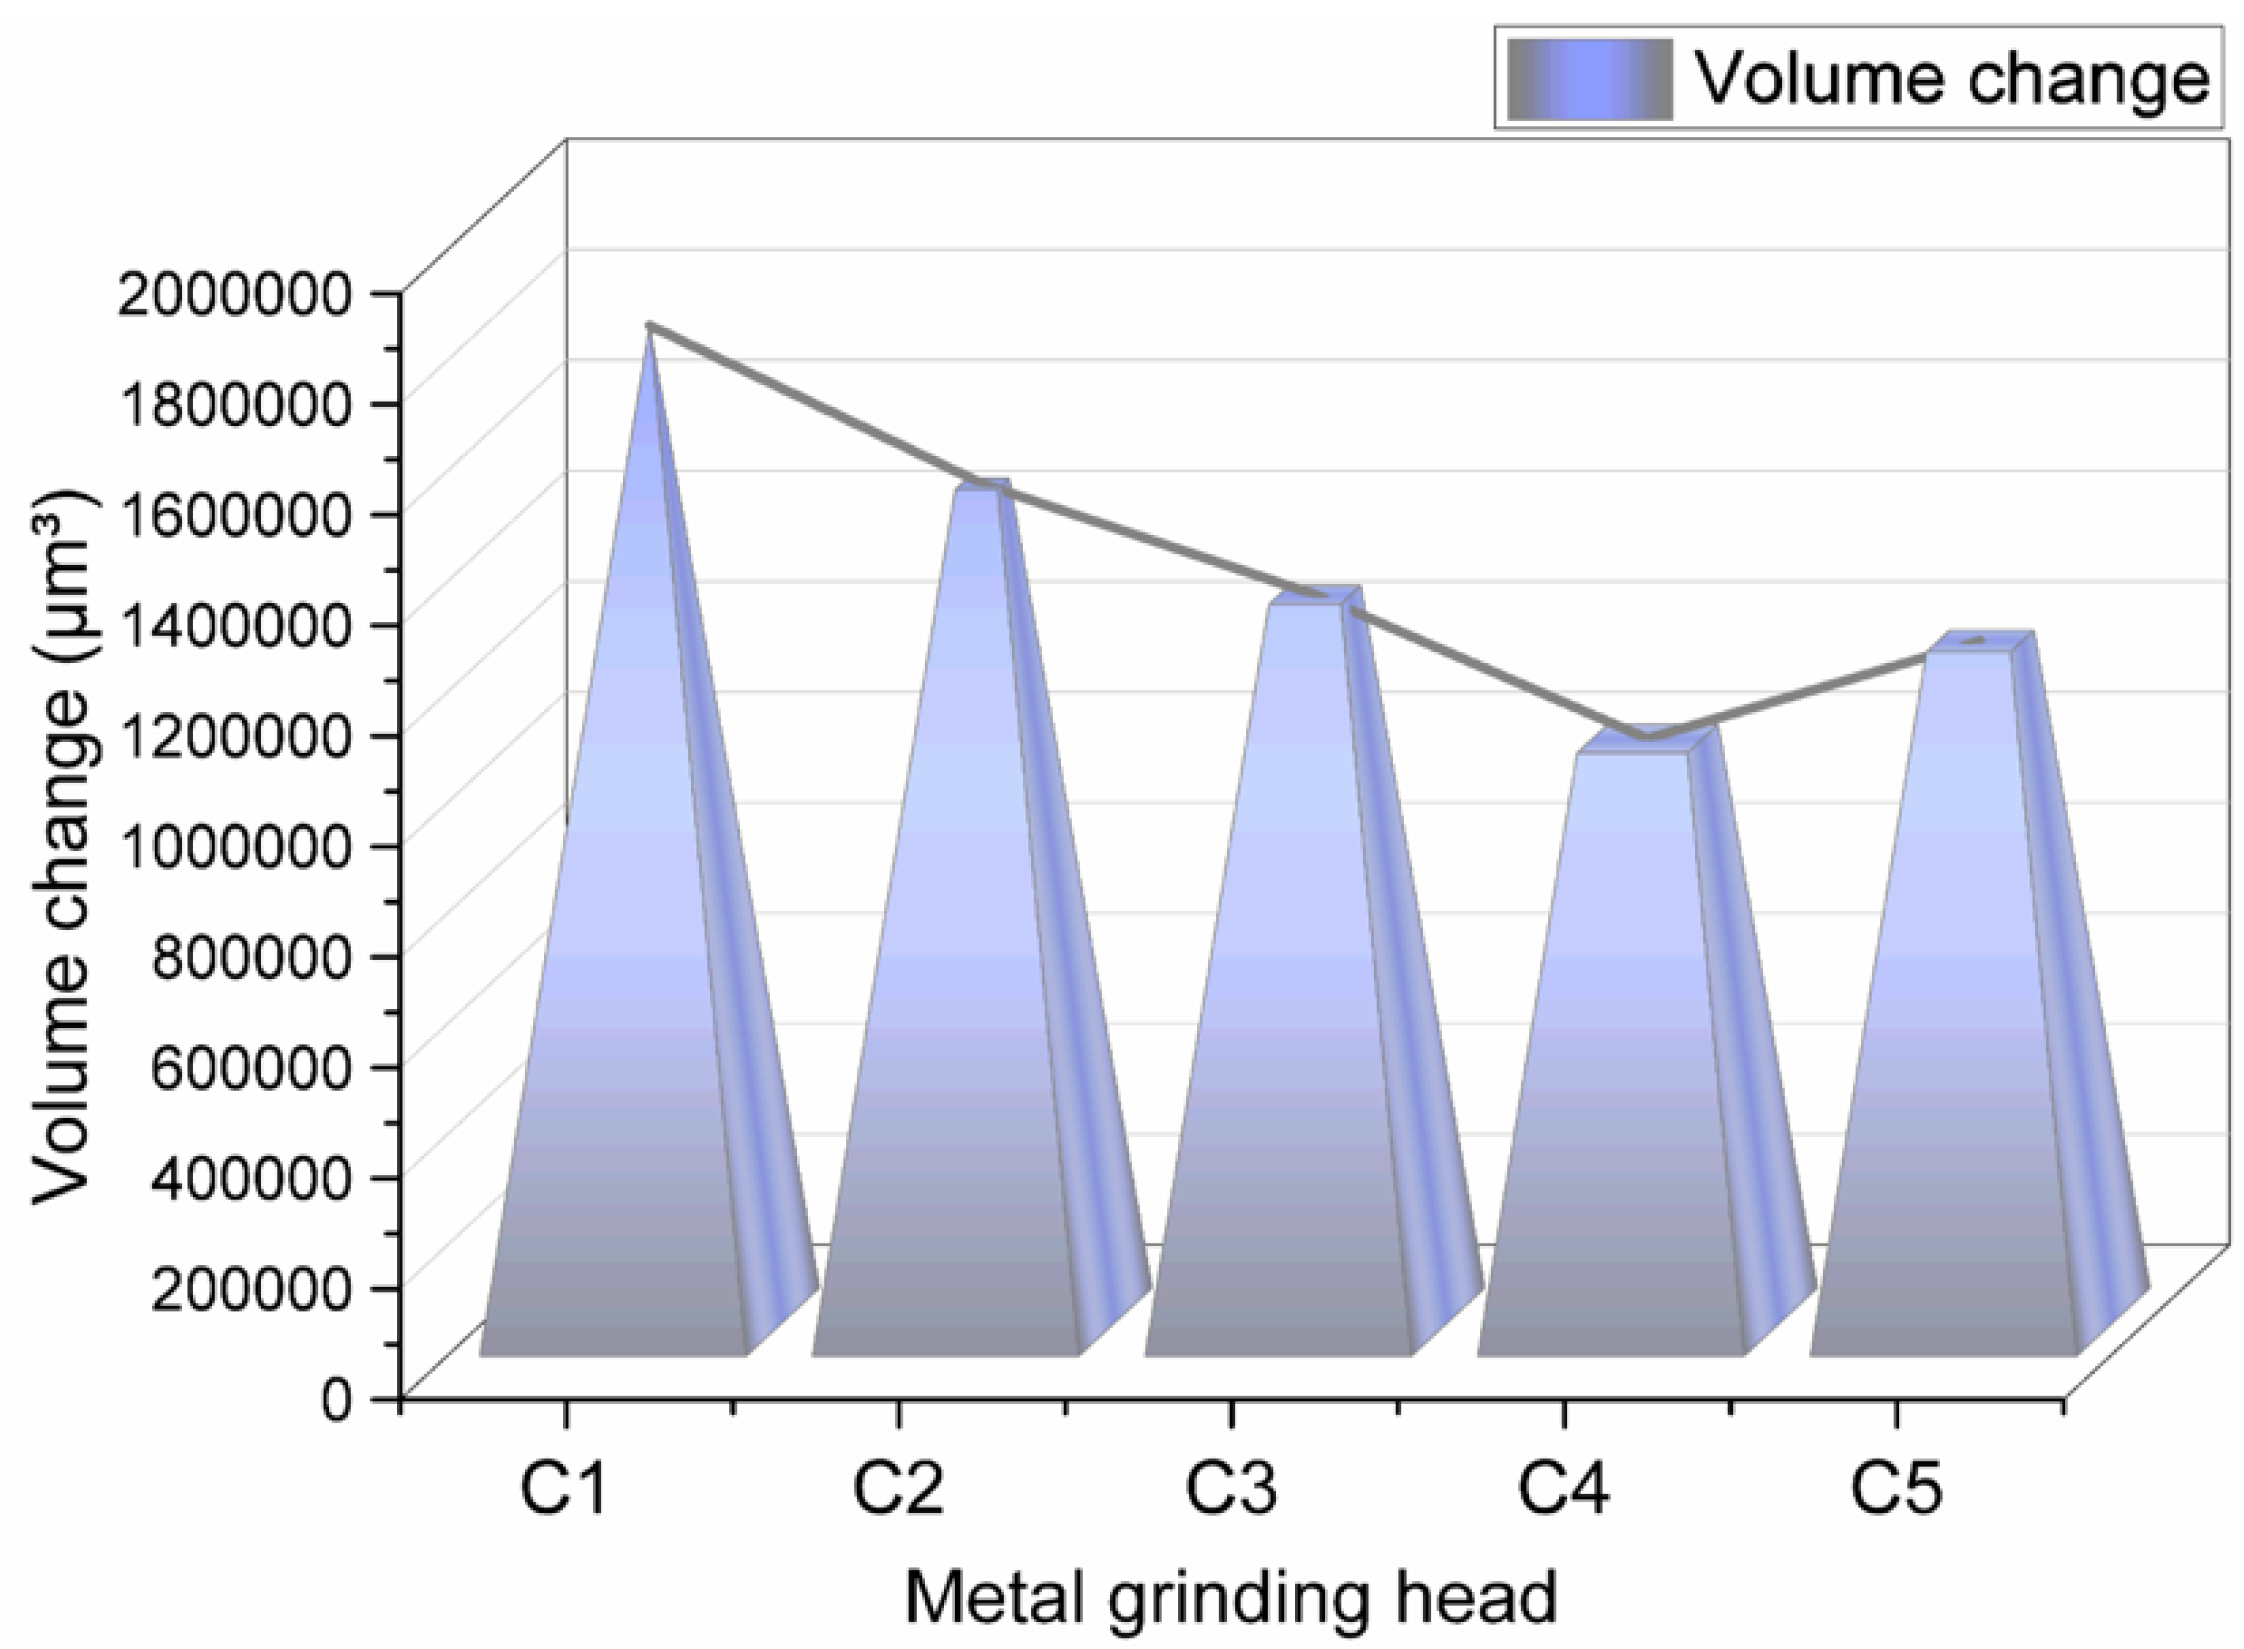
The change in the metal volume before and after friction is shown in
Figure 13.
Figure 13 indicates that as the amount of aramid fibers in the rubber compound increased, metal wear decreased first and then increased. This phenomenon may be attributed to the unique structure of aramid fibers. When the amount of aramid fibers is less than 3 phr, SiO
2 adheres to the surface of aramid fiber particles, thereby promoting the dispersion of SiO
2 particles and reducing the aggregation of SiO
2 particles. It is worth noting that these aggregated particles have a high hardness and sharp surface, which is the most critical parameter of metal wear. Accordingly, the lower the aggregation of SiO
2 particles, the lower the metal wear.
On the other hand, as the amount of aramid fibers in the compound increased, the substance friction and wear reduced. When the aramid fiber content exceeded 3 phr, the aramid fiber particles aggregated, decreasing the aramid fibers’ adsorbable surface area. Since aggregated aramid fiber particles are relatively large, they were dispersed in the mixing glue, hindering the dispersion of SiO2 particles and increasing the number of aggregated SiO2 particles. Accordingly, the compound with 4 phr of aramid fibers had relatively high metal wear.
4.3.5. Proportion of Corrosion Wear to Abrasive Wear
In this part, experiments were carried out while no ethanol–water vapor was sprayed. Therefore, the measured wear quantity was abrasive wear. The variation in the metal volume before and after the friction experiment is shown in
Figure 14.
The metal’s abrasive and corrosion wear could be calculated separately by comparing the measured wear volumes in the experiment with and without spewing the ethanol–water mixed steam. To ensure accuracy in the investigation, all tests were repeated six times, and then the obtained values were averaged. The proportions of the two wear mechanisms are shown in
Figure 15.
Corrosion wear mainly originated from the high-temperature ethanol–water vapor. On the other hand, the yield of the ethanol–water moisture was directly related to the degree of the silanization reaction. By adding aramid fibers to the rubber compound, the total surface area of the aramid fiber particles increased so that more SiO2 particles could be adsorbed, which promoted the dispersion of SiO2 particles. Accordingly, as the amount of aramid fibers in the rubber compound increased, the distribution of SiO2 particles improved, and the degree of the silanization reaction gradually increased. Moreover, the amount of high-temperature ethanol–water vapor increased, as well as the proportion of corrosion and wear additions. When the aramid fibers in the rubber compound exceeded 3 phr, the aramid fiber particles agglomerated. This phenomenon decreased the adsorbable surface area of the aramid fiber particles, thereby reducing the dispersion of SiO2 particles. Consequently, the silanization reaction in the compound with 5 phr of aramid fibers reduced, the amount of high-temperature ethanol–water vapor decreased, and the proportion of corrosion to wear dropped.
4.3.6. Changes in Metal Surface Roughness before and after Friction
Figure 16 illustrates the variation in the metal surface roughness before and after the friction of several mixing adhesives.
Figure 16 indicates that the roughness of the metal surface increased after friction. Silica has a high hardness and a strong character, and the accumulation of SiO
2 particles is the most critical factor affecting the metal surface roughness. When the amount of aramid fibers in the rubber compound was less than 3 phr, SiO
2 particles were attached to the surface of the aramid fiber particles, thereby promoting the dispersion of SiO
2 particles as well as reducing their accumulation. Meanwhile, as the amount of aramid fibers in the rubber compound increased, the friction reduction of the particles intensified, and metal wear reduced. Therefore, the metal surface roughness decreased continuously. When the aramid fiber content of the rubber compound exceeded 3 phr, aramid fiber particles aggregated, thereby reducing the adsorbable surface area of the aramid fiber particles, reducing the dispersion of SiO
2 particles, and increasing the aggregation of SiO
2 particles. Therefore, after mixing the glue with 4 phr of aramid fibers, the roughness of the metal surface increased.
5. Conclusions
In this experiment, the frictional wear of rubber on metal during the mixing process was studied by applying the silylation reaction mechanism and the frictional wear of metal from the perspective of the formulation process for the first time. With the addition of aramid fibers, the average friction coefficient and the amount of change in metal roughness between the rubber and metal during the mixing process gradually decreased and were the lowest when the addition amount of aramid fibers was 3 phr. When the addition of aramid fibers exceeded 3 phr, the rubber and metal friction coefficient and roughness increased gradually. With the addition of aramid fibers, the proportion of abrasive wear of rubber on metal in the mixing process decreased, and the balance of corrosion wear increased. However, when the addition of aramid fibers exceeded 3 phr, the proportion of abrasive wear of rubber on metal increased, and the ratio of corrosion wear decreased. When the amount of aramid fiber addition was 3 phr, the abrasive wear of rubber on metal was the smallest.
Author Contributions
Conceptualization, D.H. and H.C.; methodology, D.H.; software, H.C.; vali-dating, C.W., D.H. and J.W.; formal analysis, D.H.; investigation, W.H.; resources, C.W.; data curation, C.W.; writing—original draft preparation, Q.M.; writing—review and editing, W.H.; visualization, W.H.; supervision, W.H.; project administration, W.H.; funding acquisition, D.H. All authors have read and agreed to the published version of the manuscript.
Funding
This research was funded by the National Natural Science Foundation of China [52173101] and the Natural Science Foundation of Shandong Province [ZR2020KE037]. And the APC was funded by [Wenwen Han].
Institutional Review Board Statement
Not applicable.
Informed Consent Statement
Not applicable.
Data Availability Statement
The data presented in this study are available on request from the corresponding author.
Acknowledgments
Thanks to the editor for his encouragement and support for my article. Thank him very much!
Conflicts of Interest
The authors declare no conflict of interest. Research on properties of aramid short fiber reinforced natural rubber composites.
References
- Bienias, B.; Michalski, W.; Wagner, L. Mechanical strength assessment of aramid, glass and aramid-glass hybrid fibers reinforced dental photopolymer. Polimery 2019, 64, 605–609. [Google Scholar] [CrossRef] [Green Version]
- Chuang, Y.C.; Bao, L.M.; Lou, C.W.; Lin, J.H. Hybrid-Fiber-Reinforced Composite Boards Made of Recycled Aramid Fibers: Preparation and Puncture Properties. Fibers Polym. 2019, 20, 398–405. [Google Scholar] [CrossRef]
- Milyochin, Y.M.; Gusev, S.A.; Lunkina, G.V.; Sokolov, V.V.; Tikhonov, I.V.; Shchetinin, V.M. Aramid fiber reinforced epoxy composites: Fiber-matrix joint. Theor. Found. Chem. Eng. 2016, 50, 816–821. [Google Scholar] [CrossRef]
- Shirazi, M.; Talma, A.G.; Noordermeer, J.W.M. Viscoelastic properties of short aramid fibers-reinforced rubbers. J. Appl. Polym. Sci. 2013, 128, 2255–2261. [Google Scholar] [CrossRef]
- Zhang, S.F.; Zhang, M.Y.; Li, K.C. Adhesion force between aramid fibre and aramid fibrid by AFM. Polym. Bull. 2011, 66, 351–362. [Google Scholar] [CrossRef]
- Zhang, Y.; Dong, K.; Ma, J.; Liu, W.G. Application of Aramid Short Fiber in Dirt Tire Tread Compound. Tire Ind. 2021, 41, 3–8. [Google Scholar]
- Xiao, J.B.; Yang, P. Research on properties of aramid short fiber reinforced natural rubber compositesd. China Rubber. 2019, 35, 50–54. [Google Scholar]
- Liu, X.; Yang, X.X.; Gao, J.H. Characterization and finite element simulation of mechanical interface properties of short aramid fiber reinforced rubber composites. J. Fuzhou Univ. 2022, 50, 392–399. [Google Scholar]
- Liu, L.; Liang, S.; Zhou, Y.S.; Wang, D.P. Research on the impact resistance of modified aramid fiber rubber matrix composites. New Chem. Mater. 2022, 1–10. [Google Scholar]
- Pang, L.; Yang, T.J.; Yao, Y.Q.; Wang, C.L.; Liu, Z.X. Effects of aramid fibers on the properties of carbon nanotube-reinforced NR/BR composite adhesives. Spec. Rubber Prod. 2022, 3, 29–31. [Google Scholar]
- Patterson, B.A.; Malakooti, M.H.; Lin, J.J.; Okorom, A.; Sodano, H.A. Aramid nanofibers for multiscale fiber reinforcement of polymer composites. Compos. Sci. Technol. 2018, 161, 92–99. [Google Scholar] [CrossRef]
- Han, D.; Pan, Y.; Xue, J.; Yu, B.; Yan, G.; Wang, C.; Wang, K.; Pan, Y. Effect of adding different silane coupling agents on metal friction and wear in mixing process. J. Appl. Polym. Sci. 2021, 138, 51408. [Google Scholar] [CrossRef]
- Han, D.; Wang, K.; Bian, H.; Yan, G.; Wang, C. Effect of different amounts of graphene on metal friction and wear during the mixing process. Polym. Compos. 2021, 42, 5075–5089. [Google Scholar] [CrossRef]
- Han, D.; Yan, G.; Li, S.; Pan, Y.; Chen, Y.; Wang, C.; Liu, H. Study on mechanical properties and antifriction of calcium powder filled rubber. Polym. Compos. 2021, 43, 874–888. [Google Scholar] [CrossRef]
- Han, D.; Zhang, S.; Wang, K.; Pan, Y.; Zhu, D.; Wang, C.; Pan, Y. A comparison of the effects of traditional and wet mixing processes of rubber on metal friction and wear. J. Appl. Polym. Sci. 2021, 138, 50761. [Google Scholar] [CrossRef]
- Han, D.; Wang, K.; Yan, G.; Pan, Y.; Xue, J.; Wang, C.; Bian, H. Effect of the ratio of graphene oxide(GO) and multi-walled carbon nanotubes(MWCNTs) on metal friction and wear during mixing. Polym. Test. 2021, 106, 107441. [Google Scholar] [CrossRef]
- Han, D.; Pan, Y.; Li, S.; Xu, M.; Xiao, X.; Hao, X.; Huang, E.; Wang, C.; Bian, H. Friction and wear of Stellite 6B during slid-ing against rubber compound with varied carbon fiber content. Polym. Test. 2021, 106, 107470. [Google Scholar] [CrossRef]
- Han, D.; Zhang, S.; Pan, Y.; Wang, C. Simulation and experimental research on the wear of synchronous quadruple rotor of an internal mixer during the mixing process. Eng. Fail. Anal. 2022, 139, 106450. [Google Scholar] [CrossRef]
- Han, D.; Wang, K.; Wang, C.; Han, W. The Effect of Different Dosages of TESPT on Metal Friction and Metal Wear in the Mixing Process. Polymers 2022, 14, 2314. [Google Scholar] [CrossRef]
- Huang, M.; Li, K.; Dong, X. Study on Friction Characteristics of Laser Textured Metal Rubber Microfilaments under Solid Lubricating Grease. Prot. Met. Phys. Chem. Surfaces 2021, 57, 361–366. [Google Scholar] [CrossRef]
- Han, D.; Li, S.; Xiao, X.; Xu, M.; Chen, Y.; Wang, C.; Bian, H. Effect of different dosages of carbon nanotube s on the metal friction and metal wear in the mixing process. Polym. Compos. 2021, 42, 6051–6064. [Google Scholar] [CrossRef]
- Karger-Kocsis, J.; Mousa, A.; Major, Z.; Békési, N. Dry friction and sliding wear of EPDM rubbers against steel as a function of carbon black content. Wear 2008, 264, 359–367. [Google Scholar] [CrossRef]
- Feng, D.; Shen, M.-X.; Peng, X.-D.; Meng, X.-K. Surface Roughness Effect on the Friction and Wear Behaviour of Acrylonitrile–Butadiene Rubber (NBR) Under Oil Lubrication. Tribol. Lett. 2016, 65, 10. [Google Scholar] [CrossRef]
- Leech, P.W.; Li, X.S.; Alam, N. Comparison of abrasive wear of a complex high alloy hardfacing deposit and WC–Ni based metal matrix composite. Wear 2012, 294–295, 380–386. [Google Scholar] [CrossRef]
- Leech, P.; Li, X. Comparison of abrasive wear in diamond composites and WC-based coatings. Wear 2011, 271, 1244–1251. [Google Scholar] [CrossRef]
- Walker, C.I.; Robbie, P. Comparison of some laboratory wear tests and field wear in slurry pumps. Wear 2013, 302, 1026–1034. [Google Scholar] [CrossRef]
- Leite, R.V.D.M.; Marques, P.V. Comparative study of the wear resistance of three metal-fluxed core wire-welded coatings used in industry. Weld. Int. 2011, 25, 917–922. [Google Scholar] [CrossRef]
- Ren, Z.; Huang, J.; Bai, H.; Jin, R.; Xu, F.; Xu, J. Potential Application of Entangled Porous Titanium Alloy Metal Rubber in Artificial Lumbar Disc Prostheses. J. Bionic Eng. 2021, 18, 584–599. [Google Scholar] [CrossRef]
- Moreno-Ríos, M.; Gallardo-Hernández, E.; Yáñez-Escoto, M.; Márquez-Tamayo, L.; Iturbe-Salas, E. Evaluation of surface modification in a steel track for the rubber tyred Metro. Wear 2019, 426–427, 1265–1271. [Google Scholar] [CrossRef]
- Li, B.; Li, S.-X.; Shen, M.-X.; Xiao, Y.-L.; Zhang, J.; Xiong, G.-Y.; Zhang, Z.-N. Tribological behaviour of acrylonitrile-butadiene rubber under thermal oxidation ageing. Polym. Test. 2020, 93, 106954. [Google Scholar] [CrossRef]
- Antonov, M.; Pirso, J.; Vallikivi, A.; Goljandin, D.; Hussainova, I. The effect of fine erodent retained on the surface during erosion of metals, ceramics, plastic, rubber and hardmetal. Wear 2016, 354-355, 53–68. [Google Scholar] [CrossRef]
- Rezaeian, I.; Zahedi, P.; Rezaeian, A. Rubber Adhesion to Different Substrates and Its Importance in Industrial Applications: A Review. J. Adhes. Sci. Technol. 2012, 26, 721–744. [Google Scholar] [CrossRef]
- Békési, N.; Váradi, K.; Felhos, D. Wear Simulation of a Reciprocating Seal. J. Tribol. 2011, 133, 031601. [Google Scholar] [CrossRef]
- Santos da Silva, F.; Benedetti, A.; Cano, I.G.; Dosta, S.; Guilemany, J.M. Electrochemical Study of Al Coatings Obtained by Cold Gas Spray (CGS) on Different Substrates. Peer Rev. 2015, 23, 1251–1258. [Google Scholar]
- Bocca, B.; Forte, G.; Petrucci, F.; Costantini, S.; Izzo, P. Metals contained and leached from rubber granulates used in synthetic turf areas. Sci. Total Environ. 2009, 407, 2183–2190. [Google Scholar] [CrossRef] [PubMed]
- Levchenko, G.V.; Svistelnik, O.Y.; Plyuta, V.L.; Sychkov, A.B.; Nesterenko, A.M. Manufacturing technology for cast inserts of new wear-resistant alloys for combined mill linings. Metallurgist 2013, 56, 748–752. [Google Scholar] [CrossRef]
- Martínez, F.; Canales, M.; Bielsa, J.; Jiménez, M. Relationship between wear rate and mechanical fatigue in sliding TPU–metal contacts. Wear 2010, 268, 388–398. [Google Scholar] [CrossRef]
- Durmuş, H.; Çömez, N.; Gül, C.; Yurddaşkal, M.; Yurddaşkal, M. Wear performance of Fe-Cr-C-B hardfacing coatings: Dry sand/rubber wheel test and ball-on-disc test. Int. J. Refract. Metals Hard Mater. 2018, 77, 37–43. [Google Scholar] [CrossRef]
- Szala, M. Cavitation Erosion, Abrasive and Sliding Wear Behaviour of MetalBased Structures. Metals 2022, 12, 373. [Google Scholar] [CrossRef]
- Yüksel, N.; Şahin, S. Effects of Ferroboron and Ferrochromium Powder Addition on Abrasive Wear Resistance of Fe-Based Hardfacing Coatings. Mater. Test. 2014, 56, 694–699. [Google Scholar] [CrossRef]
- Fan, W.; Liu, Y.; Song, X.; Cheng, J.; Li, J. Influencing Mechanism of Rubber Wheel on Contact Pressure and Metal Removal in Corrugated Rail Grinding by Abrasive Belt. J. Manuf. Sci. Eng. 2018, 140, 124501. [Google Scholar] [CrossRef]
- Hekmat-Ardakan, A.; Liu, X.; Ajersch, F.; Chen, X.-G. Wear behaviour of hypereutectic Al–Si–Cu–Mg casting alloys with variable Mg contents. Wear 2010, 269, 684–692. [Google Scholar] [CrossRef]
- Sivaprasad, K.; Babu, S.P.K.; Natarajan, S.; Narayanasamy, R.; Kumar, B.A.; Dinesh, G. Study on abrasive and erosive wear behaviour of Al 6063/TiB2in situ composites. Mater. Sci. Eng. A 2008, 498, 495–500. [Google Scholar] [CrossRef]
- Tozetti, K.; Albertin, E.; Scandian, C. Abrasive size and load effects on the wear of a 19.9% chromium and 2.9% carbon cast iron. Wear 2017, 376–377, 46–53. [Google Scholar] [CrossRef]
- Sarath, P.; Moni, G.; George, J.J.; Haponiuk, J.T.; Thomas, S.; George, S.C. A study on the influence of reduced graphene oxide on the mechanical, dynamic mechanical and tribological properties of silicone rubber nanocomposites. J. Compos. Mater. 2020, 55, 2011–2024. [Google Scholar] [CrossRef]
Figure 1.
Distribution of silanization reaction degree.
Figure 1.
Distribution of silanization reaction degree.
Figure 2.
Configuration of the CSM wear experiment.
Figure 2.
Configuration of the CSM wear experiment.
Figure 3.
Chemical composition and molecular structure of TESPT.
Figure 3.
Chemical composition and molecular structure of TESPT.
Figure 4.
The silanization reaction.
Figure 4.
The silanization reaction.
Figure 6.
Microstructure of the aramid fiber (20× magnification).
Figure 6.
Microstructure of the aramid fiber (20× magnification).
Figure 7.
Dispersion image.
Figure 7.
Dispersion image.
Figure 8.
Distributions of the silanization reaction degree.
Figure 8.
Distributions of the silanization reaction degree.
Figure 9.
Average friction coefficient.
Figure 9.
Average friction coefficient.
Figure 10.
Surface morphology of the metal grinding head before and after friction.
Figure 10.
Surface morphology of the metal grinding head before and after friction.
Figure 11.
Three-dimensional morphology of the metal surface before and after friction.
Figure 11.
Three-dimensional morphology of the metal surface before and after friction.
Figure 12.
Height profiles before and after friction.
Figure 12.
Height profiles before and after friction.
Figure 13.
Change in the metal volume before and after friction.
Figure 13.
Change in the metal volume before and after friction.
Figure 14.
Metal wear volume without spraying the ethanol–water mixture.
Figure 14.
Metal wear volume without spraying the ethanol–water mixture.
Figure 15.
The ratio of the two wear mechanisms.
Figure 15.
The ratio of the two wear mechanisms.
Figure 16.
Metal surface roughness before and after friction.
Figure 16.
Metal surface roughness before and after friction.
Table 1.
Chemical composition of the prepared samples.
Table 1.
Chemical composition of the prepared samples.
| Raw Material | C1 | C2 | C3 | C4 | C5 |
|---|
| BR9000 | 25.5 | 25.5 | 25.5 | 25.5 | 25.5 |
| RC2557S | 81.81 | 81.81 | 81.81 | 81.81 | 81.81 |
| TSR20 | 15 | 15 | 15 | 15 | 15 |
| N234 | 10 | 10 | 10 | 10 | 10 |
| Silica115MP | 45 | 45 | 45 | 45 | 45 |
| TESPT | 6 | 6 | 6 | 6 | 6 |
| ZnO | 2 | 2 | 2 | 2 | 2 |
| SAD | 2 | 2 | 2 | 2 | 2 |
| 4020 | 2 | 2 | 2 | 2 | 2 |
| DPG | 0.8 | 0.8 | 0.8 | 0.8 | 0.8 |
| Aramid fiber | 0 | 1 | 2 | 3 | 4 |
| S | 1.3 | 1.3 | 1.3 | 1.3 | 1.3 |
| CZ | 1.8 | 1.8 | 1.8 | 1.8 | 1.8 |
Table 2.
The preparation process of the mixed rubber.
Table 2.
The preparation process of the mixed rubber.
| 1.6 L Mixer, 70 rpm, 75% FF |
|---|
| Time | T (°C) | Ingredients |
|---|
| Master batch |
| 0:00 | 40 | Polymers |
| 0:40 | | Chemical, 1/2 Silica115 MP |
| 1:10 | | 1/2 Silica115 MP |
| 2:30 | 120 | Sweep |
| 4:00 | 135 | Sweep, Sampling |
| 5:00 | 145 | Discharge |
Table 3.
Stages of the RPA method to measure the degree of the silanization reaction.
Table 3.
Stages of the RPA method to measure the degree of the silanization reaction.
| Stage | Frequency/Hz | T/℃ | Time/min | Strain | Test Items |
|---|
| 1 | 0.1 | 60 | 5 | 0.28% | - |
| 2 | 1 | 60 | - | 0.28–40% | G’ (02) |
| 3 | 1 | 60 | - | 0.28–40% | G’ (03) |
| 4 | 0.1 | 60/160/160 | 0/2.5/5 | 0.28% | - |
| 5 | 1 | 60 | - | 0.28–40% | G’ (05) |
| 6 | 1 | 60 | - | 0.28–40% | G’ (06) |
Table 4.
Dispersion values.
Table 4.
Dispersion values.
| Rubber Compound | C1 | C2 | C3 | C4 | C5 |
|---|
| Dispersion | 5.14 | 5.57 | 5.97 | 6.68 | 6.39 |
Table 5.
Silanization reaction index of five blends.
Table 5.
Silanization reaction index of five blends.
| Rubber Compounds | C1 | C2 | C3 | C4 | C5 |
|---|
| Silanization reaction index | 0.463 | 0.525 | 0.559 | 0.642 | 0.563 |
| Publisher’s Note: MDPI stays neutral with regard to jurisdictional claims in published maps and institutional affiliations. |
© 2022 by the authors. Licensee MDPI, Basel, Switzerland. This article is an open access article distributed under the terms and conditions of the Creative Commons Attribution (CC BY) license (https://creativecommons.org/licenses/by/4.0/).


