
Strain Release Behaviour during Crack Growth of a Polymeric Beam under Elastic Loads for Self-Healing


Abstract
:1. Introduction
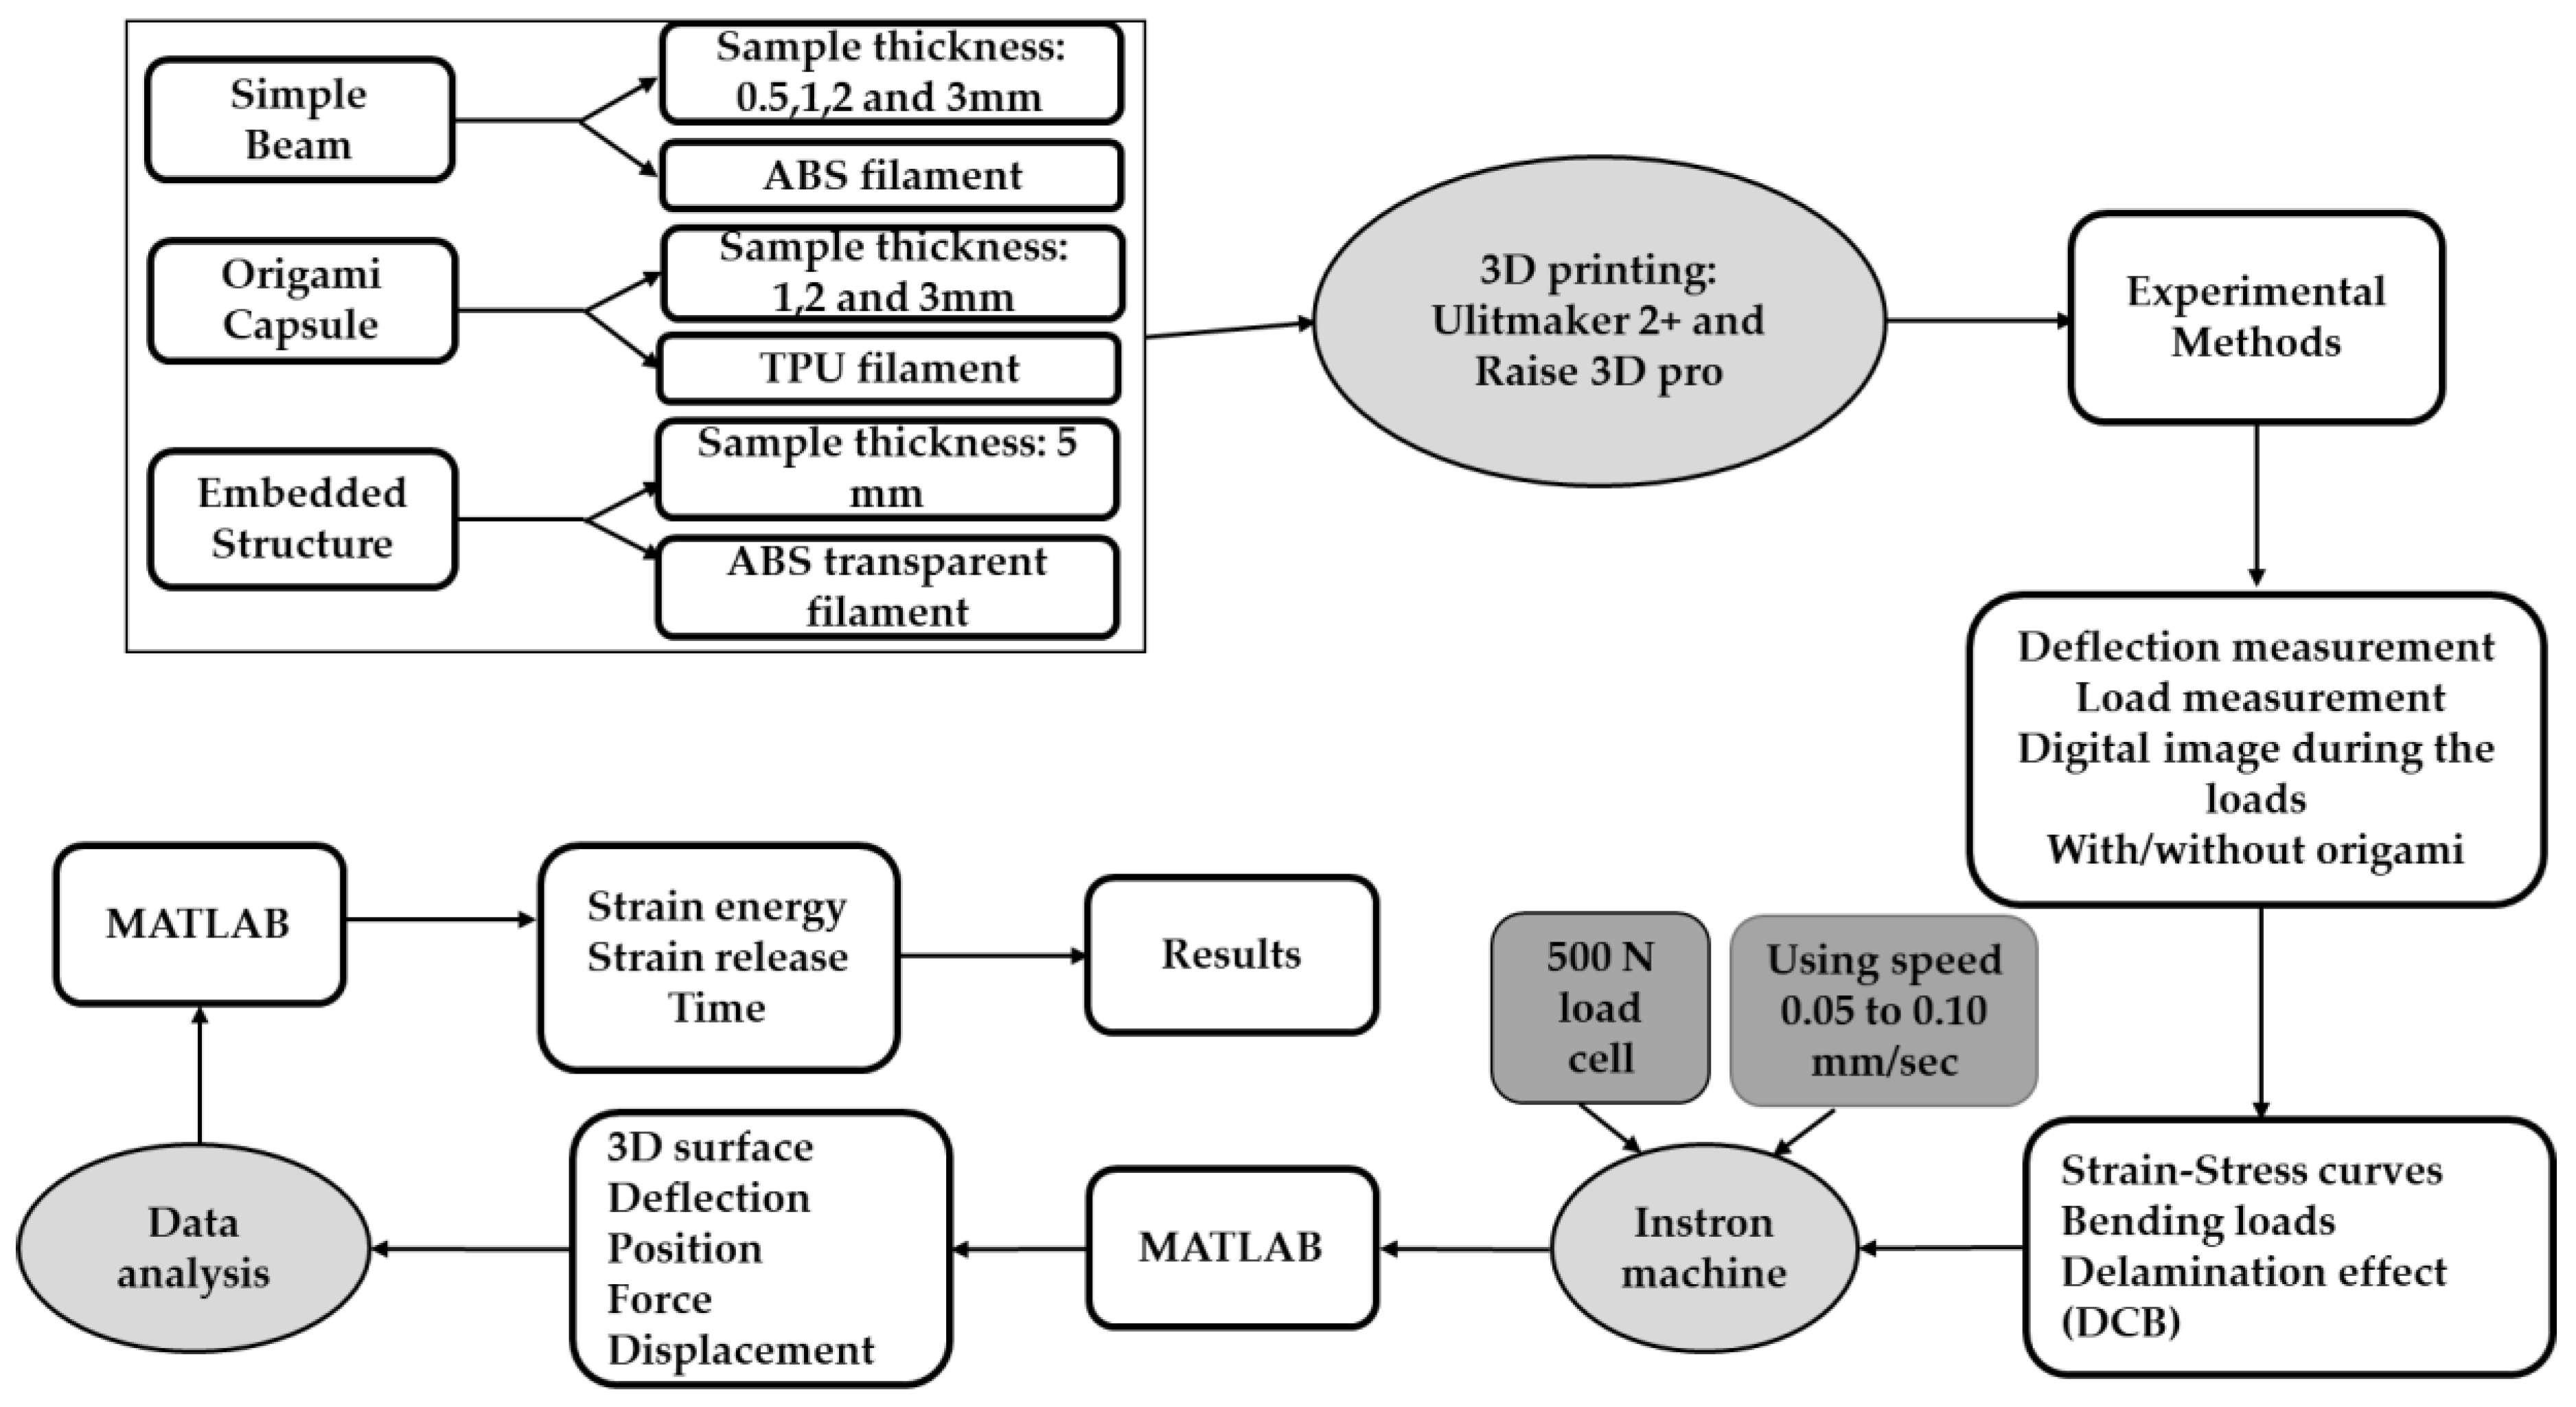
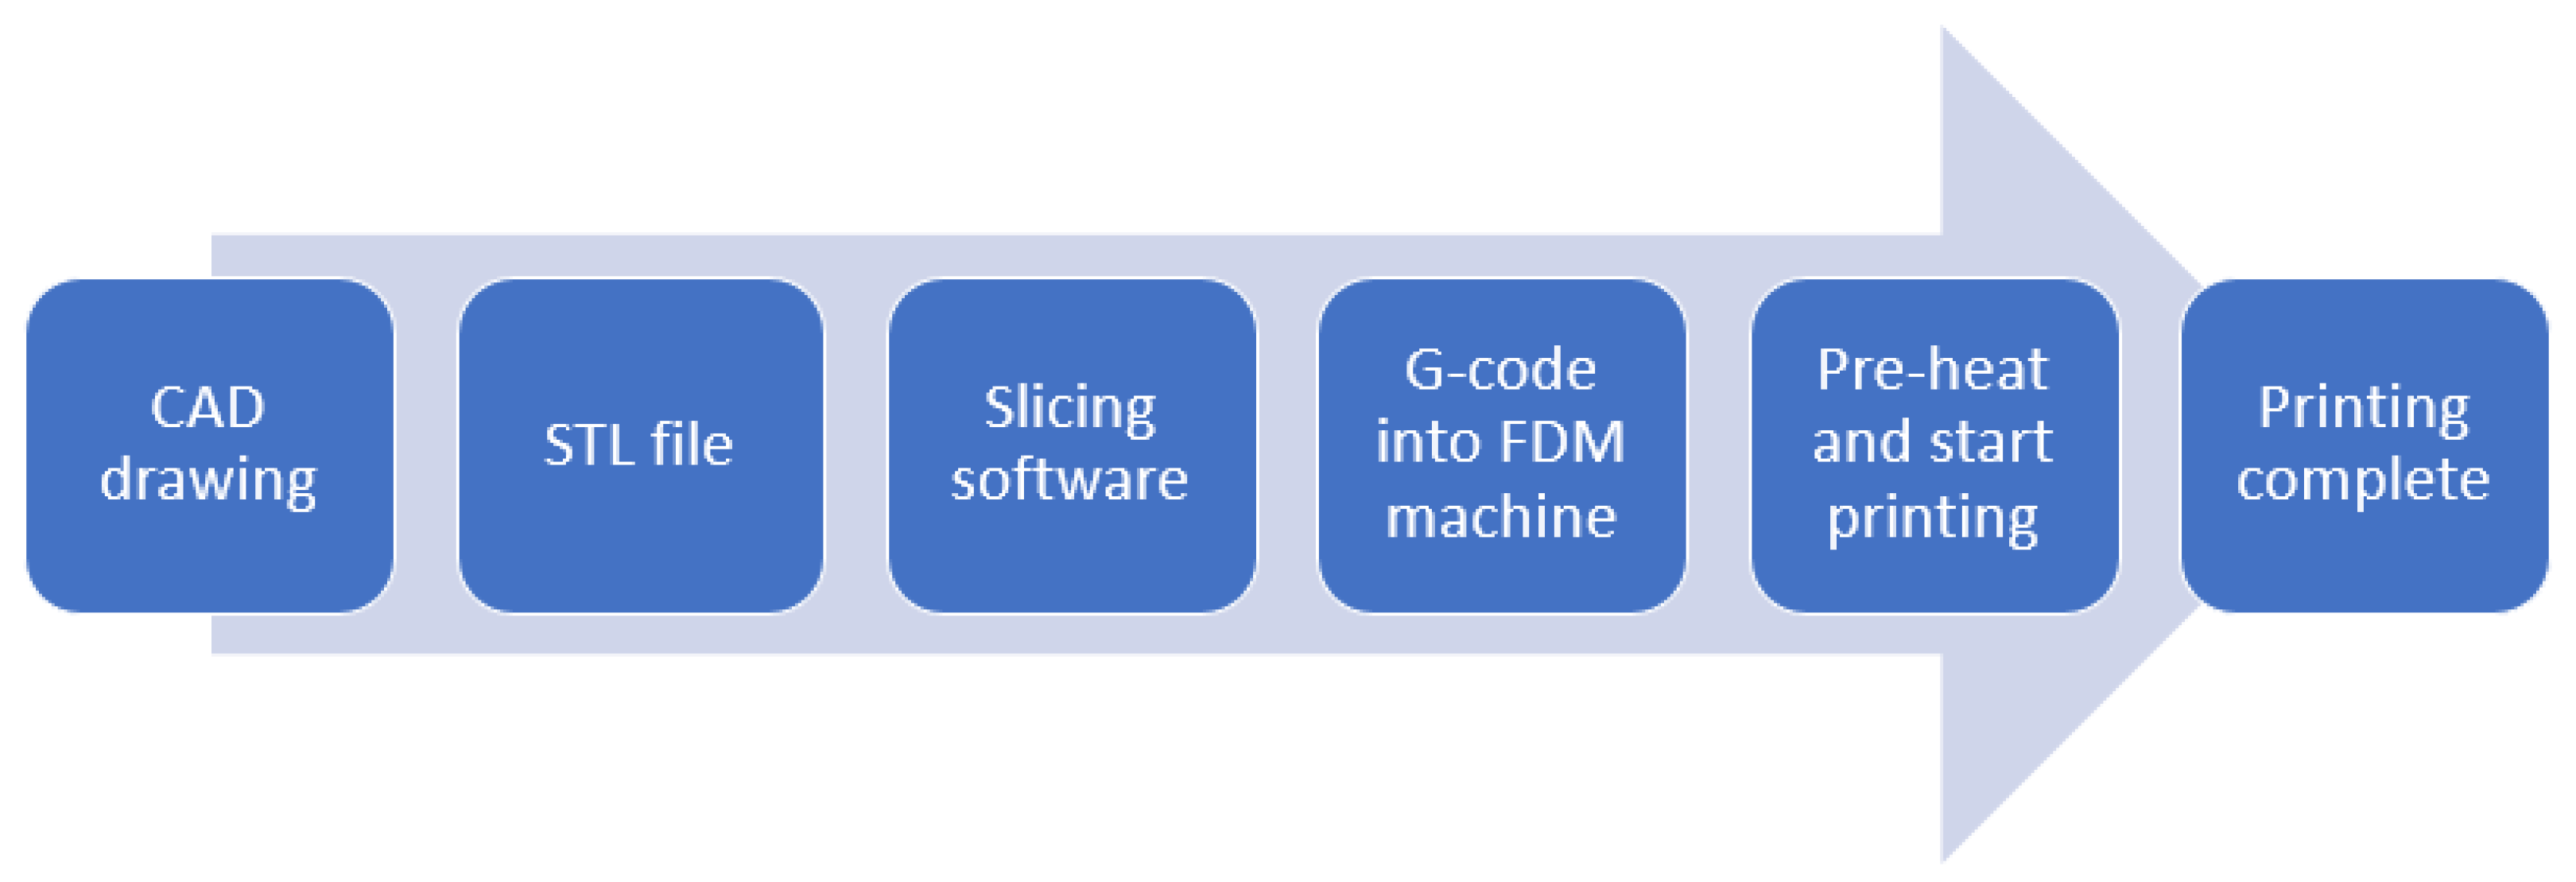
2. Methodology
2.1. Material Selection
2.2. Specimen Preparation
2.3. Design of Experiment
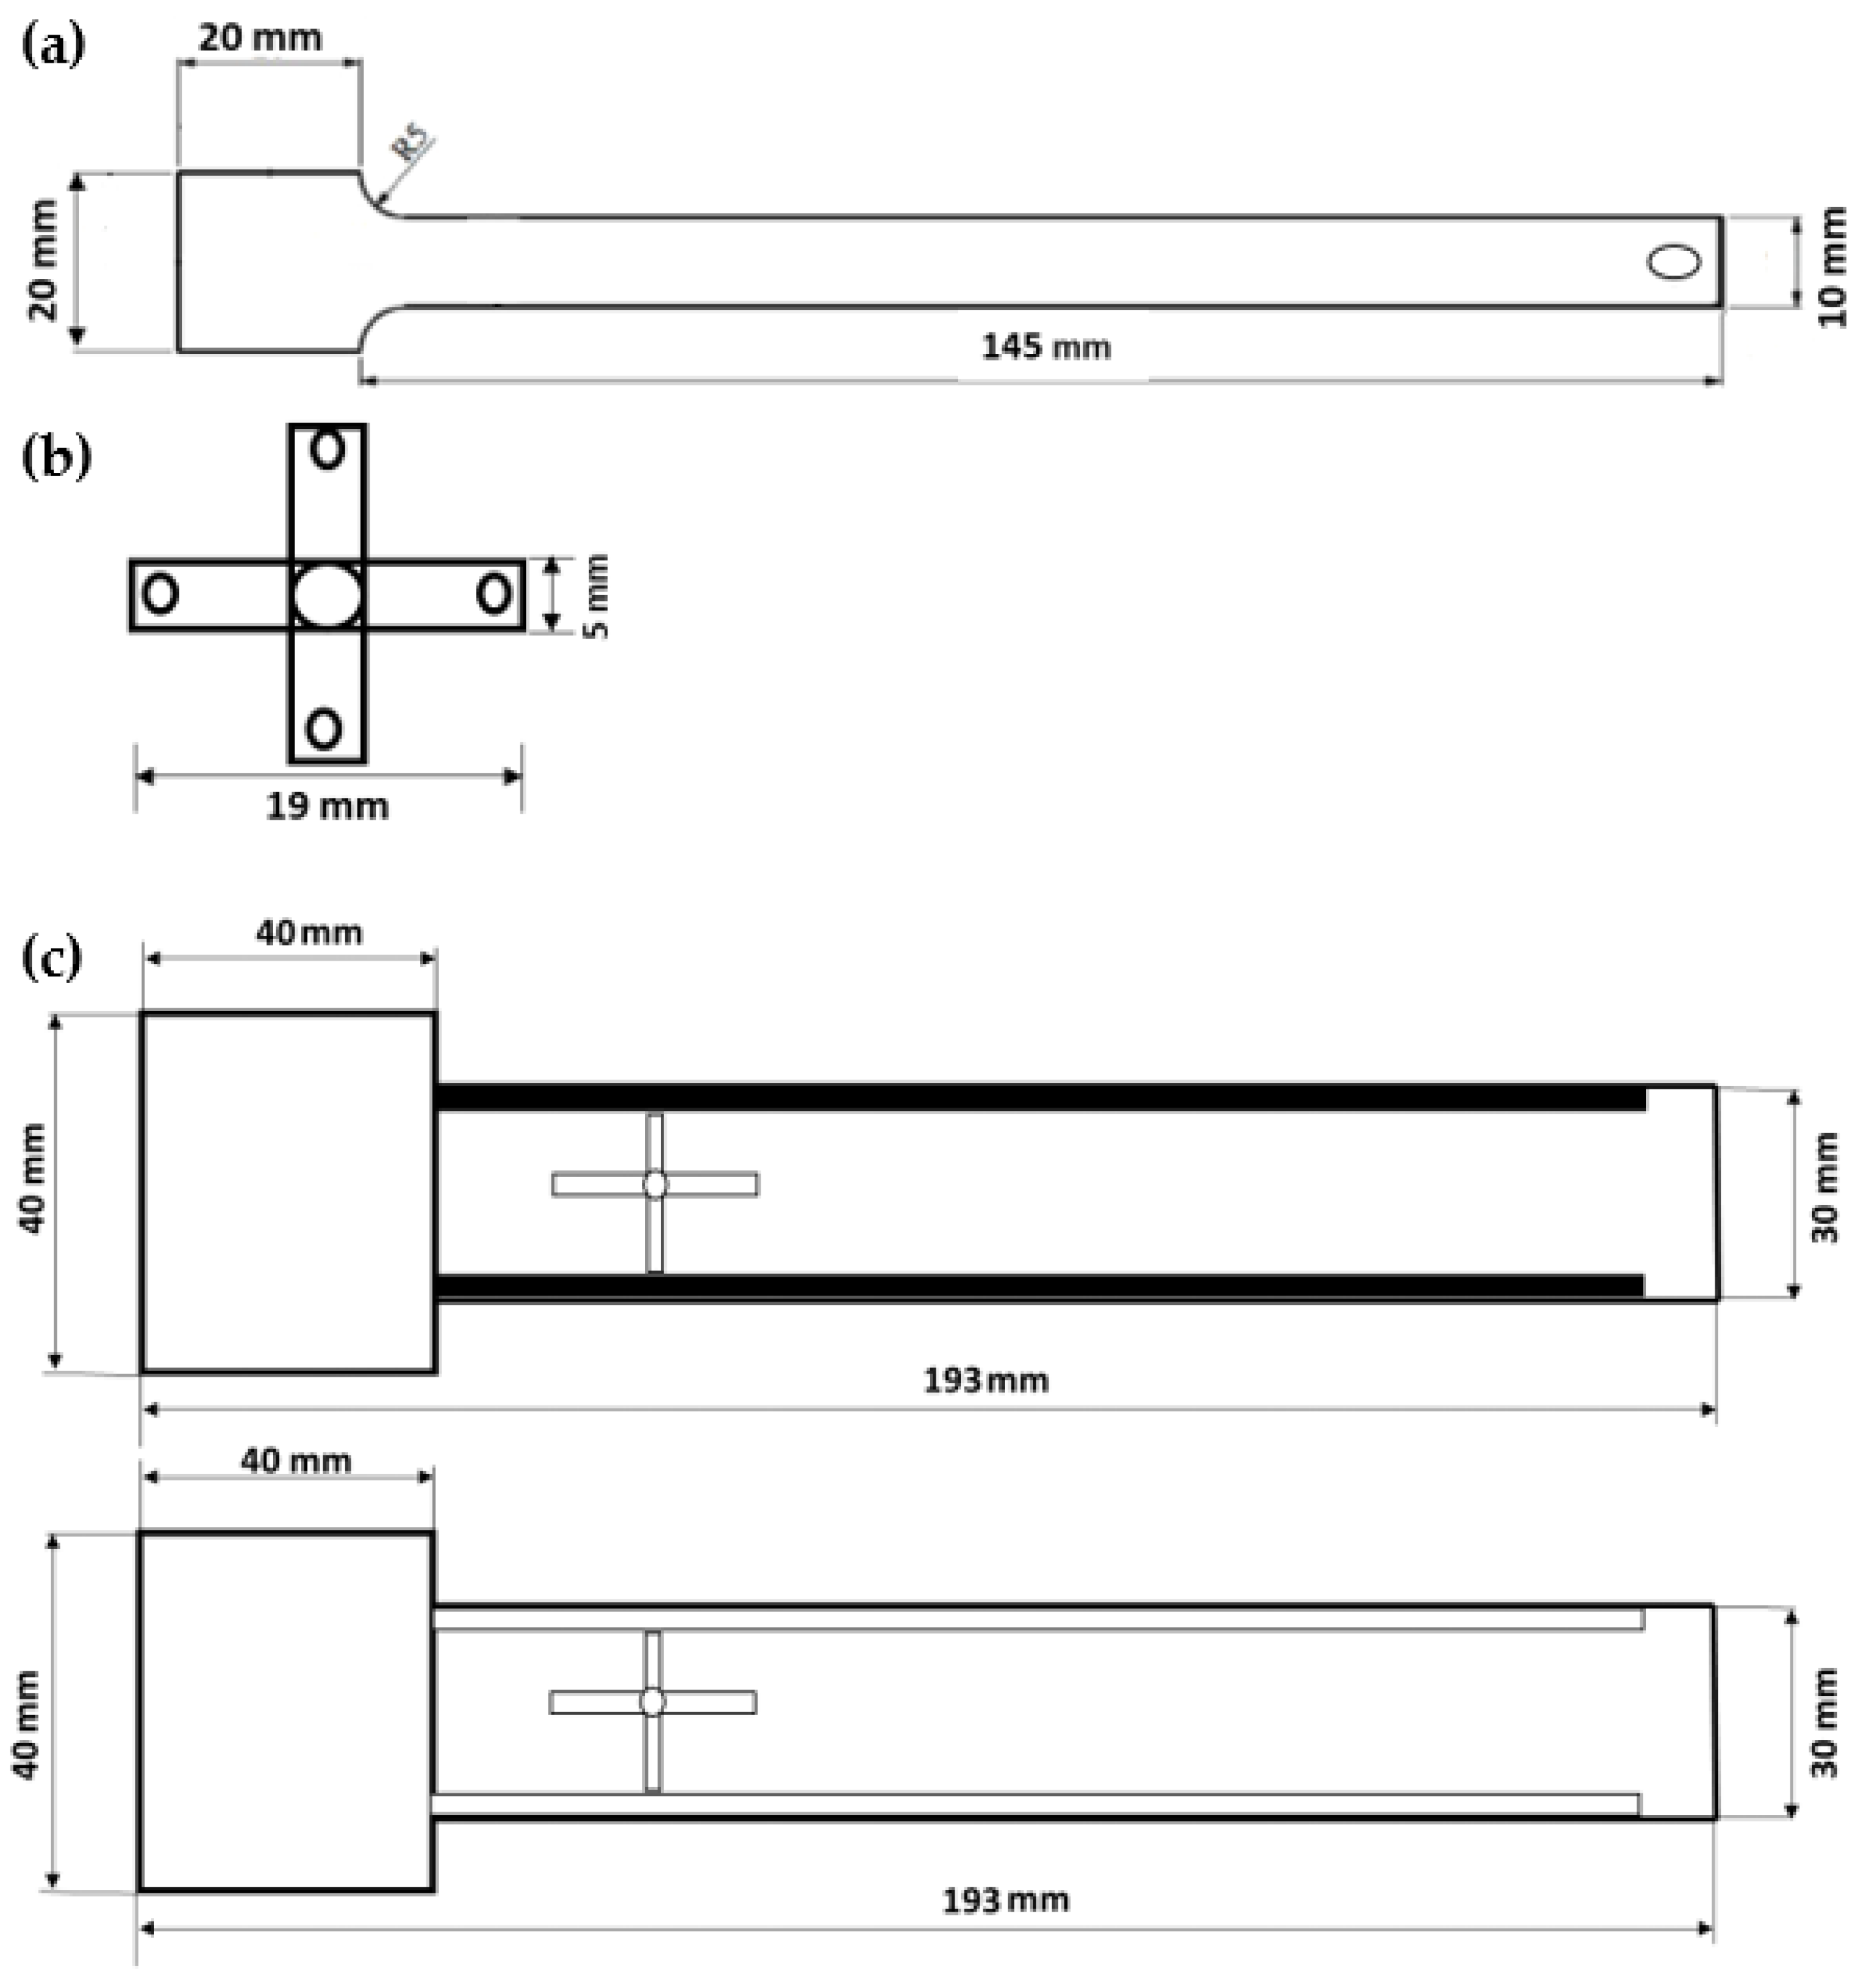
2.3.1. Simple Beam and Origami Beam

| Sample Number | Beam Thickness mm | Dimensions, mm (Length/Width) | Loads (g) Attached to the Beam, See Figure 6 |
|---|---|---|---|
| 1 | 0.5 | 145/10 | 1, 2, 3, 4, 5, 6, 7, 8, 9, 10 |
| 2 | 1.0 | 145/10 | 1, 3, 5, 10, 15, 25, 35, 45, 55, 75, 100 |
| 3 | 2.0 | 145/10 | 5, 10, 20, 30, 50, 70, 90, 110, 160, 210, 310, 410 |
| 4 | 3.0 | 145/10 | 5, 10, 20, 30, 50, 70, 90, 110, 160, 210, 310, 410 |

2.3.2. Origami Beam Embedded Inside Structure of the Beam
2.4. Experiment Setup and Procedure
- First, prepare the surface of the test piece by applying conditioner and neutralisers. A step-by-step procedure was developed. The process of bonding the strain gauge should be carried out precisely without errors. Notably, the surface area of the strain gauge should be stuck together by first cleaning the surface with sandpaper and then using conditioners to neutralise the free-end and the fixed support. Finally, to complete the surface preparation of the beam, a generous volume of the neutraliser is applied and wiped out with the cotton ball.
- To further explain the process for educational purposes, the bonding area must be cleared with alcohol/acetone. After clearing the surface, the necessary marks are placed on the bonding site, preferably with a fine graphite pencil, such that no residual deposition affect the measurement.
- Clamping of the beam: the flat portion of the ABS beam was clamped in the test machine.
- Place the strain gauges on the sample. One in free end and other one close to the fixed support, as shown in Figure 7.

- Connect the strain gauges to the DAQ-card and the Signal-Express software
- Calibrate the strain gauges with no load on the sample and set readings to zero.
- Measure the distance between free end of each sample and the nearest strain gauge.
- Apply loads progressively from 0 N to 4.02 N and measure the corresponding strain on each of the two strain gauges. Remove the masses in the reverse order in which they were added to produce a hysteresis plot.
- Placing the protractor parallel to the edge of the clamping machine (i.e., starting point of the beam). The fixing should be firm, so there is no unwanted movement of the protractor.
- Camera orientation: The camera was placed parallel to the longitudinal side of the beam such that the protractor could be easily seen. The distance between the camera and the beam was 30 cm.
2.4.1. ABS Simple Beam Behaviour in Normal Condition
2.4.2. Polymeric Origami Beam Behaviour
2.4.3. Beam Behaviour with the Origami Capsule Contained within It
3. Results and Discussion
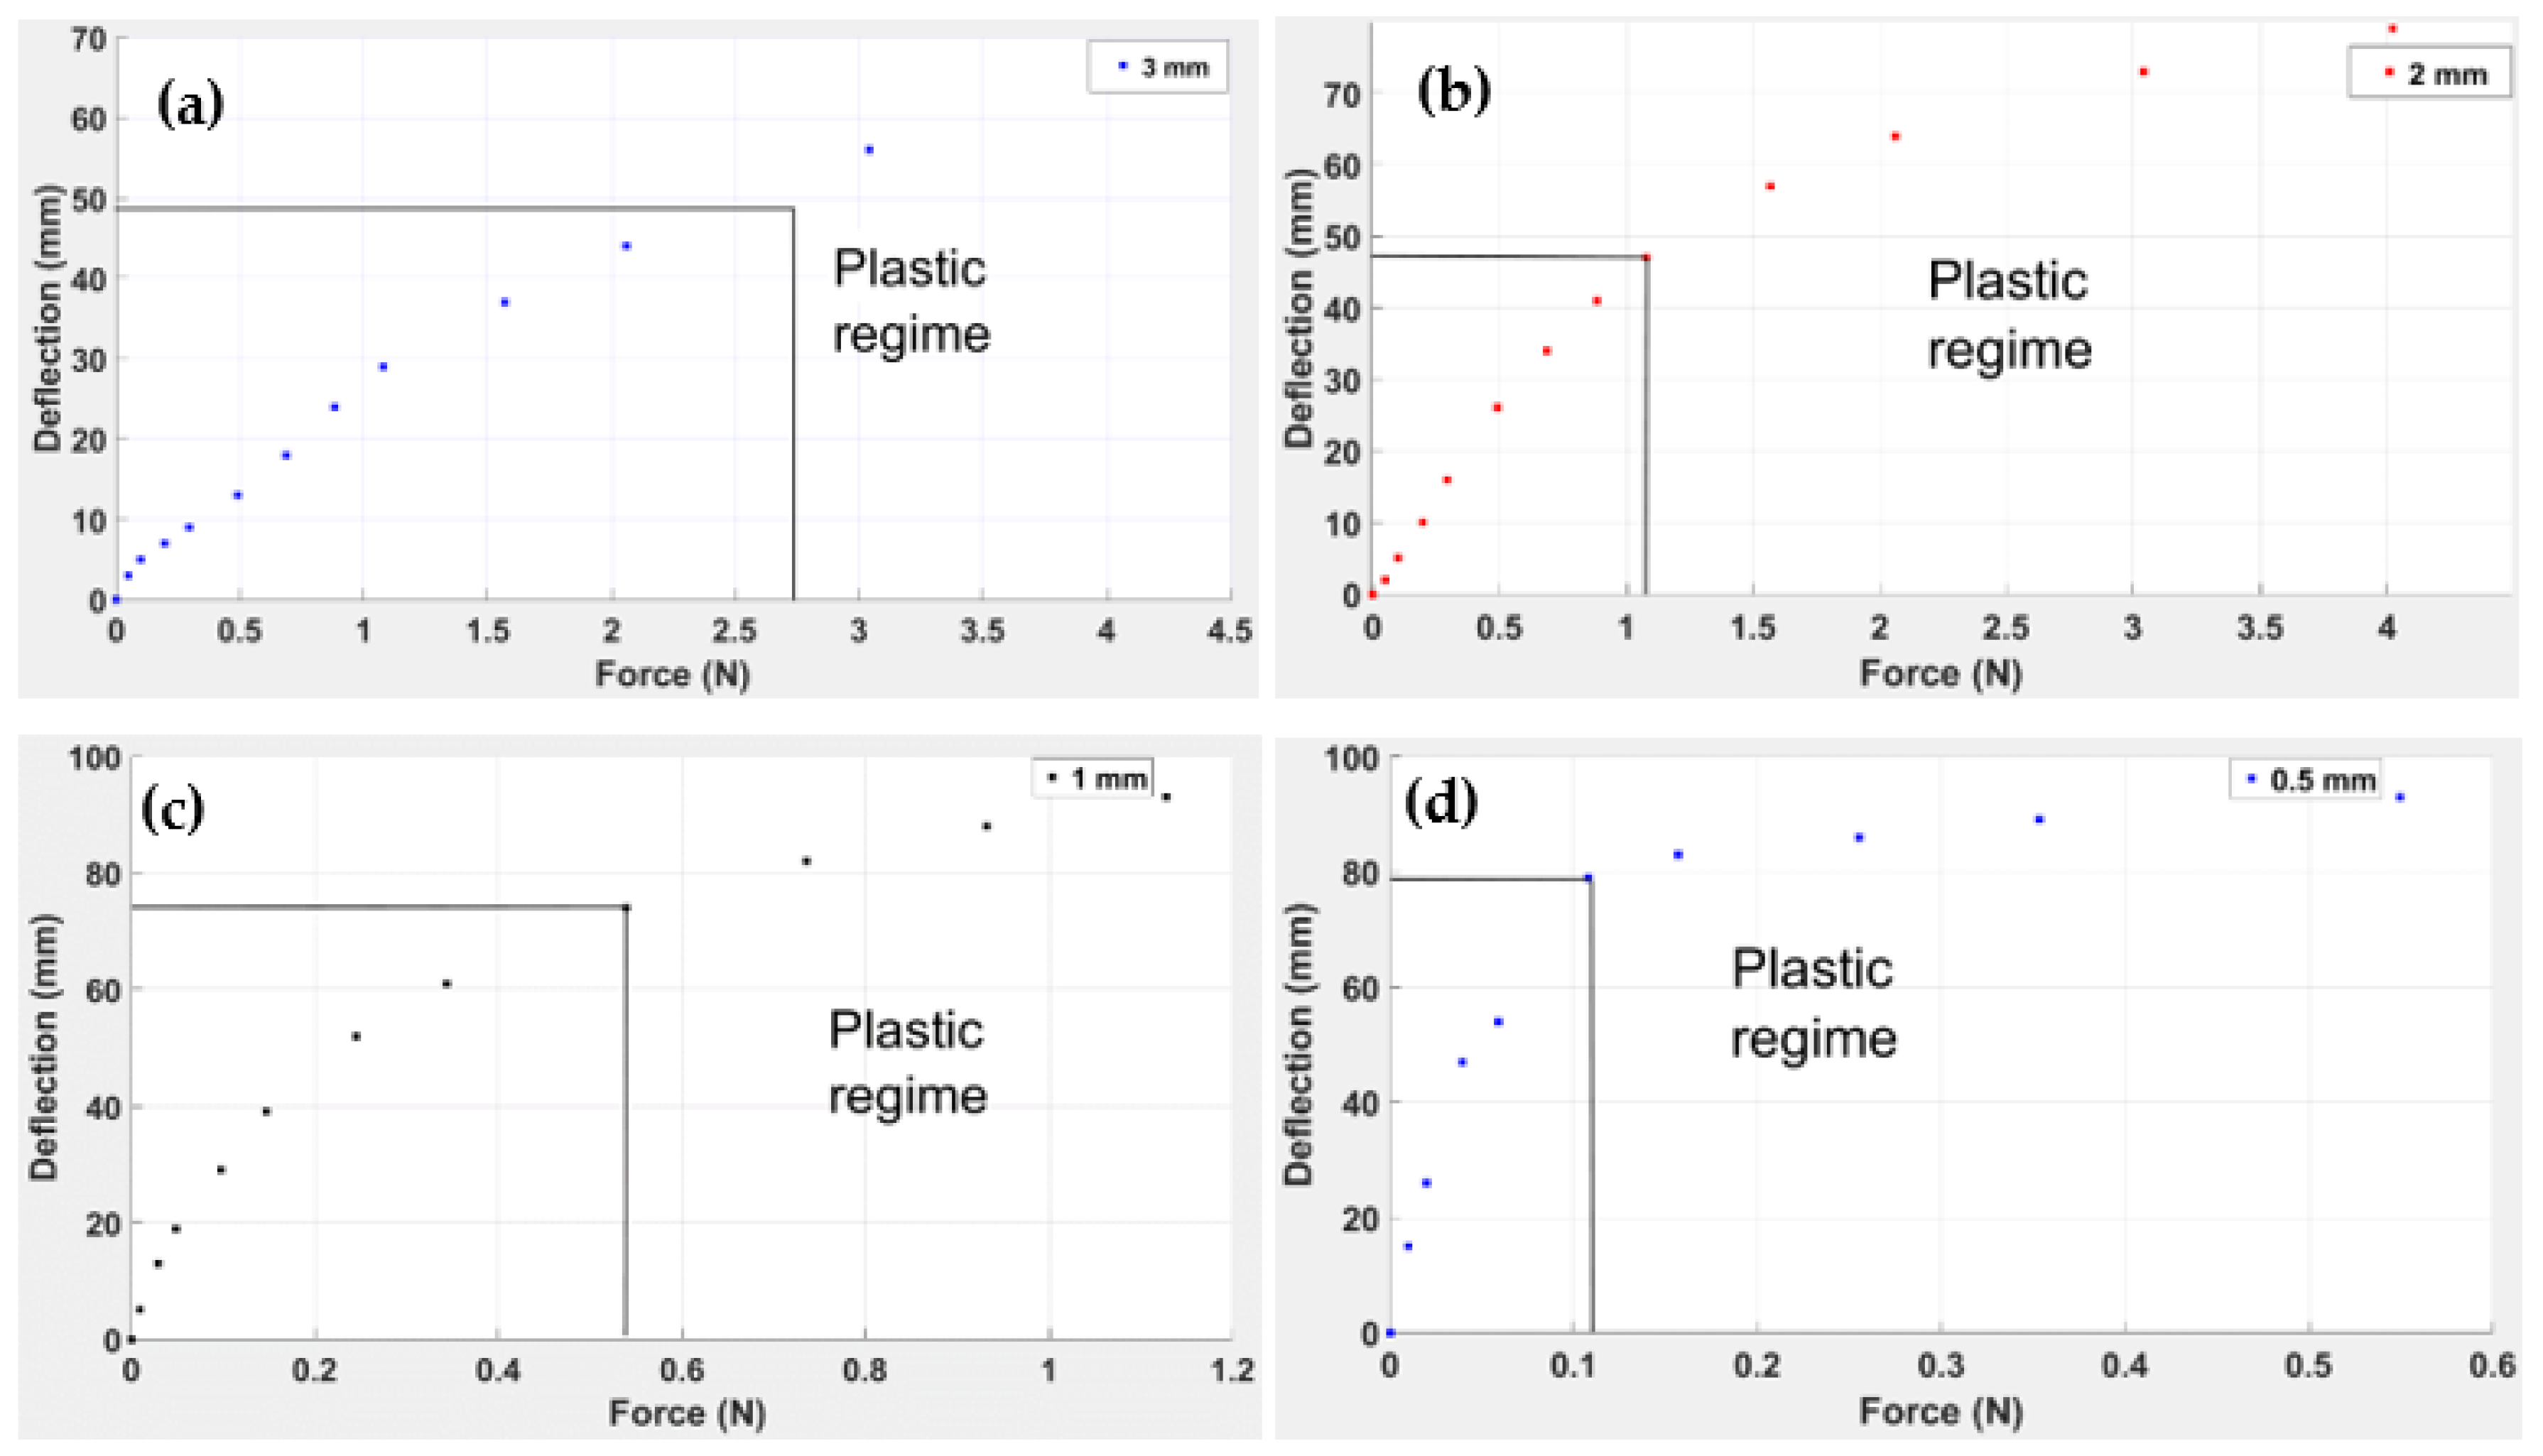
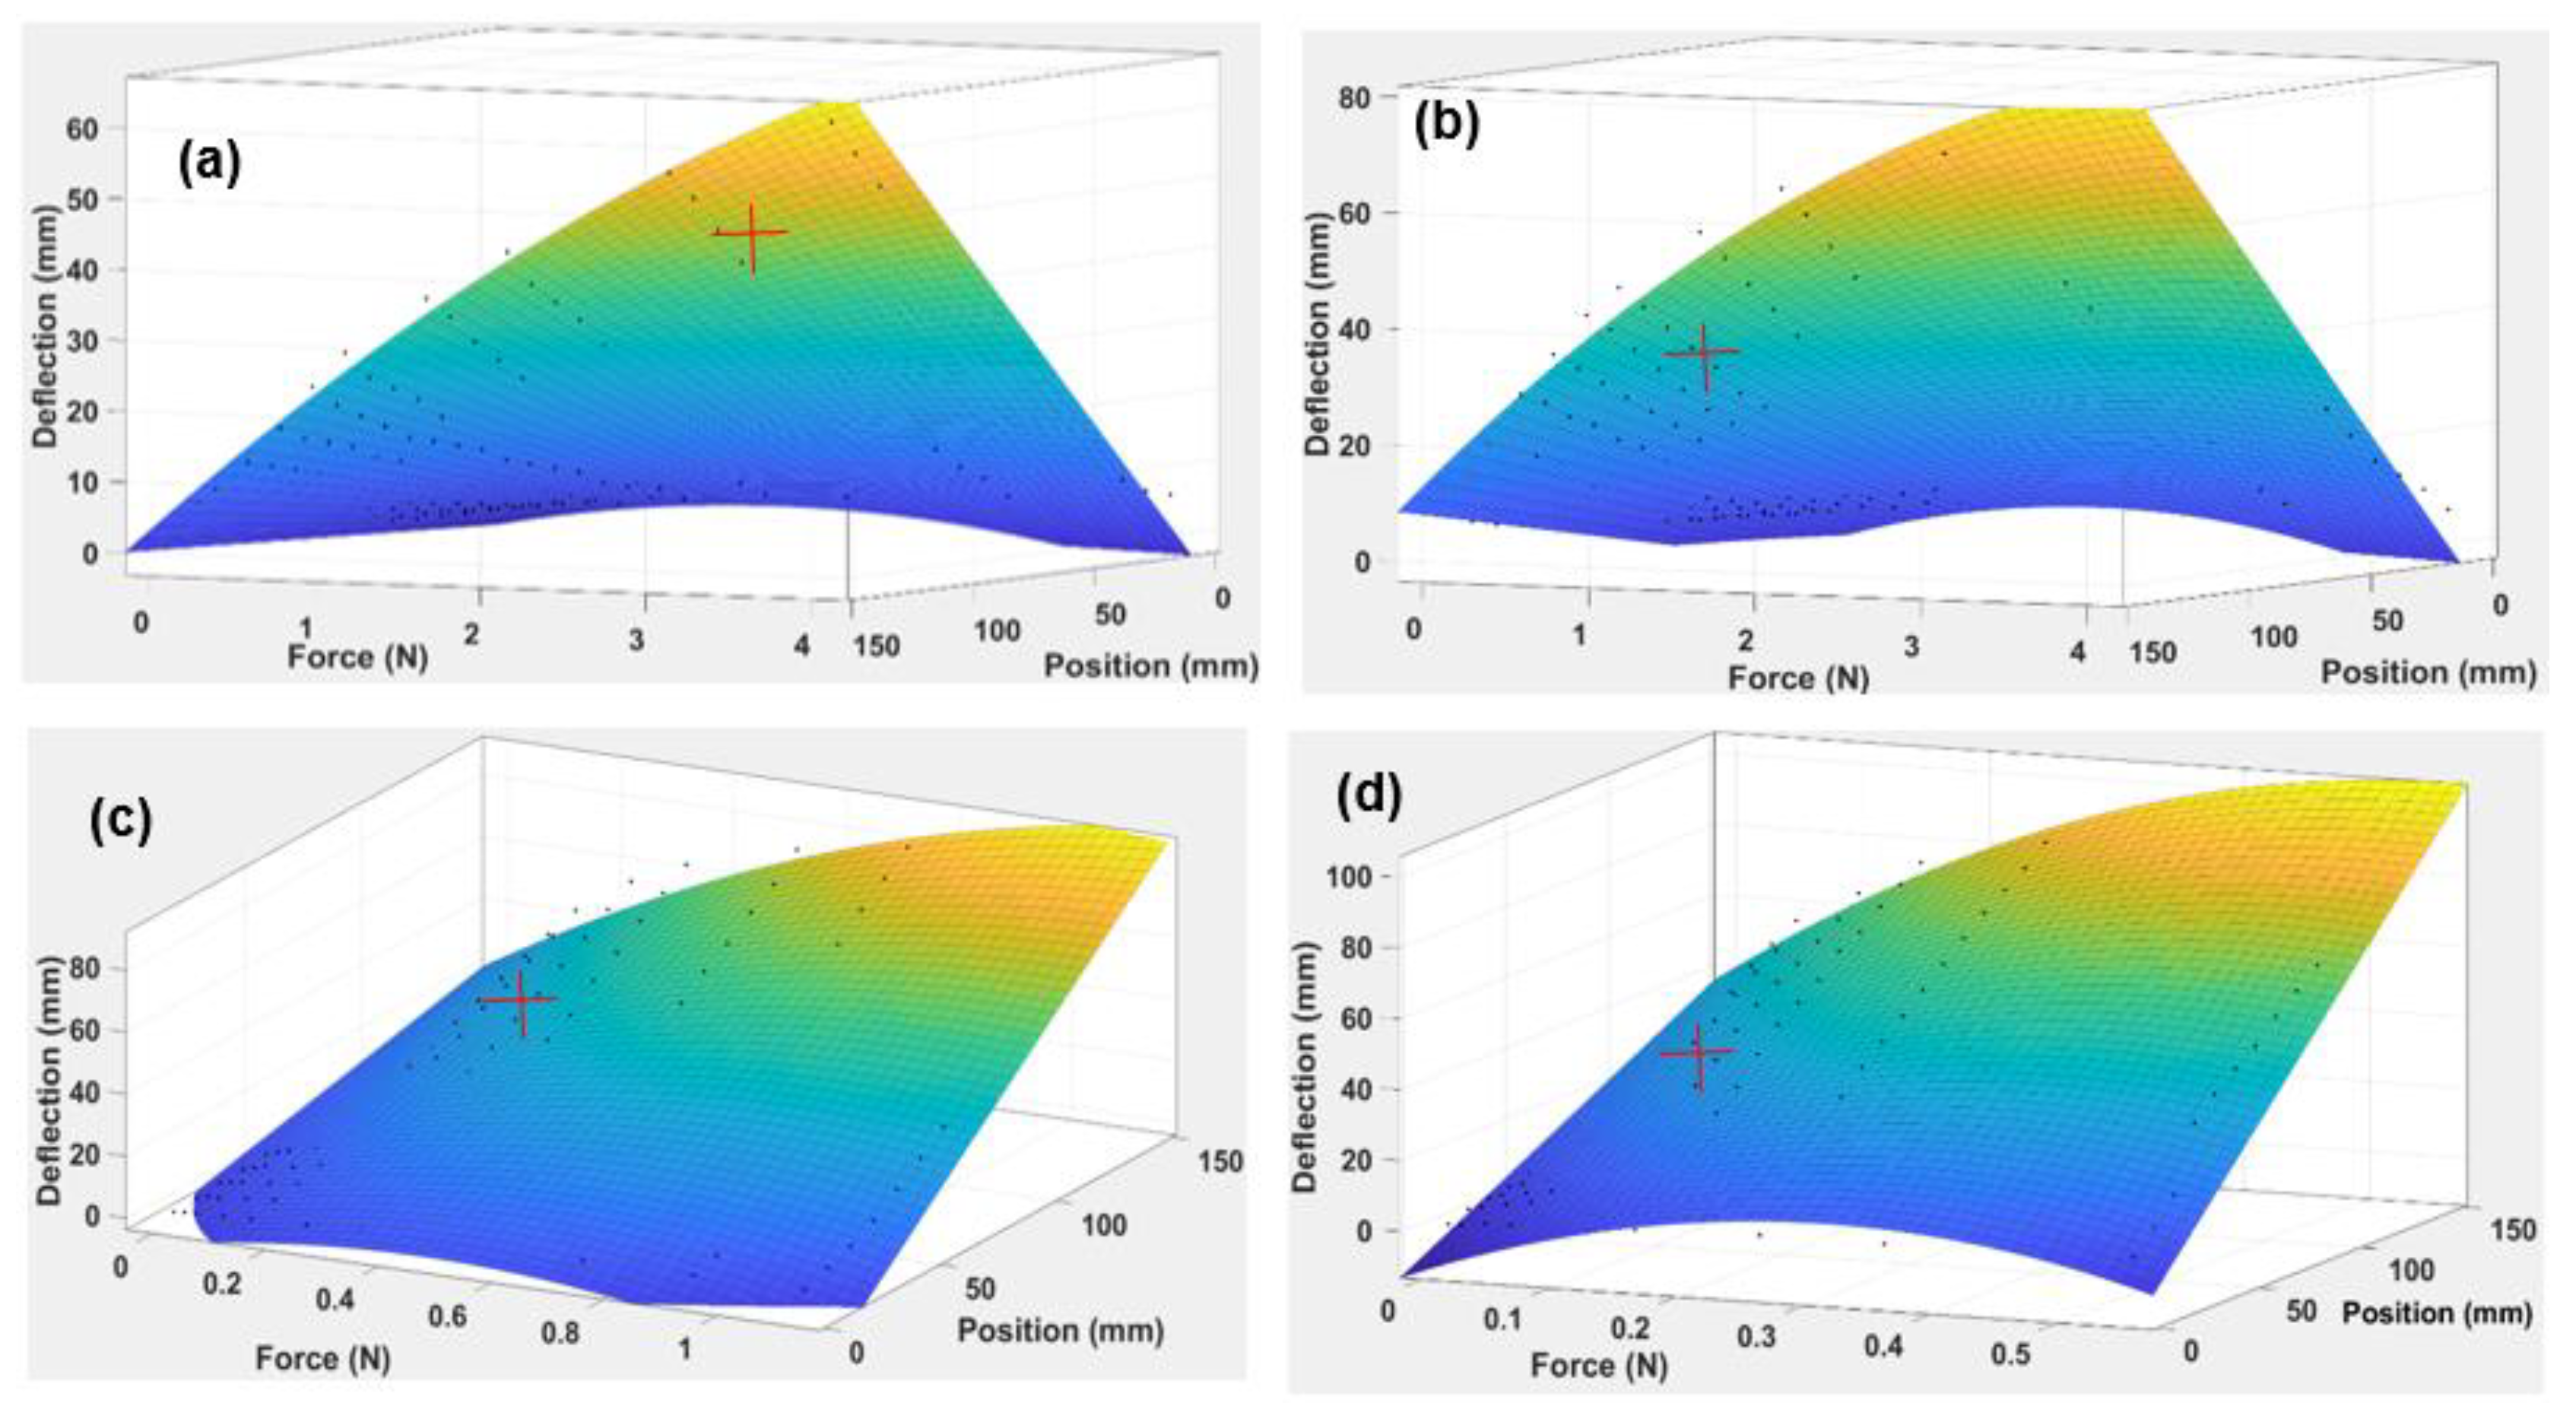
3.1. Results for ABS Simple Beam Behaviour
3.2. Results with the TPU Origami Capsule
3.2.1. Discussions of Simple ABS Beam and TPU Origami Capsule
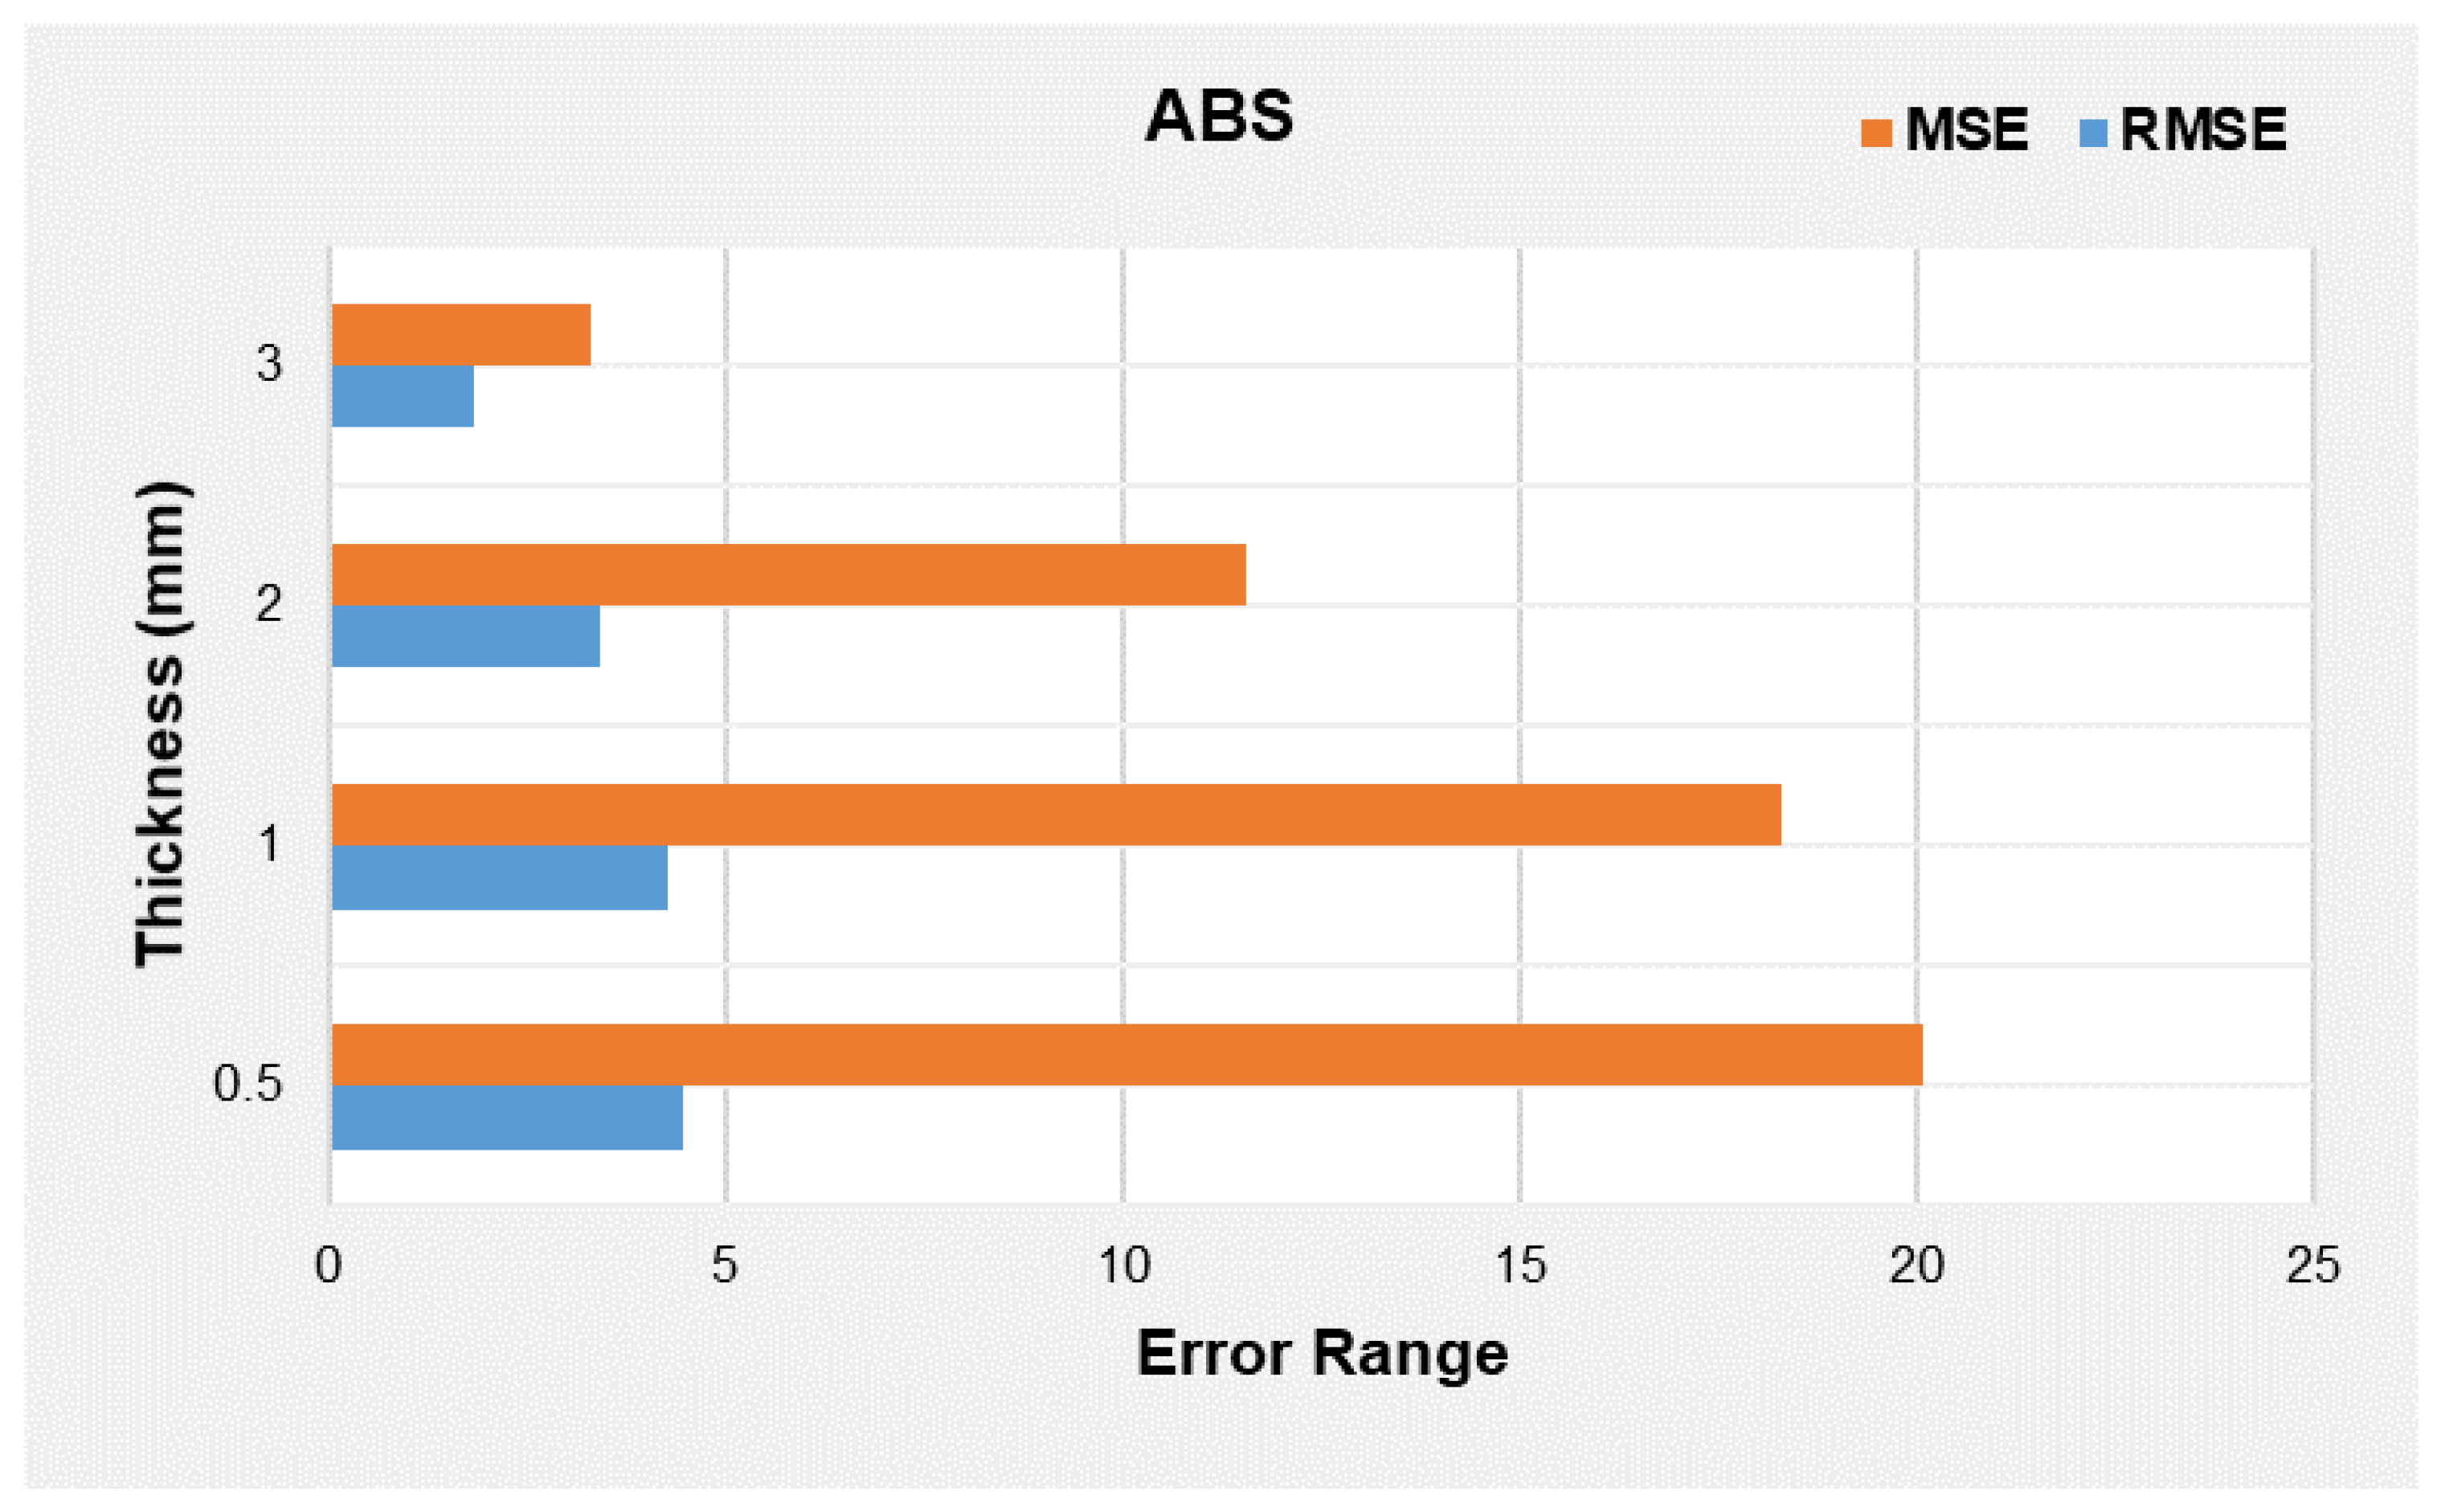
3.2.2. Discussion on Error in Predictions
3.3. Results for Origami “Cross” Module Embedded Structure
3.4. Results for a Comparative Study for Strain Energy Activation in an Embedded Structure Versus a Simple TPU Capsule
4. Conclusions
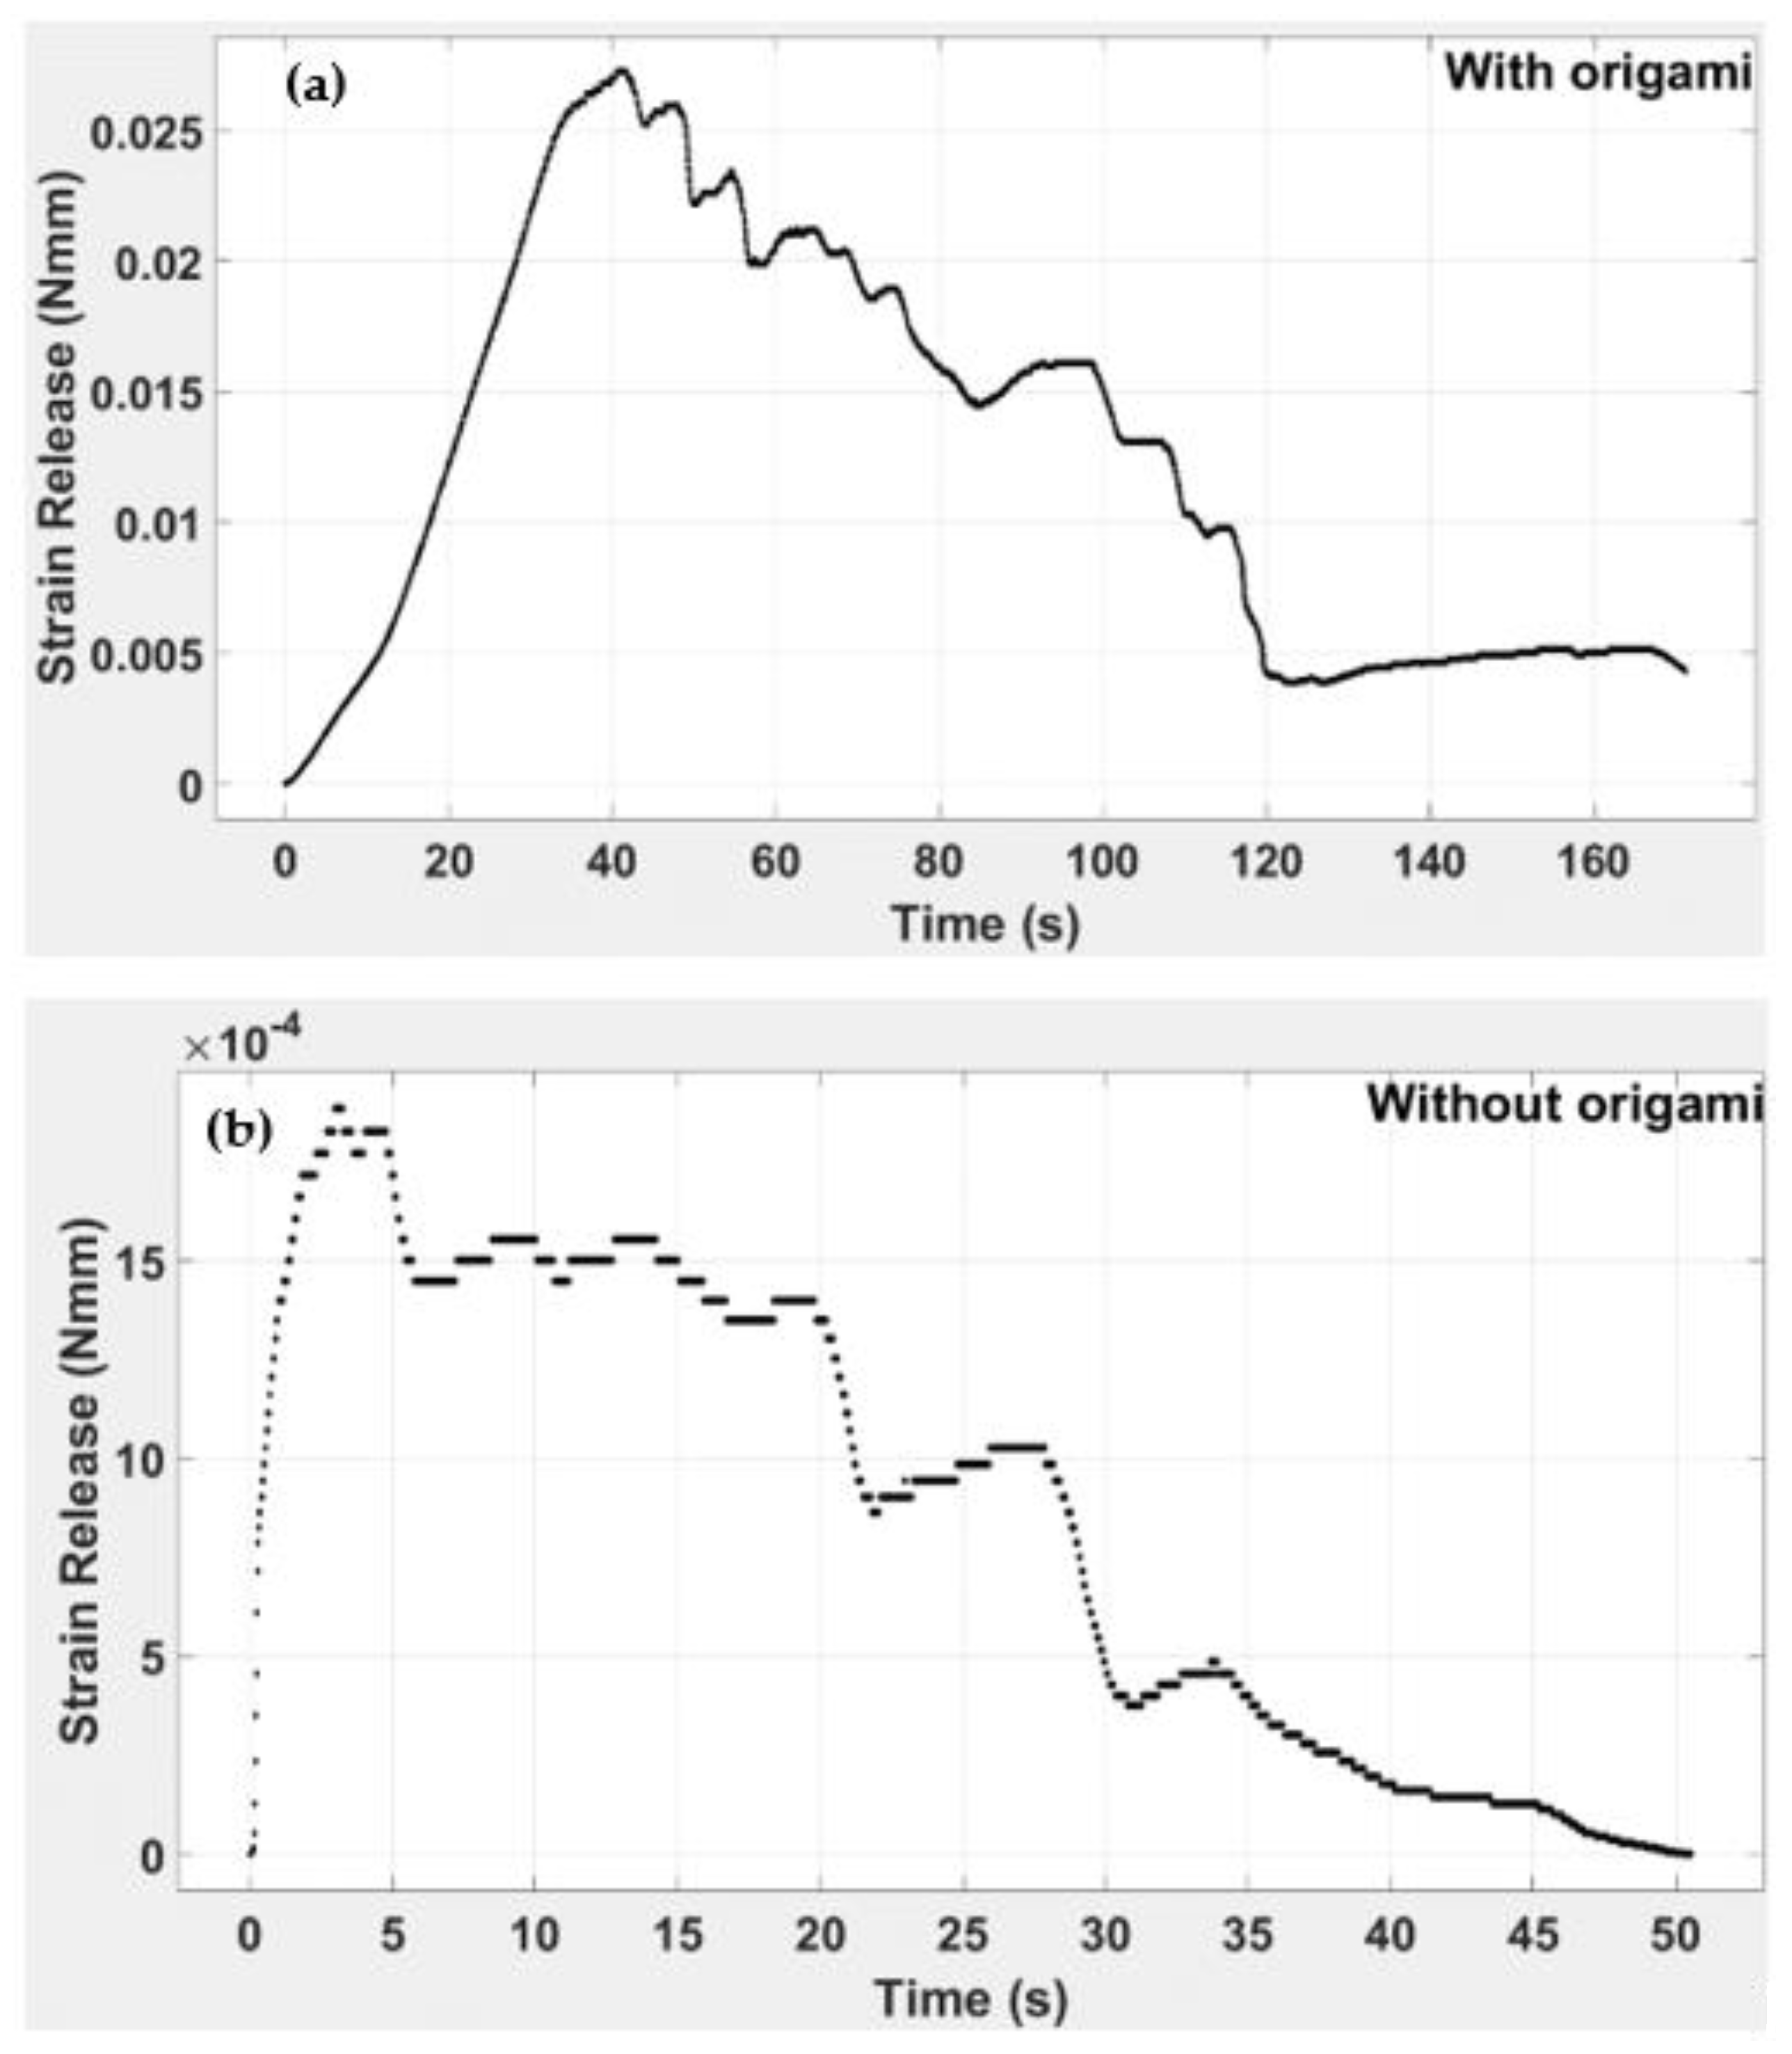
- The study calculated the strain via strain energy and strain release for beams with and without origami capsules.
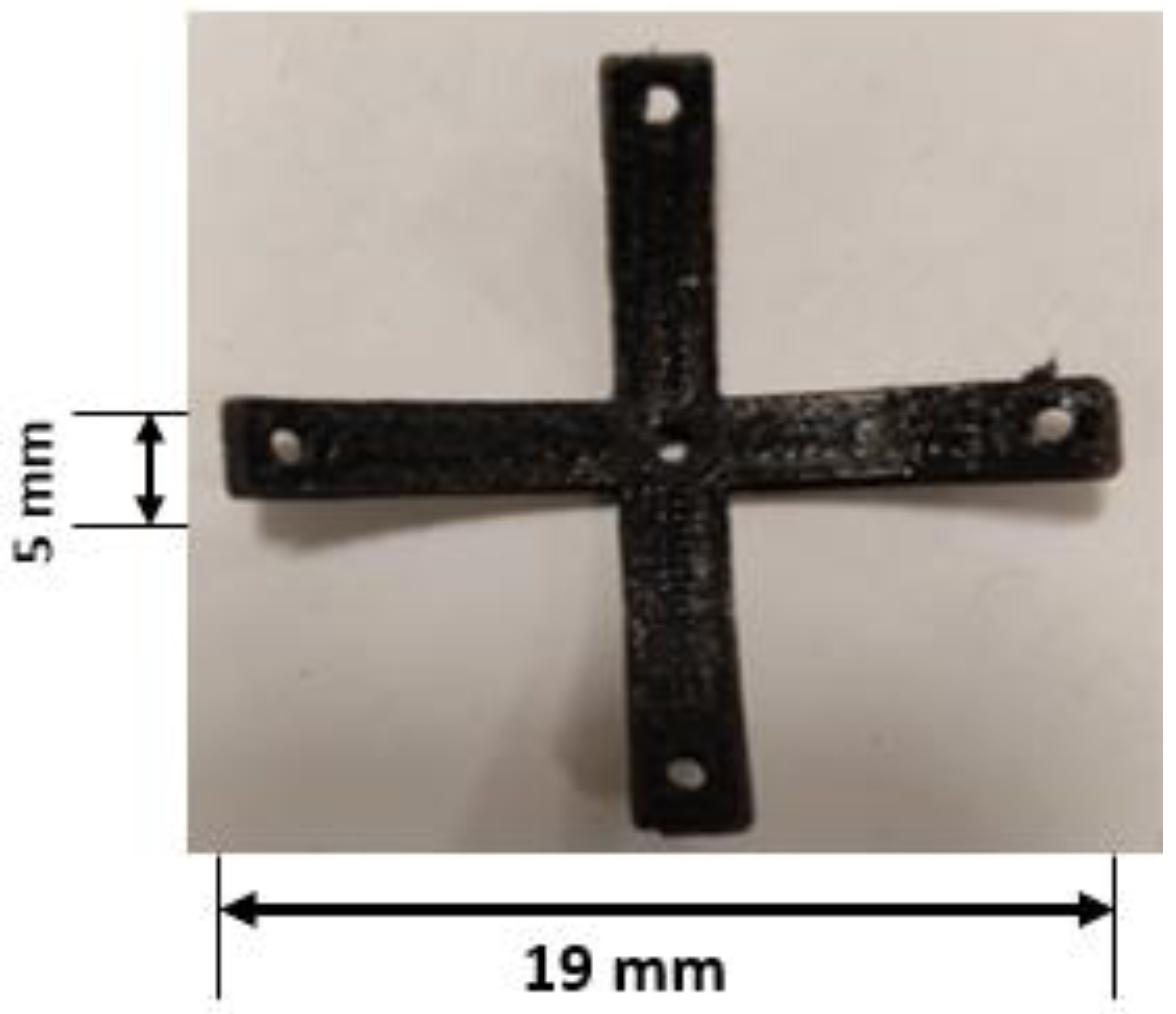
- Origami capsules were made in the shape of a cross with the four small beams comprising the arms, folded or elastically deformed and embedded in the main beam structure.
- Regarding crack propagation in the main beam, once the strain is released due to the crack, the small beams comprising the origami capsules open in the direction of the crack path and increase the crack resistance of the structure.
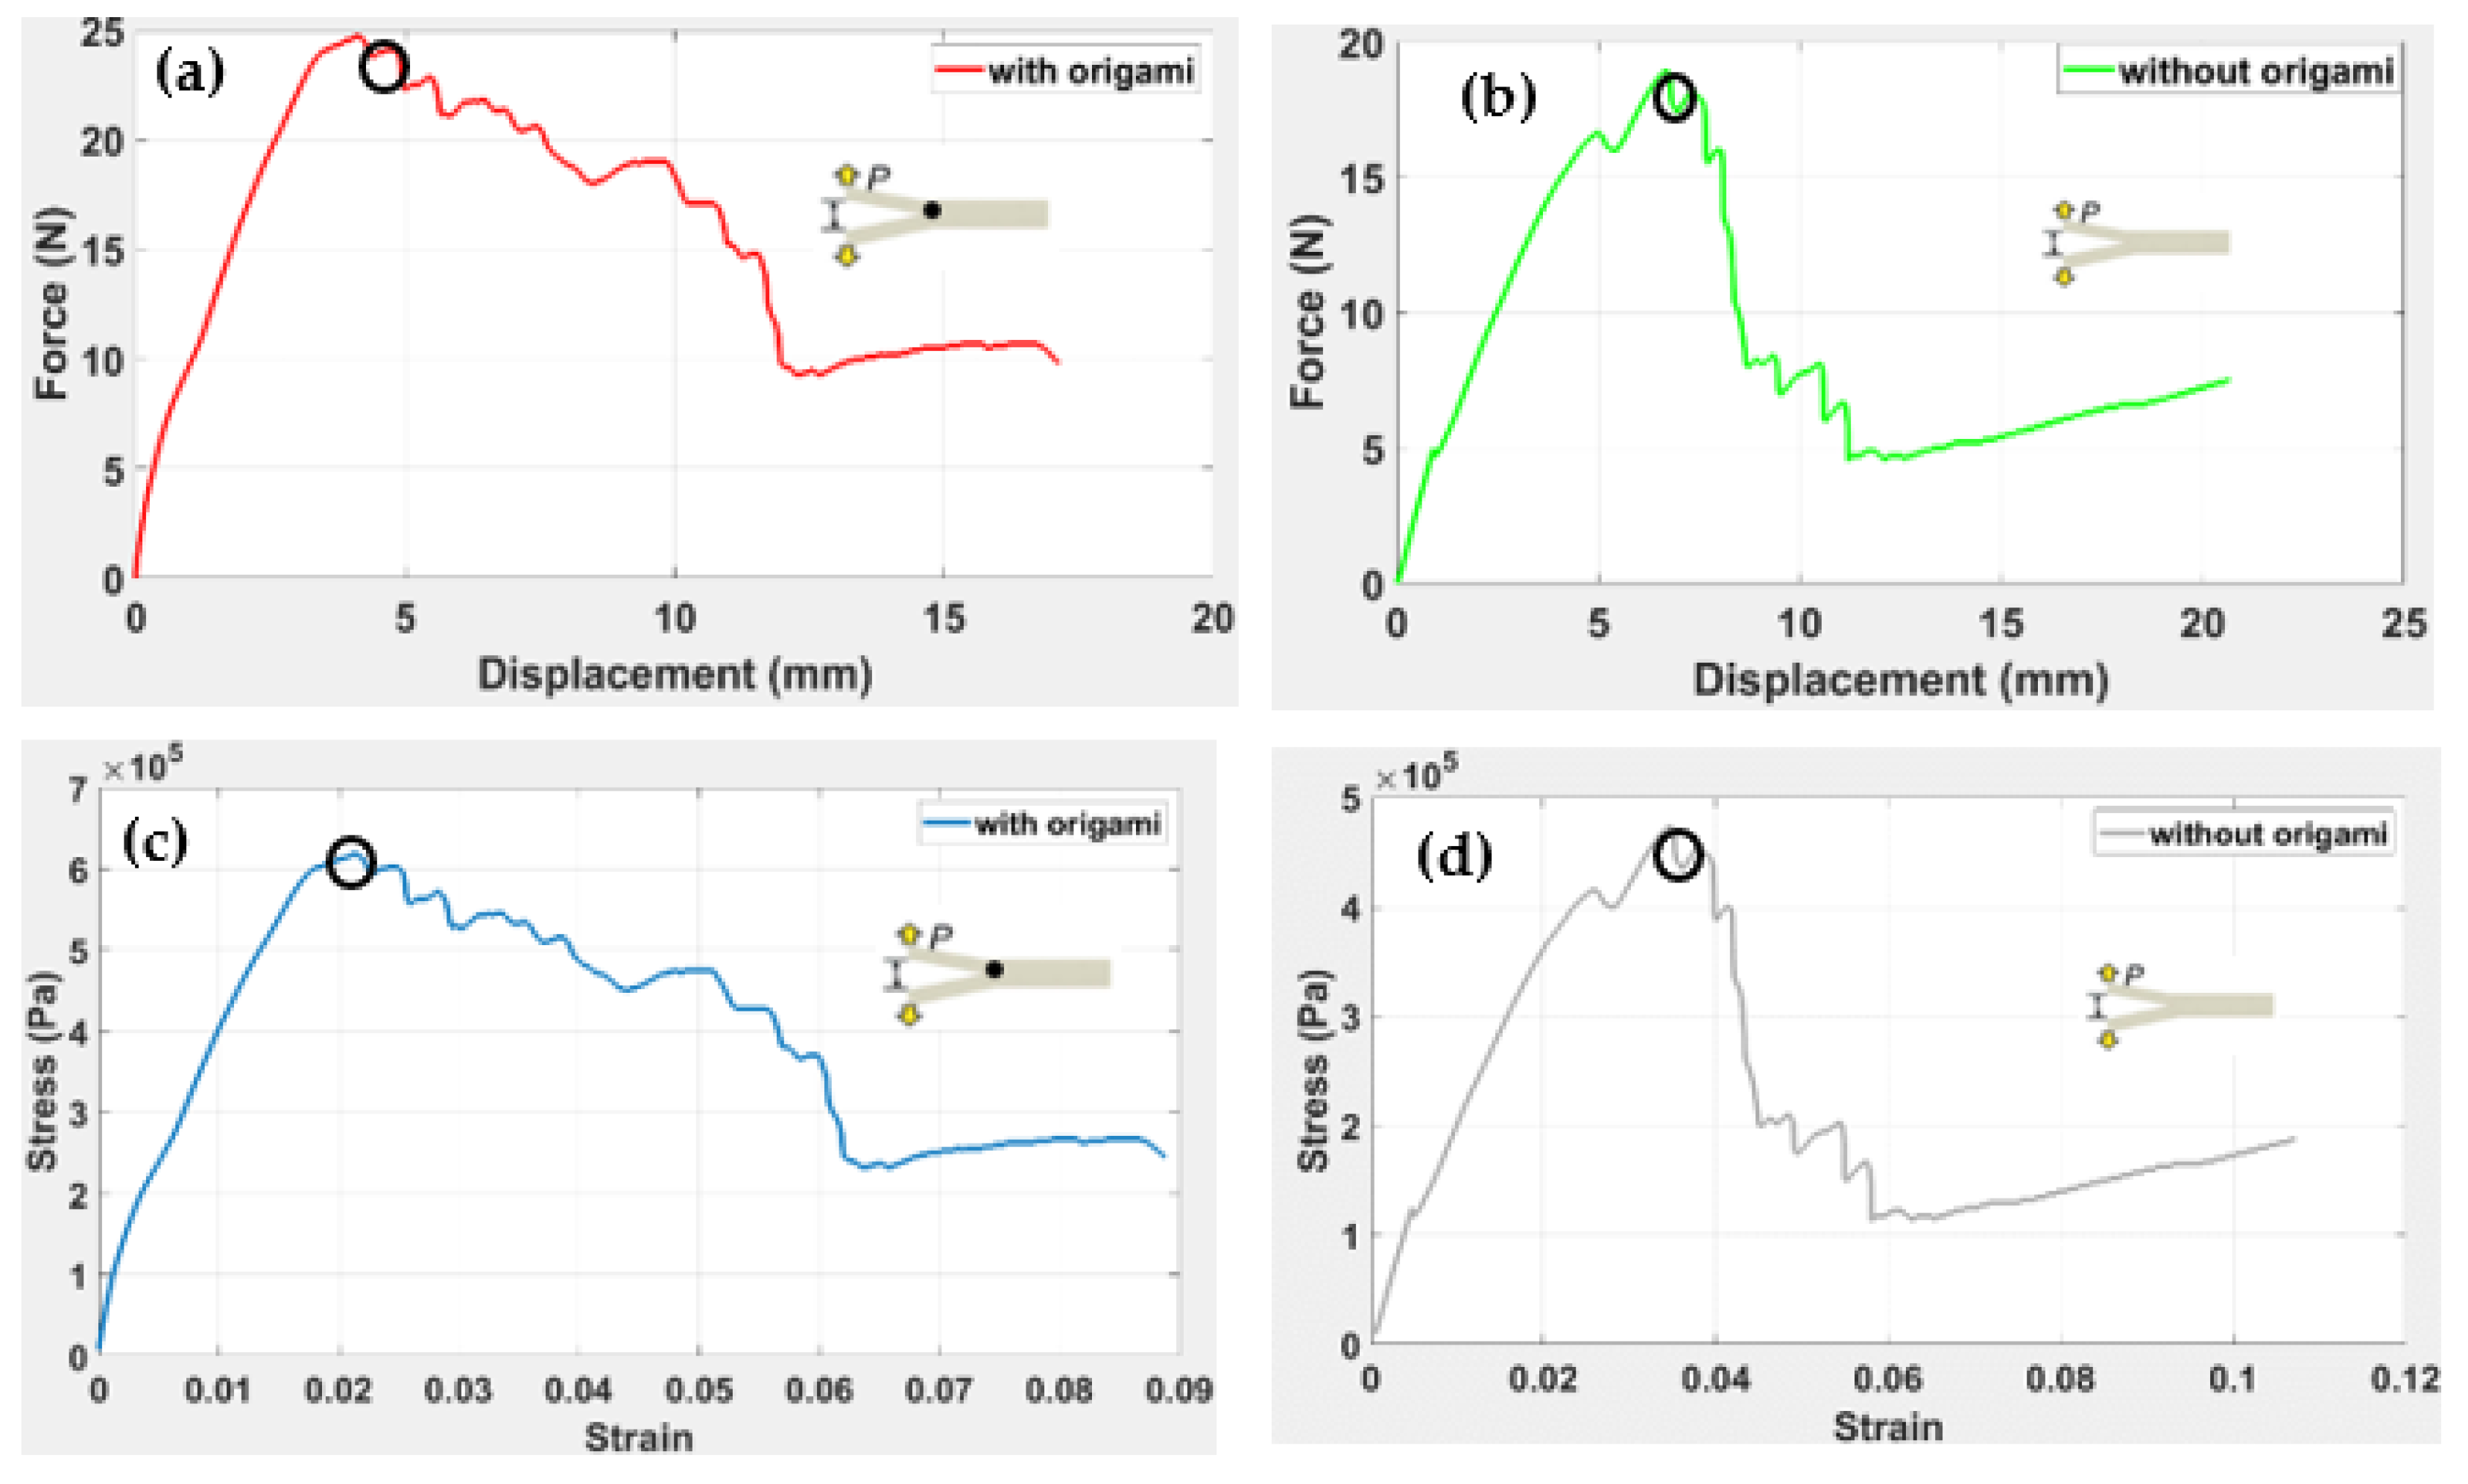
- When ABS transparent was used as the beam and TPU as the embedded capsule, it was found that the capsule worked as a self-healing mechanism, healing the crack before it occurred at a force of 24 N.
- From the results, it is evident that the properties of the TPU allowed deformation to remain flexible, which is why it was considered a suitable material for a novel self-healing mechanism that can be triggered by crack propagation due to strain release in a structure.
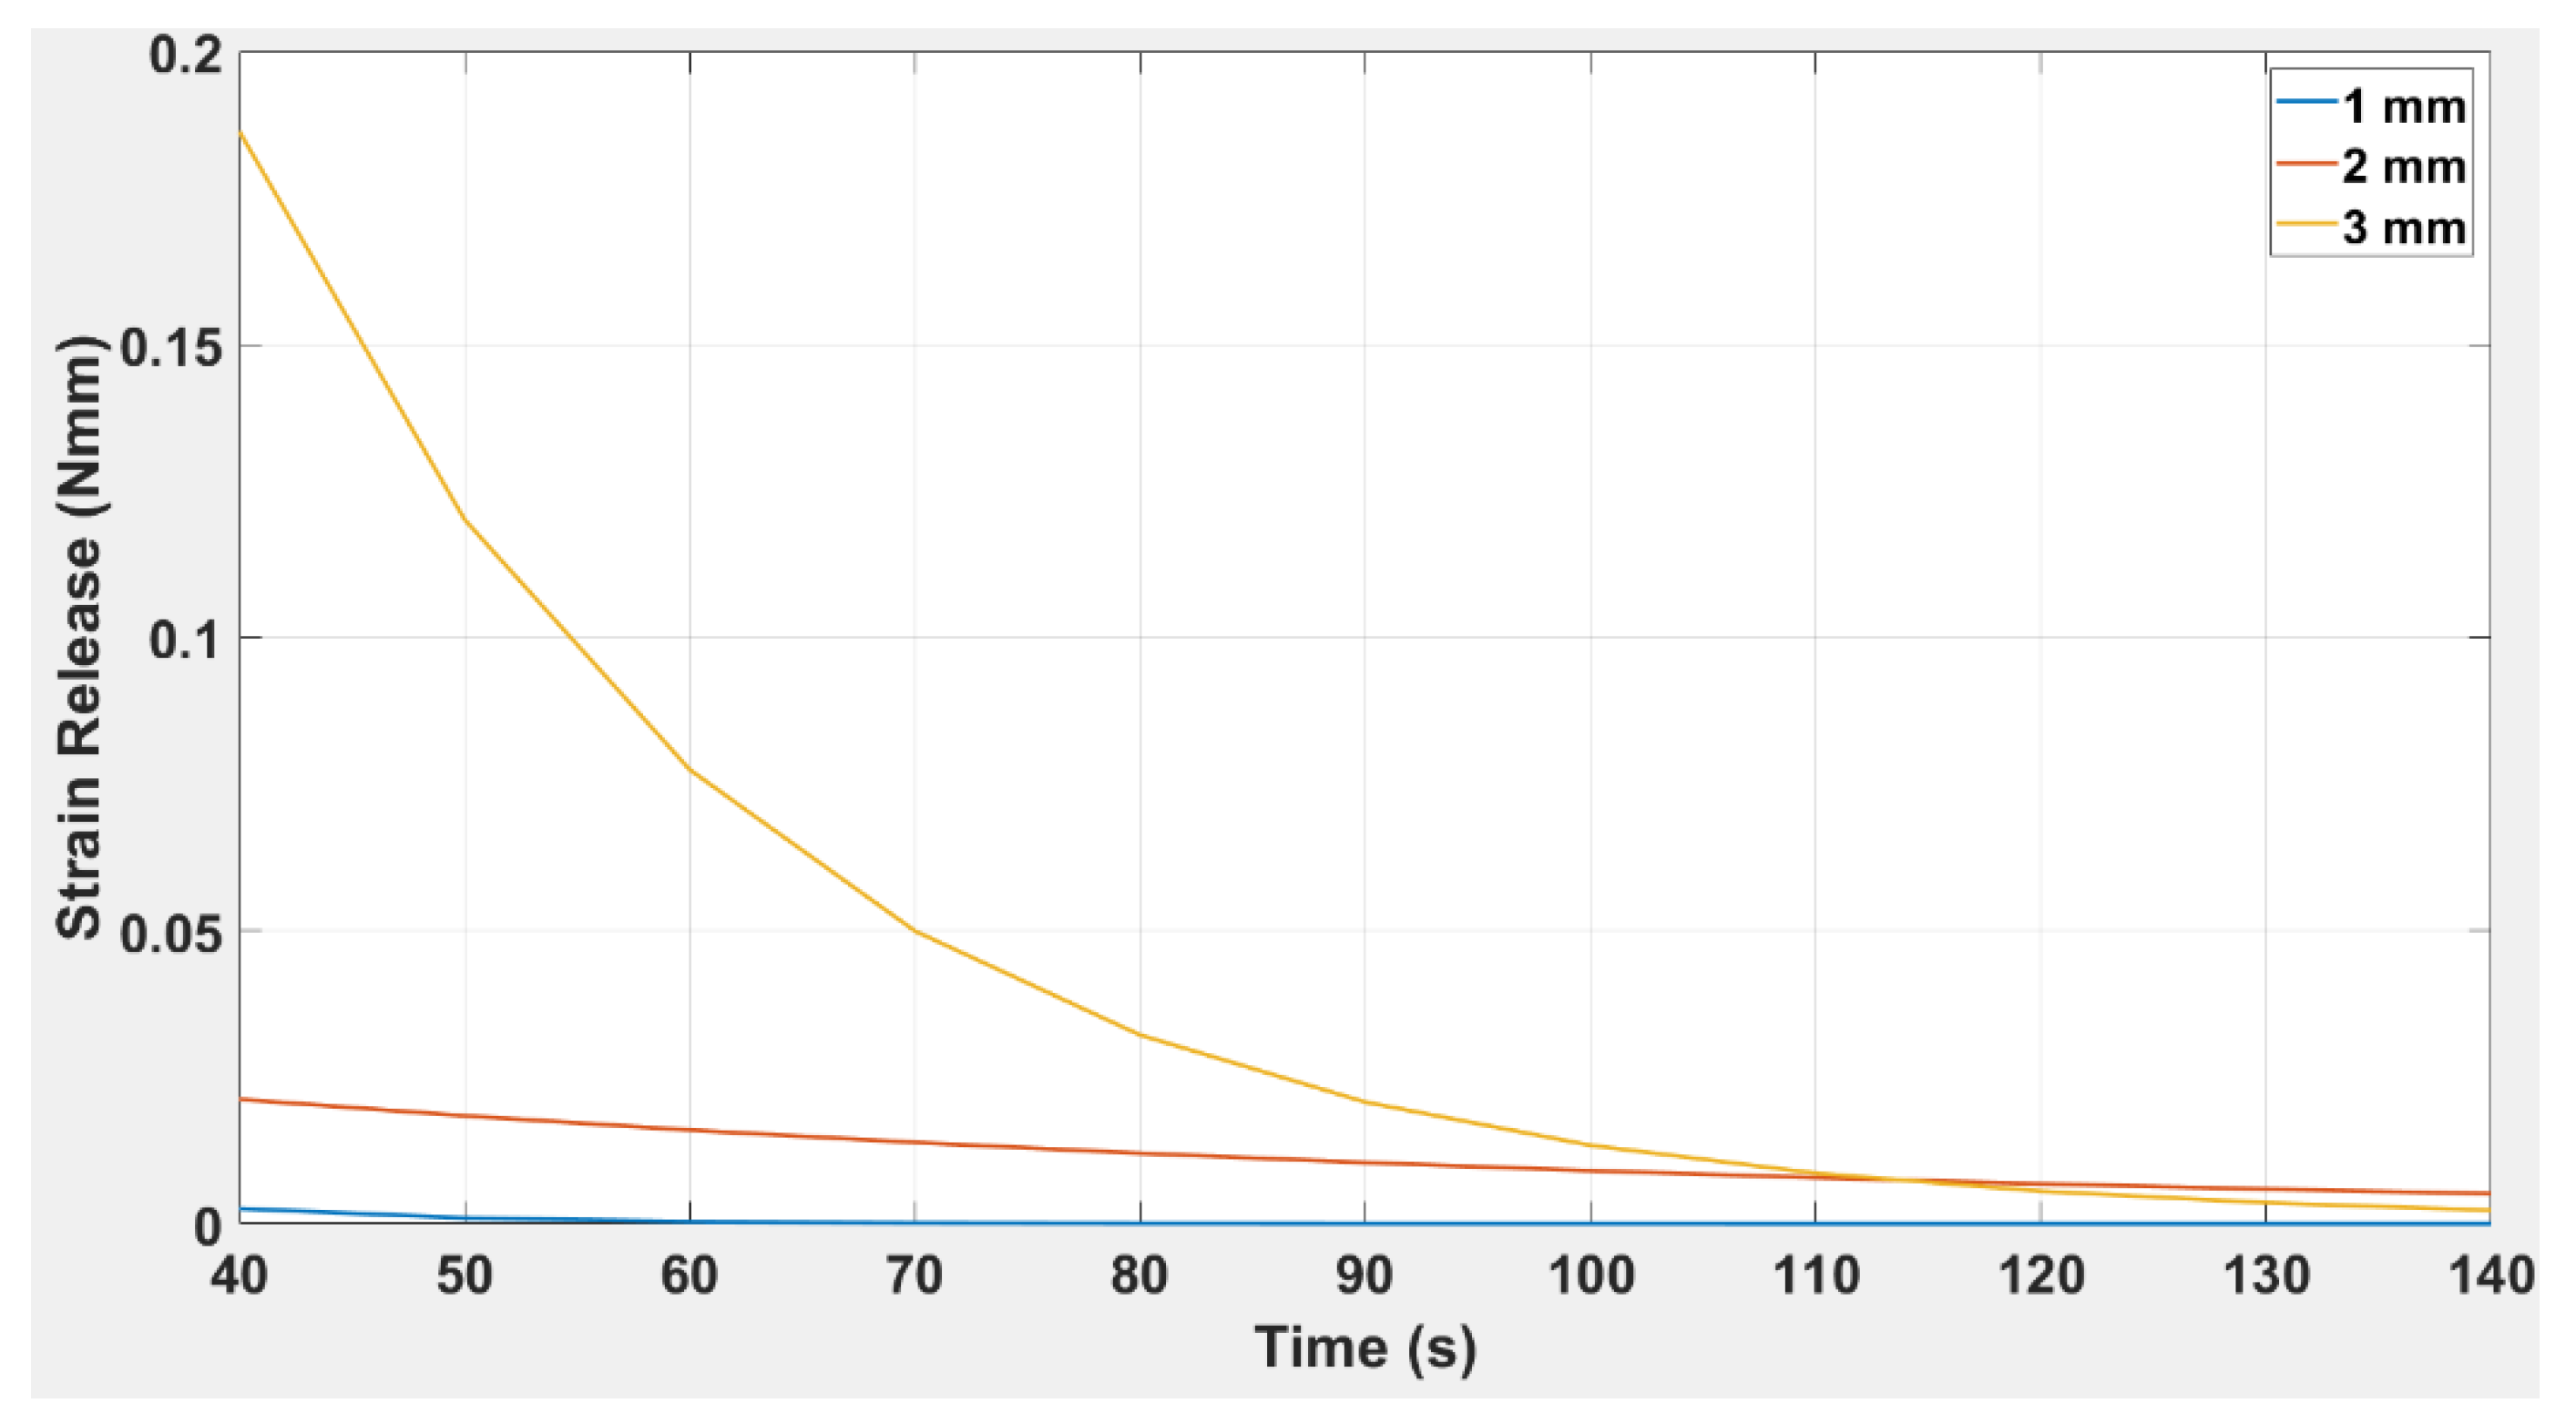
- Structural analysis has shown that the greater the beam thickness, the greater force required to attain the plastic region.
- The delamination tests showed the presence of a capsule suppressed the high compressive stresses induced by the bending moment in the vicinity of the crack tip and prevented the specimen from breaking and allowing crack propagation.
- The results show the potential of origami capsules as a novel self-healing mechanism to extend existing practice, which is primarily based on external healing agents.
Author Contributions
Funding
Institutional Review Board Statement
Informed Consent Statement
Data Availability Statement
Conflicts of Interest
References
- Khoo, Z.X.; Teoh, J.E.M.; Liu, Y.; Chua, C.K.; Yang, S.; An, J.; Leong, K.F.; Yeong, W.Y. 3D Printing of Smart Materials: A Review on Recent Progresses in 4D Printing. Virtual Phys. Prototyp. 2015, 10, 103–122. [Google Scholar] [CrossRef]
- Shafranek, R.T.; Millik, S.C.; Smith, P.T.; Lee, C.U.; Boydston, A.J.; Nelson, A. Stimuli-Responsive Materials in Additive Manufacturing. Prog. Polym. Sci. 2019, 93, 36–67. [Google Scholar] [CrossRef] [Green Version]
- Zhang, Z.; Demir, K.G.; Gu, G.X. Developments in 4D-Printing: A Review on Current Smart Materials, Technologies, and Applications. Int. J. Smart Nano Mater. 2019, 10, 205–224. [Google Scholar] [CrossRef] [Green Version]
- Garcia, S.J. Effect of Polymer Architecture on the Intrinsic Self-Healing Character of Polymers. Eur. Polym. J. 2014, 53, 118–125. [Google Scholar] [CrossRef] [Green Version]
- He, F.; Thakur, V.K.; Khan, M. Evolution and New Horizons in Modeling Crack Mechanics of 3D Printing Polymeric Structures. Mater. Today Chem. 2021, 20. [Google Scholar] [CrossRef]
- He, F.; Khan, M. Effects of Printing Parameters on the Fatigue Behaviour of 3d-Printed Abs under Dynamic Thermo-Mechanical Loads. Polymers 2021, 13, 2362. [Google Scholar] [CrossRef]
- MacDonald, E.; Wicker, R. Multiprocess 3D Printing for Increasing Component Functionality. Science 2016, 353, aaf2093. [Google Scholar] [CrossRef]
- Invernizzi, M.; Turri, S.; Levi, M.; Suriano, R. 4D Printed Thermally Activated Self-Healing and Shape Memory Polycaprolactone-Based Polymers. Eur. Polym. J. 2018, 101, 169–176. [Google Scholar] [CrossRef]
- Belowich, M.E.; Stoddart, J.F. Dynamic Imine Chemistry. Chem. Soc. Rev. 2012, 41, 2003–2024. [Google Scholar] [CrossRef]
- Willocq, B.; Odent, J.; Dubois, P.; Raquez, J.M. Advances in Intrinsic Self-Healing Polyurethanes and Related Composites. RSC Adv. 2020, 10, 13766–13782. [Google Scholar] [CrossRef] [PubMed]
- Fleet, T.; Kamei, K.; He, F.; Khan, M.A.; Khan, K.A.; Starr, A. A Machine Learning Approach to Model Interdependencies between Dynamic Response and Crack Propagation. Sensors 2020, 20, 6847. [Google Scholar] [CrossRef]
- Zhang, Z.P.; Rong, M.Z.; Zhang, M.Q. Mechanically Robust, Self-Healable, and Highly Stretchable “Living” Crosslinked Polyurethane Based on a Reversible C–C Bond. Adv. Funct. Mater. 2018, 28, 1706050. [Google Scholar] [CrossRef]
- Almutairi, M.D.; Aria, A.I.; Thakur, V.K.; Khan, M.A. Self-Healing Mechanisms for 3D-Printed Polymeric Structures: From Lab to Reality. Polymers 2020, 12, 1534. [Google Scholar] [CrossRef] [PubMed]
- Kamei, K.; Khan, M.A. Investigating the Structural Dynamics and Crack Propagation Behavior under Uniform and Non-Uniform Temperature Conditions. Materials 2021, 14, 7071. [Google Scholar] [CrossRef] [PubMed]
- Gattas, J.M.; You, Z. The Behaviour of Curved-Crease Foldcores under Low-Velocity Impact Loads. Int. J. Solids Struct. 2015, 53, 80–91. [Google Scholar] [CrossRef]
- He, F.; Khan, M.; Aldosari, S. Interdependencies between Dynamic Response and Crack Growth in a 3D-Printed Acrylonitrile Butadiene Styrene (ABS) Cantilever Beam under Thermo-Mechanical Loads. Polymers 2022, 14, 982. [Google Scholar] [CrossRef] [PubMed]
- Li, Y.; You, Z. Open-Section Origami Beams for Energy Absorption. Int. J. Mech. Sci. 2019, 157–158, 741–757. [Google Scholar] [CrossRef]
- Richeton, J.; Ahzi, S.; Vecchio, K.S.; Jiang, F.C.; Adharapurapu, R.R. Influence of Temperature and Strain Rate on the Mechanical Behavior of Three Amorphous Polymers: Characterization and Modeling of the Compressive Yield Stress. Int. J. Solids Struct. 2006, 43, 2318–2335. [Google Scholar] [CrossRef] [Green Version]
- Alshammari, Y.L.A.; He, F.; Khan, M.A. Modelling and Investigation of Crack Growth for 3d-Printed Acrylonitrile Butadiene Styrene (Abs) with Various Printing Parameters and Ambient Temperatures. Polymers 2021, 13, 3737. [Google Scholar] [CrossRef] [PubMed]
- Yuan, L.; Dai, H.; Song, J.; Ma, J.; Chen, Y. The Behavior of a Functionally Graded Origami Structure Subjected to Quasi-Static Compression. Mater. Des. 2020, 189, 108494. [Google Scholar] [CrossRef]
- Peraza Hernandez, E.A.; Hartl, D.J.; Lagoudas, D.C. Structural Mechanics and Design of Active Origami Structures. In Active Origami; Springer: Berlin/Heidelberg, Germany, 2019; pp. 331–409. [Google Scholar]
- Kamei, K.; Khan, M.A.; Khan, K.A. Characterising Modal Behaviour of a Cantilever Beam at Different Heating Rates for Isothermal Conditions. Appl. Sci. 2021, 11, 4375. [Google Scholar] [CrossRef]
- Banshiwal, J.K.; Tripathi, D.N. Self-Healing Polymer Composites for Structural Application. Funct. Mater. 2019, 10, 1–13. [Google Scholar] [CrossRef] [Green Version]
- Yıldırım, G.; Khiavi, A.H.; Yeşilmen, S.; Şahmaran, M. Self-Healing Performance of Aged Cementitious Composites. Cem. Concr. Compos. 2018, 87, 172–186. [Google Scholar] [CrossRef]
- Alazhari, M.; Sharma, T.; Heath, A.; Cooper, R.; Paine, K. Application of Expanded Perlite Encapsulated Bacteria and Growth Media for Self-Healing Concrete. Constr. Build. Mater. 2018, 160, 610–619. [Google Scholar] [CrossRef]
- Teall, O.; Pilegis, M.; Davies, R.; Sweeney, J.; Jefferson, T.; Lark, R.; Gardner, D. A Shape Memory Polymer Concrete Crack Closure System Activated by Electrical Current. Smart Mater. Struct. 2018, 27, 075016. [Google Scholar] [CrossRef]
- Pang, J.W.C.; Bond, I.P. A Hollow Fibre Reinforced Polymer Composite Encompassing Self-Healing and Enhanced Damage Visibility. Compos. Sci. Technol. 2005, 65, 1791–1799. [Google Scholar] [CrossRef]
- Zai, B.A.; Khan, M.A.; Khan, S.Z.; Asif, M.; Khan, K.A.; Saquib, A.N.; Mansoor, A.; Shahzad, M.; Mujtaba, A. Prediction of Crack Depth and Fatigue Life of an Acrylonitrile Butadiene Styrene Cantilever Beam Using Dynamic Response. J. Test. Eval. 2020, 48, 20180674. [Google Scholar] [CrossRef]
- Dhaliwal, G.S.; Dundar, M.A. Four Point Flexural Response of Acrylonitrile–Butadiene–Styrene. J. Compos. Sci. 2020, 4, 63. [Google Scholar] [CrossRef]
- Lee, T.U.; You, Z.; Gattas, J.M. Elastica Surface Generation of Curved-Crease Origami. Int. J. Solids Struct. 2018, 136–137, 13–27. [Google Scholar] [CrossRef]
- Damas, S.M.; Turner, C.J. The Material Testing of Nanoparticle Doped 3D Printed ABS Strain Gages for Resisitance and Stiffness. In Proceedings of the International Design Engineering Technical Conferences and Computers and Information in Engineering Conference IDETC/CIE2020, Virtual, 17–19 August 2020; pp. 1–9. [Google Scholar]
- Tymrak, B.M.; Kreiger, M.; Pearce, J.M. Mechanical Properties of Components Fabricated with Open-Source 3-D Printers under Realistic Environmental Conditions. Mater. Des. 2014, 58, 242–246. [Google Scholar] [CrossRef] [Green Version]
- Cantrell, J.; Rohde, S.; Damiani, D.; Gurnani, R.; Disandro, L.; Anton, J.; Young, A.; Jerez, A.; Steinbach, D.; Kroese, C.; et al. Experimental Characterization of the Mechanical Properties of 3D-Printed ABS and Polycarbonate Parts. Rapid Prototyp. J. 2017, 23, 811–824. [Google Scholar] [CrossRef]
- Yu, Z.; Li, Y.; Zhao, Z.; Wang, C.; Yang, J.; Zhang, C.; Li, Z.; Wang, Y. Effect of Rubber Types on Synthesis, Morphology, and Properties of ABS Resins. Polym. Eng. Sci. 2009, 49, 2249–2256. [Google Scholar] [CrossRef]
- Ritzen, L.; Montano, V.; Garcia, S.J. 3d Printing of a Self-Healing Thermoplastic Polyurethane through Fdm: From Polymer Slab to Mechanical Assessment. Polymers 2021, 13, 305. [Google Scholar] [CrossRef] [PubMed]
- UL Prospector Generic Families of Plastic. Available online: https://www.ulprospector.com/plastics/en/generics (accessed on 15 September 2021).
- Srivastava, V.K. A Review on Advances in Rapid Prototype 3D Printing of Multi-Functional Applications. Sci. Technol. 2017, 7, 4–24. [Google Scholar] [CrossRef]
- Mitra, A.C.; Jagtap, A.; Kachare, S. Development and Validation of Experimental Setup for Flexural Formula of Cantilever Beam Using NI-LabVIEW. Mater. Today Proc. 2018, 5, 20326–20335. [Google Scholar] [CrossRef]
- Hunt, C.; Kratz, J.; Partridge, I.K. Cure Path Dependency of Mode i Fracture Toughness in Thermoplastic Particle Interleaf Toughened Prepreg Laminates. Compos. Part A Appl. Sci. Manuf. 2016, 87, 109–114. [Google Scholar] [CrossRef] [Green Version]
- Simon, I.; Banks-Sills, L.; Fourman, V. Mode I Delamination Propagation and R-Ratio Effects in Woven Composite DCB Specimens for a Multi-Directional Layup. Int. J. Fatigue 2017, 96, 237–251. [Google Scholar] [CrossRef]
- Reis, P.N.B.; Ferreira, J.A.M.; Antunes, F.V.; Costa, J.D.M. Initial Crack Length on the Interlaminar Fracture of Woven Carbon/Epoxy Laminates. Fibers Polym. 2015, 16, 894–901. [Google Scholar] [CrossRef]
- Brunner, A.J.; Blackman, B.R.K.; Davies, P. A Status Report on Delamination Resistance Testing of Polymer-Matrix Composites. Eng. Fract. Mech. 2008, 75, 2779–2794. [Google Scholar] [CrossRef] [Green Version]
- Mishra, K.; Babu, L.K.; Vaidyanathan, R. Improvement of Fracture Toughness and Thermo-Mechanical Properties of Carbon Fiber/Epoxy Composites Using Polyhedral Oligomeric Silsesquioxane. J. Compos. Mater. 2020, 54, 1273–1280. [Google Scholar] [CrossRef]
- Ait-Amir, B.; Pougnet, P.; El Hami, A. Meta-Model Development. Embed. Mechatron. Syst. 2015, 2, 151–179. [Google Scholar] [CrossRef]
- Chen, L.; Ifju, P.G.; Sankar, B.V. A Novel Double Cantilever Beam Test for Stitched Composite Laminates. J. Compos. Mater. 2001, 35, 1137–1149. [Google Scholar] [CrossRef]
- Kato, Y.; Minakuchi, S.; Ogihara, S.; Takeda, N.; Krull, B.; Patrick, J.; Hart, K.; White, S.; Sottos, N.; Yamagata, Y.; et al. Self-Healing Composites Structure Using Multiple through-Thickness Microvascular Channels. Adv. Compos. Mater. 2020, 30, 1–18. [Google Scholar] [CrossRef]

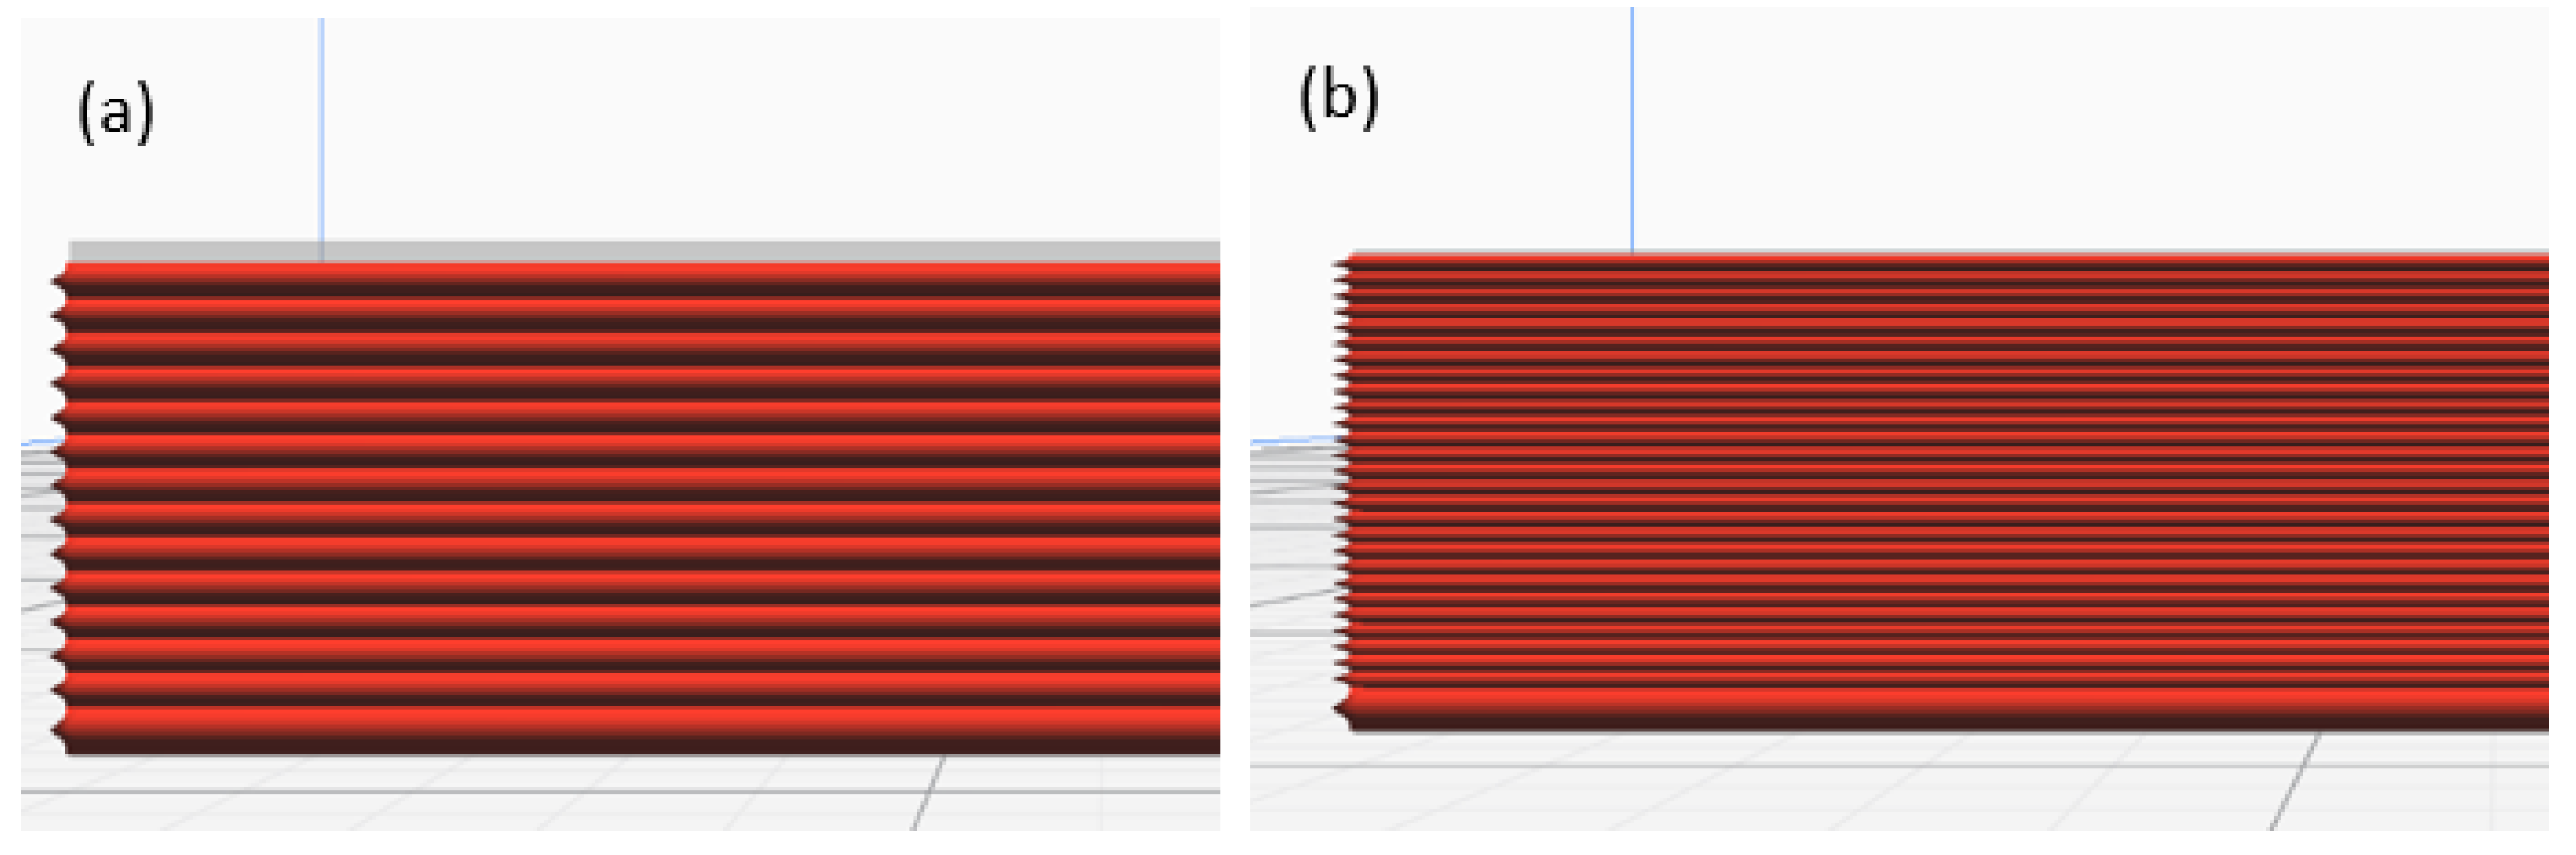


| Parameters | Value |
|---|---|
| Nozzle size (mm) | 0.4 |
| Layer thickness (mm) | 0.1, 0.2 |
| Build orientation | 0°, ±45°, 90° |
| Infill density (%) | 100 |
| Origami Capsule Shape | Thickness (mm) | Dimensions (mm) | Loads (g) |
|---|---|---|---|
| Cross | 1.0, 2.0, 3.0 | 19L/5W | 1, 2, 4, 6, 11, 16, 26, 36, 56, 86, 106 |
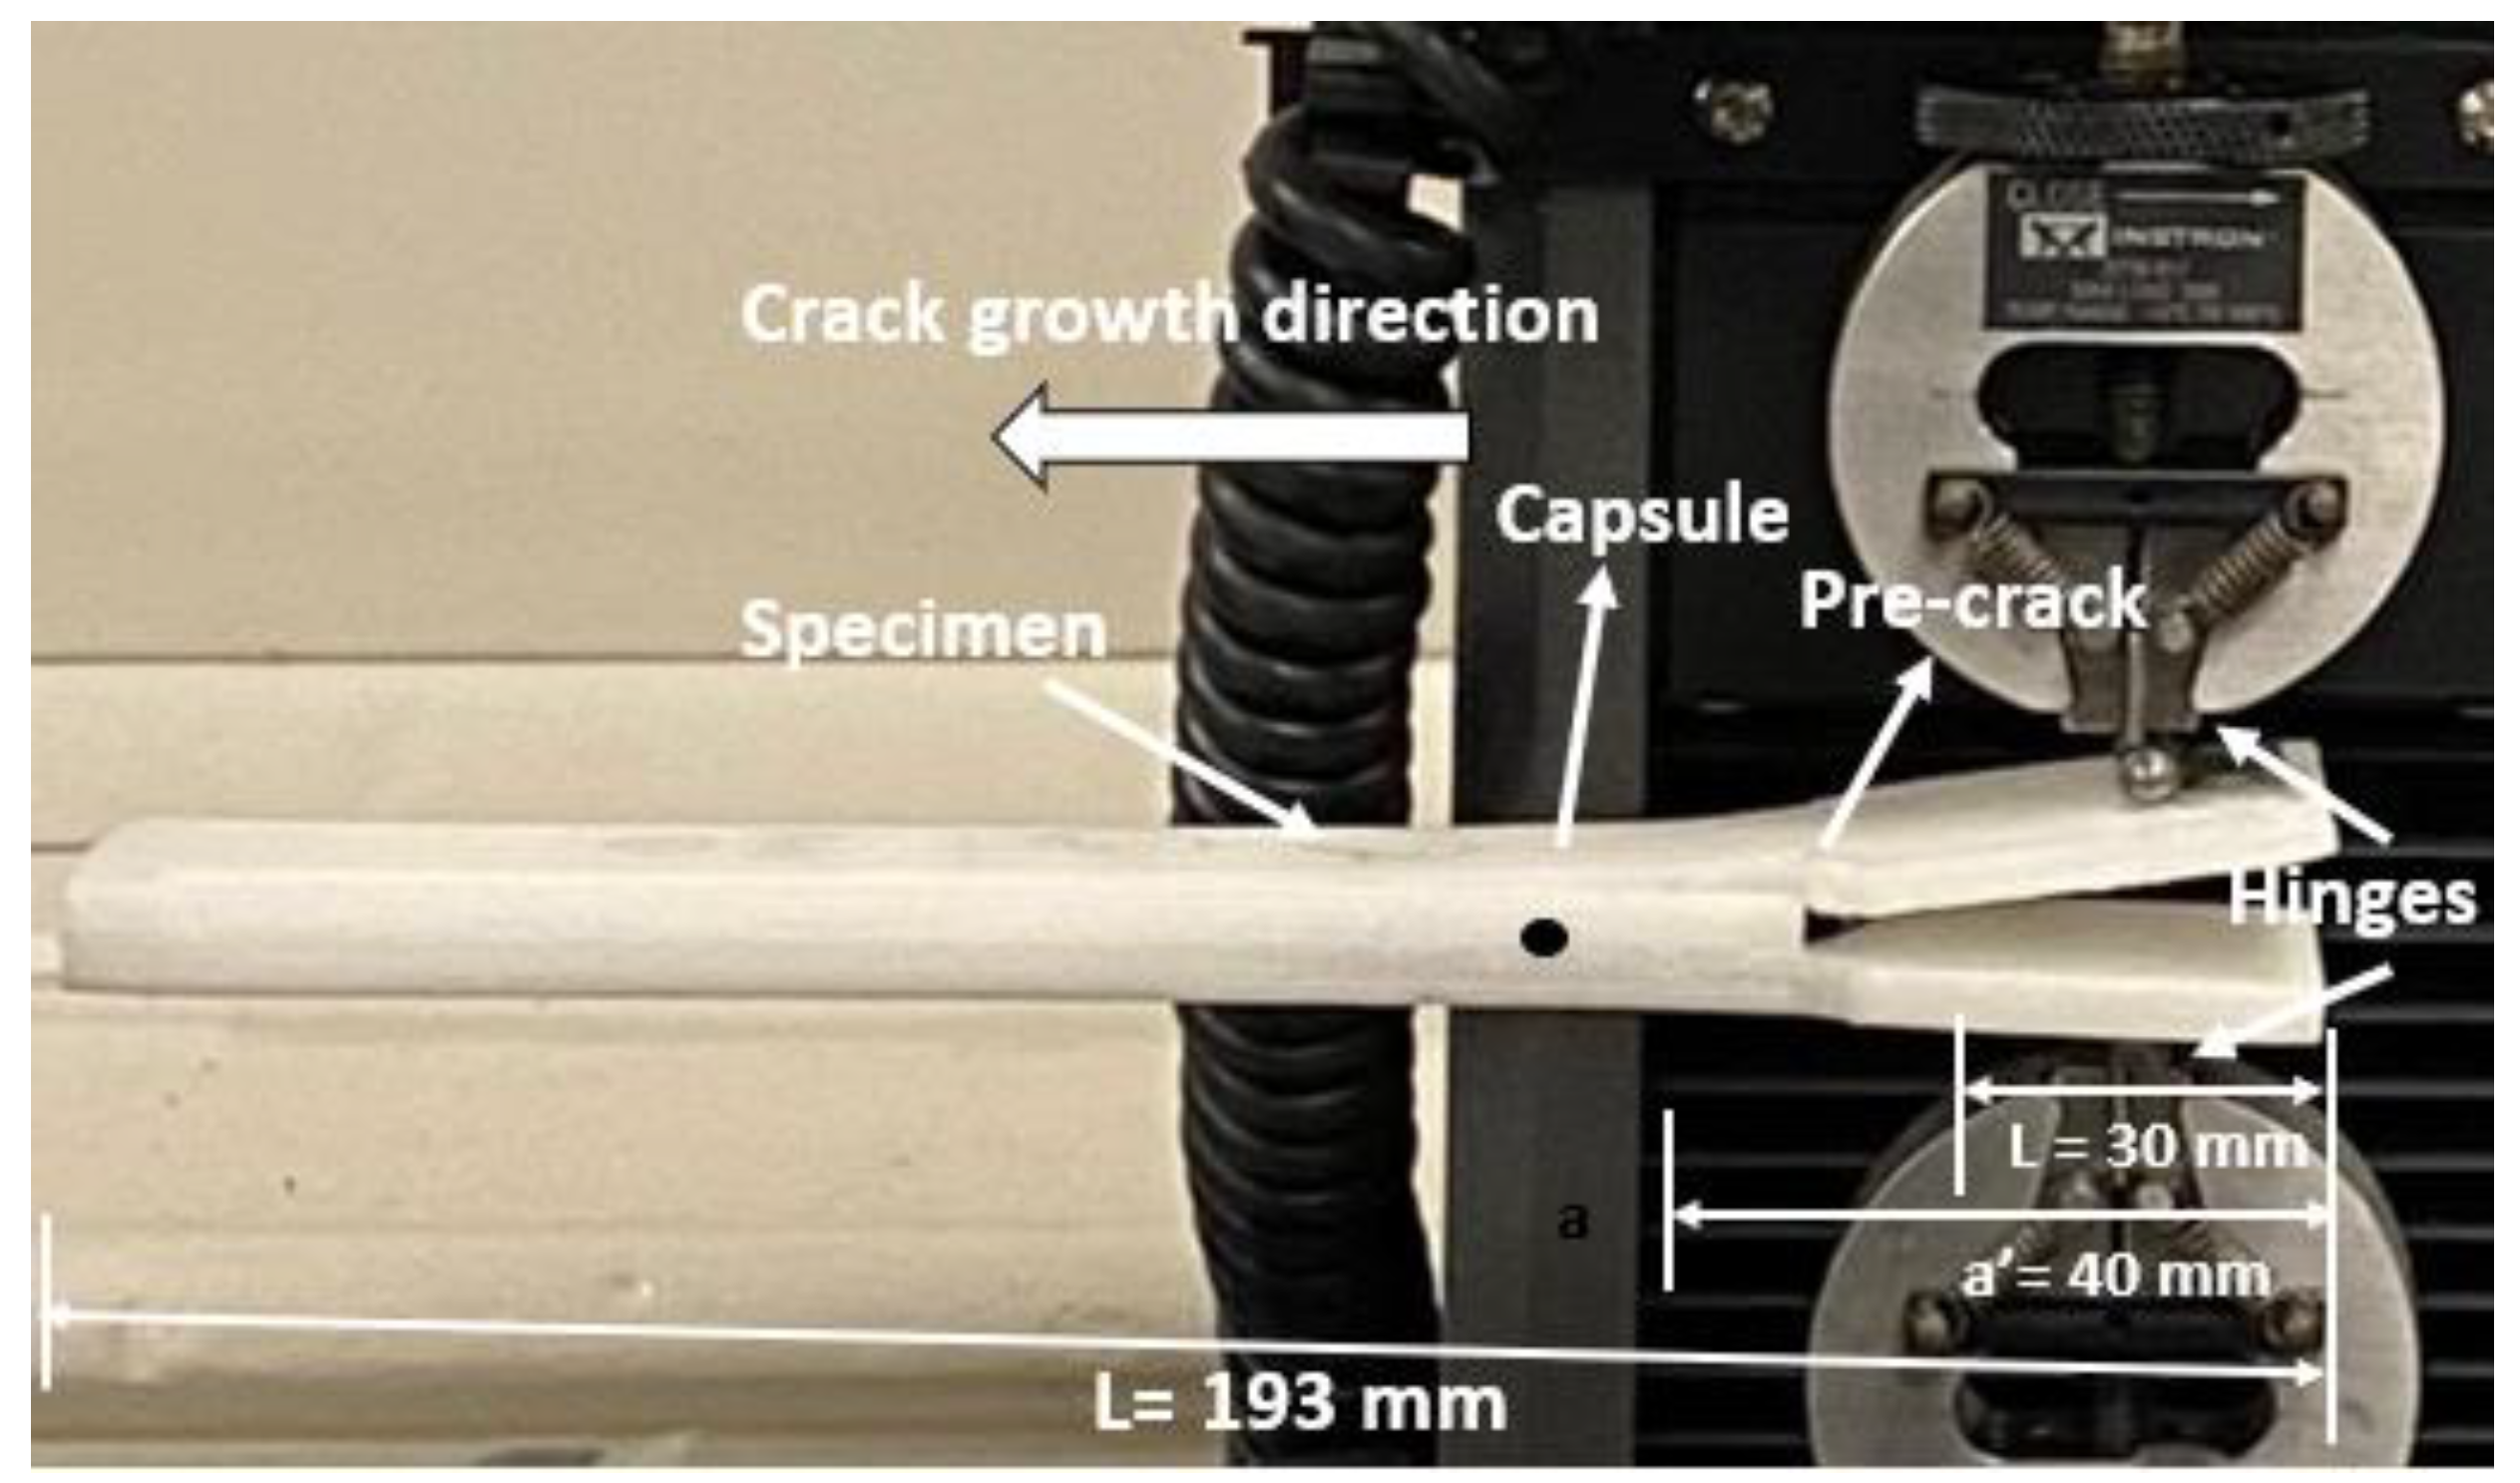
| Specimen Type | Crack Length | Thickness of Capsule | Mechanical Testing |
|---|---|---|---|
| DCB origami | 40 mm | 1 mm, 2 mm, 3 mm | Delamination test |
| DCB without origami | - | - | Delamination test |
| Specimen | Beam Thickness mm | Dimension, mm (Length/Width) | Type of Structure |
|---|---|---|---|
| with origami capsule | 5 mm | 193L/30W | With holes and pillars |
| without origami Capsule | 5 mm | 193L/30W | With holes and pillars |
| Coefficients | Simple ABS Beam | TPU Origami Capsule | |||||
|---|---|---|---|---|---|---|---|
| 0.5 mm | 1 mm | 2 mm | 3 mm | 1 mm | 2 mm | 3 mm | |
| P00 | −10.25 | −7.013 | −6.002 | −2.196 | 0.5864 | 1.176 | −0.05332 |
| P10 | 134.8 | 37.79 | 10.3 | 4.519 | 49.29 | −18.06 | −24.81 |
| P01 | 0.3297 | 0.1968 | 0.1247 | 0.0363 | 0.5673 | 2.483 | 3.927 |
| P20 | −209.2 | −38.41 | −2.804 | −1.402 | 14.57 | 37.92 | 21.46 |
| P11 | 0.6598 | 0.4525 | 0.1259 | 0.1112 | −3.208 | −2.87 | −2.373 |
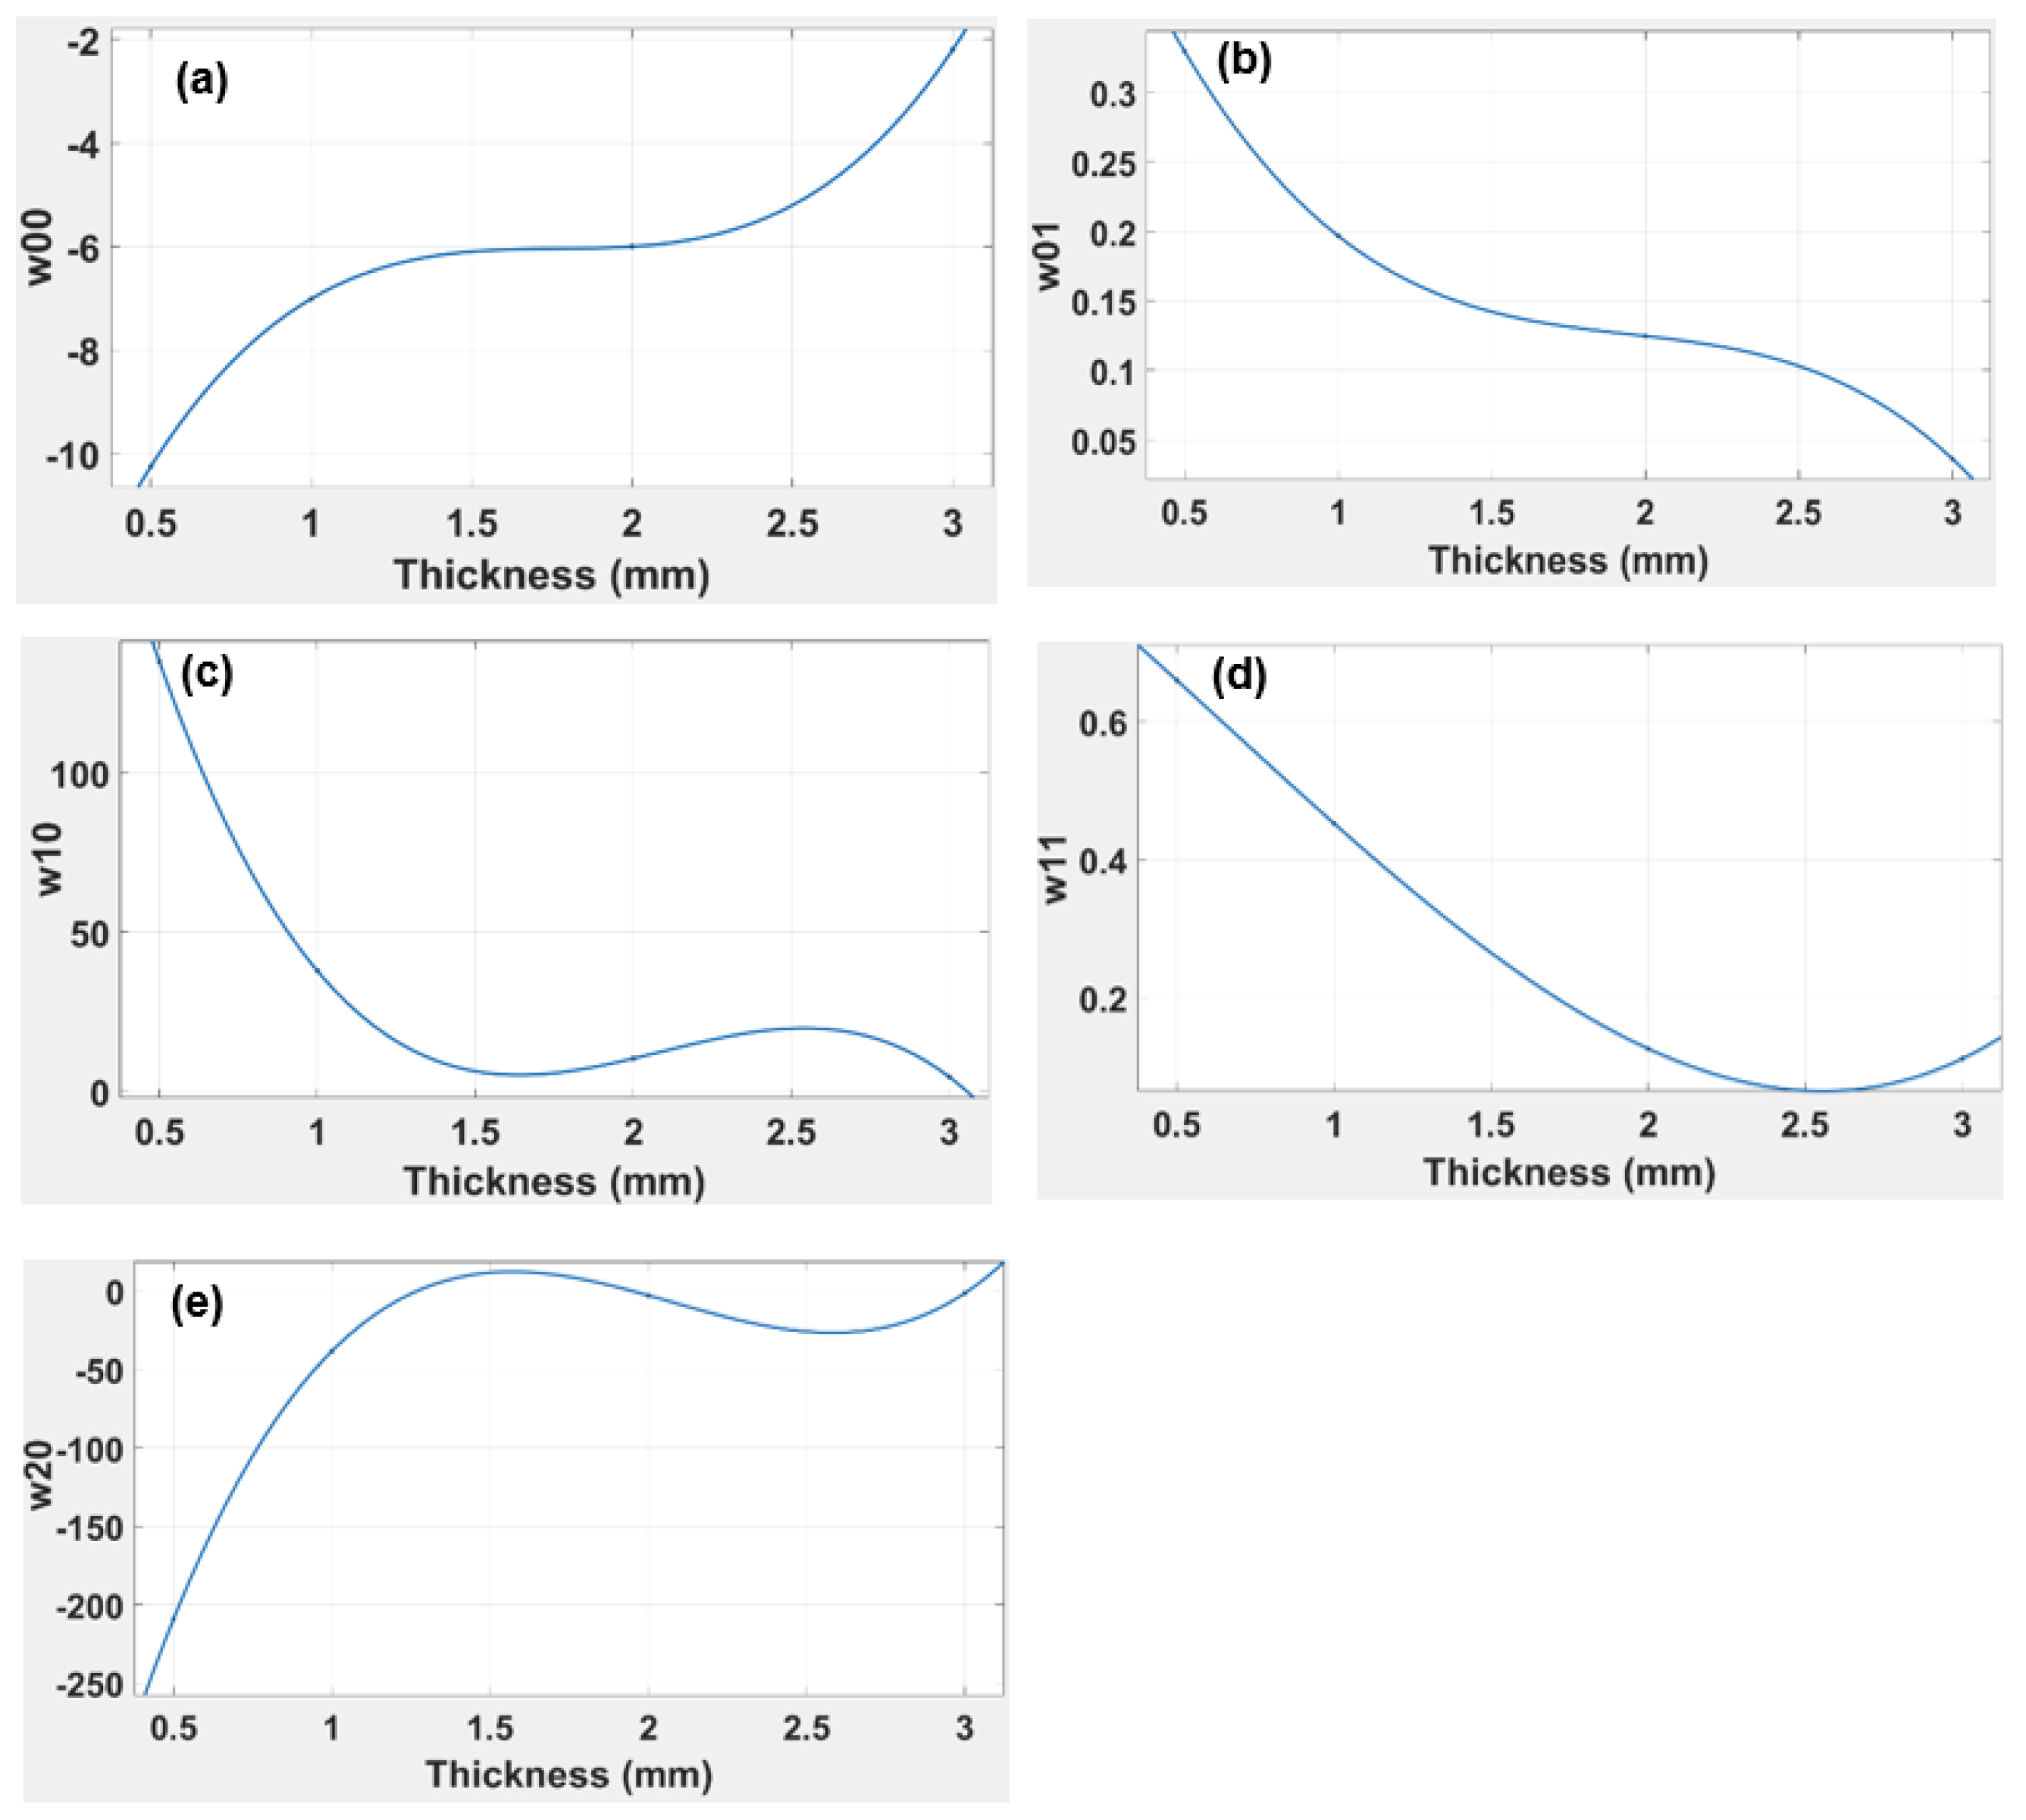
| w00 | 2.02 | −10.70 | 18.99 | −17.32 | −0.9095 | 3.318 | −1.822 |
| w01 | −0.05 | 0.32 | −0.65 | 0.58 | −0.2359 | 2.623 | −1.82 |
| w10 | −40.07 | 251.30 | 500.80 | 327.40 | −30.3 | −158.3 | 177.2 |
| w11 | 0.04 | −0.08 | −0.37 | 0.86 | 0.0795 | 0.0995 | −3.387 |
| w20 | 74.75 | −465.60 | 909.20 | −556.70 | −19.91 | 83.07 | −48.59 |
| with Origami (5 mm) | without Origami (5 mm) | |
|---|---|---|
| Experimental value of strain release | ||
| Theoretical value of strain release | ||
| Percent Deviation in strain release | = 0.0871 (8.71%) | = 0.0267 (2.67%) |
| Coefficient | S1 | S2 | S3 | S4 | R-Squared |
|---|---|---|---|---|---|
| With origami capsule | 4.971 × 10⁻⁸ | −1.479 × 10⁻⁵ | 0.001144 | −0.003213 | 0.9200 |
| Non origami capsule | 5.415 × 10⁻⁸ | −4.429 × 10⁻⁶ | 6.075 × 10⁻⁵ | 0.001356 | 0.9333 |
| Thickness | Coefficients | Embedded Structure DCB (Average) | TPU Beam Thickness (Average) |
|---|---|---|---|
| 1 mm | a | 0.1199 | 184.3 |
| b | −0.09576 | −0.06174 | |
| 2 mm | a | 0.03747 | 38.61 |
| b | −0.01419 | −0.03903 | |
| 3 mm | a | 1.0784 | 14.96 |
| b | −0.04389 | −0.03509 |
Publisher’s Note: MDPI stays neutral with regard to jurisdictional claims in published maps and institutional affiliations. |
© 2022 by the authors. Licensee MDPI, Basel, Switzerland. This article is an open access article distributed under the terms and conditions of the Creative Commons Attribution (CC BY) license (https://creativecommons.org/licenses/by/4.0/).
Share and Cite
Almutairi, M.D.; Alnahdi, S.S.; Khan, M.A. Strain Release Behaviour during Crack Growth of a Polymeric Beam under Elastic Loads for Self-Healing. Polymers 2022, 14, 3102. https://doi.org/10.3390/polym14153102
Almutairi MD, Alnahdi SS, Khan MA. Strain Release Behaviour during Crack Growth of a Polymeric Beam under Elastic Loads for Self-Healing. Polymers. 2022; 14(15):3102. https://doi.org/10.3390/polym14153102
Chicago/Turabian StyleAlmutairi, Mohammed Dukhi, Sultan Saleh Alnahdi, and Muhammad A. Khan. 2022. "Strain Release Behaviour during Crack Growth of a Polymeric Beam under Elastic Loads for Self-Healing" Polymers 14, no. 15: 3102. https://doi.org/10.3390/polym14153102