
Quantitative Characterization of the Anisotropy of the Stress-Optical Properties of Polyethylene Terephthalate Films Based on the Photoelastic Method


Abstract
:1. Introduction
2. Materials and Methods
2.1. Specimen Preparation
2.2. Experimental Equipment
2.3. Tensile Test
3. Results and Discussion
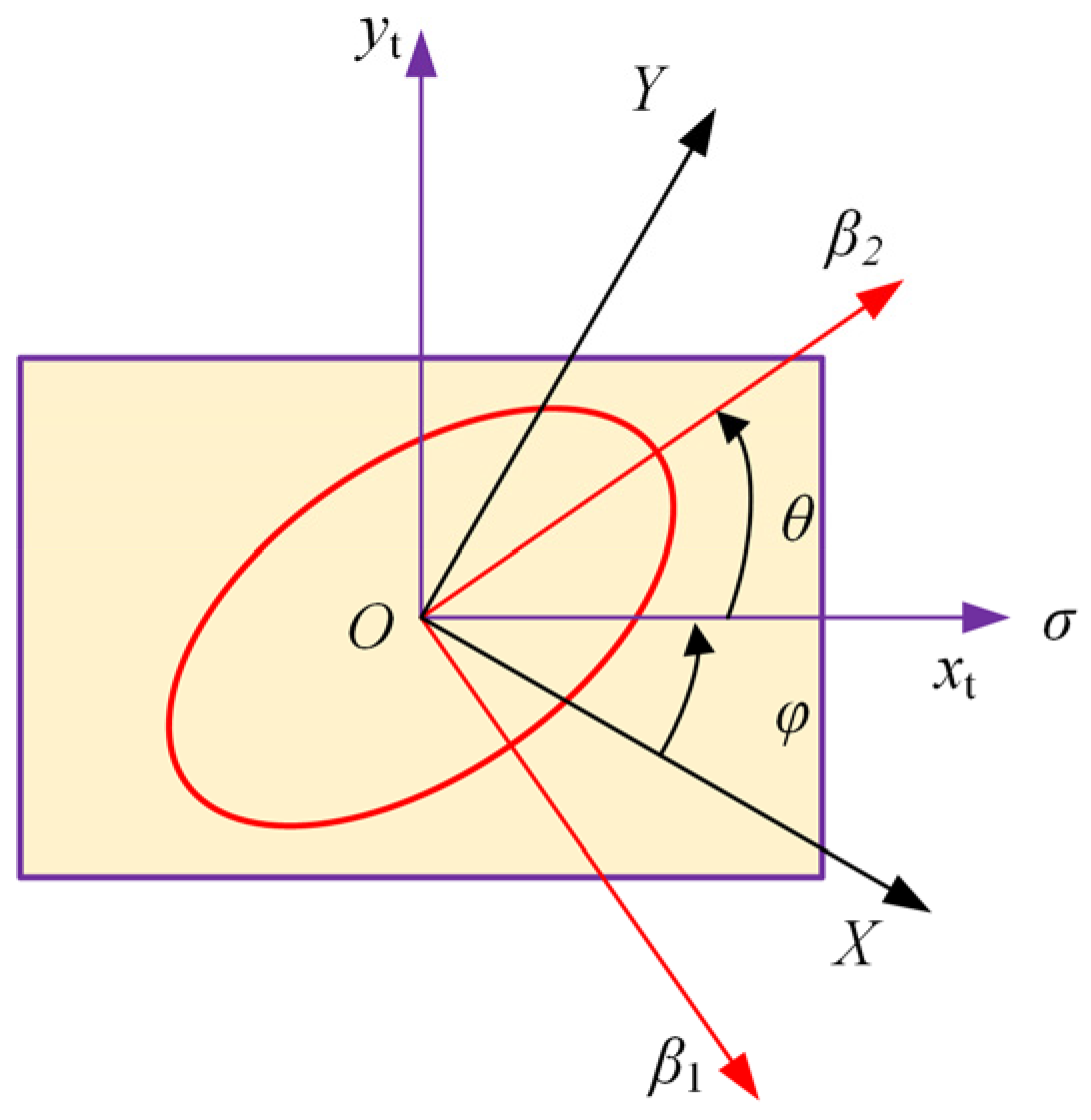
3.1. Model
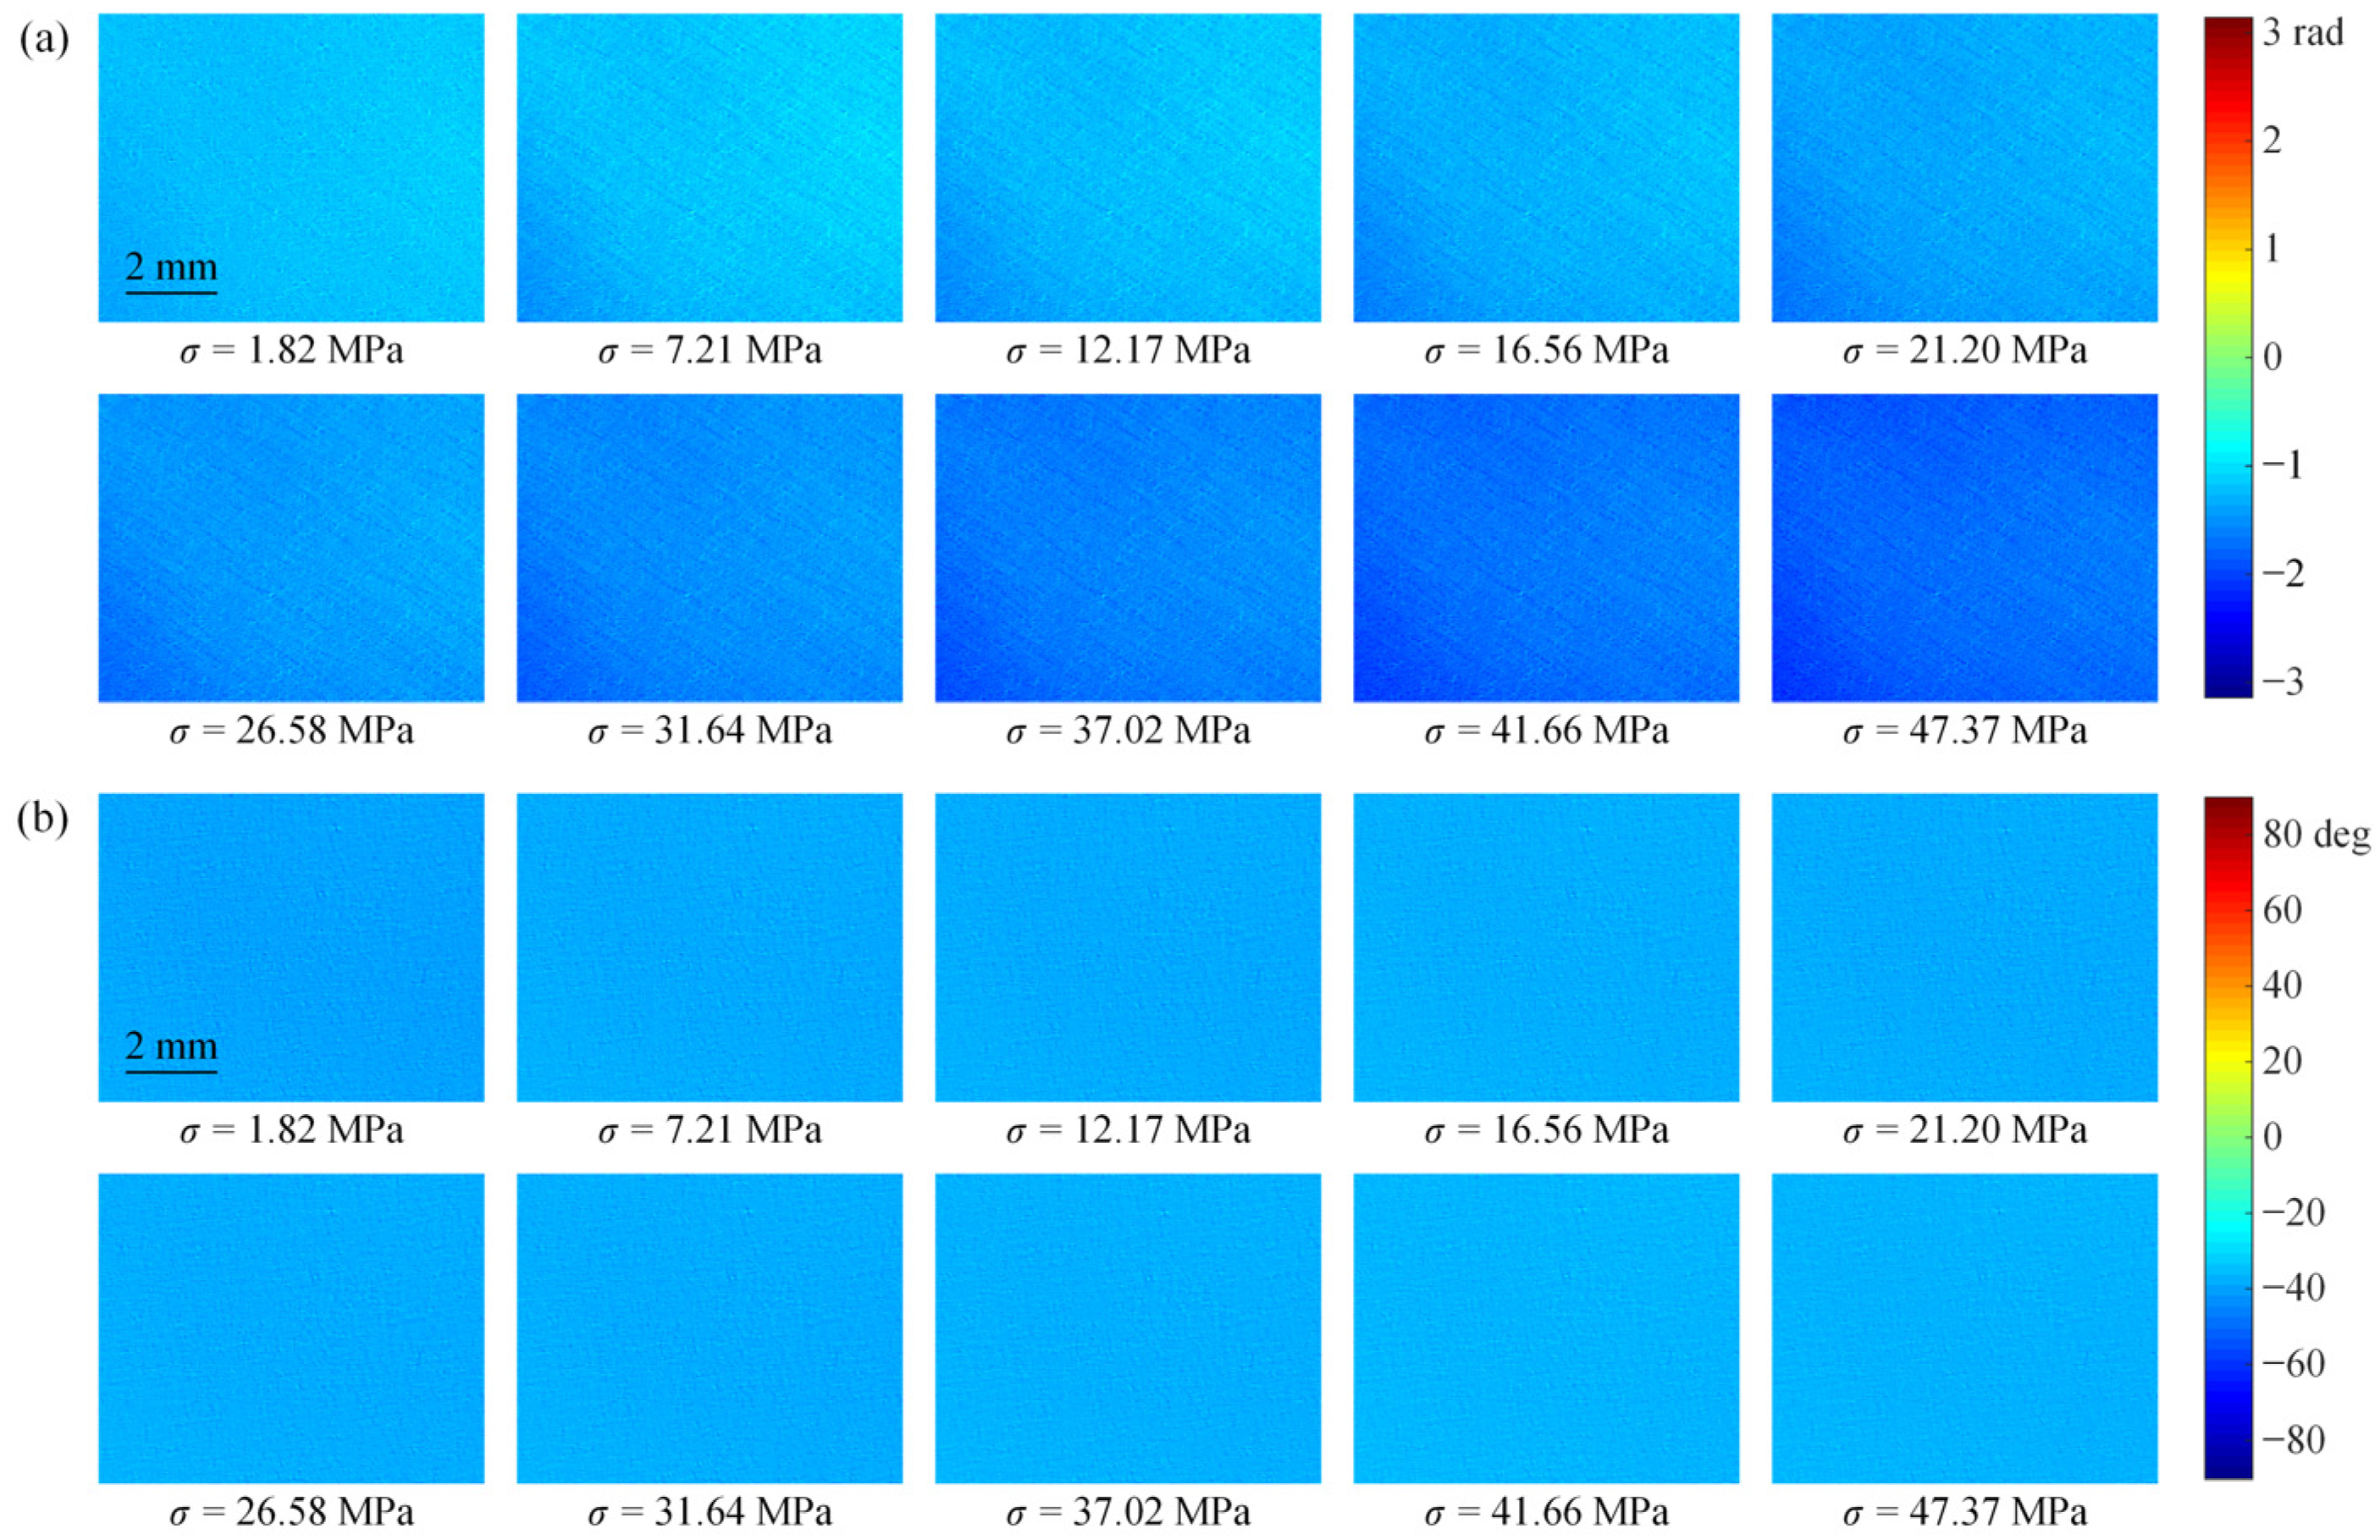
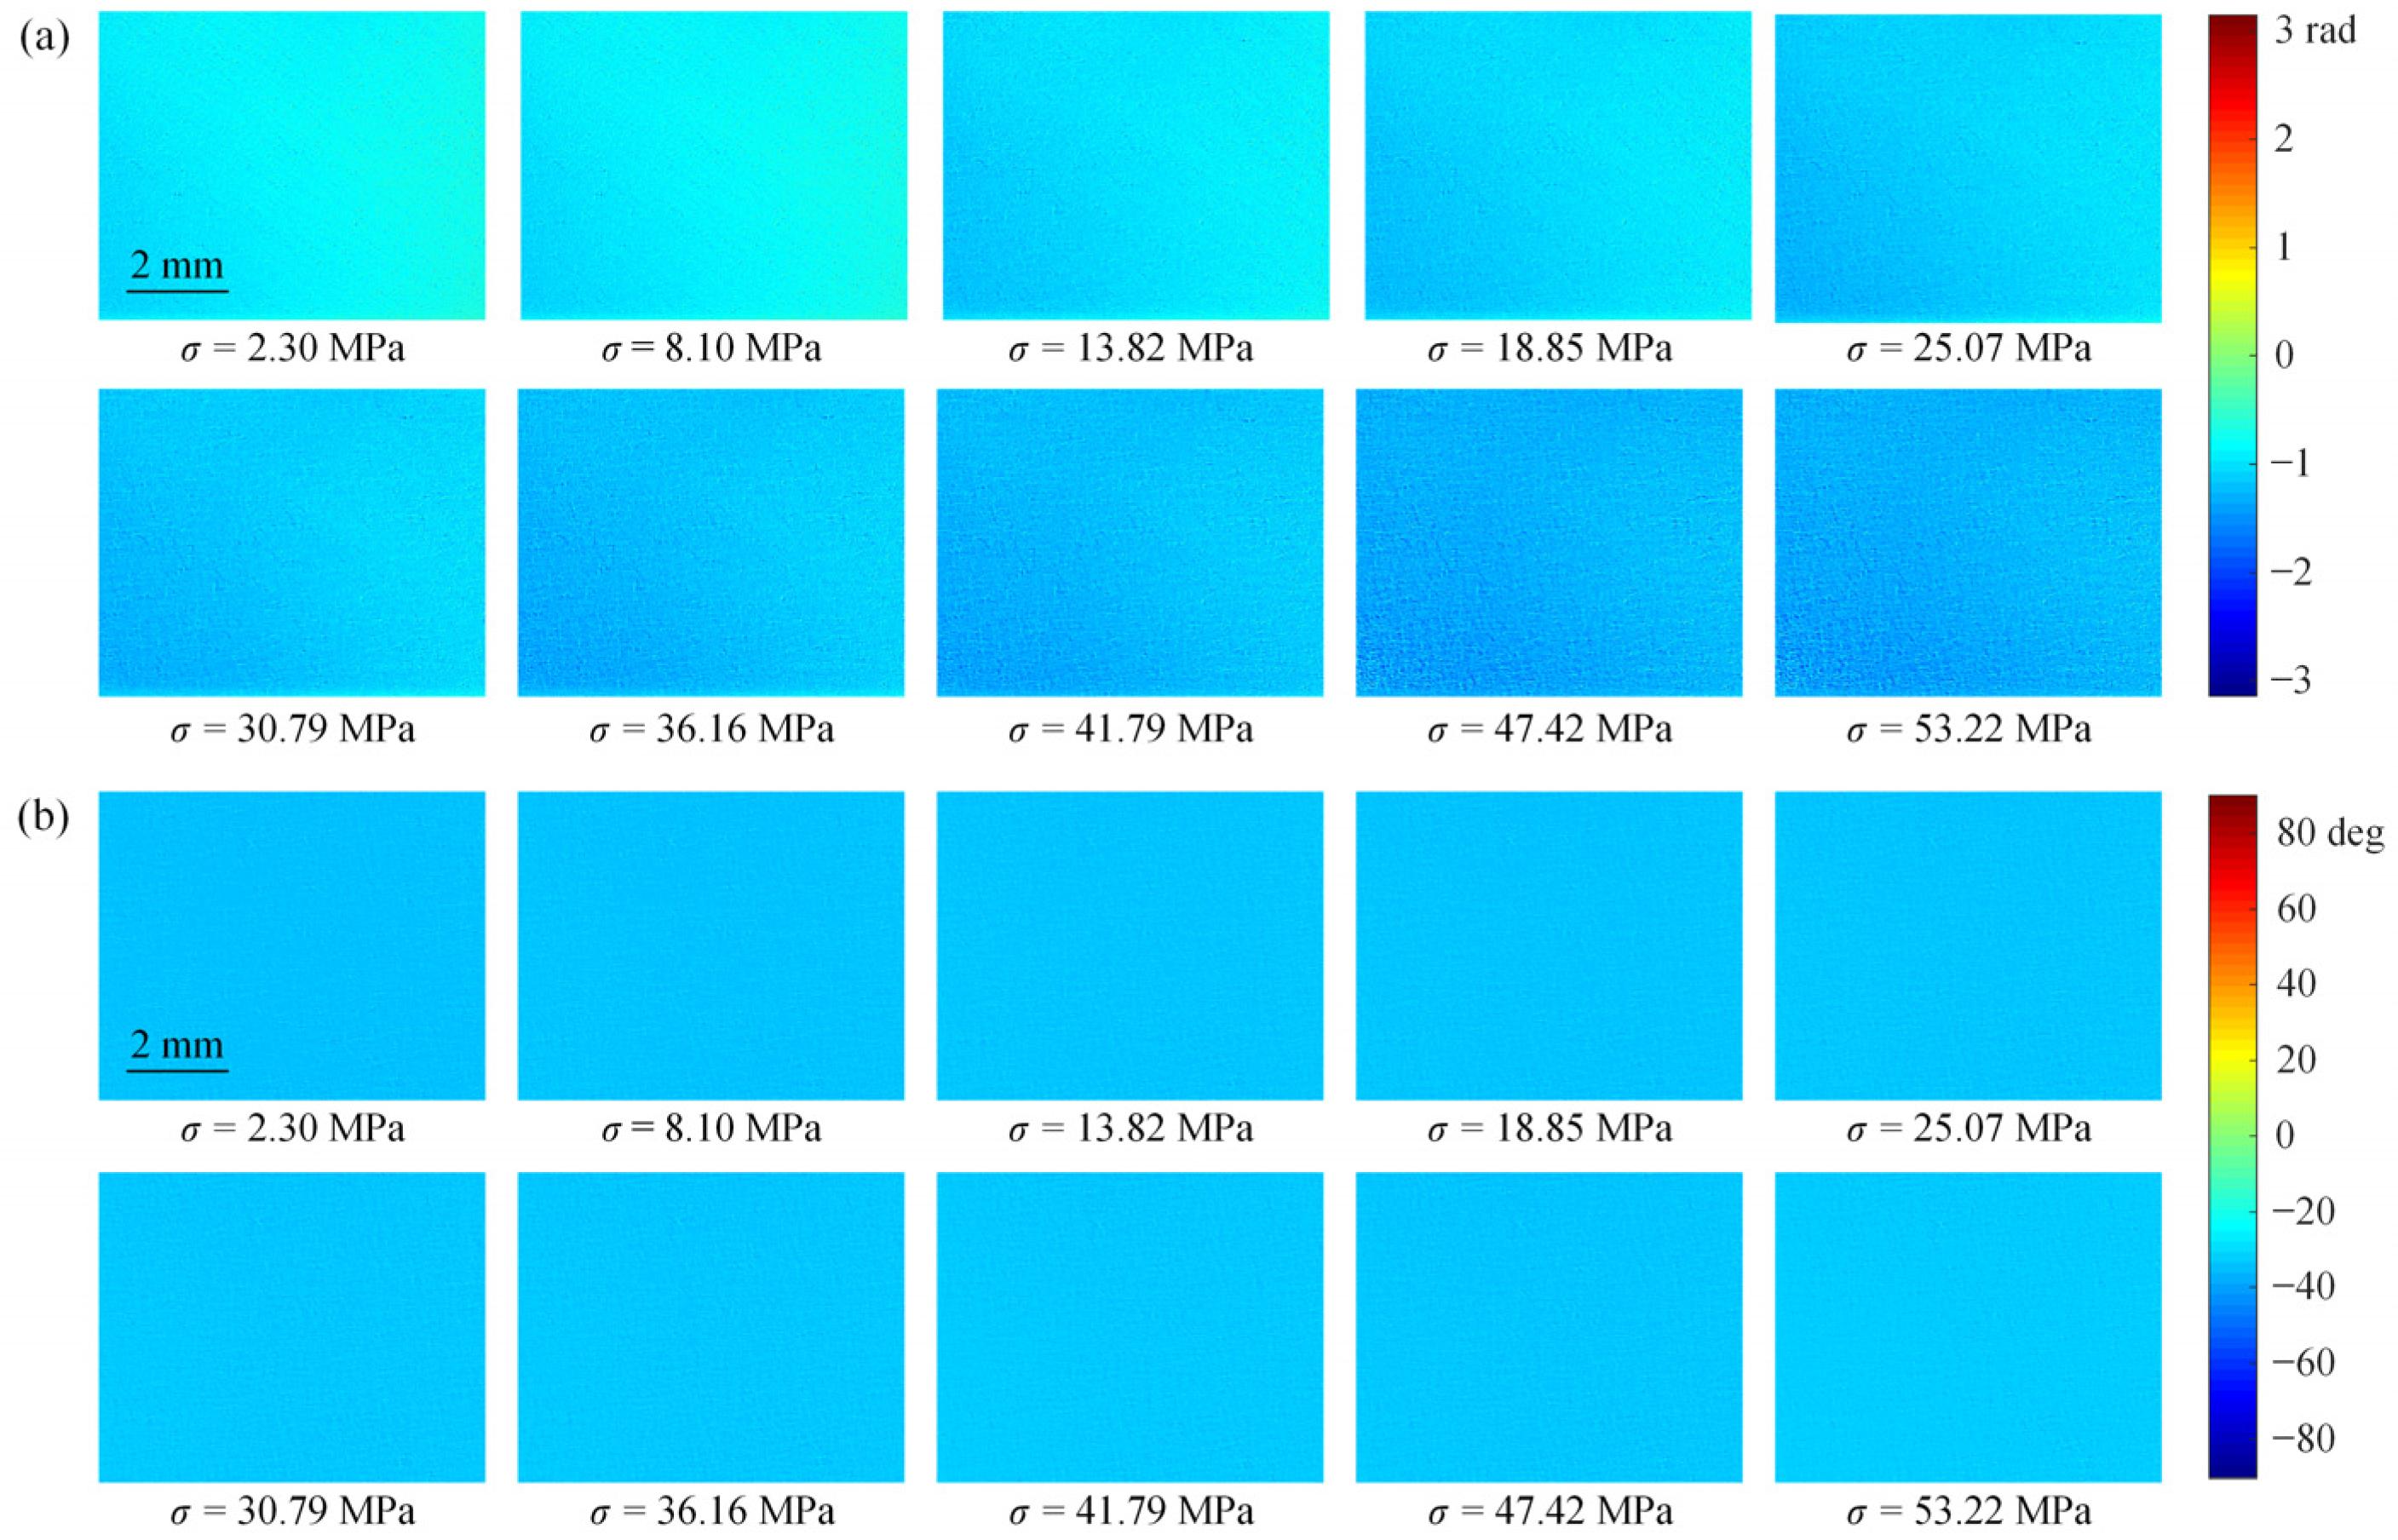
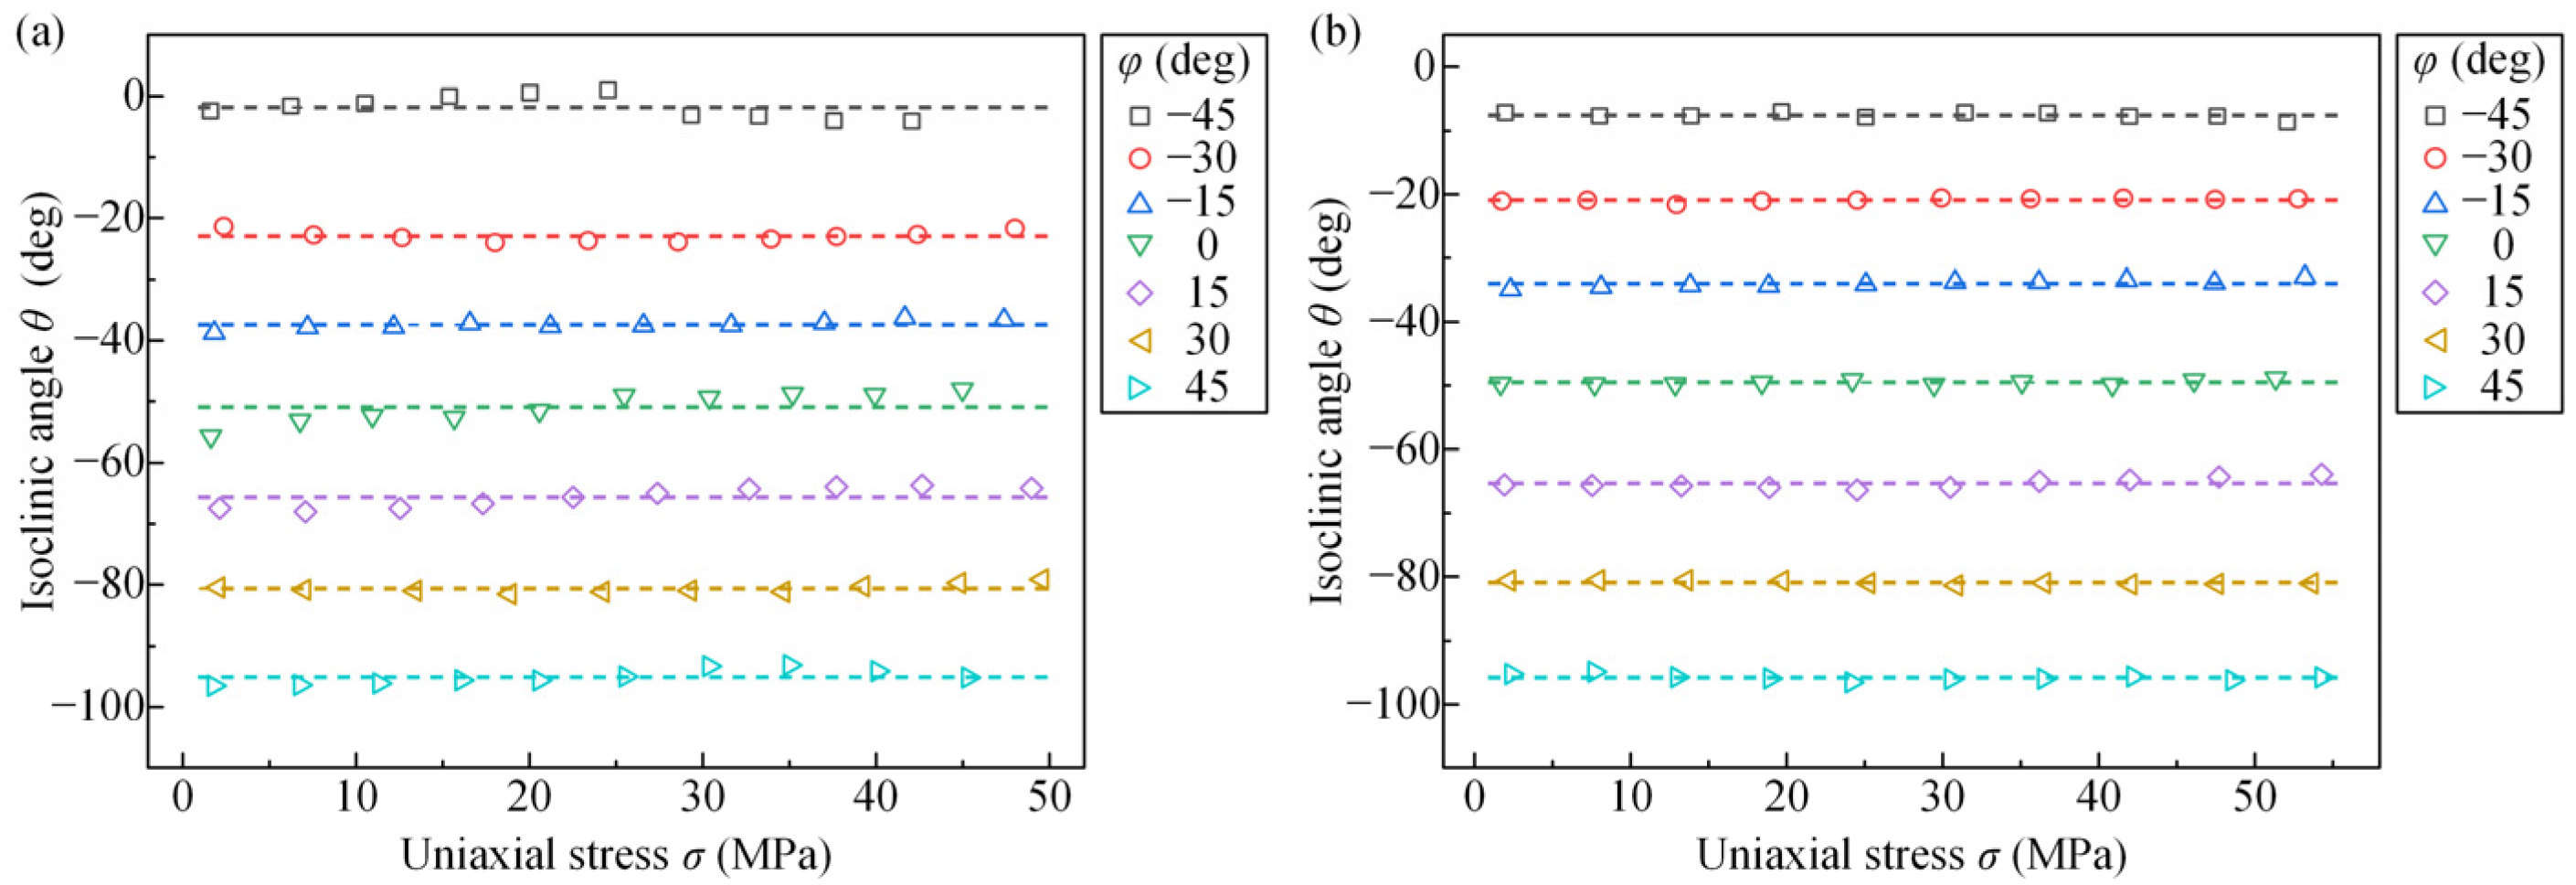
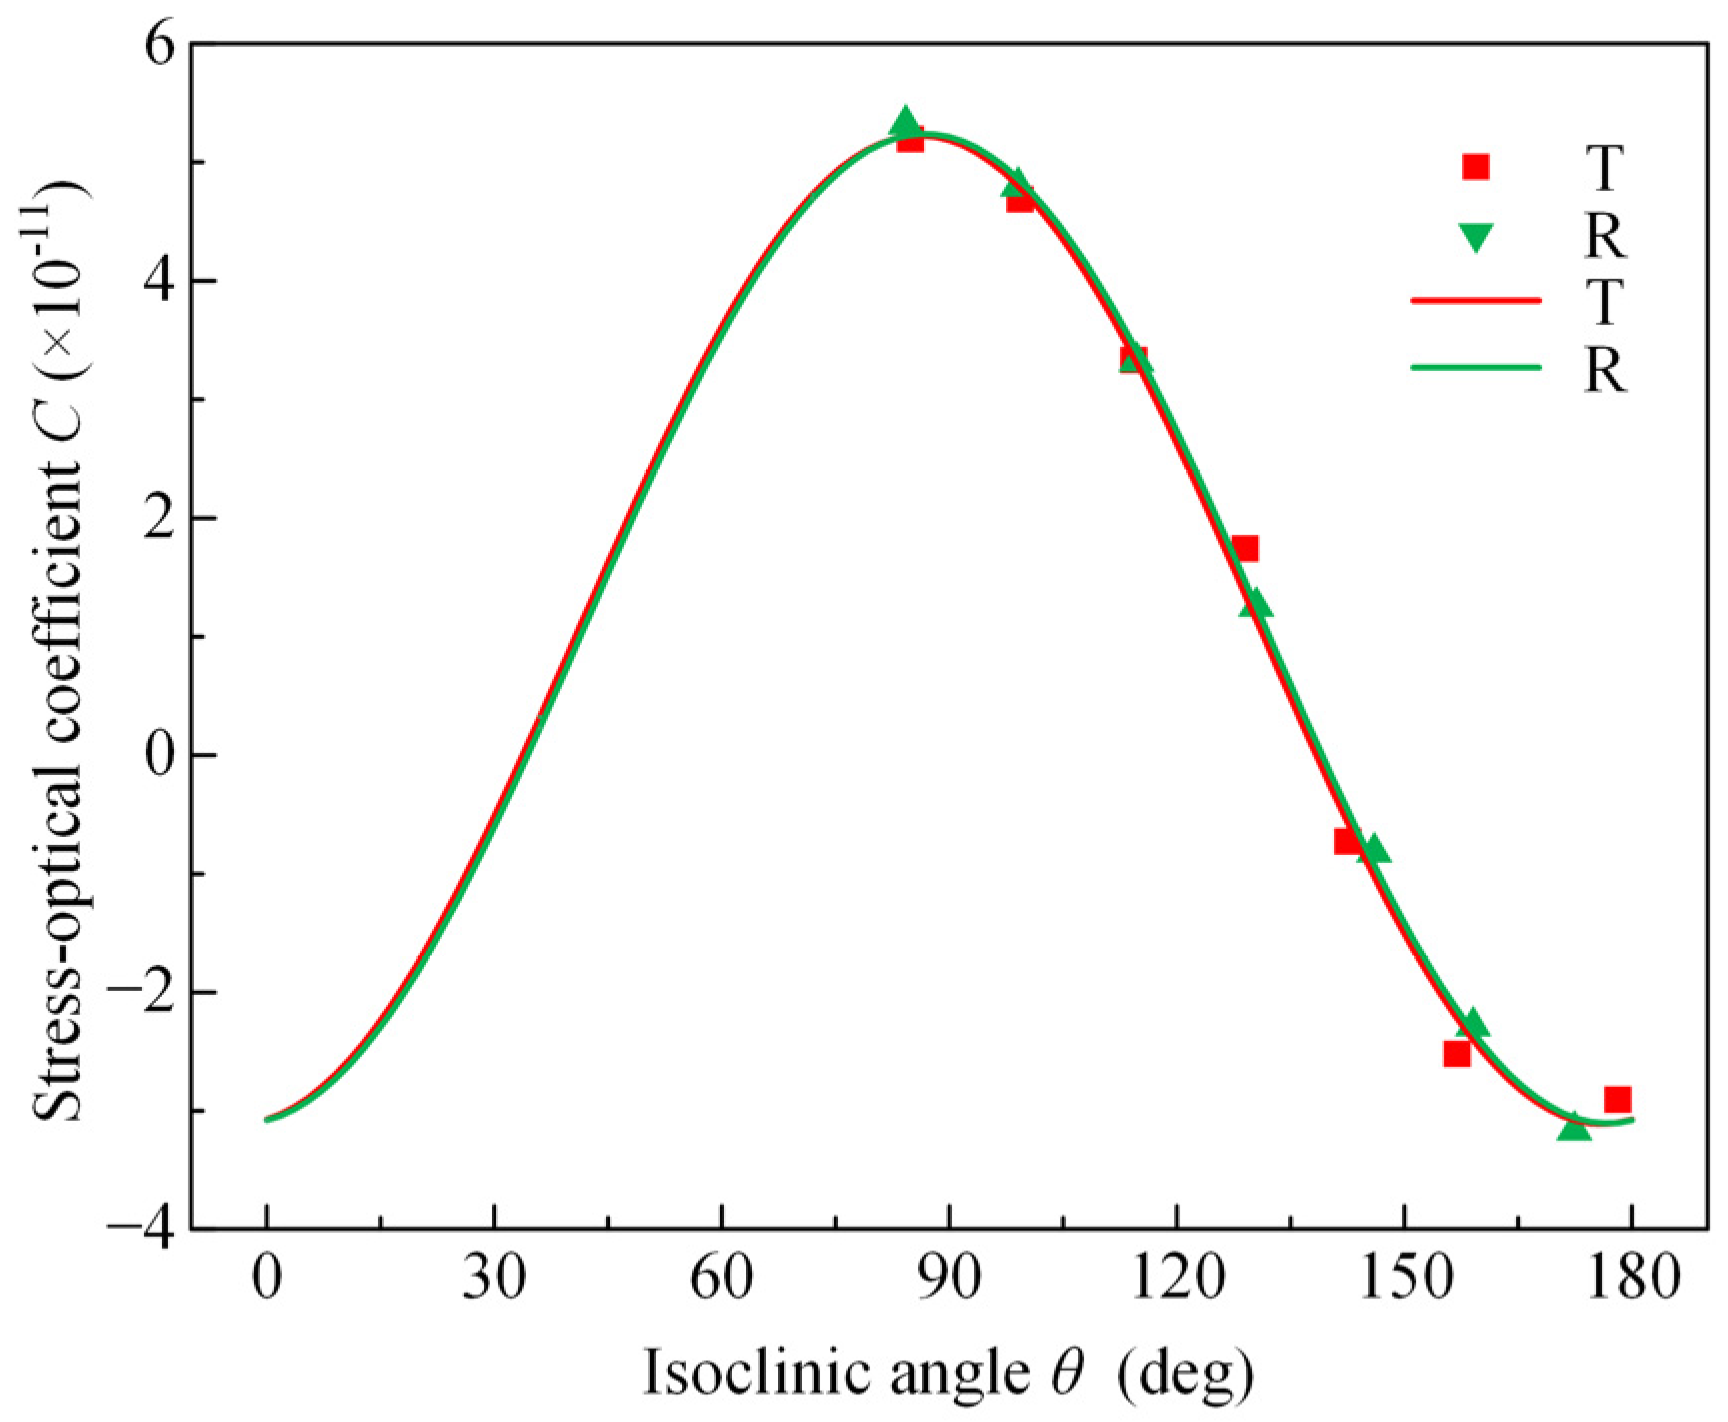
3.2. Result
3.3. Discussion
4. Conclusions
Author Contributions
Funding
Data Availability Statement
Conflicts of Interest
References
- Nathan, A.; Ahnood, A.; Cole, M.T.; Lee, S.; Suzuki, Y.; Hiralal, P.; Bonaccorso, F.; Hasan, T.; Garcia-Gancedo, L.; Dyadyusha, A.; et al. Flexible Electronics: The Next Ubiquitous Platform. Proc. IEEE 2012, 100, 1486–1517. [Google Scholar] [CrossRef]
- Alzoubi, K.; Lu, S.; Sammakia, B.; Poliks, M. Experimental and Analytical Studies on the High Cycle Fatigue of Thin Film Metal on PET Substrate for Flexible Electronics Applications. IEEE Trans. Compon. Pack. Manuf. Technol. 2011, 1, 43–51. [Google Scholar] [CrossRef]
- Li, H.B.; Ma, Y.J.; Huang, Y.G. Material innovation and mechanics design for substrates and encapsulation of flexible electronics: A review. Mater. Horiz. 2021, 8, 383–400. [Google Scholar] [CrossRef] [PubMed]
- Mladenovski, S.; Neyts, K.; Pavicic, D.; Werner, A.; Rothe, C. Exceptionally efficient organic light emitting devices using high refractive index substrates. Opt. Express 2009, 17, 7562–7570. [Google Scholar] [CrossRef] [Green Version]
- McBranch, D.; Campbell, I.H.; Smith, D.L.; Ferraris, J.P. Optical determination of chain orientation in electroluminescent polymer film. Appl. Phys. Lett. 1995, 66, 1175–1177. [Google Scholar] [CrossRef]
- Singh, G.; Methta, D.S. Effect of Birefringence of Flexible Substrate on the Polarization State of Backlight Source for Photonic Devices. In Proceedings of the Workshop on Recent Advances in Photonics (WRAP), New Delhi, India, 17–18 December 2013. [Google Scholar] [CrossRef]
- MacDonald, W.A.; Looney, M.K.; MacKerron, D.; Eveson, R.; Adam, R.; Hashimoto, K.; Rakos, K. Latest advances in substrates for flexible electronics. J. Soc. Inf. Display 2007, 15, 1075–1083. [Google Scholar] [CrossRef]
- Cakmak, M.; White, J.L.; Spruiell, J.E. Optical properties of simultaneous biaxially stretched poly(ethylene terephthalate) films. Polym. Eng. Sci. 1989, 29, 1534–1543. [Google Scholar] [CrossRef]
- Lapersonne, P.; Tassin, J.F.; Monnerie, L. Uniaxial planar deformation of PET films: 2. Characterization of the orientation from measurements of refractive indices. Polymer 1994, 35, 2192–2196. [Google Scholar] [CrossRef]
- Cail, J.I.; Saunders, L.S.; Stepto, R.F.T.; Ward, I.M. Experimental studies and molecular modelling of the stress-optical and stress-strain behaviour of poly(ethylene terephthalate). Part III: Measurement and quantitative modelling of birefringence-strain, stress-strain and stress-optical properties. Polymer 2007, 48, 1379–1387. [Google Scholar] [CrossRef]
- Haji, A.; Rahbar, R.S.; Kalantari, B. The effect of hot multistage drawing on molecular structure and optical properties of polyethylene terephthalate fibers. Mater. Res. 2012, 15, 554–560. [Google Scholar] [CrossRef] [Green Version]
- Kirov, K.R.; Assender, H.E. Quantitative ATR-IR Analysis of Anisotropic Polymer Films: Extraction of Optical Constants. Macromolecules 2004, 37, 894–904. [Google Scholar] [CrossRef]
- Inoue, T.; Kuwada, S.; Ryu, D.S.; Osaki, K. Effects of Wavelength on Strain-Induced Birefringence of Polymers. Polym. J. 1998, 30, 929–934. [Google Scholar] [CrossRef] [Green Version]
- Elman, J.F.; Greener, J.; Herzinger, C.M.; Johs, B. Characterization of biaxially-stretched plastic films by generalized ellipsometry. Thin Solid Films 1998, 313, 814–818. [Google Scholar] [CrossRef]
- Laskarakis, A.; Logothetidis, S. On the optical anisotropy of poly(ethylene terephthalate) and poly(ethylene naphthalate) polymeric films by spectroscopic ellipsometry from visible-far ultraviolet to infrared spectral regions. J. Appl. Phys. 2006, 99, 066101. [Google Scholar] [CrossRef]
- Laskarakis, A.; Logothetidis, S. Investigation of the optical anisotropy of PET and PEN films by VIS-FUV to IR spectroscopic ellipsometry. Appl. Surf. Sci. 2006, 253, 52–56. [Google Scholar] [CrossRef]
- Schmidegg, K.; Sun, L.D.; Zeppenfeld, P. Optical and mechanical anisotropies of oriented poly(ethylene terephthalate) films. Appl. Phys. Lett. 2006, 89, 051906. [Google Scholar] [CrossRef]
- Onogi, S.; Keedy, D.A.; Stein, R.S. The measurement of dynamic birefringence. J. Polym. Sci. 2010, 50, 15–16. [Google Scholar] [CrossRef]
- Ryu, D.S.; Inoue, T.; Osaki, K. A birefringence study of polymer crystallization in the process of elongation of films. Polymer 1998, 39, 2515–2520. [Google Scholar] [CrossRef]
- Zhou, Z.K.; Jiang, H.; Gu, H.G.; Chen, X.G.; Peng, H.Y.; Liao, Y.G.; Liu, S.Y.; Xie, X.L. Strain-optical behavior of polyethylene terephthalate film during uniaxial stretching investigated by Mueller matrix ellipsometry. Polymer 2019, 182, 121842. [Google Scholar] [CrossRef]
- Brewster, D. On the Effects of Simple Pressure in Producing That Species of Crystallization Which Forms Two Oppositely Polarised Images, and Exhibits the Complementary Colours by Polarised Light. Philos. Trans. R. Soc. Lond. 1815, 105, 60–64. [Google Scholar] [CrossRef]
- Brewster, D. On the Communication of the Structure of Doubly Refracting Crystals to Glass, Muriate of Soda, Fluor Spar, and Other Substances, by Mechanical Compression and Dilatation. Philos. Trans. R. Soc. Lond. 1816, 106, 156–178. [Google Scholar] [CrossRef]
- Neumann, K.E. Die Gesetze der Doppelbrechung des Lichts in comprimirten oder ungleichförmig erwärmten unkrystallinischen Körpern. Ann. Phys. 1841, 130, 449–476. [Google Scholar] [CrossRef] [Green Version]
- Pockels, F. Ueber den Einfluss elastischer Deformationen, speciell einseitigen Druckes, auf das optische Verhalten krystallinischer Körper. Ann. Phys. 1889, 273, 144–172. [Google Scholar] [CrossRef] [Green Version]
- Lei, Z.K.; Yun, D.Z.; Yu, W.M. Whole-field determination of isoclinic parameter by five-step color phase shifting and its error analysis. Opt. Laser Eng. 2003, 40, 189–200. [Google Scholar] [CrossRef]
- Su, F.; Lan, T.B.; Pan, X.X. Stress evaluation of Through-Silicon Vias using micro-infrared photoelasticity and finite element analysis. Opt. Laser Eng. 2015, 74, 87–93. [Google Scholar] [CrossRef]
- Ding, Q.; Wang, M.J.; Xing, H.D.; He, Q.Y.; Ma, L.L.; Qiu, W. Investigation of a fitting phase-shift method for stress analysis using infrared photoelasticity. Opt. Laser Eng. 2022, 149, 106787. [Google Scholar] [CrossRef]
- Hecker, F.W.; Morche, B. Computer-aided measurement of relative retardations in plane photoelasticity. In Experimental Stress Analysis; Wieringa, H., Ed.; Springer: Dordrecht, The Netherlands, 1986; pp. 535–542. [Google Scholar] [CrossRef]
- Gao, G.; Mao, D.; Jiang, R.; Li, Z.; Liu, X.; Lei, B.; Bian, J.; Wu, S.; Fan, B. Investigation of Photoelastic Property and Stress Analysis for Optical Polyimide Membrane through Stress Birefringence Method. Coatings 2020, 10, 56. [Google Scholar] [CrossRef] [Green Version]
- Lee, Y.C.; Liu, T.S.; Wu, C.I.; Lin, W.Y. Investigation on residual stress and stress-optical coefficient for flexible electronics by photoelasticity. Measurement 2012, 45, 311–316. [Google Scholar] [CrossRef]
- Ramesh, K.; Sasikumar, S. Digital photoelasticity: Recent developments and diverse applications. Opt. Laser Eng. 2020, 135, 106186. [Google Scholar] [CrossRef]
- Ramji, M.; Ramesh, K. Whole field evaluation of stress components in digital photoelasticity—Issues, implementation and application. Opt. Laser Eng. 2008, 46, 257–271. [Google Scholar] [CrossRef]
- Ramji, M.; Ramesh, K. Adaptive Quality Guided Phase Unwrapping Algorithm for Whole-Field Digital Photoelastic Parameter Estimation of Complex Models. Strain 2010, 46, 184–194. [Google Scholar] [CrossRef]
- Narasimhamurty, T.S. Photoelastic and Electro-Optic Properties of Crystals; Plenum Press: New York, NY, USA; London, UK, 1981; p. 50. [Google Scholar] [CrossRef]
- García-Caurel, E.; De Martino, A.; Gaston, J.P.; Yan, L. Application of Spectroscopic Ellipsometry and Mueller Ellipsometry to Optical Characterization. Appl. Spectrosc. 2013, 67, 1–21. [Google Scholar] [CrossRef] [PubMed] [Green Version]
- Ma, J.; Ye, X.; Jin, B. Structure and application of polarizer film for thin-film-transistor liquid crystal displays. Displays 2011, 32, 49–57. [Google Scholar] [CrossRef]
- Teng, W.Y.; Jeng, S.C.; Ding, J.M.; Kuo, C.W.; Chin, W.K. Flexible Homeotropic Liquid Crystal Displays Using Low-Glass-Transition-Temperature Poly (ethylene terephthalate) Substrates. Jpn. J. Appl. Phys. 2010, 49, 010205. [Google Scholar] [CrossRef]
- Kumar, P.; Jaggi, C.; Sharma, V.; Raina, K.K. Advancements of vertically aligned liquid crystal displays. Micron 2016, 81, 34–47. [Google Scholar] [CrossRef]
- Manda, R.; Pagidi, S.; Lim, Y.J.; He, R.; Song, S.M.; Lee, J.H.; Lee, G.D.; Lee, S.H. Self-supported liquid crystal film for flexible display and photonic applications. J. Mol. Liq. 2019, 291, 111314. [Google Scholar] [CrossRef]


| Image Number | α | β | β′ | Intensity Equation | |
|---|---|---|---|---|---|
| T | R | ||||
| 1 | π/2 | 0 | 0 | ||
| 2 | π/4 | 0 | 0 | ||
| 3 | π/2 | 3π/4 | π/4 | ||
| 4 | π/4 | π/4 | 3π/4 | ||
| Image Number | ζ | γ = γ′ | β = β′ | Intensity Equation | |
|---|---|---|---|---|---|
| T | R | ||||
| 5 | 3π/4 | π/4 | π/2 | ||
| 6 | 3π/4 | π/4 | 0 | ||
| 7 | 3π/4 | 0 | 0 | ||
| 8 | 3π/4 | π/4 | π/4 | ||
| 9 | π/4 | 0 | 0 | ||
| 10 | π/4 | 3π/4 | π/4 | ||
| T | 2.250 | 23.06 | −13.66 | 5.092 | 0.9954 |
| R | 2.250 | 23.17 | −13.69 | 4.158 | 0.9993 |
Publisher’s Note: MDPI stays neutral with regard to jurisdictional claims in published maps and institutional affiliations. |
© 2022 by the authors. Licensee MDPI, Basel, Switzerland. This article is an open access article distributed under the terms and conditions of the Creative Commons Attribution (CC BY) license (https://creativecommons.org/licenses/by/4.0/).
Share and Cite
He, Q.; Wang, M.; Du, Y.; Qin, Q.; Qiu, W. Quantitative Characterization of the Anisotropy of the Stress-Optical Properties of Polyethylene Terephthalate Films Based on the Photoelastic Method. Polymers 2022, 14, 3257. https://doi.org/10.3390/polym14163257
He Q, Wang M, Du Y, Qin Q, Qiu W. Quantitative Characterization of the Anisotropy of the Stress-Optical Properties of Polyethylene Terephthalate Films Based on the Photoelastic Method. Polymers. 2022; 14(16):3257. https://doi.org/10.3390/polym14163257
Chicago/Turabian StyleHe, Quanyan, Miaojing Wang, Yitao Du, Qinghua Qin, and Wei Qiu. 2022. "Quantitative Characterization of the Anisotropy of the Stress-Optical Properties of Polyethylene Terephthalate Films Based on the Photoelastic Method" Polymers 14, no. 16: 3257. https://doi.org/10.3390/polym14163257
APA StyleHe, Q., Wang, M., Du, Y., Qin, Q., & Qiu, W. (2022). Quantitative Characterization of the Anisotropy of the Stress-Optical Properties of Polyethylene Terephthalate Films Based on the Photoelastic Method. Polymers, 14(16), 3257. https://doi.org/10.3390/polym14163257