
Quantitative Structure-Activity Relationship, Ontology-Based Model of the Antioxidant and Cell Protective Activity of Peat Humic Acids

 , , , and
Abstract
:
1. Introduction
2. Materials and Methods
2.1. Materials
2.2. Characterization of Humic Acids
2.3. Free Radical Scavenging Activity of Humic Acids
2.4. Cytotoxicity Study
2.5. Intracellular Humic Acids Distribution Assay
2.6. The Effect of Humic Acidss on the Action of Prooxidants In Vitro
3. Results
3.1. Antioxidant Activity of the Samples
3.2. Cell Protective Activity of the Samples
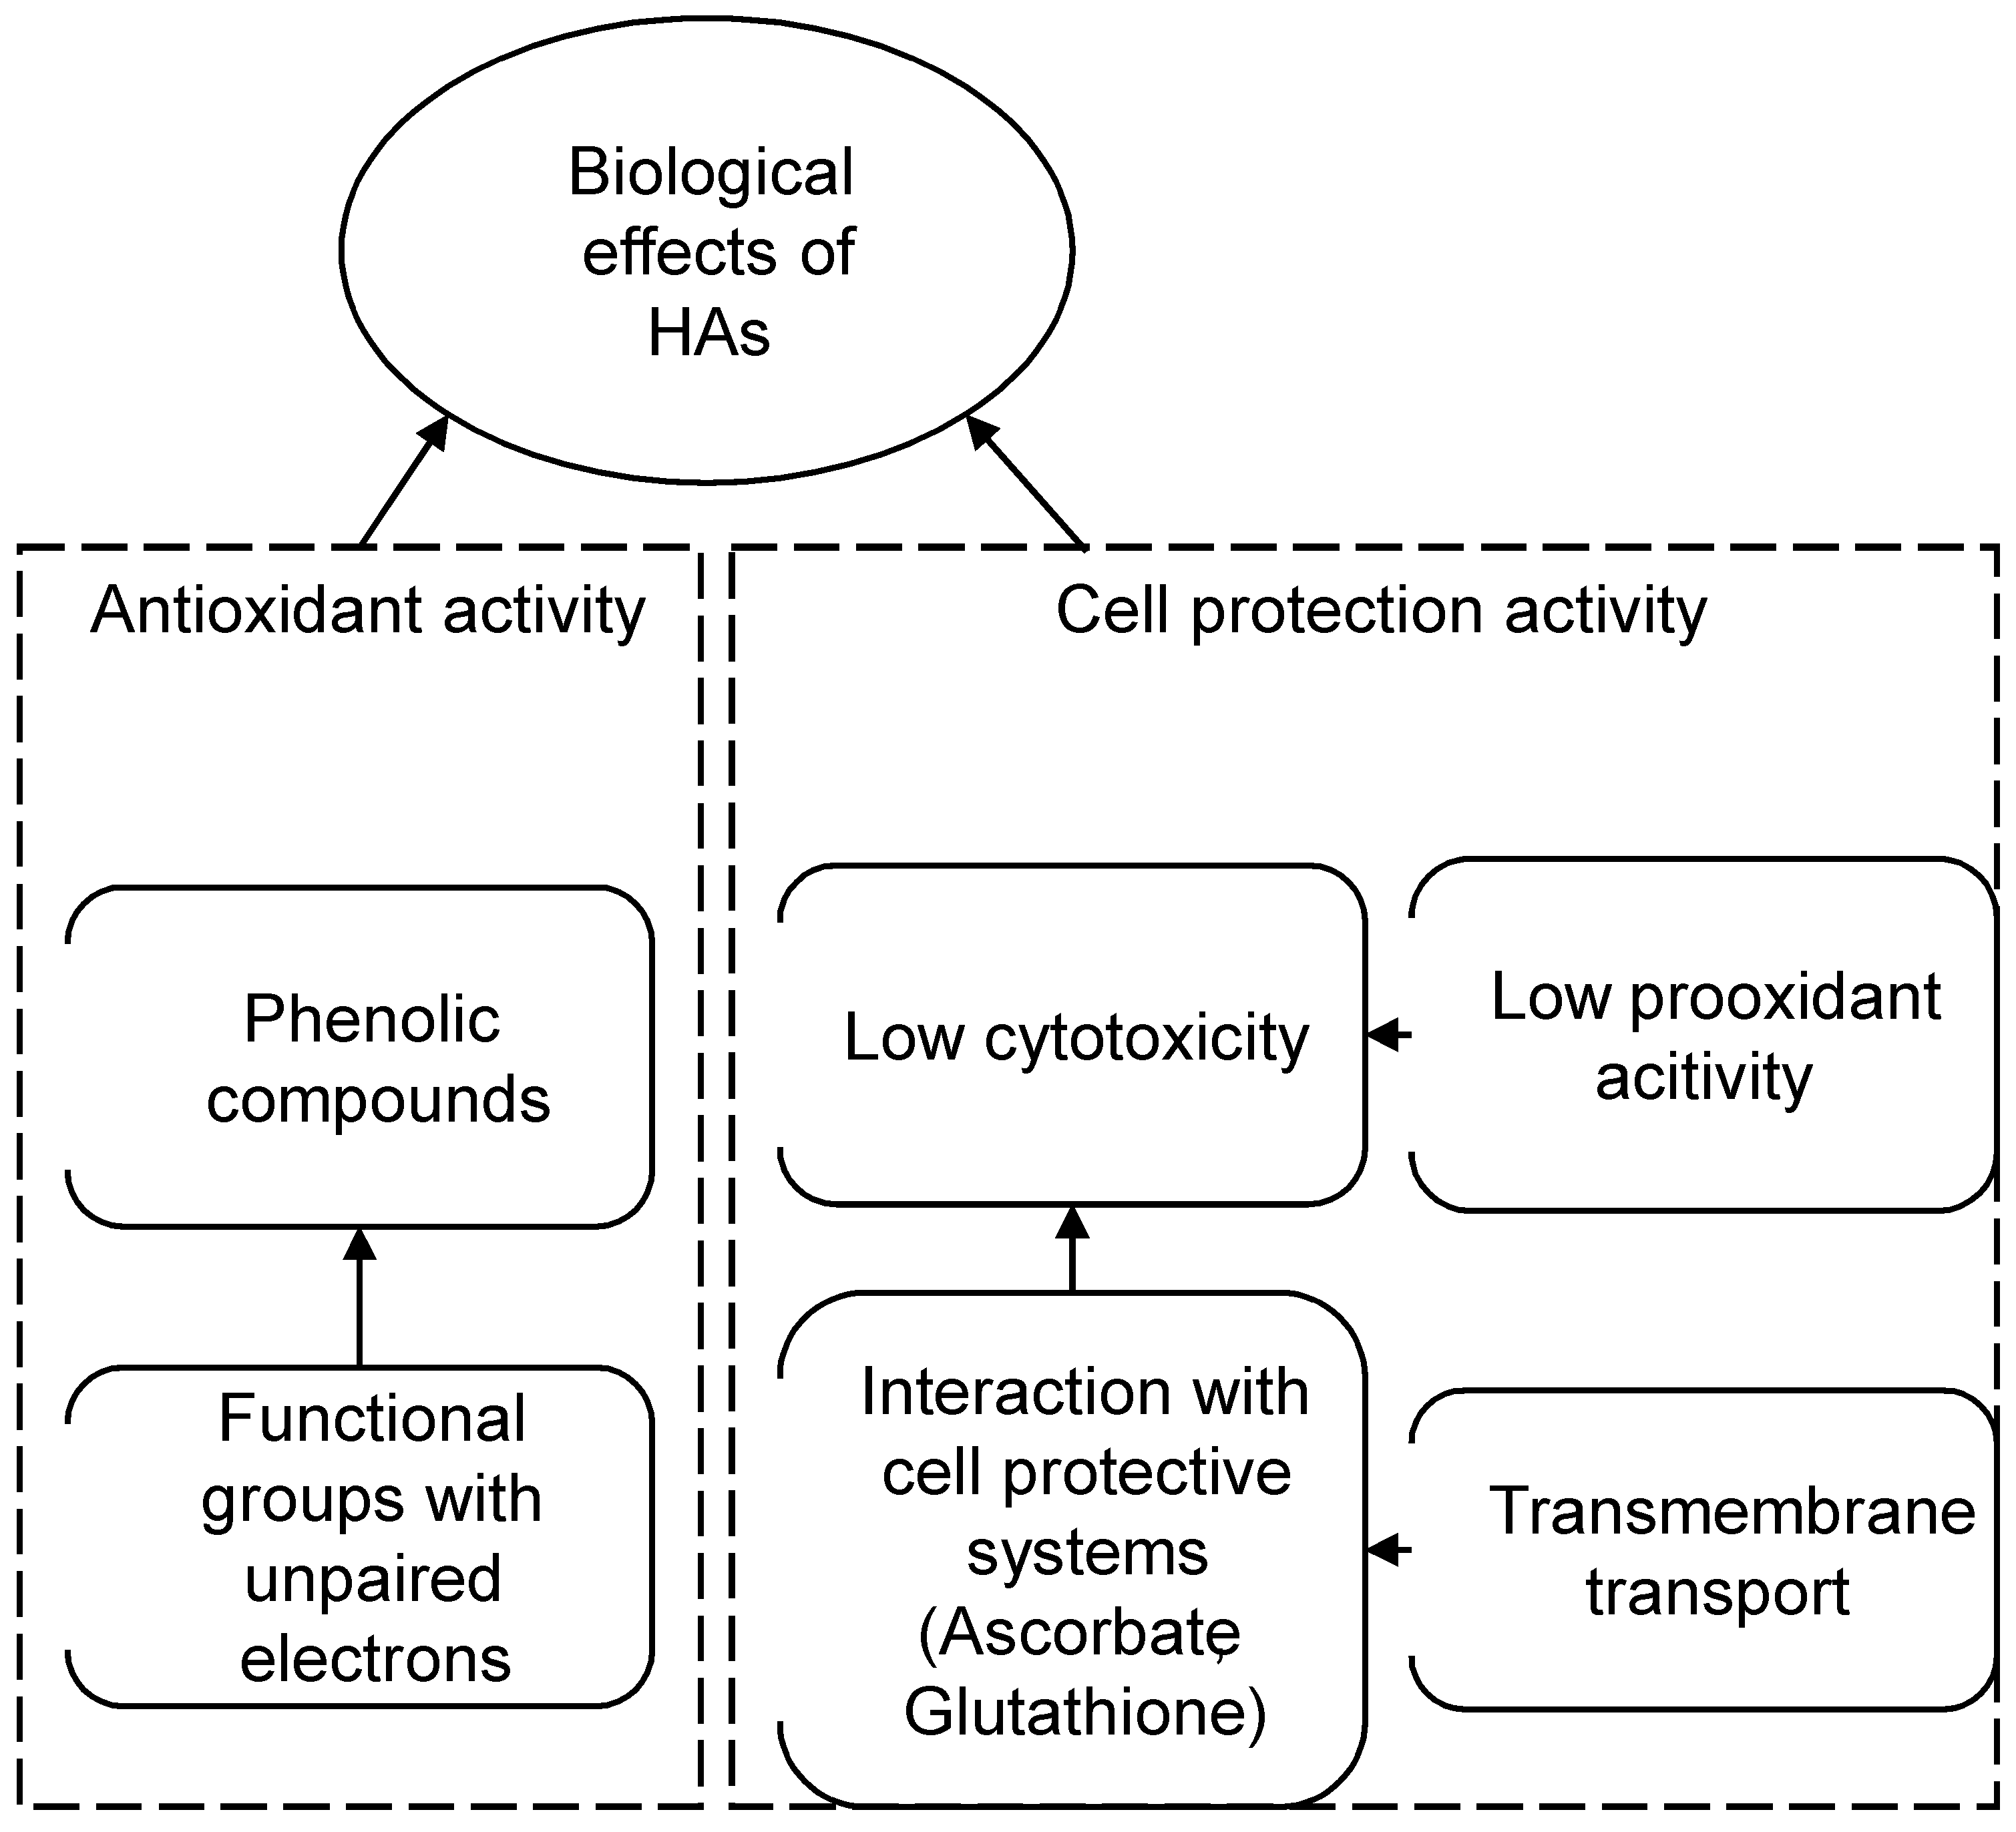
- High antioxidant activity that depends on concentration of phenolic components;
- The ability of HAs to permeate a cell membrane and, possibly, interact with intracellular protective systems;
- Low cytotoxicity even in very high concentration.
3.3. Ontology-Based Model of the Antioxidant and Cytoprotective Activity
4. Discussion
5. Conclusions
Supplementary Materials
Author Contributions
Funding
Institutional Review Board Statement
Informed Consent Statement
Data Availability Statement
Conflicts of Interest
References
- Droge, W. Free radicals in physiological control of cell function. Physiol. Rev. 2002, 82, 47–95. [Google Scholar] [CrossRef]
- Harman, D. Origin and evolution of the free radical theory of aging: A brief personal history. Biogerontology 2009, 6, 1954–2009. [Google Scholar]
- Xie, Z.Z.; Liu, Y.; Bian, J.S. Hydrogen sulfide and cellular redox homeostasis. Oxid. Med. Cell Longev. 2016, 2016, 6043038. [Google Scholar] [CrossRef]
- Buzlama, A.V.; Chernov, U.N. Humic substances: Pharmacological properties, mechanisms of action, and prospects for use in medicine. Eksperimental’naia i klinicheskaia farmakologiia 2010, 73, 43–48. [Google Scholar]
- Zykova, M.V.; Schepetkin, I.A.; Belousov, M.V.; Krivoshchekov, S.V.; Logvinova, L.A.; Bratishko, K.A.; Yusubov, M.S.; Romanenko, S.V.; Quinn, M.T. Physicochemical characterization and antioxidant activity of humic acids isolated from peat of various origins. Molecules 2018, 23, 753. [Google Scholar] [CrossRef]
- Buyko, E.E.; Zykova, M.V.; Ivanov, V.V.; Bratishko, K.A.; Ufandeev, A.A.; Grigorieva, I.O.; Tsupko, A.V.; Mikhalyov, D.A.; Perminova, I.V.; Belousov, M.V. Antioxidant activity of silver-containing bionanocompositions based on humic substances in cell culture. Drug Dev. Regist. 2021, 10, 46–53. [Google Scholar] [CrossRef]
- Klein, O.I.; Kulikova, N.A.; Konstantinov, A.I.; Zykova, M.V.; Perminova, I.V. A systematic study of the antioxidant capacity of humic substances against peroxyl radicals: Relation to structure polymers. Polymers 2021, 13, 3262. [Google Scholar] [CrossRef] [PubMed]
- Bratishko, K.A.; Zykova, M.V.; Ivanov, V.V.; Buyko, E.E.; Drygunova, L.A.; Perminova, I.V.; Belousov, M.V. Peat humic acids-prospective biologically active substances with antioxidant activity for the development of protective agents. Khimiya Rastitel’nogo Syr’ya 2021, 1, 287–298. [Google Scholar] [CrossRef]
- Zykova, M.V.; Belousov, M.V.; Logvinova, L.A.; Lasukova, T.V.; Gorbunov, A.S.; Dygai, A.M. Cardiovascular effects of high-molecular-weight compounds of humic nature. Bull. Exp. Biol. Med. 2017, 163, 206–209. [Google Scholar] [CrossRef]
- Vaškova, J.; Veliká, B.; Pilátová, M.; Kron, I.; Vaško, L. Effects of humic acid in vitro. In Vitro Cell. Dev. Biol. 2011, 47, 378–382. [Google Scholar] [CrossRef]
- Piotrowska, D.; Dlugosz, A.; Witkiewicz, K.; Pajak, J. The research on antioxidative properties of Tolpa Peat Preparation and its fractions. Acta. Pol. Pharm. 2000, 57, 127–129. [Google Scholar]
- Vetvicka, V.; Vashishta, A.; Fuentes, M.; Baigorri, R.; Jose, M.G.M.; Yvin, J.C. The relative abundance of oxygen alkyl-related groups in aliphatic domains is involved in the main pharmacological-pleiotropic effects of humic acids. J. Med. Food 2013, 16, 625–632. [Google Scholar] [CrossRef]
- Maslinski, C.; Fogel, W.A.; Andjewski, W. The influence of Tolpa Peat Preparation on rat liver regeneration. Acta Pol. Pharm. 1995, 50, 413–416. [Google Scholar]
- Ozcan, A.; Sen, H.M.; Sehitoglu, I.; Alacam, H.; Guven, M.; Aras, A.B.; Akman, T.; Silan, C.; Cosar, M.; Karama, H.I.O. Neuroprotective effect of humic acid on focal cerebral ischemia injury: An experimental study on rats. Inflammation 2015, 38, 32–39. [Google Scholar] [CrossRef]
- Akbas, A.; Silan, C.; Gulpinar, M.T.; Sancak, E.B.; Ozkanli, S.S.; Cakir, D.U. Renoprotective effect of humic acid on renal ischemia-reperfusion injury: An experimental study in rats. Inflammation 2015, 38, 2042–2048. [Google Scholar] [CrossRef]
- Wollina, U. The response of erythematous rosacea to ondasentron. Br. J. Derm. 1999, 140, 561–562. [Google Scholar] [CrossRef]
- Belousov, M.V.; Akhmedzhanov, R.R.; Zykova, M.V.; Vasil’ev, K.Y.; Yusubov, M.S. Effect of native humic acids from Tomsk region lowland peat on mitochrondrial oxidative phosphorylation under hypoxic conditions. Pharm. Chem. J. 2015, 49, 250–253. [Google Scholar] [CrossRef]
- Van Rensburg, C.E.J.; Snyman, J.R.; Mokoele, T.; Cromaty, A.D. Brown coal derived humate inhibits contact hypersensitivity, an efficacy, toxicity and teragenicity study in rats. Inflammation 2007, 30, 148–152. [Google Scholar] [CrossRef]
- Juszkiewicz, M.; Minta, B.; Włodarczyk, M.; Biernacki, B.; Zmudzki, J. Studies of the embryotoxic and teratogenic effects of Tolpa Peat Preparation. Acta Pol. Pharm. 1993, 50, 383–388. [Google Scholar]
- Zraly, Z.; Pisarikova, B.; Trckova, M.; Navratilova, M. Effect of humic acids on lead accumulation in chicken organs and muscles. Acta Vet. Brno 2008, 77, 439–445. [Google Scholar] [CrossRef]
- Davies, G.; Ghabbour, E.A. Humic Substances, Structeres, Properties and Uses; The Royal Society of Chemistry: Cambridge, UK, 1998; p. 260. [Google Scholar]
- Mirza, M.A.; Ahmad, N.; Agarwal, S.P.; Mahmood, D.; Anwer, M.K.; Iqbal, Z. Comparative evaluation of humic substances in oral drug delivery. Results Pharma. Sci. 2011, 1, 16–26. [Google Scholar] [CrossRef]
- Karadirek, S.; Kanmaz, N.; Balta, Z.; Demircivi, P.; Uzer, A.; Hizal, J.; Apak, R. Determination of total antioxidant capacity of humic acids using CUPRAC, Folin-Ciocalteu, noble metal nanoparticle- and solid-liquid extraction-based methods. Talanta 2016, 153, 120–129. [Google Scholar] [CrossRef]
- Renganathan, V. Overview of artificial neural network models in the biomedical domain. Bratisl. Med. J. 2019, 120, 536–540. [Google Scholar] [CrossRef]
- Serrano, D.; Golpour, I.; Sánchez-Delgado, S. Predicting the effect of bed materials in bubbling fluidized bed gasification using artificial neural networks (ANNs) modeling approach. Fuel 2020, 266, 117021. [Google Scholar] [CrossRef]
- Cabrera, Á.C.; Prieto, J. Application of artificial neural networks to the prediction of the antioxidant activity of essential oils in two experimental in vitro models. Food Chem. 2010, 118, 141–146. [Google Scholar] [CrossRef]
- Kovačević, S.Z.; Tepić, A.N.; Jevrić, L.R.; Podunavac-Kuzmanović, S.O.; Vidović, S.S.; Šumić, Z.M.; Ilin, Ž.M. Chemometric guidelines for selection of cultivation conditions influencing the antioxidant potential of beetroot extracts. Comput. Electron. Agric. 2015, 118, 332–339. [Google Scholar] [CrossRef]
- Cimpoiu, C.; Cristea, V.-M.; Hosu, A.; Sandru, M.; Seserman, L. Antioxidant activity prediction and classification of some teas using artificial neural networks. Food Chem. 2011, 127, 1323–1328. [Google Scholar] [CrossRef]
- Golpour, I.; Ferrão, A.C.; Gonçalves, F.; Correia, P.M.R.; Blanco-Marigorta, A.M.; Guiné, R.P.F. Extraction of phenolic compounds with antioxidant activity from strawberries: Modelling with artificial neural networks (ANNs). Foods 2021, 10, 2228. [Google Scholar] [CrossRef]
- Gutés, A.; Céspedes, F.; Alegret, S.; Del Valle, M. Determination of phenolic compounds by a polyphenol oxidase amperometric biosensor and artificial neural network analysis. Biosens. Bioelectron. 2005, 20, 1668–1673. [Google Scholar] [CrossRef]
- Peña-Méndez, E.M.A.; Novotná, K.; Gajdosová, D.; González, V.; Havel, J. Characterization of humic substances of different origin by means of mass spectrometry and neural networks. Chemosphere 2007, 68, 2047–2053. [Google Scholar] [CrossRef] [PubMed]
- Al-Abri, M.; Anezi, K.A.; Dakheel, A.; Hilal, N. Humic substance coagulation: Artificial neural network simulation. Desalination 2010, 253, 153–157. [Google Scholar] [CrossRef]
- Genuino, D.A.D.; Bataller, B.G.; Capareda, S.; Luna, M.D. Application of artificial neural network in the modeling and optimization of humic acid extraction from municipal solid waste biochar. J. Environ. Chem. Eng. 2017, 5, 4101–4107. [Google Scholar] [CrossRef]
- Hategan, A.R.; Puscas, R.; Cristea, G.; Dehelean, A.; Guyon, F.; Molnar, A.J.; Mirel, V.; Magdas, D.A. Opportunities and constraints in applying artificial neural networks (ANNs) in food authentication. Honey—A case study. Appl. Sci. 2021, 11, 6723. [Google Scholar] [CrossRef]
- Zykova, M.V.; Brazovsky, K.S.; Veretennikova, E.E.; Danilets, M.G.; Logvinova, L.A.; Romanenko, S.V.; Trofimova, E.S.; Ligacheva, A.A.; Bratishko, K.A.; Yusubov, M.S.; et al. New artificial network model to estimate biological activity of peat humic acids. Environ. Res. 2020, 191, 109999. [Google Scholar] [CrossRef]
- Savy, D.; Brostaux, Y.; Cozzolino, V.; Delaplace, P.; Du Jardin, P.; Piccolo, A. Quantitative structure-activity relationship of humic-like biostimulants derived from agro-industrial byproducts and energy crops. Front. Plant Sci. 2020, 11, 581. [Google Scholar] [CrossRef]
- Monda, H.; McKenna, A.M.; Fountain, R.; Lamar, R.T. Bioactivity of humic acids extracted from shale ore: Molecular characterization and structure-activity relationship with tomato plant yield under nutritional stress. Front. Plant. Sci. 2021, 12, 958. [Google Scholar] [CrossRef]
- Zhernov, Y.V.; Konstantinov, A.I.; Zherebker, A.; Nikolaev, E.; Orlov, A.; Savinykh, M.I.; Kornilaeva, G.V.; Karamov, E.V.; Perminova, I.V. Antiviral activity of natural humic substances and shilajit materials against HIV-1: Relation to structure. Environ. Res. 2021, 193, 110312. [Google Scholar] [CrossRef]
- Calvanese, D.; Giacomo, G.D.; Lembo, D.; Lenzerini, M.; Rosati, R. Ontology-Based Data Access and Integration. In Encyclopedia of Database Systems; Liu, L., Özsu, M.T., Eds.; Springer Publishing Company, Inc.: Chelsea, MI, USA, 2018; pp. 2590–2596. [Google Scholar]
- Markov, V.D.; Ospennikova, L.A.; Skobeyeva, Y.I.; Matukhina, V.G.; Inysheva, L.I.; Lapshina, Y.D.; Mikhantyeva, L.S. General review of West-Siberian mires. Glob. Peat Resour. Jyska 1996, 2, 203–207. [Google Scholar]
- Fooken, U.; Liebezeit, G. An IR study of humic acids isolated from sediments and soils. Senckenbergiana Maritima 2003, 32, 183–189. [Google Scholar] [CrossRef]
- Kovalevskii, D.V.; Permin, A.B.; Perminova, I.V.; Petrosyan, V.S. Conditions for acquiring quantitative 13C NMR spectra of humic substances. Mosc. Univ. Chem. Bull. 2000, 41, 39–42. [Google Scholar]
- Korotkova, E.I.; Karbainov, Y.A.; Avramchik, O.A. Investigation of antioxidant and catalytic properties of some biologically active substances by voltammetry. Anal. Bioanal. Chem. 2003, 375, 465–468. [Google Scholar] [CrossRef] [PubMed]
- Bentayeb, K.; Rubio, C.; Nerín, C. Study of the antioxidant mechanisms of Trolox and eugenol with 2, 2′-azobis (2-amidinepropane) dihydrochloride using ultra-high performance liquid chromatography coupled with tandem mass spectrometry. Analyst 2012, 137, 459–470. [Google Scholar] [CrossRef] [PubMed]
- Schepetkin, I.; Potapov, A.; Khlebnikov, A.; Korotkova, E.; Lukina, A.; Malovichko, G.; Kirpotina, L.; Quinn, M.T. Decomposition of reactive oxygen species by copper(II) bis(1-pyrazolyl)methane complexes. JBIC J. Biol. Inorg. Chem. 2006, 11, 499–513. [Google Scholar] [CrossRef] [PubMed]
- Mahakunakorn, P.; Tohda, M.; Murakami, Y.; Matsumoto, K.; Watanabe, H. Antioxidant and free radical-scavenging activity of Choto-san and its related constituents. Biol. Pharm. Bull. 2004, 27, 38–46. [Google Scholar] [CrossRef]
- Repetto, G.; Del Peso, A.; Zurita, J.L. Neutral red uptake assay for the estimation of cell viability/cytotoxicity. Nat. Protoc. 2008, 3, 1125–1131. [Google Scholar] [CrossRef]
- Yang, M.L.; Huang, T.S.; Lee, Y.; Chen, T.H.; Chen, S.Y.; Lu, F.J. Inhibition of endogenous thyroid hormone receptor-β and peroxisome proliferator-activated receptor-α activities by humic acid in a human-derived liver cell line. Thyroid 2002, 12, 361–371. [Google Scholar] [CrossRef]
- Cao, H.; Yang, L.; Tian, R.; Wu, H.; Gu, Z.; Li, Y. Versatile polyphenolic platforms in regulating cell biology. Chem. Soc. Rev. 2022, 51, 4175–4198. [Google Scholar] [CrossRef]


| Peat Type | Sample Name | Sampling Depth (cm) | Degree of Decay (%) |
|---|---|---|---|
| Raised bog sphagnum | Peat 1 | 20–70 | 5–10 |
| Raised bog pine-cotton-grass | Peat 2 | 10–50 | 30–35 |
| Raised bog magellanicum | Peat 3 | 20–70 | 10–15 |
| Raised bog fuscum | Peat 4 | 20–70 | 5–10 |
| Low-mire woody | Peat 5 | 10–50 | 25–30 |
| Low-mire grass-moss | Peat 6 | 200–250 | 35–50 |
| Low-mire grass | Peat 7 | 230–270 | 40–45 |
| Low-mire woody peat | Peat 8 | 50–100 | 30–35 |
| Mesotrophic carex peat | Peat 9 | 150–200 | 40–45 |
| Parameter | Min | Max |
|---|---|---|
| DPPH | 5.2 | 20.8 |
| ABTS | 10.6 | 28.5 |
| Fe chelating | 26.9 | 100.0 |
| OH | 240.0 | 2590.0 |
| Superoxide | 3.9 | 38.1 |
| Parameter | r | R2 | p Value |
|---|---|---|---|
| DPPH | −0.27 | 0.01 | 0.279 |
| ABTS | 0.30 | 0.03 | 0.222 |
| Fe chelating | 0.24 | 0.01 | 0.343 |
| OH | −0.14 | 0.04 | 0.588 |
| Superoxide | −0.03 | 0.06 | 0.903 |
| Parameter | r | R2 | p Value |
|---|---|---|---|
| DPPH | 0.07 | 0.05 | 0.781 |
| ABTS | −0.20 | 0.01 | 0.451 |
| Fe chelating | −0.18 | 0.02 | 0.464 |
| OH | 0.04 | 0.06 | 0.980 |
| Superoxide | −0.03 | 0.06 | 0.887 |
| Parameter | r | R2 | p Value |
|---|---|---|---|
| DPPH | −0.6 | 0.3 | 0.008 * |
| ABTS | 0.07 | 0.05 | 0.768 |
| Fe chelating | 0.13 | 0.04 | 0.600 |
| OH | −0.17 | 0.02 | 0.484 |
| Superoxide | −0.26 | 0.01 | 0.291 |
| Parameter | r | R2 | p Value |
|---|---|---|---|
| DPPH | 0.31 | 0.02 | 0.459 |
| ABTS | 0.64 | 0.33 | 0.02 * |
| Fe chelating | 0.70 | 0.42 | 0.007 * |
| OH | 0.57 | 0.24 | 0.049 * |
| Superoxide | 0.73 | 0.48 | 0.002 * |
Publisher’s Note: MDPI stays neutral with regard to jurisdictional claims in published maps and institutional affiliations. |
© 2022 by the authors. Licensee MDPI, Basel, Switzerland. This article is an open access article distributed under the terms and conditions of the Creative Commons Attribution (CC BY) license (https://creativecommons.org/licenses/by/4.0/).
Share and Cite
Zykova, M.V.; Brazovskii, K.S.; Bratishko, K.A.; Buyko, E.E.; Logvinova, L.A.; Romanenko, S.V.; Konstantinov, A.I.; Krivoshchekov, S.V.; Perminova, I.V.; Belousov, M.V. Quantitative Structure-Activity Relationship, Ontology-Based Model of the Antioxidant and Cell Protective Activity of Peat Humic Acids. Polymers 2022, 14, 3293. https://doi.org/10.3390/polym14163293
Zykova MV, Brazovskii KS, Bratishko KA, Buyko EE, Logvinova LA, Romanenko SV, Konstantinov AI, Krivoshchekov SV, Perminova IV, Belousov MV. Quantitative Structure-Activity Relationship, Ontology-Based Model of the Antioxidant and Cell Protective Activity of Peat Humic Acids. Polymers. 2022; 14(16):3293. https://doi.org/10.3390/polym14163293
Chicago/Turabian StyleZykova, Maria V., Konstantin S. Brazovskii, Kristina A. Bratishko, Evgeny E. Buyko, Lyudmila A. Logvinova, Sergey V. Romanenko, Andrey I. Konstantinov, Sergei V. Krivoshchekov, Irina V. Perminova, and Mikhail V. Belousov. 2022. "Quantitative Structure-Activity Relationship, Ontology-Based Model of the Antioxidant and Cell Protective Activity of Peat Humic Acids" Polymers 14, no. 16: 3293. https://doi.org/10.3390/polym14163293
APA StyleZykova, M. V., Brazovskii, K. S., Bratishko, K. A., Buyko, E. E., Logvinova, L. A., Romanenko, S. V., Konstantinov, A. I., Krivoshchekov, S. V., Perminova, I. V., & Belousov, M. V. (2022). Quantitative Structure-Activity Relationship, Ontology-Based Model of the Antioxidant and Cell Protective Activity of Peat Humic Acids. Polymers, 14(16), 3293. https://doi.org/10.3390/polym14163293