
Evaluation of Physico-Mechanical Properties on Oil Extracted Ground Coffee Waste Reinforced Polyethylene Composite

 , and
, and
Abstract
:1. Introduction

| Fiber | Matrix | Parametric Evaluation | Particle/ Fiber Loading (wt%.) | Finding | Reference |
|---|---|---|---|---|---|
| Coffee chaff and spent ground coffee | PP | Different type of coffee | 26 | Coffee chaff provided greater thermal stability and was suitable for composite reinforcement. | Zarrinbakhsh et al., 2016 [34] |
| Coffee silverskin | PBAT-PHBV | Different filler content | 10, 20 and 30 | Increasing the filler content enhanced Young’s modulus but decreased tensile strength. | Sarasini et al., 2018 [31] |
| Coffee silverskin | PLA and PBS | Different filler content | 10, 20 and 30 | Adding fillers to both matrices improved tensile characteristics. | Totaro et al., 2019 [33] |
| Coffee silverskin | PE | Different filler content | 10, 20 and 30 | Improvement in the elastic modulus and a reduction in strain at maximum stress were observed with the increase in fiber fraction. | Dominici et al., 2019 [30] |
| Green coffee cake | PP | Steam explosion treatment | Nil | The addition of treated fiber increased the thermostability of the composite. | de Brito et al., 2020 [27] |
| Coffee silverskin | HDPE | Different filler content | 1, 2, 5, 10 and 20 | Maximum tensile strength was obtained at 20 wt%. particle loading. | Hejna et al., 2021 [32] |
| Coffee husk fiber waste | PU | Effect of NaOH concentration | 5, 10 and 20 | Increased tensile strength by lowering the NaOH content. | Gonçalves et al., 2021 [29] |
2. Materials and Methods
2.1. Materials
2.2. Methods
2.2.1. Compounding and Compression Molding
2.2.2. Composite Property Testing
- A.
- Fourier Transform Infrared Spectroscopy (FT-IR)
- B.
- Scanning Electron Microscopy (SEM)
- C.
- Thermal Analysis
- Thermogravimetric Analysis (TGA)TGA was performed via Netzsch TG 200 F3 Tarsus (Selb, Germany). Approximately 20 mg of the composite was prepared and put into a crucible. A temperature range from 30 °C to 600 °C was used with a heating rate of 10 °C min−1 in a nitrogen atmosphere. The mass loss, initial degradation temperature (Tonset), maximum degradation temperature (Tmax), and final degradation temperature (Tfinal) were determined.
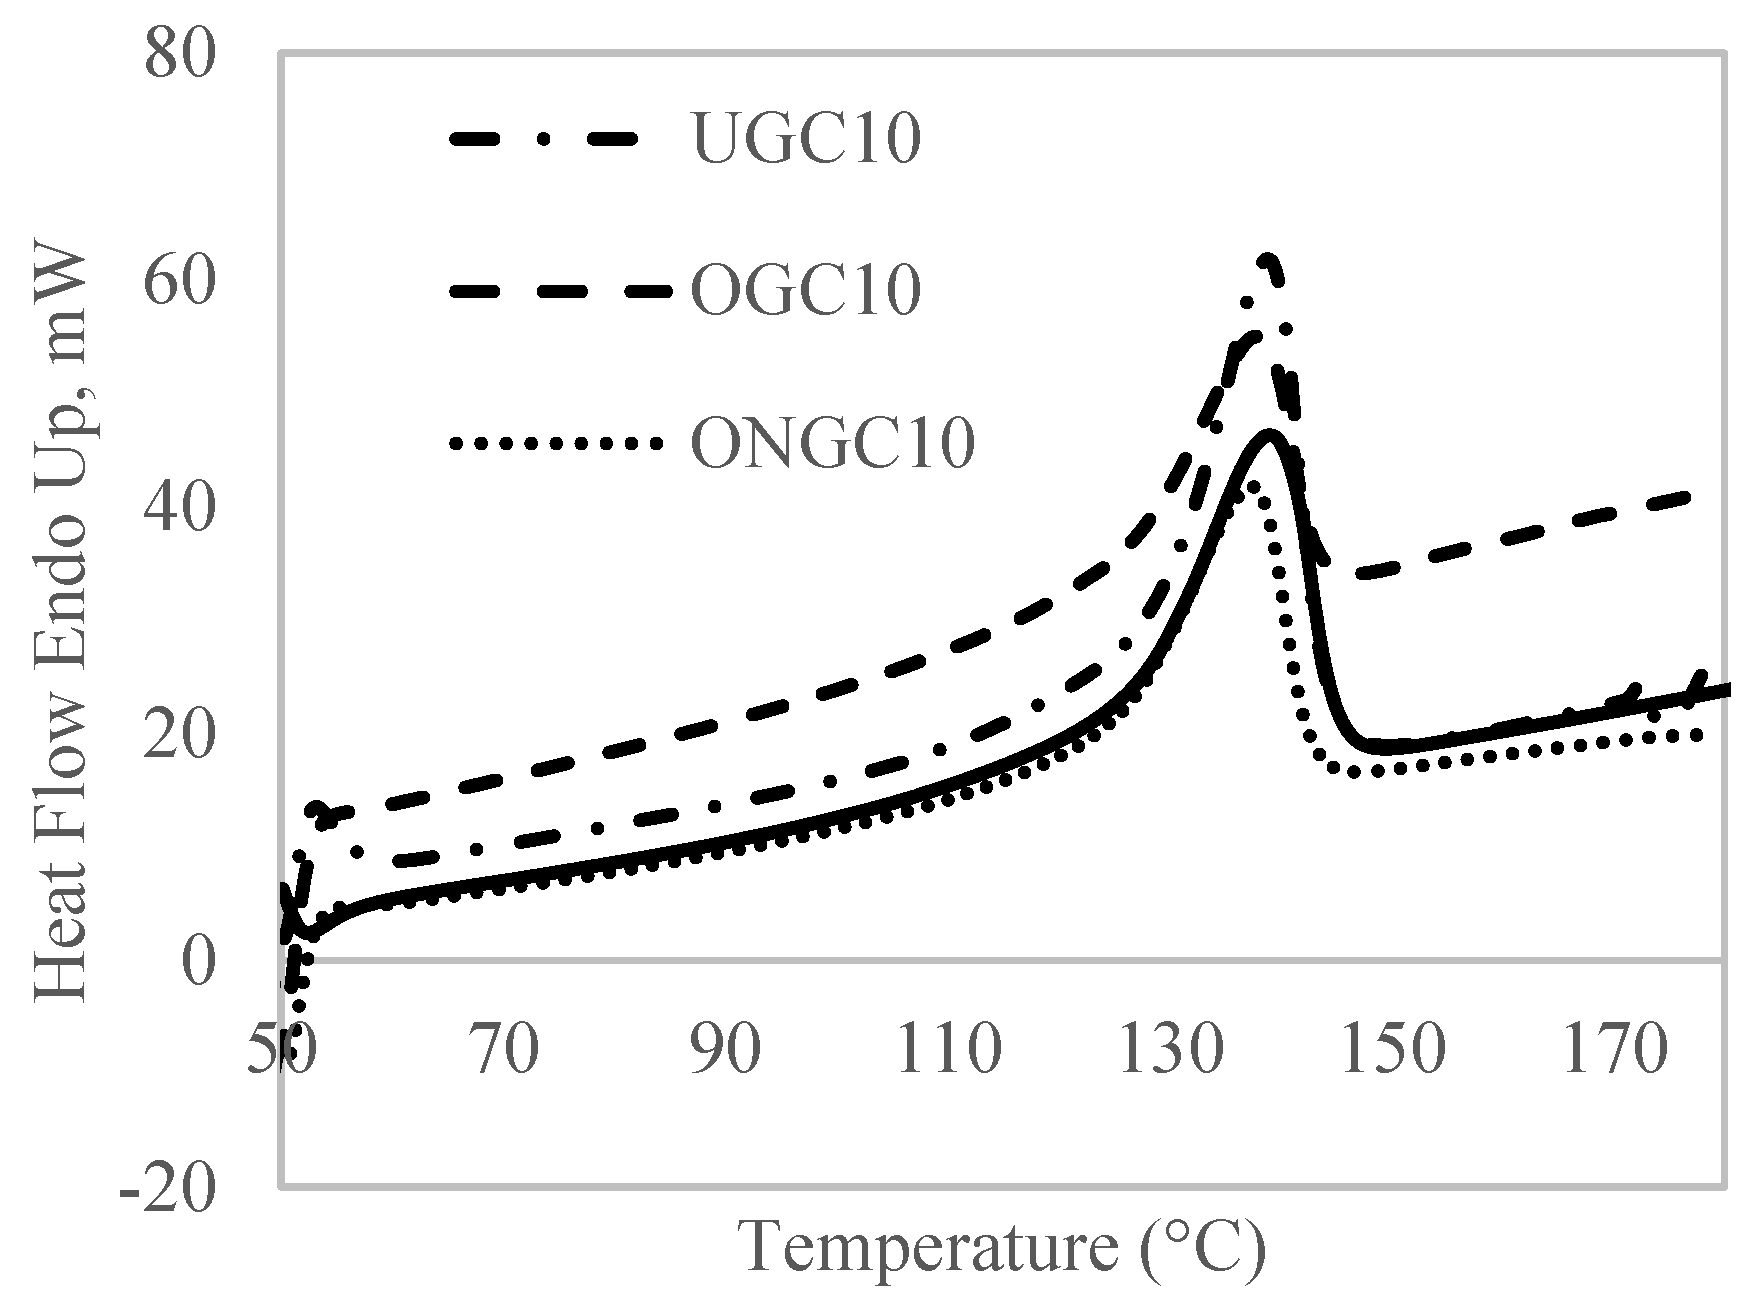
- Differential Scanning Calorimetry (DSC)DSC measurements were performed using Perkin Elmer equipment, DSC 8000 model (MA, USA). Approximately 20 mg of the composite was prepared. A temperature range from 50 °C to 180 °C was used with a heating rate of 20 °C min−1 in a nitrogen atmosphere. The sample was heated from 50 °C to 180 °C, then maintained at 180 °C for 2 min; the second cycle was performed with a cooling rate of 20 °C min−1 until it reached 50 °C; while for the third cycle, the sample was heated from 50 °C to 180 °C at a heating rate of 20 °C min−1. The crystalline melting temperature (Tm) and degree of crystallinity (Xc) of the HDPE were obtained by considering the second heating curves.
- D.
- Mechanical Properties of the Prepared Composites
- Tensile TestingTensile properties were examined using a Shimadzu universal testing machine, model AG-300K IS MS (Kyoto, Japan). Tensile tests were carried out in accordance with ASTM using a load cell of 50 kN at a crosshead rate displacement of 1 mm/min [41]. Tensile strength and tensile modulus were based on initial sample dimensions and the results were averaged over five measurements.
- Impact TestingDart drop impact properties were characterized using Instron 9250 HV (U.S.) in accordance with ASTM D3763-15. A 12.88 mm hemisphere head of 3.4727 kg was employed and a free-falling initial drop height was set at 0.50 m. A total of five different samples were subjected to impact testing. The composites can be tested to assess their resistance to falling weight [42].
- E.
- Water Absorption
3. Results and Discussion
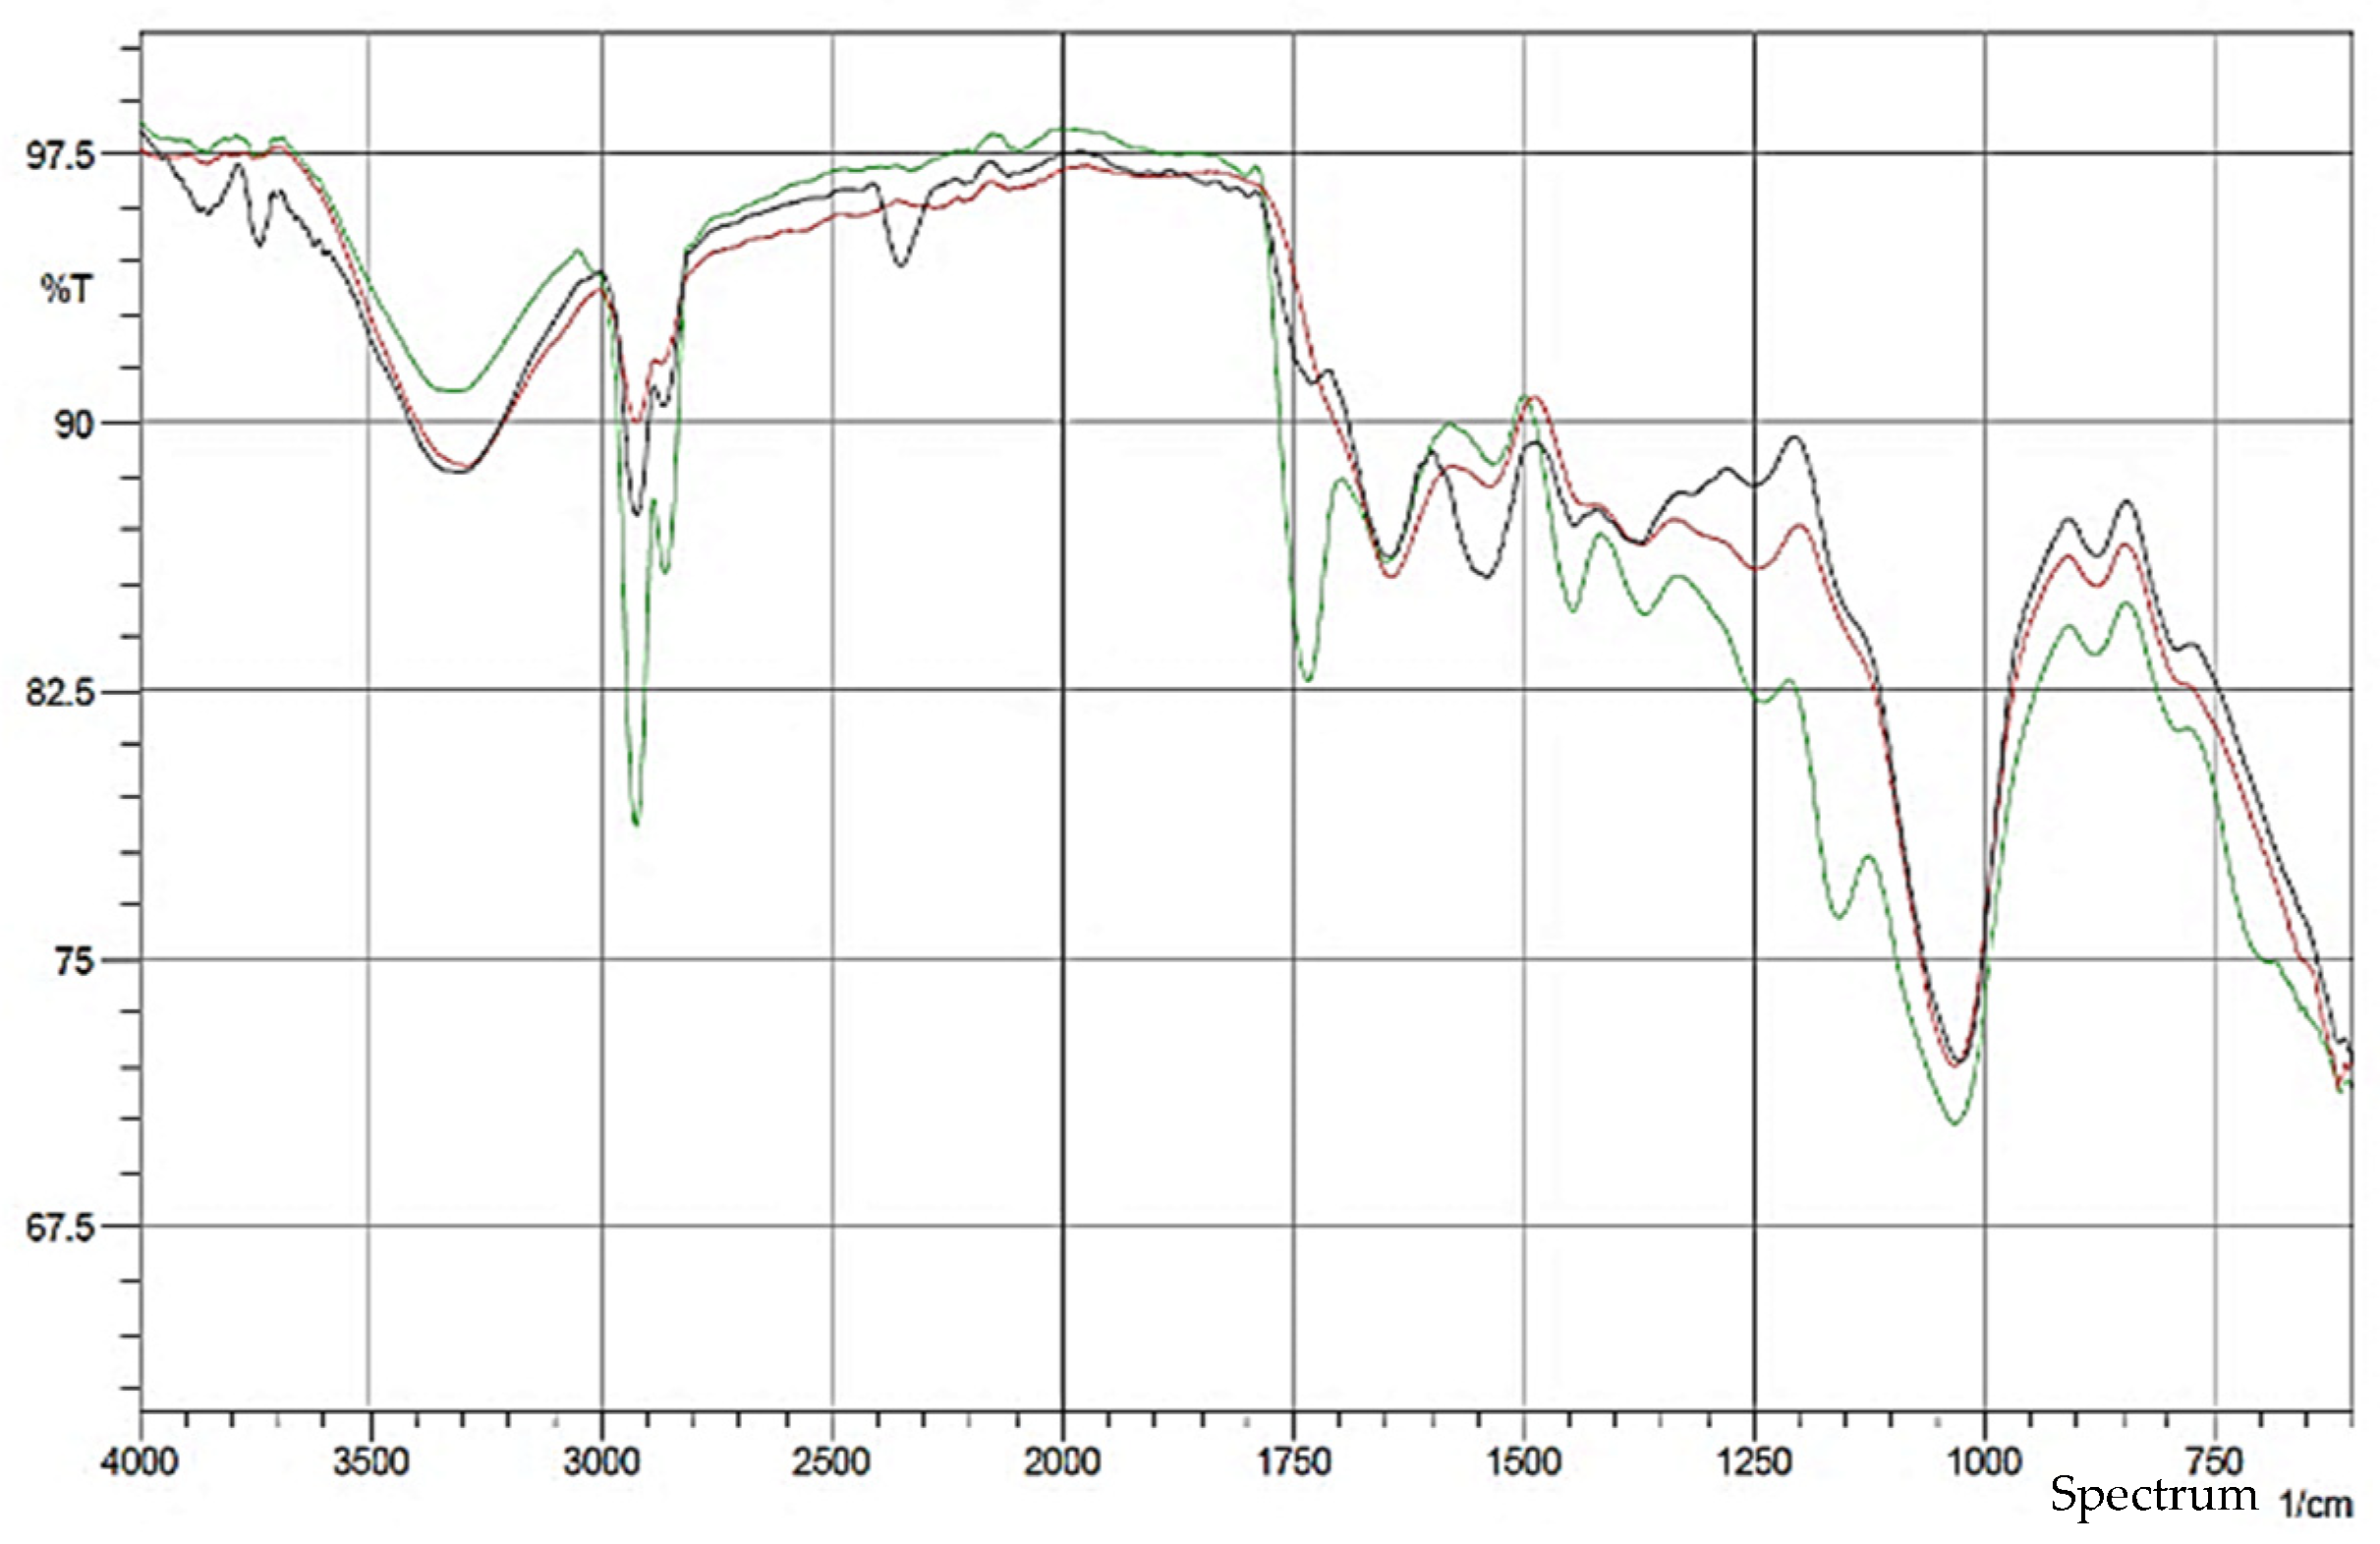
3.1. FT-IR Spectroscopy
3.2. TGA Analysis
3.3. DSC Analysis
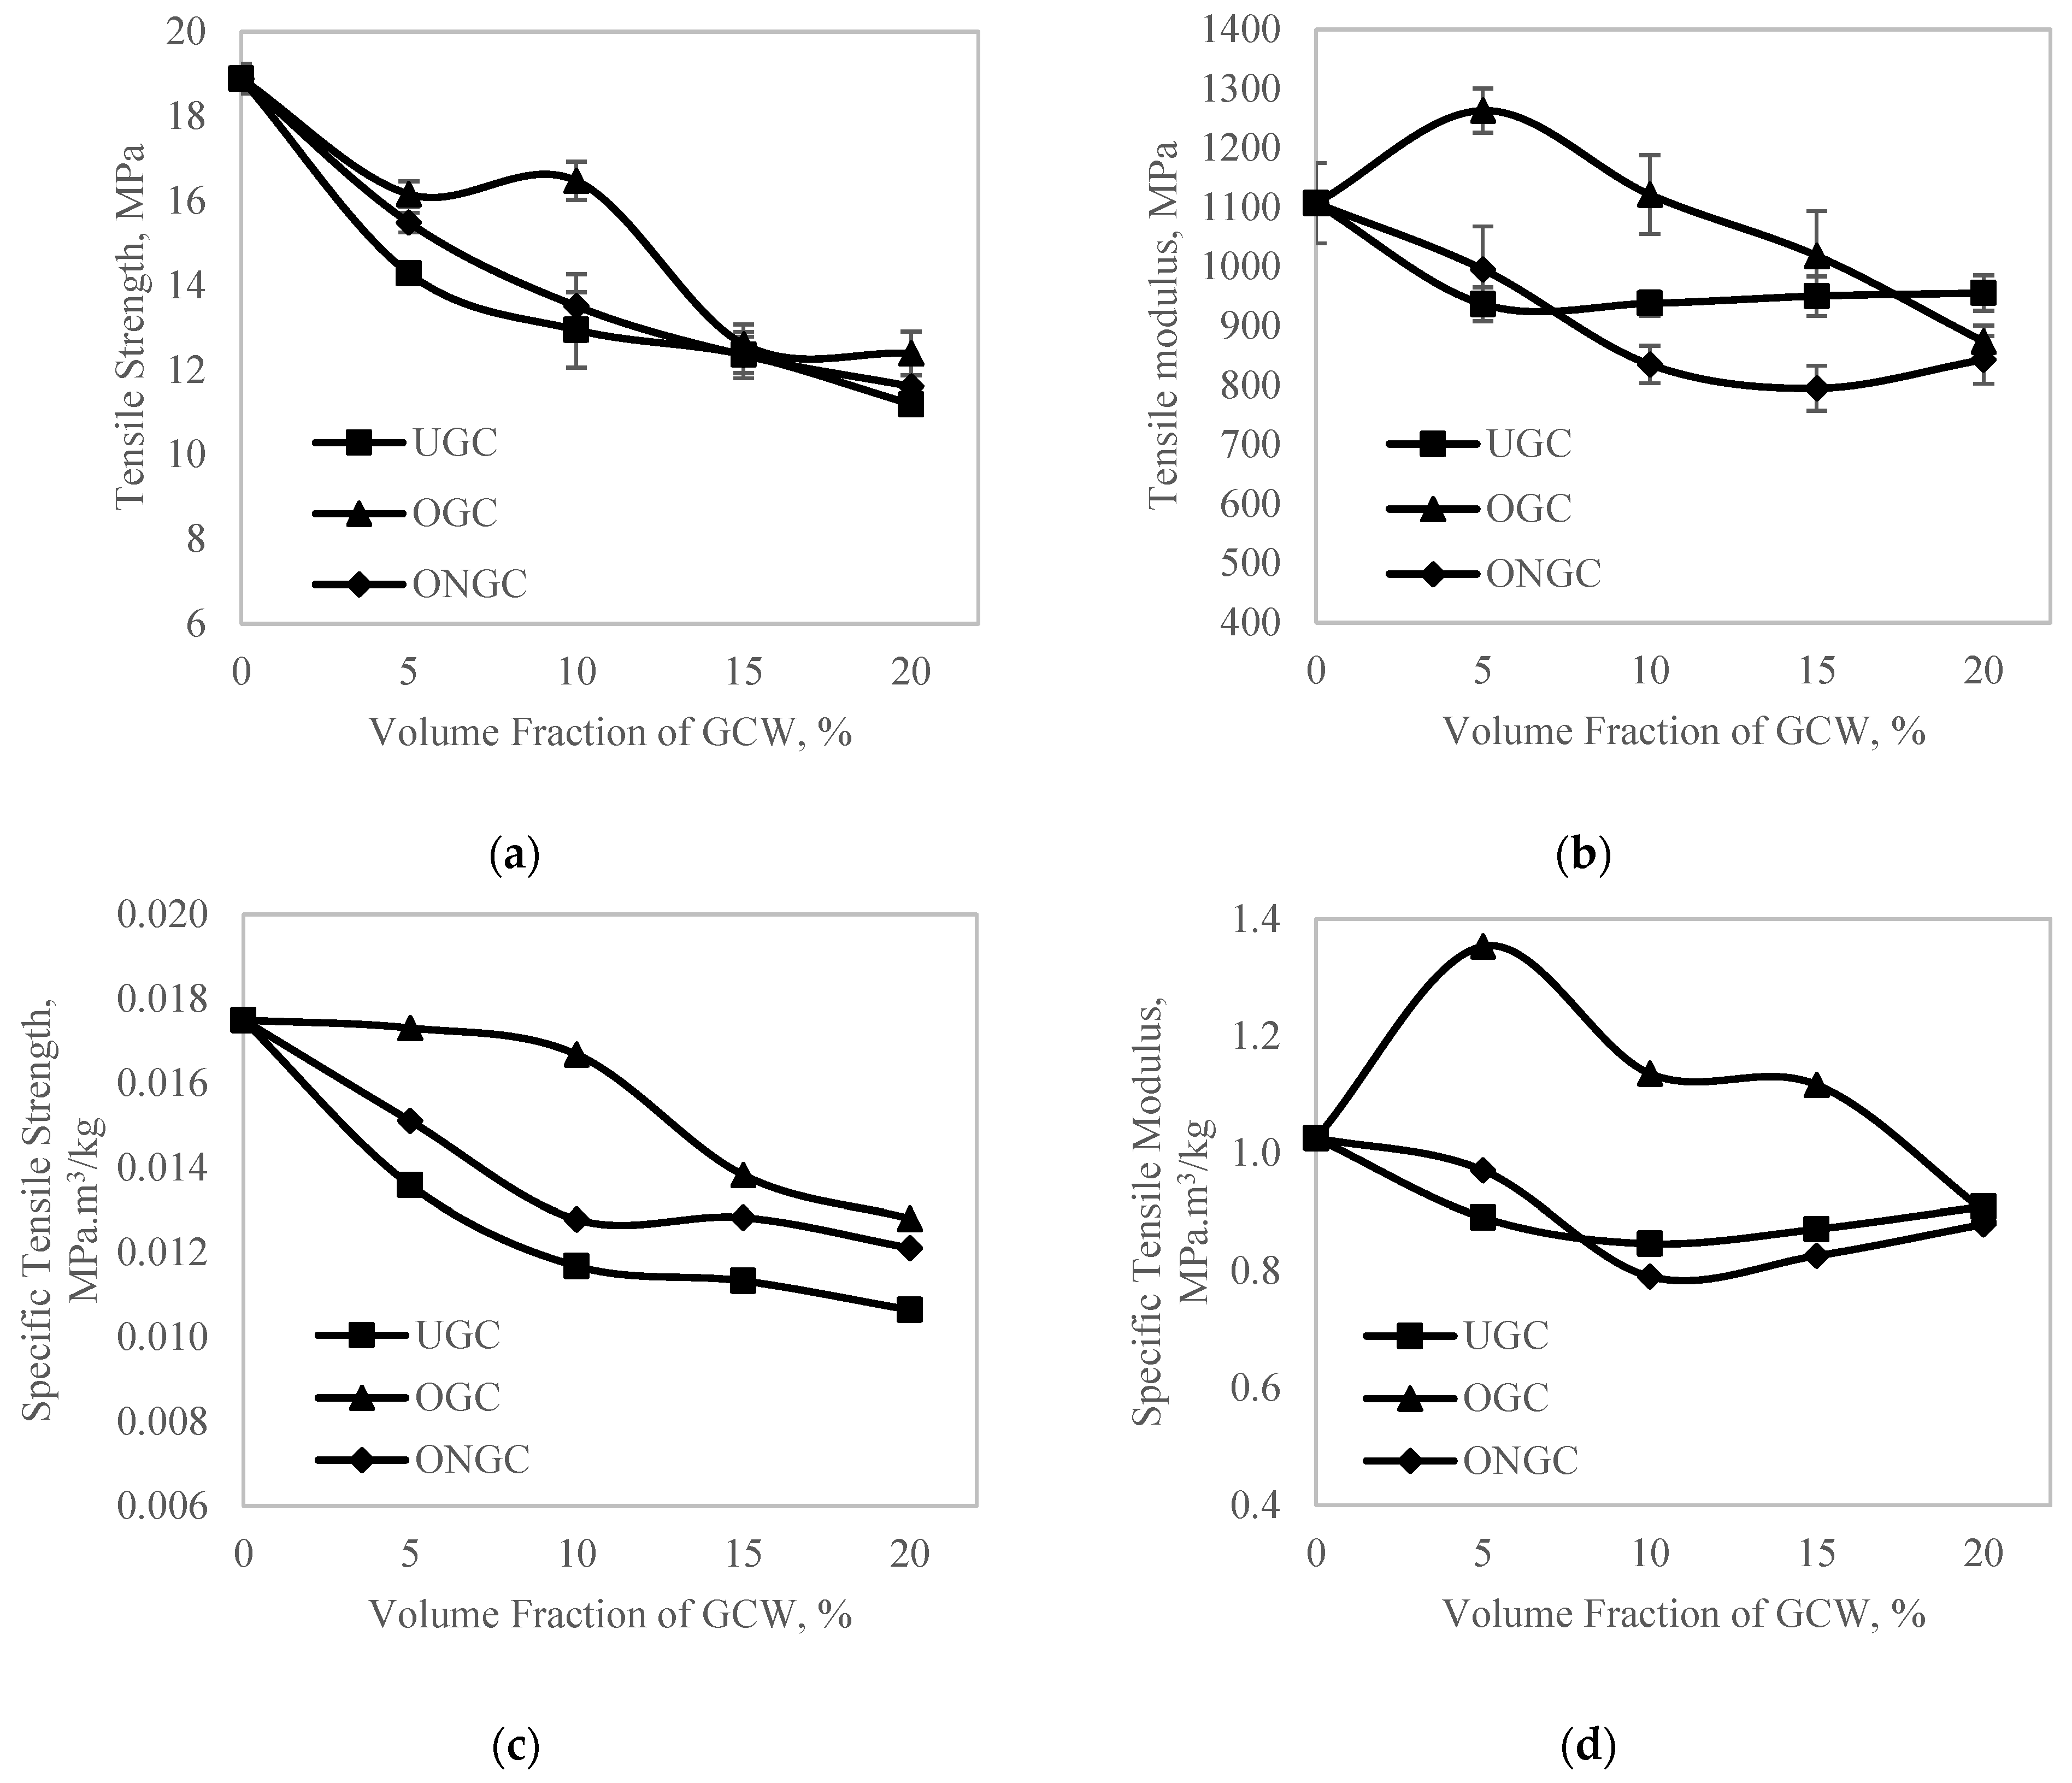
3.4. Tensile
3.5. Impact Test
3.6. Water Absorption
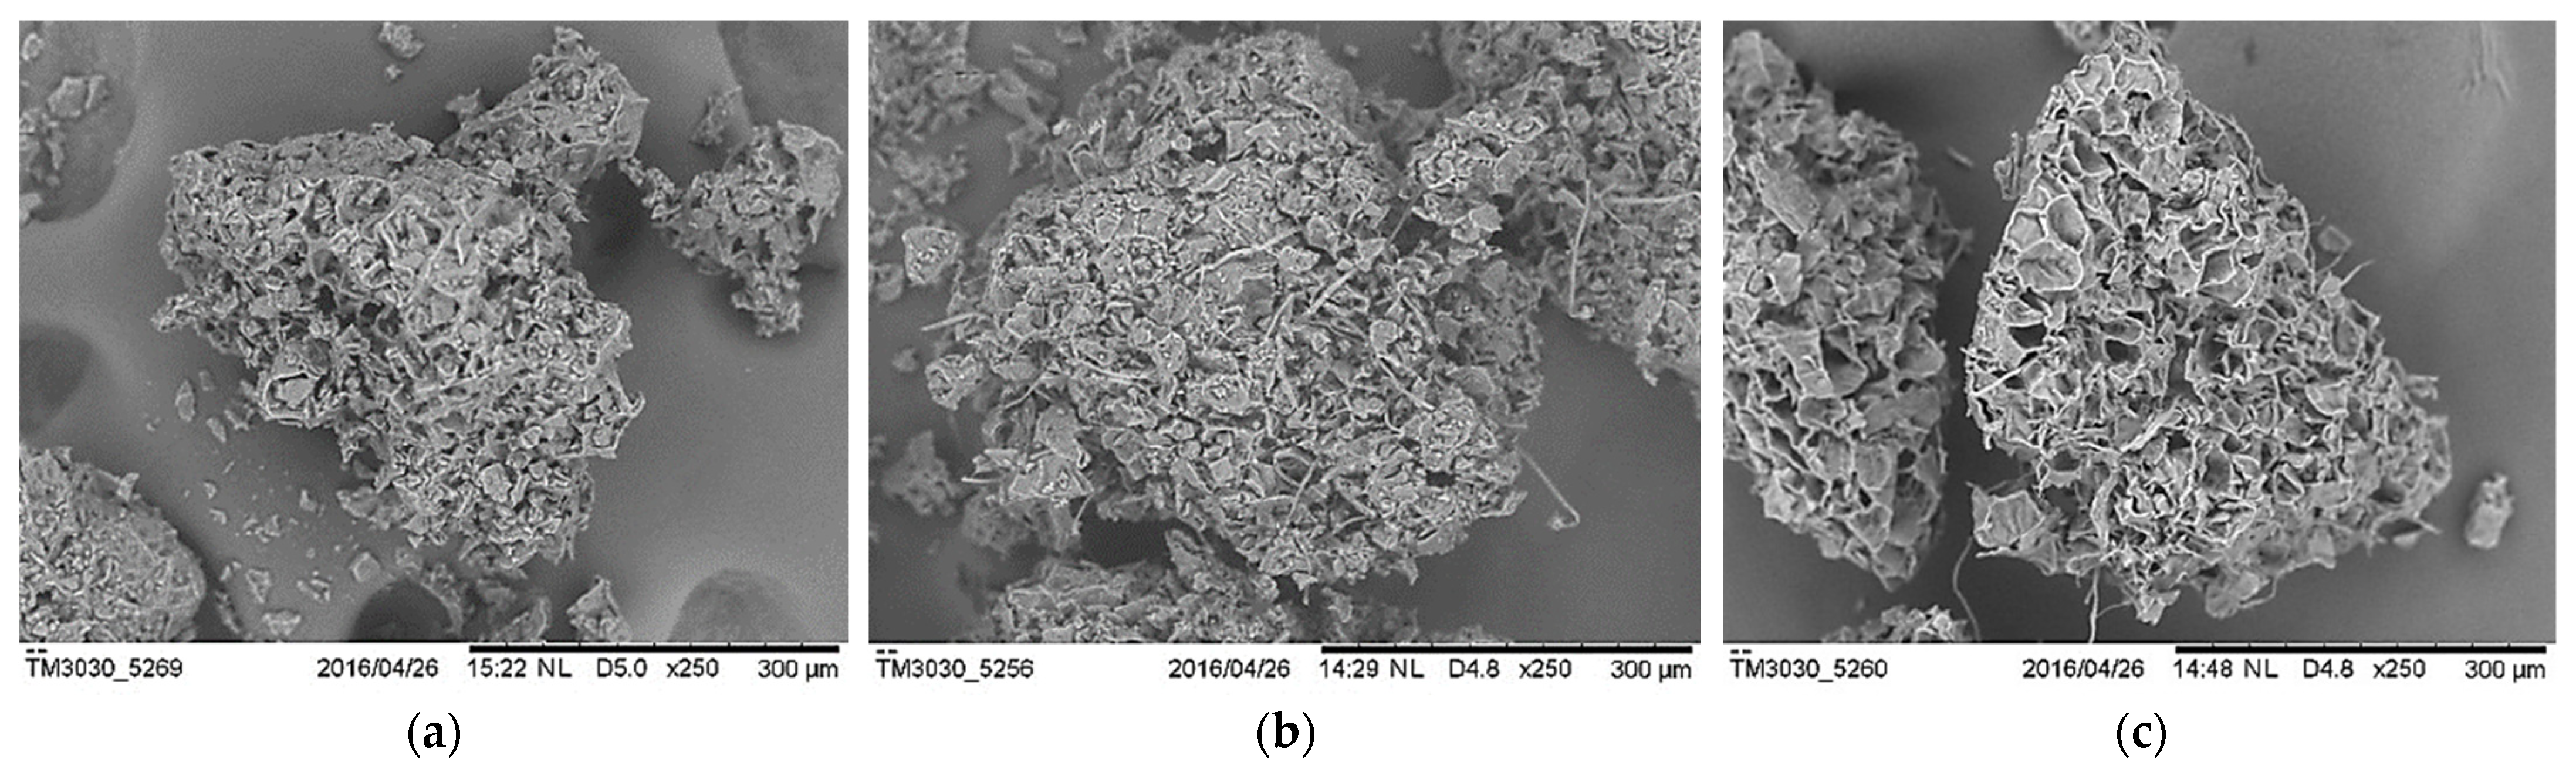
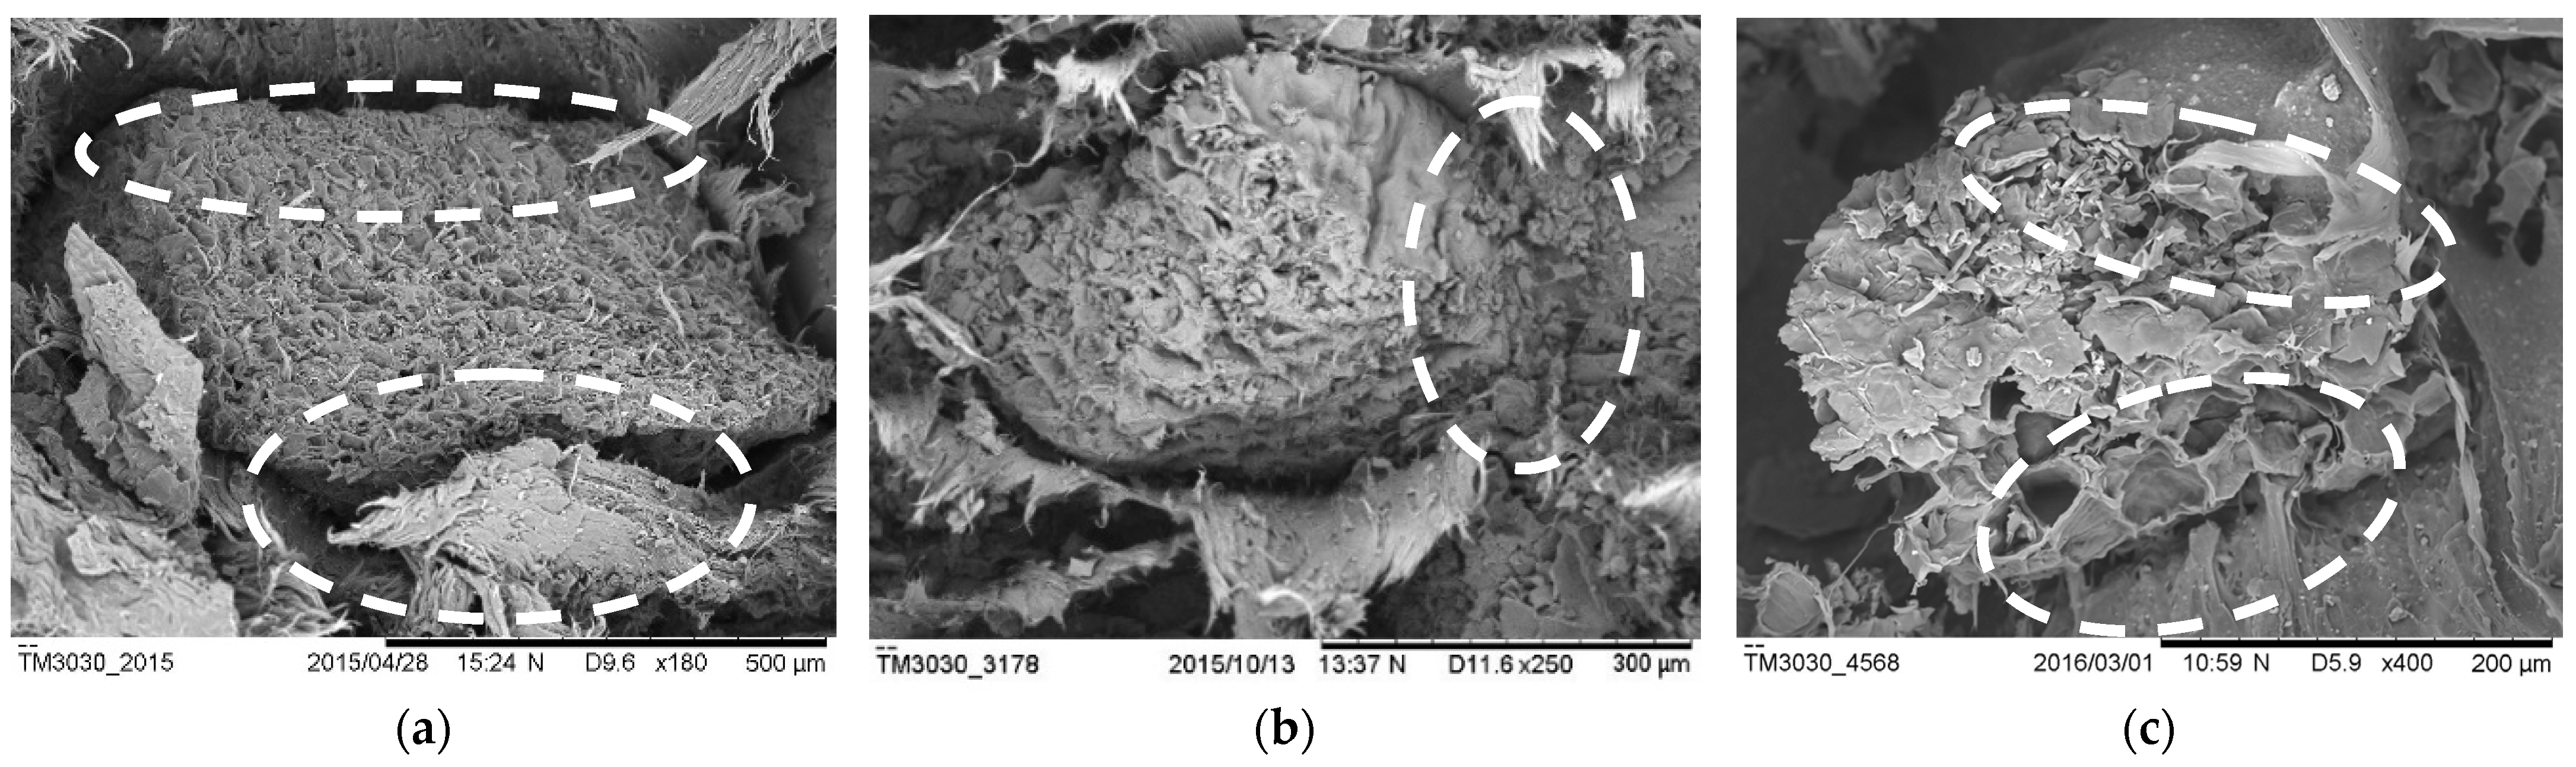
3.7. Morphological Studies
4. Conclusions
Author Contributions
Funding
Data Availability Statement
Acknowledgments
Conflicts of Interest
References
- Stark, N.M.; Rowlands, R.E. Effects of wood fiber characteristics on mechanical properties of wood/polypropylene composites. Wood Fibre Sci. 2003, 35, 167–174. [Google Scholar]
- Liu, W.; Xie, T.; Qiu, R.; Fan, M. N-methylol acrylamide grafting bamboo fibers and their composites. Compos. Sci. Technol. 2015, 117, 100–106. [Google Scholar] [CrossRef]
- Kuan, H.T.N.; Lee, M.C. Tensile Properties of Pandanus Atrocarpus based Composites. J. Appl. Sci. Process Eng. 2014, 1, 39–44. [Google Scholar] [CrossRef] [Green Version]
- Santulli, C.; Kuan, H.T.; Sarasini, F.; De Rosa, I.; Cantwell, W. Damage characterisation on PP-hemp/aluminium fibre–metal laminates using acoustic emission. J. Compos. Mater. 2012, 47, 2265–2274. [Google Scholar] [CrossRef]
- Lim, S.F.; Pah PY, L.; Chua, S.N.; Kuan, H.T.N. Optimisation of Water Soluble Essential Oil from Lemongrass Leaves using Steam Distillation. Pertanika J. Sci. Technol. 2017, 25, 137–143. [Google Scholar]
- Kuan, H.T.N.; Lee, M.C.; Khan, A.A.; Sawawi, M. The low velocity impact properties of pandanus fiber composites. In Materials Science Forum; Trans Tech Publications Ltd.: Zurich, Switzerland, 2017; Volume 895, pp. 56–60. [Google Scholar]
- Fávaro, S.L.; Lopes, M.S.; Neto, A.G.V.D.C.; de Santana, R.R.; Radovanovic, E. Chemical, morphological, and mechanical analysis of rice husk/post-consumer polyethylene composites. Compos. Part A Appl. Sci. Manuf. 2010, 41, 154–160. [Google Scholar] [CrossRef]
- Mohanty, A.K.; Misra, M.; Drzal, L.T. Surface modifications of natural fibers and performance of the resulting biocomposites: An overview. Compos. Interfaces 2001, 8, 313–343. [Google Scholar] [CrossRef]
- García, D.; López, J.; Balart, R.; Ruseckaite, R.; Stefani, P. Composites based on sintering rice husk–waste tire rubber mixtures. Mater. Des. 2007, 28, 2234–2238. [Google Scholar] [CrossRef]
- Panthapulakkal, S.; Sain, M.; Law, S. Effect of coupling agents on rice-husk-filled HDPE extruded profiles. Polym. Int. 2004, 54, 137–142. [Google Scholar] [CrossRef]
- Arbelaiz, A.; Fernández, B.; Ramos, J.A.; Retegi, A.; Llano-Ponte, R.; Mondragon, I. Mechanical properties of short flax fibre bundle/polypropylene composites: Influence of matrix/fibre modification, fibre content, water uptake and recycling. Compos. Sci. Technol. 2005, 65, 1582–1592. [Google Scholar] [CrossRef]
- Sawawi, M.; Sahari, S.K.; Kuan, N.; Yusof, M.; Andew, M.; Salleh, S.F.; Sapawi, R. Optimisation of electrospinning parameter for Poly (L-lactic) acid (PLLA) electrospun nanofiber. In MATEC Web of Conferences; EDP Sciences: Ulis, France, 2017; Volume 87, p. 02012. [Google Scholar]
- Kuan, H.T.N.; Sarawak, U.M.; Kee, S.L.P.; Yusof, M.; Ting, S.N.; Ng, C.K. Mechanical properties study of durio zibethinus skin fiber reinforced polyethylene composite. J. Sustain. Sci. Manag. 2022, 17, 152–158. [Google Scholar] [CrossRef]
- Kuan, H.T.N.; Tan, M.Y.; Shen, Y.; Yahya, M.Y. Mechanical properties of particulate organic natural filler-reinforced polymer composite: A review. Compos. Adv. Mater. 2021, 30, 26349833211007502. [Google Scholar] [CrossRef]
- Edwin, R.; Sanker, P.; Sekar, T.; Munusamy, T.S. Botany; Government of Tamil Nadu: Chennai, India, 2006.
- International Coffee Organization. Coffee Consumption in East and Southeast Asia: 1990–2012. 2014. Available online: icc-112-4e-consumption-asia.pdf (accessed on 30 October 2019).
- International Coffee Organization. World Coffee Consumption. 2015. Available online: http://www.ico.org/prices/new-consumption-table.pdf (accessed on 27 October 2015).
- Tokimoto, T.; Kawasaki, N.; Nakamura, T.; Akutagawa, J.; Tanada, S. Removal of lead ions in drinking water by coffee grounds as vegetable biomass. J. Colloid Interface Sci. 2005, 281, 56–61. [Google Scholar] [CrossRef] [PubMed]
- Joseph, S.; Sreekala, M.S.; Oommen, Z.; Koshy, P.; Thomas, S. A comparison of the mechanical properties of phenol formaldehyde composites reinforced with banana fibres and glass fibres. Compos. Sci. Technol. 2002, 62, 1857–1868. [Google Scholar] [CrossRef]
- Noremylia, M.B.; Hassan, M.Z.; Ismail, Z. Recent advancement in isolation, processing, characterization and applications of emerging nanocellulose: A review. Int. J. Biol. Macromol. 2022, 206, 954–976. [Google Scholar] [CrossRef]
- Haris, N.; Hassan, M.; Ilyas, R. Crystallinity, Chemical, Thermal, and Dynamic Mechanical Properties of Rice Husk/Coco Peat Fiber Reinforced ABS Biocomposites. J. Nat. Fibers 2022, 20, 1–12. [Google Scholar] [CrossRef]
- Siracusa, V.; Rocculi, P.; Romani, S.; Rosa, M.D. Biodegradable polymers for food packaging: A review. Trends Food Sci. Technol. 2008, 19, 634–643. [Google Scholar] [CrossRef]
- Suhot, M.A.; Hassan, M.Z.; Aziz SA, A.; Md Daud, M.Y. Recent progress of rice husk reinforced polymer composites: A review. Polymers 2021, 13, 2391. [Google Scholar] [CrossRef]
- Gho, J.G.; Ballingham, E.P.N.; Chiellini, E.; Swift, G.; Wiles, D.; Katsaros, N. EPI’s Oxo-biodegradable Plastics Guide-book. Vancouver, Canada, 2008.
- Fermoso, J.; Mašek, O. Thermochemical decomposition of coffee ground residues by TG-MS: A kinetic study. J. Anal. Appl. Pyrolysis 2018, 130, 358–367. [Google Scholar] [CrossRef] [Green Version]
- Cai, H.; Liu, J.; Xie, W.; Kuo, J.; Buyukada, M.; Evrendilek, F. Pyrolytic kinetics, reaction mechanisms and products of waste tea via TG-FTIR and Py-GC/MS. Energy Convers. Manag. 2019, 184, 436–447. [Google Scholar] [CrossRef]
- De Brito, E.B.; Tienne LG, P.; Cordeiro, S.B.; Marques MD, F.V.; Monteiro, S.N. The influence of steam explosion treatment of green coffee cake on the thermal and mechanical properties of reinforced polypropylene matrix compo-sites. J. Mater. Res. Technol. 2020, 9, 4051–4060. [Google Scholar] [CrossRef]
- Zhao, X.; Lawal, T.; Rodrigues, M.; Geib, T.; Vodovotz, Y. Value-Added Use of Invasive Plant-Derived Fibers as PHBV Fillers for Biocomposite Development. Polymers 2021, 13, 1975. [Google Scholar] [CrossRef] [PubMed]
- Gonçalves, B.M.M.; Camillo, M.D.O.; Oliveira, M.P.; Carreira, L.G.; Moulin, J.C.; Fantuzzi Neto, H.; de Oliveira, B.F.; Pereira, A.C.; Monteiro, S.N. Surface Treatments of Coffee Husk Fiber Waste for Effective Incorporation into Polymer Biocomposites. Polymers 2021, 13, 3428. [Google Scholar] [CrossRef]
- Dominici, F.; García, D.G.; Fombuena, V.; Luzi, F.; Puglia, D.; Torre, L.; Balart, R. Bio-Polyethylene-Based Composites Reinforced with Alkali and Palmitoyl Chloride-Treated Coffee Silverskin. Molecules 2019, 24, 3113. [Google Scholar] [CrossRef] [PubMed] [Green Version]
- Sarasini, F.; Tirillò, J.; Zuorro, A.; Maffei, G.; Lavecchia, R.; Puglia, D.; Dominici, F.; Luzi, F.; Valente, T.; Torre, L. Recycling coffee silverskin in sustainable composites based on a poly (butylene adipate-co-terephthalate)/poly (3-hydroxybutyrate-co-3-hydroxyvalerate) matrix. Ind. Crops Prod. 2018, 118, 311–320. [Google Scholar] [CrossRef]
- Hejna, A.; Barczewski, M.; Kosmela, P.; Mysiukiewicz, O.; Kuzmin, A. Coffee Silverskin as a Multifunctional Waste Filler for High-Density Polyethylene Green Composites. J. Compos. Sci. 2021, 5, 44. [Google Scholar] [CrossRef]
- Totaro, G.; Sisti, L.; Fiorini, M.; Lancellotti, I.; Andreola, F.N.; Saccani, A. Formulation of Green Particulate Composites from PLA and PBS Matrix and Wastes Deriving from the Coffee Production. J. Polym. Environ. 2019, 27, 1488–1496. [Google Scholar] [CrossRef]
- Zarrinbakhsh, N.; Wang, T.; Rodriguez-Uribe, A.; Misra, M.; Mohanty, A.K. Characterization of wastes and coproducts from the coffee industry for composite material production. BioResources 2016, 11, 7637–7653. [Google Scholar] [CrossRef] [Green Version]
- Pujol, D.; Liu, C.; Gominho, J.; Olivella, M.; Fiol, N.; Villaescusa, I.; Pereira, H. The chemical composition of exhausted coffee waste. Ind. Crop. Prod. 2013, 50, 423–429. [Google Scholar] [CrossRef]
- Caetano, N.S.; Silvaa, V.F.M.; Mata, T.M. Valorization of coffee grounds for biodiesel production. Chem. Eng. Trans. 2012, 26, 267–272. [Google Scholar]
- Ballesteros, L.F.; Teixeira, J.A.; Mussatto, S.I. Chemical, Functional, and Structural Properties of Spent Coffee Grounds and Coffee Silverskin. Food Bioprocess Technol. 2014, 7, 3493–3503. [Google Scholar] [CrossRef] [Green Version]
- Mussatto, S.I.; Machado, E.M.S.; Martins, S.; Teixeira, J.A. Production, Composition, and Application of Coffee and Its Industrial Residues. Food Bioprocess Technol. 2011, 4, 661–672. [Google Scholar] [CrossRef] [Green Version]
- Tan, M.Y.; Kuan, H.T.N.; Lee, M.C. Characterization of Alkaline Treatment and Fiber Content on the Physical, Thermal, and Mechanical Properties of Ground Coffee Waste/Oxobiodegradable HDPE Biocomposites. Int. J. Polym. Sci. 2017, 2017, 6258151. [Google Scholar] [CrossRef]
- Tan, M.Y.; Kuan, H.T.N.; Khan, A.A. Tensile Properties of Ground Coffee Waste Reinforced Polyethylene Composite. Mater. Sci. Forum 2016, 880, 73–76. [Google Scholar] [CrossRef]
- ASTM D3039/D3039M; Standard Test Method for Tensile Properties of Polymer Matrix Composite Materials. ASTM International: West Conshohocken, PA, USA, 2000.
- ASTM D3763; ASTM D3763: Standard Test Method for High Speed Puncture Properties of Plastics Using Load and Displacement Sensors. ASTM International: West Conshohocken, PA, USA, 2012.
- ASTM D570-98; ASTM D570-10: Standard Test Method for Water absorption of Plastics. ASTM International: West Conshohocken, PA, USA, 2010.
- Khan, M.A.; Ali, K.M.I.; Basu, S.C. IR studies of wood plastic composites. J. Appl. Polym. Sci. 1993, 49, 1547–1551. [Google Scholar] [CrossRef]
- Kolboe, S.; Ellefsen, O. Infrared investigations of lignin. A discussion of some recent results. Tappi 1962, 45, 163–166. [Google Scholar]
- Cremer, D.R.; Kaletunç, G. Fourier transform infrared microspectroscopic study of the chemical microstructure of corn and oat flour-based extrudates. Carbohydr. Polym. 2003, 52, 53–65. [Google Scholar] [CrossRef]
- Faix, O. Classification of Lignins from Different Botanical Origins by FT-IR Spectroscopy. Holzforschung 1991, 45, 21–28. [Google Scholar] [CrossRef]
- Matuana, L.M.; Balatinecz, J.J.; Sodhi, R.N.S.; Park, C.B. Surface characterization of esterified cellulosic fibers by XPS and FTIR Spectroscopy. Wood Sci. Technol. 2001, 35, 191–201. [Google Scholar] [CrossRef]
- Pervan, S.; Prekrat, S.; Gorisek, Z.; Straze, A.; Humar, M. Effect of Steaming on Colour and Chemistry of Cherrywood (Prunus avium L.). In Wood Structure and Properties ’06; Kurjatko, S., Kudela, J., Lagana, R., Eds.; Arbora Publisher: Zvolen, Slovakia, 2006; pp. 331–336. [Google Scholar]
- Fan, M.; Dai, D.; Huang, B. Fourier transform infrared spectroscopy for natural fibres. In Fourier Transform—Materials Analysis; IntechOpen: London, UK, 2012; pp. 45–68. [Google Scholar]
- Castro, D.; Ruvolo-Filho, A.; Frollini, E. Materials prepared from biopolyethylene and curaua fibers: Composites from biomass. Polym. Test. 2012, 31, 880–888. [Google Scholar] [CrossRef]
- Brebu, M.; Vasile, C. Thermal degradation of Lignin—A review. Cellul. Chem. Technol. 2010, 44, 353–363. [Google Scholar]
- Perez, I.S.B.; Manrich, S.; Manrich, S. The effect of different block copolymers on post consumer HDPE/HIPS Blends: Phase morphology and thermal properties. Polímeros 2008, 18, 207–214. [Google Scholar] [CrossRef]
- Davachi, S.M.; Kaffashi, B.; Davoodi, S.; Pouresmaeel-Selakjani, P.; Bakhtiari, S.; Mohammadi-Rovshandeh, J.; Yousefi, A. Investigating the Effect of Treated Rice Straw in PLLA/Starch Composite: Mechanical, Thermal, Rheological, and Morpho-logical Study. Adv. Polym. Technol. 2018, 37, 5–16. [Google Scholar] [CrossRef]
- Fernandes, E.M.; Mano, J.F.; Reis, R.L. Hybrid cork–polymer composites containing sisal fibre: Morphology, effect of the fibre treatment on the mechanical properties and tensile failure prediction. Compos. Struct. 2013, 105, 153–162. [Google Scholar] [CrossRef] [Green Version]
- Yang, H.S.; Kim, H.J.; Son, J.; Park, H.J.; Lee, B.J.; Hwang, T.S. Rice-husk flour filled polypropylene composites; mechanical and morphological study. Compos. Struct. 2004, 63, 305–312. [Google Scholar] [CrossRef]
- Rozman, H.D.; Tay, G.S.; Kumar, R.N.; Abusamah, A.; Ismail, H.; Ishak, Z.A.M. The effect of oil extraction of the oil palm empty fruit bunch on the mechanical properties of polypropylene—Oil palm empty fruit bunch—Glass fibre hybrid composites on the mechanical properties fibre hybrid. Polym. Plast. Technol. Eng. 2001, 40, 103–115. [Google Scholar] [CrossRef]
- Anbukarasi, K.; Kalaiselvam, S. Study of effect of fibre volume and dimension on mechanical, thermal, and water ab-sorption behaviour of luffa reinforced epoxy composites. Mater. Des. 2015, 66, 321–330. [Google Scholar] [CrossRef]
- Youssef, A.M.; El-Gendy, A.; Kamel, S. Evaluation of corn husk fibers reinforced recycled low density polyethylene composites. Mater. Chem. Phys. 2015, 152, 26–33. [Google Scholar] [CrossRef]


| Composition of GCW (%) | Reference | ||
|---|---|---|---|
| Cellulose | Hemicellulose | Lignin | |
| 13.02 | - | 26.52 | [35] |
| 13.85 | - | 19.84 | [35] |
| 13.8 | - | 33.6 | [36] |
| 12.4 ± 0.79 | 39.1 ± 1.94 | 23.9 ± 1.7 | [37] |
| 8.6 | 36.7 | - | [38] |
| Composite | Sample | Stacking Sequence | Volume of GCW (%) | Volume of HDPE (%) | Reference |
|---|---|---|---|---|---|
| HDPE | HDPE | 150PE | 0 | 100 | [39] |
| UGC5 | Untreated GCW5/HDPE | 150PE + 5UG | 5 | 95 | [39] |
| UGC10 | Untreated GCW10/HDPE | 150PE + 10UG | 10 | 90 | [39] |
| UGC15 | Untreated GCW15/HDPE | 150PE + 15UG | 15 | 85 | [39] |
| UGC20 | Untreated GCW20/HDPE | 150PE + 20UG | 20 | 80 | [39] |
| OGC5 | Oil Extraction GCW5/HDPE | 150PE + 5OG | 5 | 95 | |
| OGC10 | Oil Extraction GCW10/HDPE | 150PE + 10OG | 10 | 90 | |
| OGC15 | Oil Extraction GCW15/HDPE | 150PE + 15OG | 15 | 85 | |
| OGC20 | Oil Extraction GCW20/HDPE | 150PE + 20OG | 20 | 80 | |
| ONGC5 | Oil Extraction + NaOH5/HDPE | 150PE + 5ONG | 5 | 95 | |
| ONGC10 | Oil Extraction + NaOH10/HDPE | 150PE + 10ONG | 10 | 90 | |
| ONGC15 | Oil Extraction + NaOH15/HDPE | 150PE + 15ONG | 15 | 85 | |
| ONGC20 | Oil Extraction + NaOH20/HDPE | 150PE + 20ONG | 20 | 80 |
| Band Wavelength (cm−1) | Associated Chemical Group | UG | OG | ONG |
|---|---|---|---|---|
| 3351 | –OH intensity | High | Low | Low |
| 2923 | Lignin peak | Present | Reduced | Reduced |
| 2859 | Lignin peak | Present | Reduced | Reduced |
| 1733 | Hemicellulose, Lignin, Lipid, pectin-wax peak | Present | - | - |
| 1444 | Lignin, hemicellulose peak | Present | - | - |
| 1367 | Hemicellulose peak | Present | Reduced | Reduced |
| 1238 | Hemicellulose, Lignin peak | Present | Reduced | Reduced |
| 1120 | Lignin peak | Present | - | - |
| 600–1100 | –OH intensity | Low | High | High |
| Composites | Tonset (°C) | Tmax (°C) | Tfinal (°C) | Residue (%) | Reference |
|---|---|---|---|---|---|
| HDPE | 461.8 | 474.4 | 493.2 | 15.13 | [39] |
| UGC10 | 460.4 | 481.9 | 492.4 | 25.80 | [39] |
| OGC10 | 460.4 | 481.9 | 492.4 | 20.47 | |
| ONGC10 | 459.1 | 482.0 | 492.8 | 17.71 |
| Composites | Temperature at 10% Weight Loss (°C) | Temperature at 15% Weight Loss (°C) | Temperature at 25% Weight Loss (°C) | Temperature at 50% Weight Loss (°C) |
|---|---|---|---|---|
| HDPE | 456.52 | 462.48 | 469.74 | 479.60 |
| UGC10 | 422.11 | 450.39 | 464.64 | 478.01 |
| OGC10 | 444.50 | 456.08 | 466.70 | 479.88 |
| ONGC10 | 448.79 | 458.33 | 467.87 | 480.29 |
| Composites | Tm (°C) | ∆Hm (J/g) | Xc (%) |
|---|---|---|---|
| HDPE | 138.92 | 142.44 | 48.61 |
| UGC10 | 138.85 | 133.27 | 50.54 |
| OGC10 | 137.72 | 140.67 | 53.34 |
| ONG10 | 137.35 | 140.76 | 53.38 |
Publisher’s Note: MDPI stays neutral with regard to jurisdictional claims in published maps and institutional affiliations. |
© 2022 by the authors. Licensee MDPI, Basel, Switzerland. This article is an open access article distributed under the terms and conditions of the Creative Commons Attribution (CC BY) license (https://creativecommons.org/licenses/by/4.0/).
Share and Cite
Kuan, H.T.N.; Tan, M.Y.; Hassan, M.Z.; Zuhri, M.Y.M. Evaluation of Physico-Mechanical Properties on Oil Extracted Ground Coffee Waste Reinforced Polyethylene Composite. Polymers 2022, 14, 4678. https://doi.org/10.3390/polym14214678
Kuan HTN, Tan MY, Hassan MZ, Zuhri MYM. Evaluation of Physico-Mechanical Properties on Oil Extracted Ground Coffee Waste Reinforced Polyethylene Composite. Polymers. 2022; 14(21):4678. https://doi.org/10.3390/polym14214678
Chicago/Turabian StyleKuan, Hoo Tien Nicholas, Ming Yee Tan, Mohamad Zaki Hassan, and Mohamed Yusoff Mohd Zuhri. 2022. "Evaluation of Physico-Mechanical Properties on Oil Extracted Ground Coffee Waste Reinforced Polyethylene Composite" Polymers 14, no. 21: 4678. https://doi.org/10.3390/polym14214678