
Development and Evaluation of a Novel Sulfonated Phenol–Formaldehyde Resin with High Dispersion Stability

Abstract
:
1. Introduction
2. Materials and Methods
2.1. Materials
2.1.1. Preparation of Sodium Formaldehyde Sulfoxylate
2.1.2. Preparation of SPF Resin
2.2. Methodology
2.2.1. FTIR
2.2.2. HPLC–MS/MS
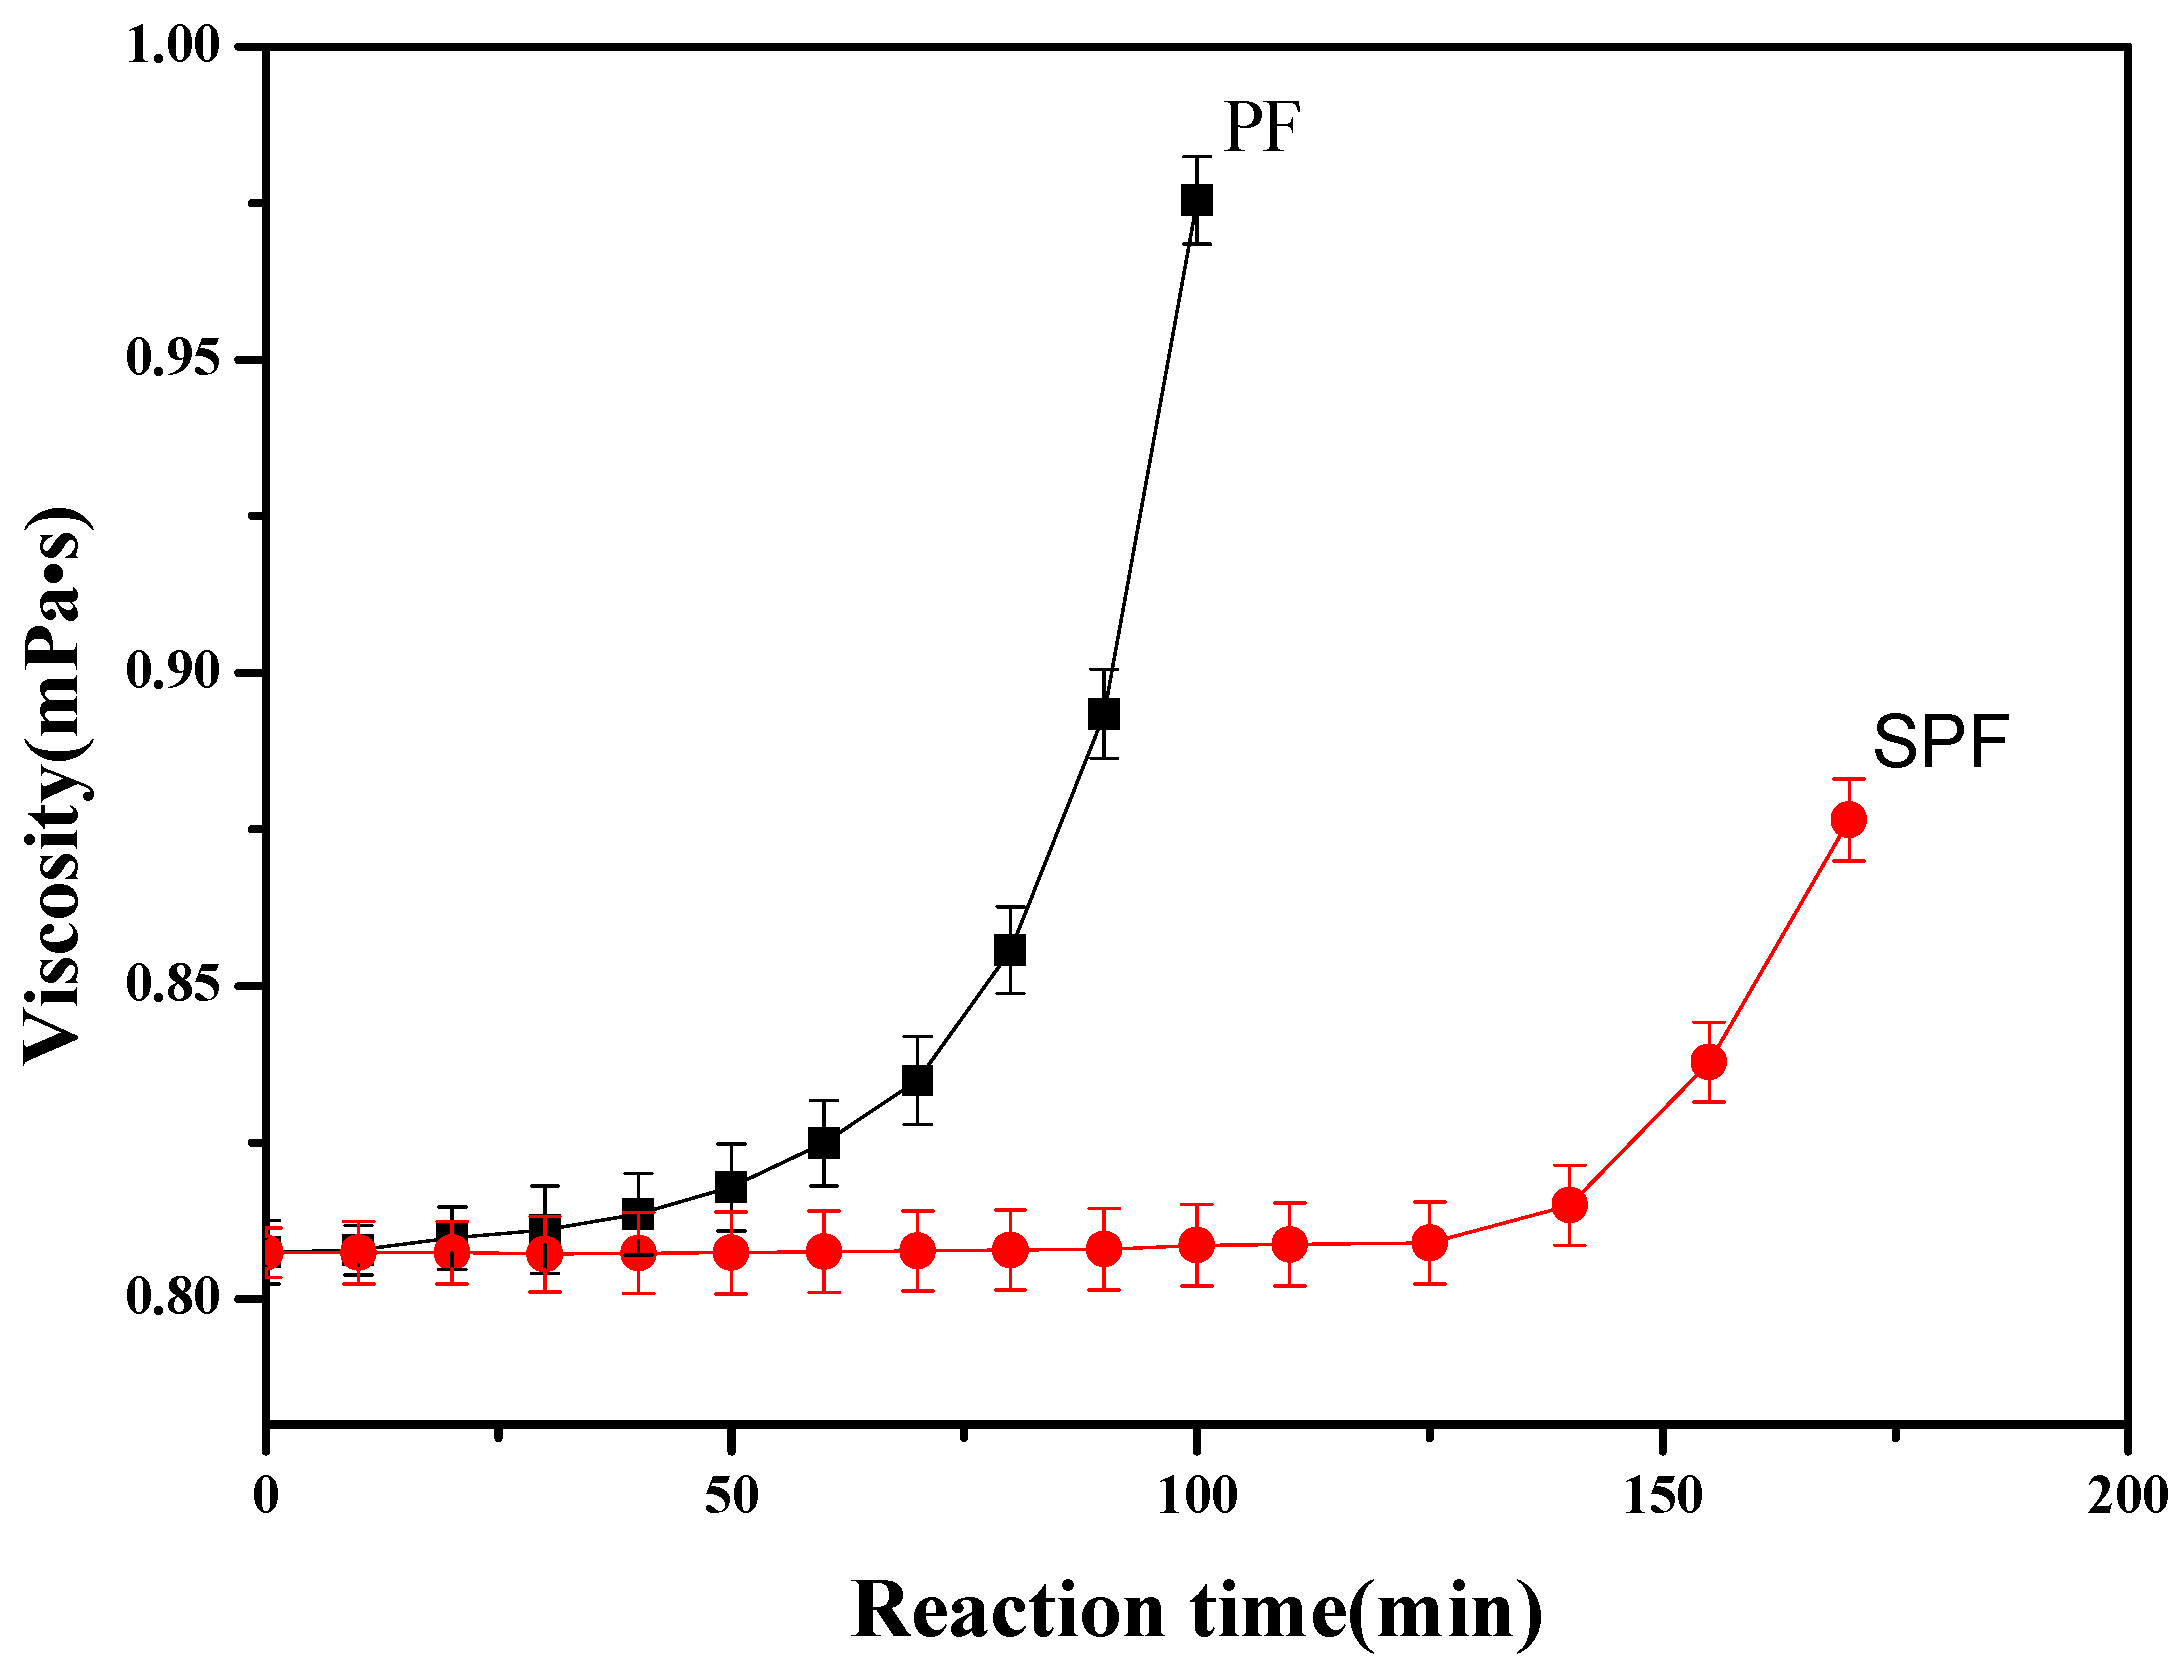
2.2.3. Viscosity
2.2.4. Storage Time
2.2.5. Coagulation Value
2.2.6. Molecular Size and Zeta Potential
3. Results
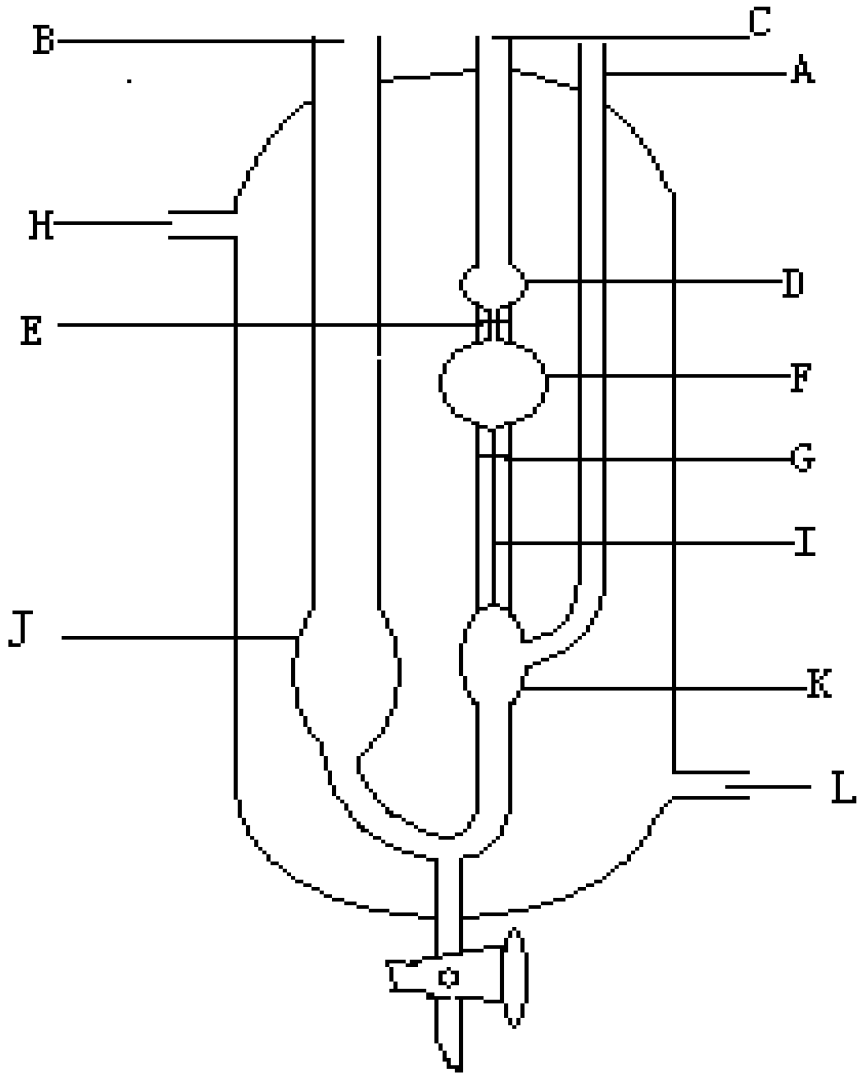
3.1. Analysis of Reaction Process for SPF Resin
3.2. Structure Analysis
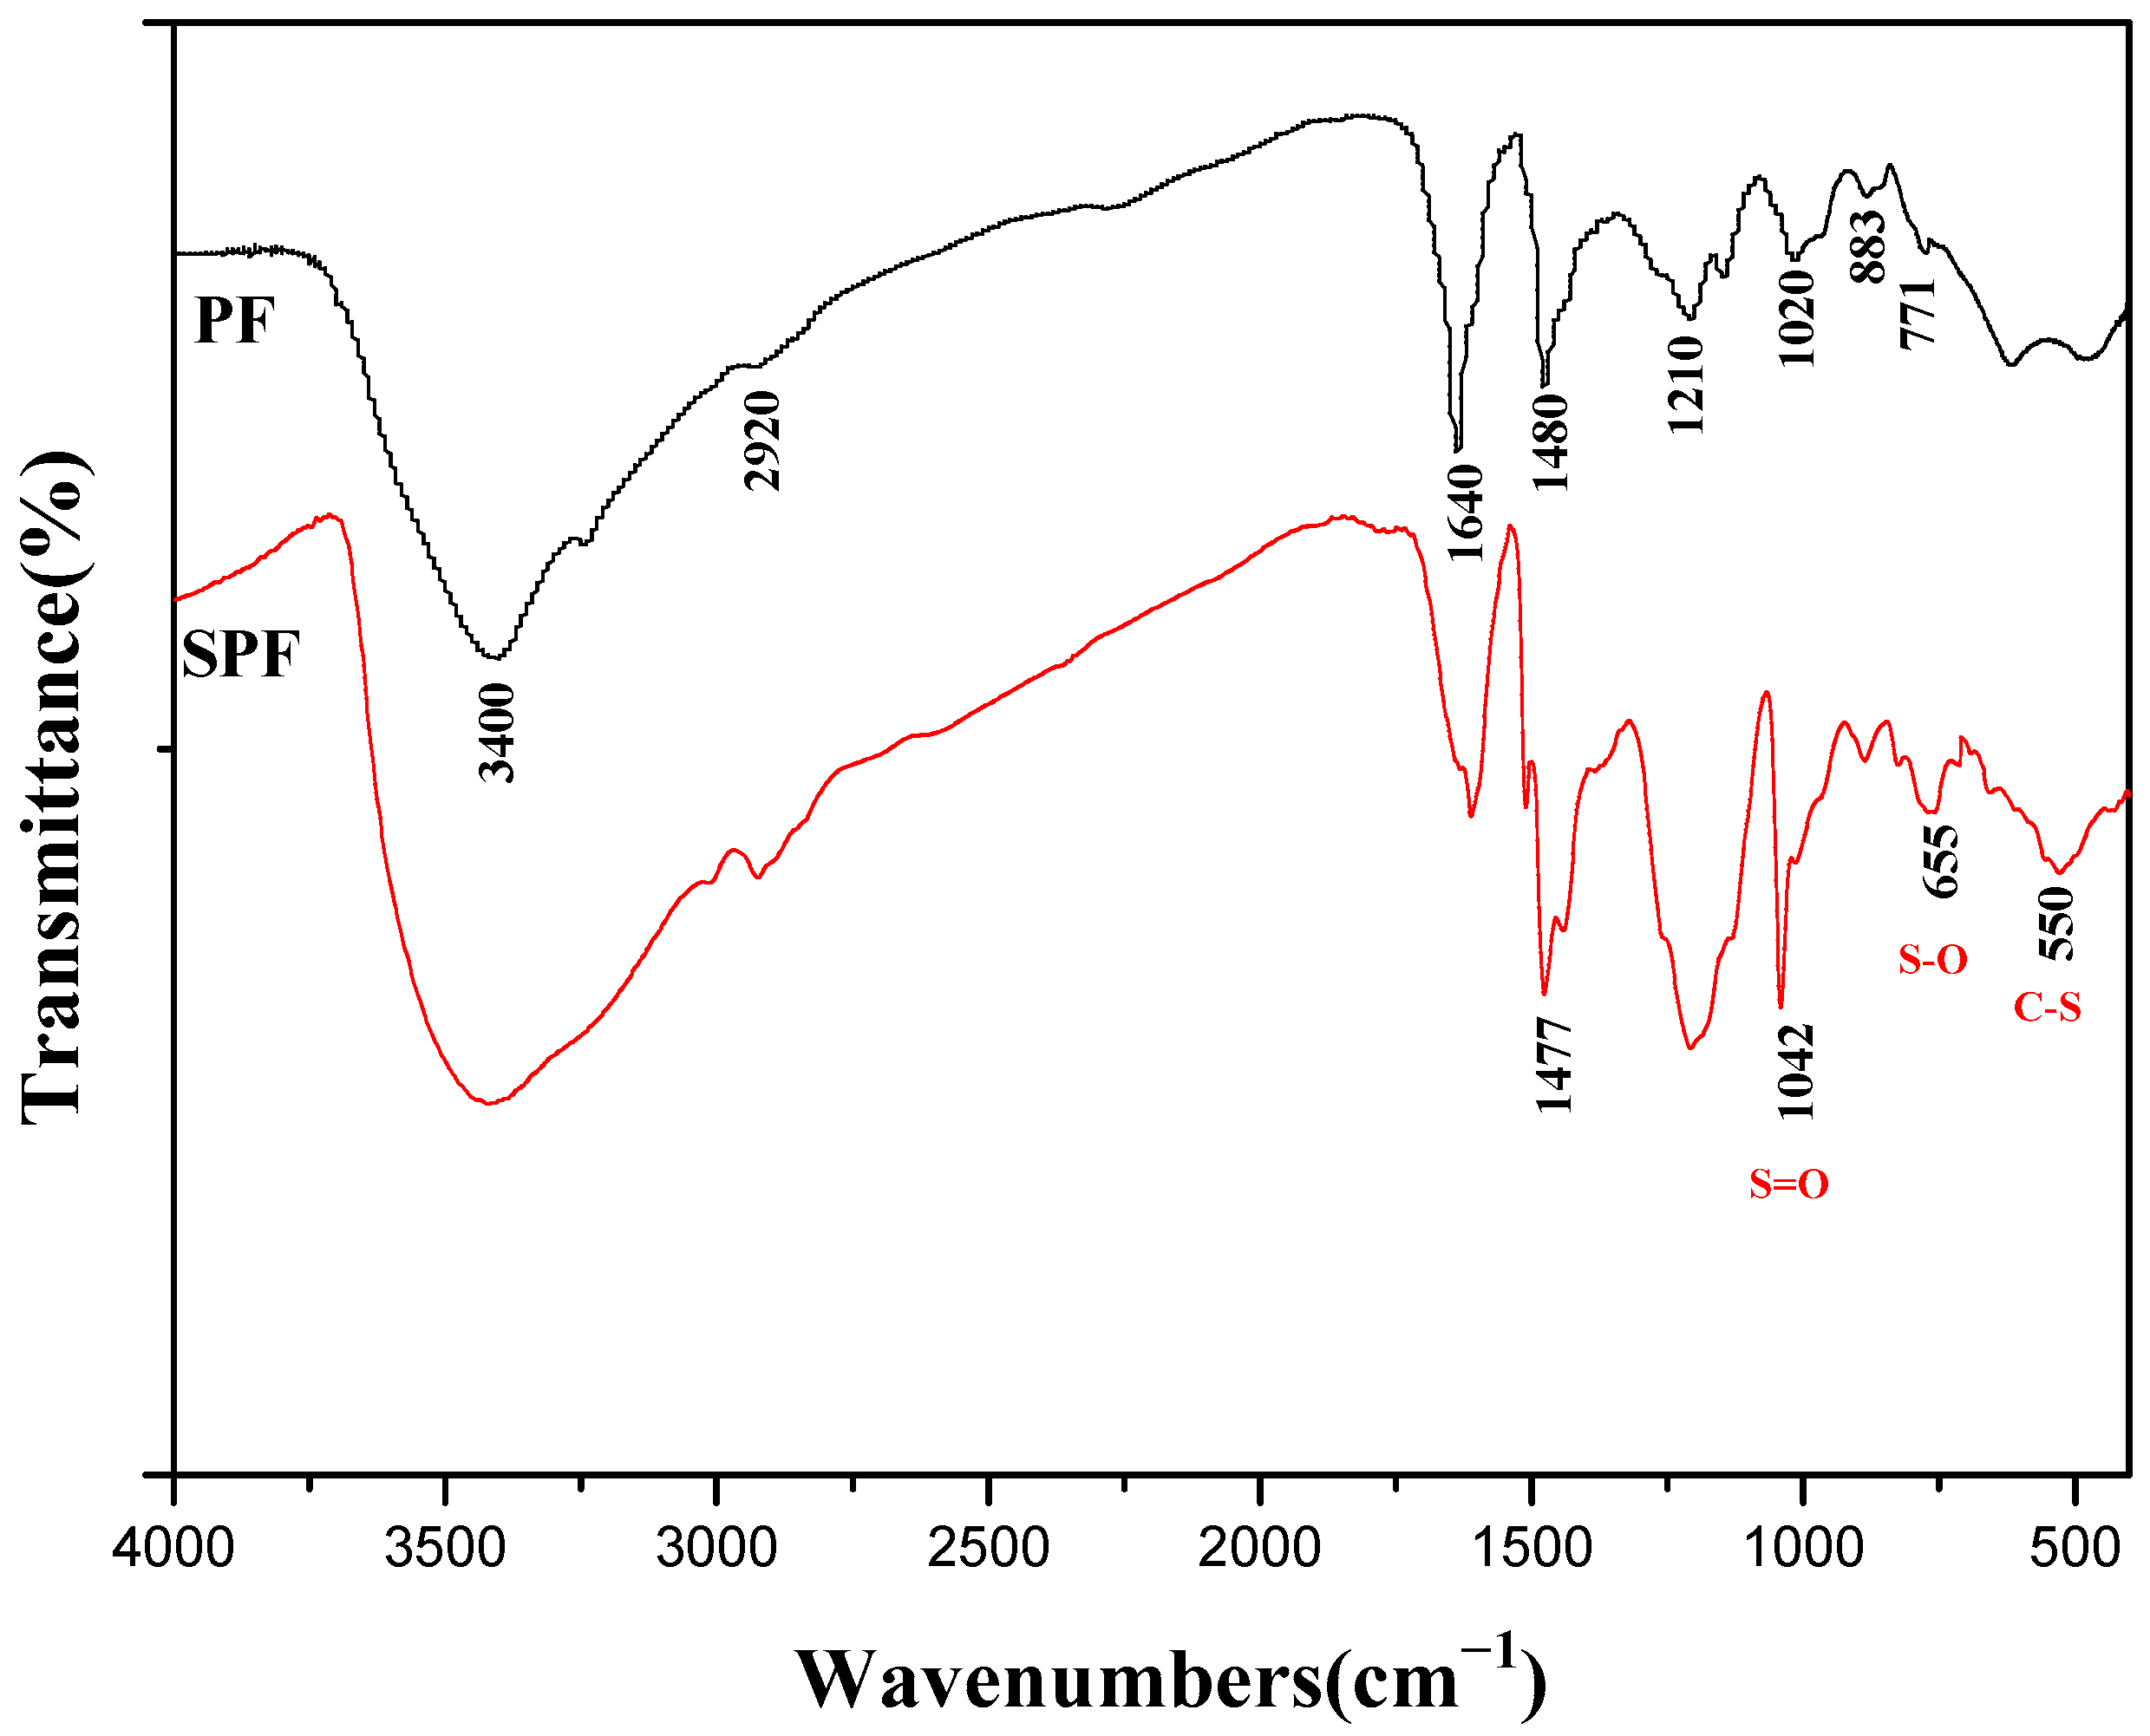
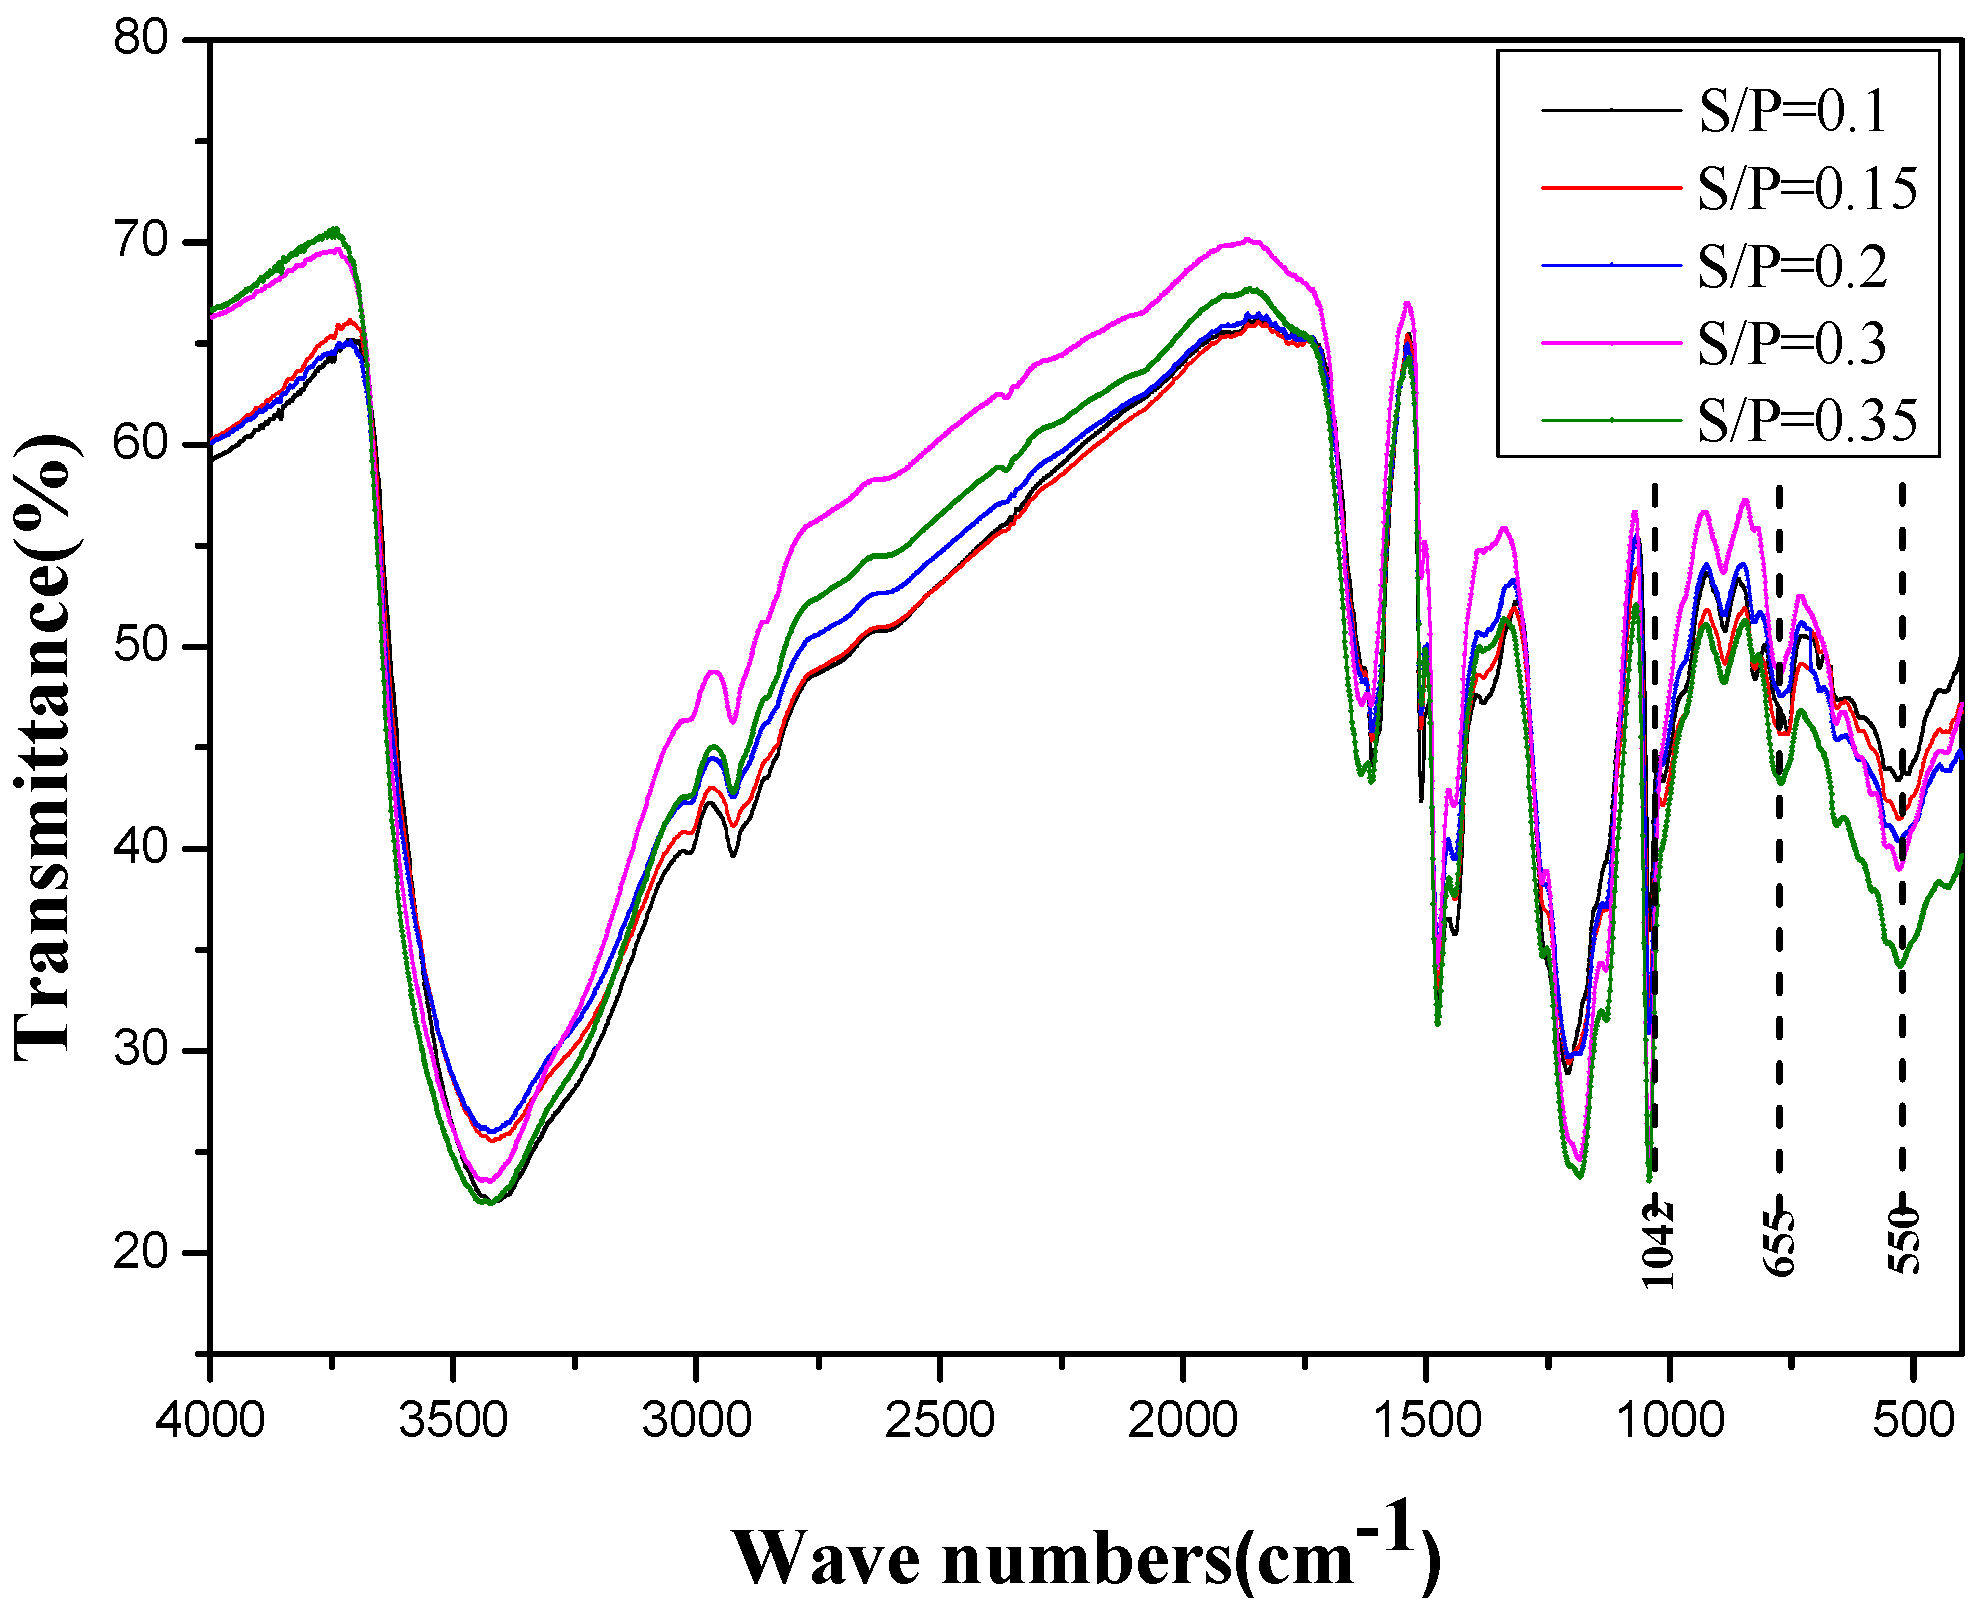
3.2.1. FTIR
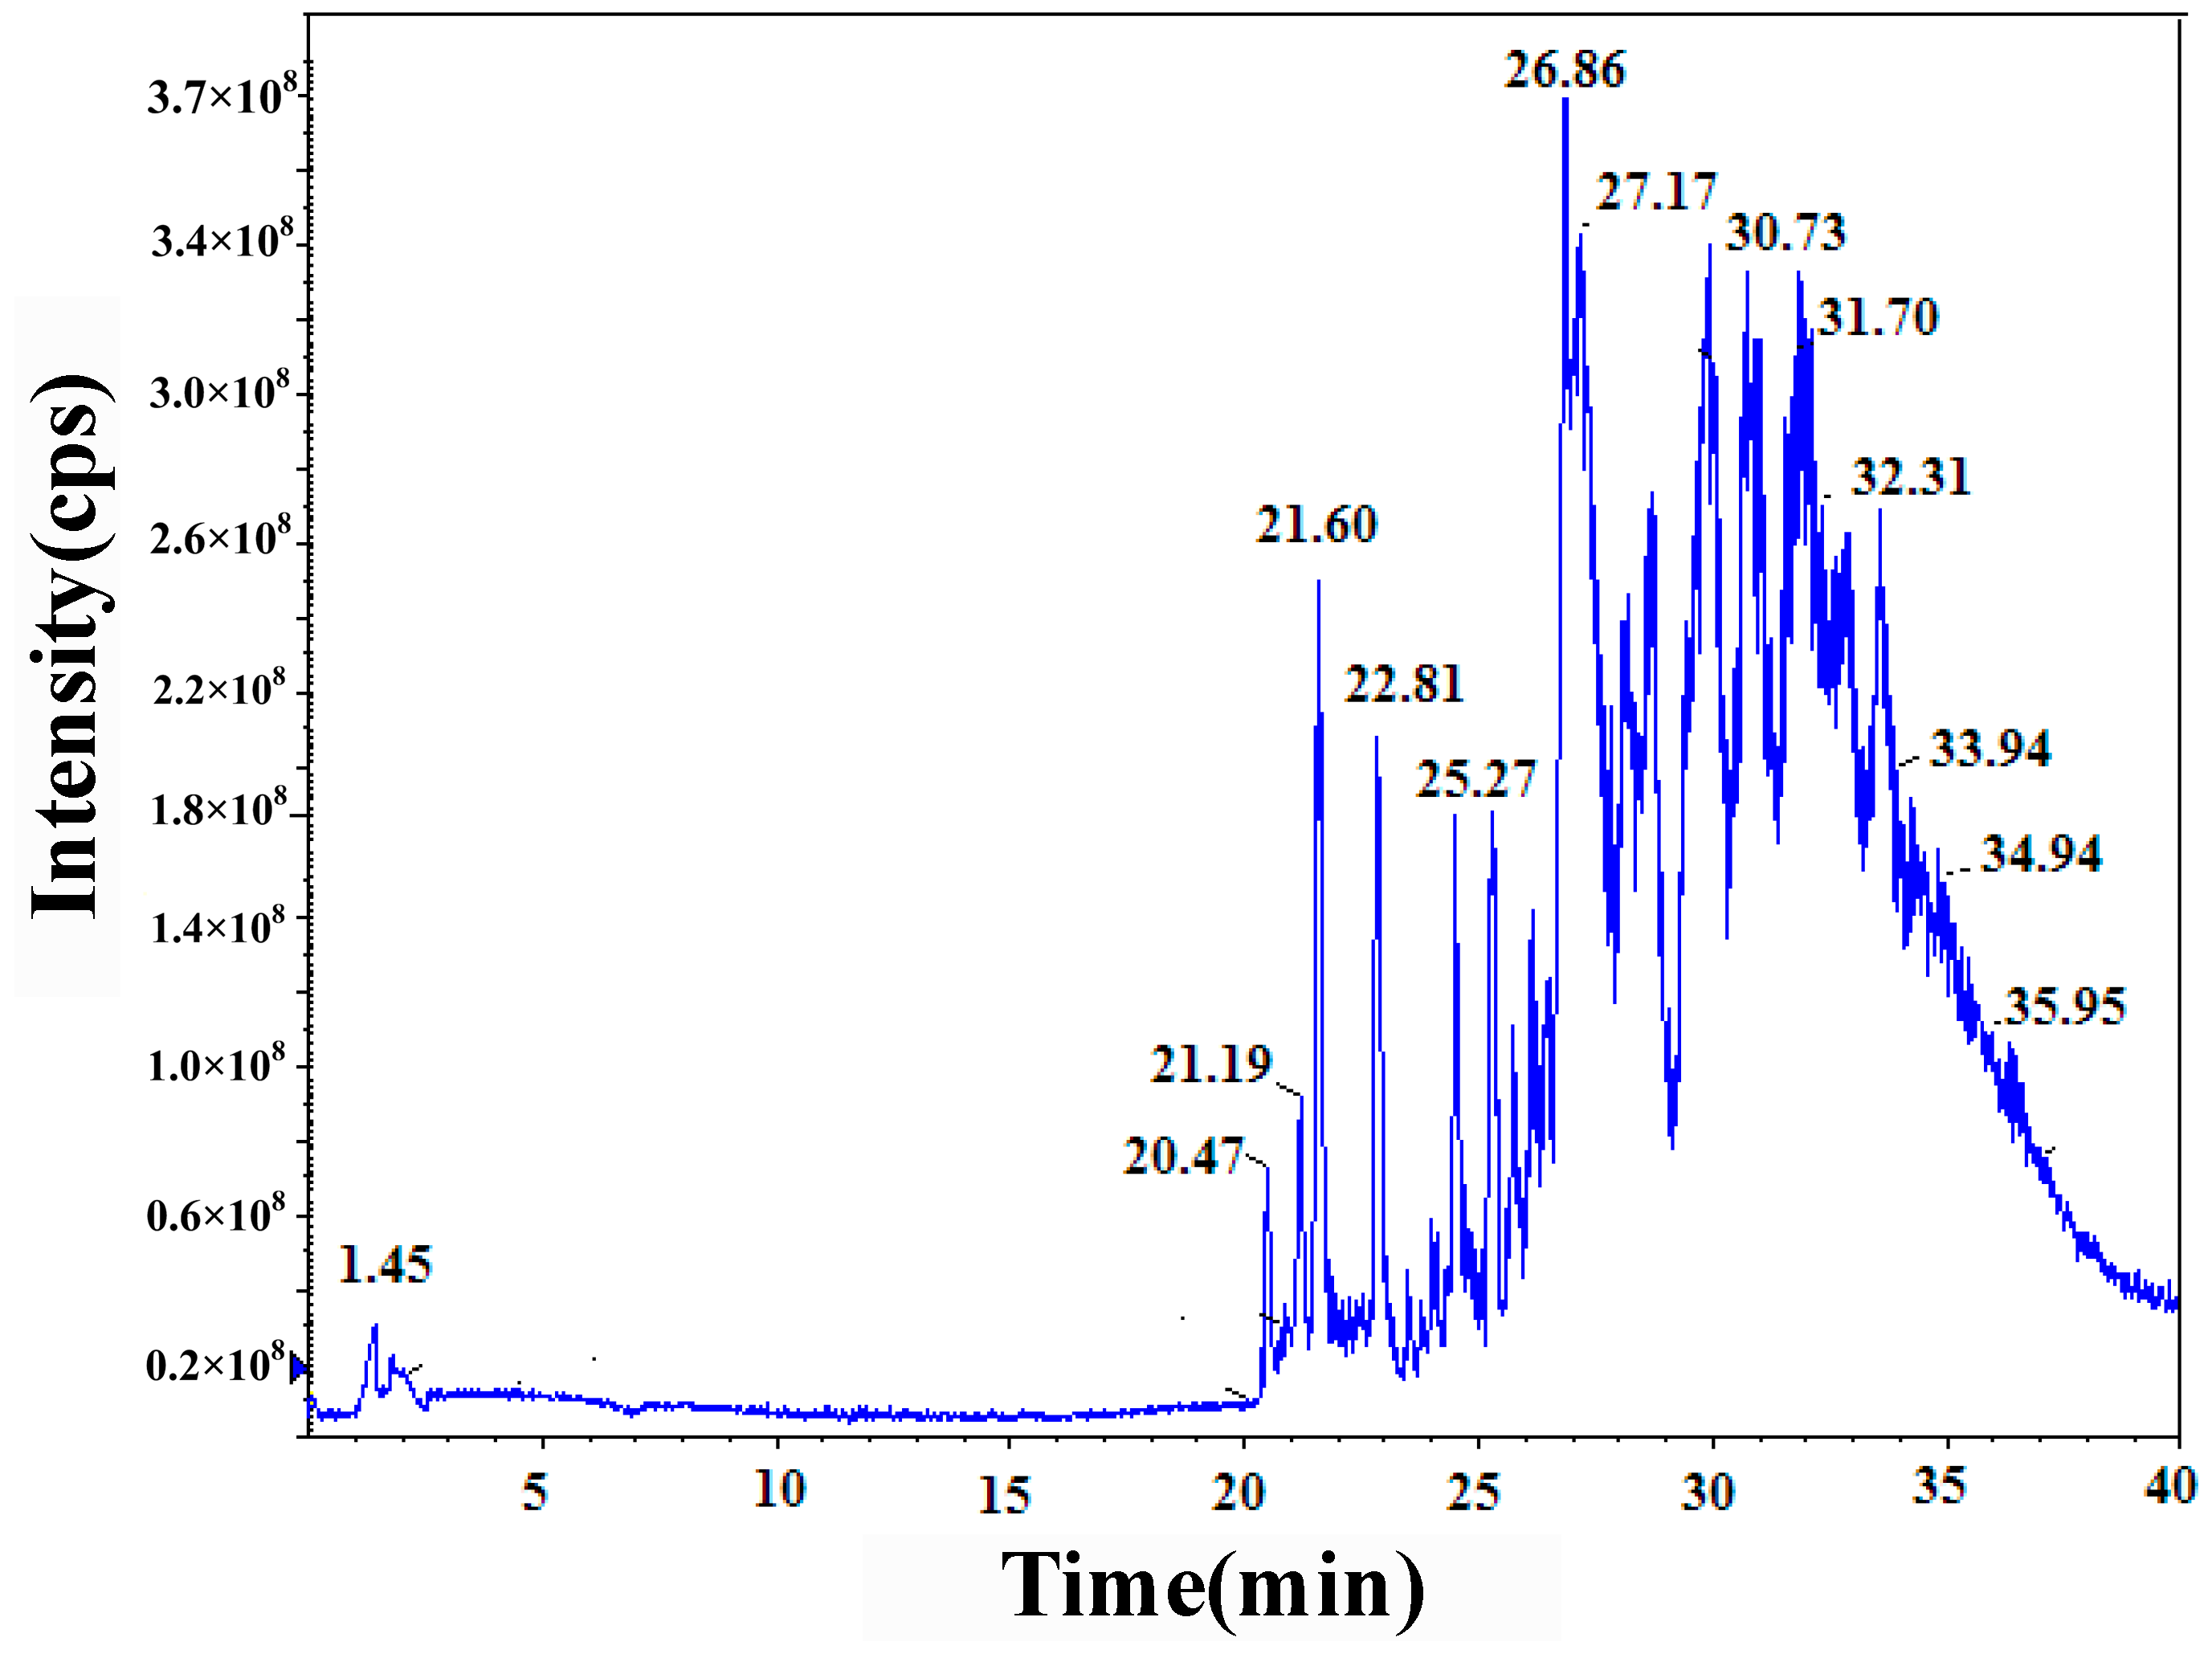
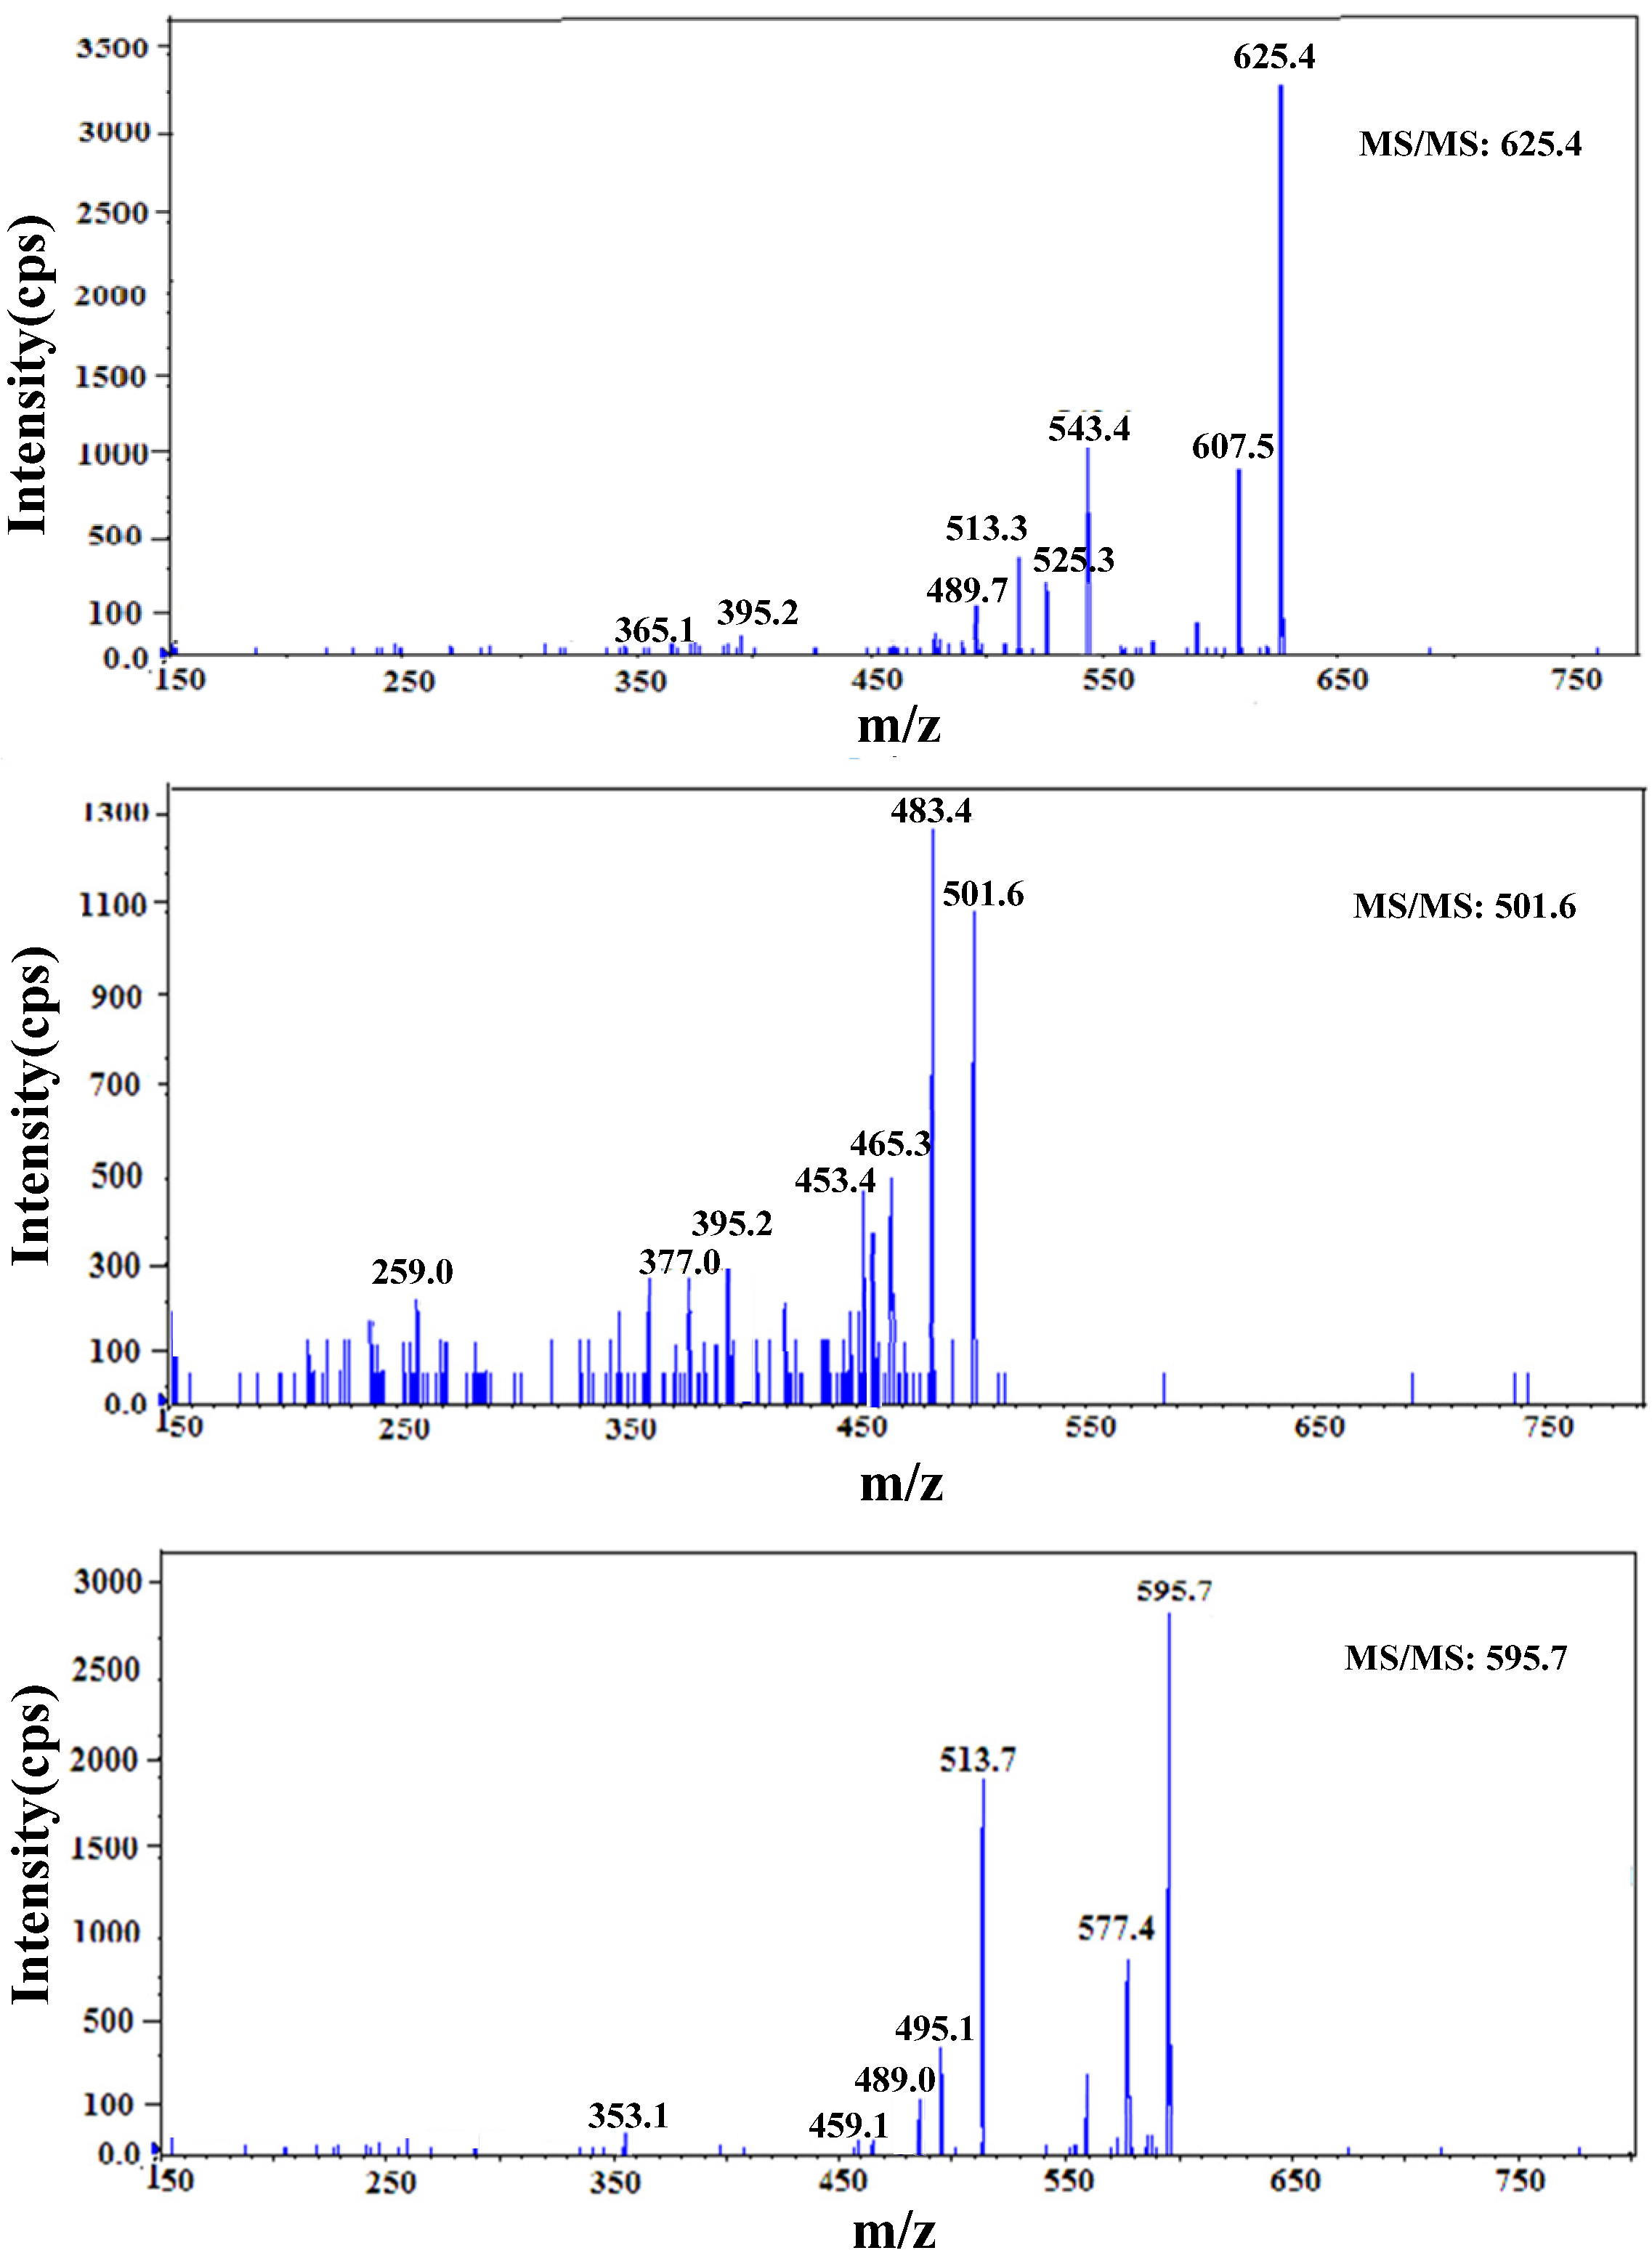
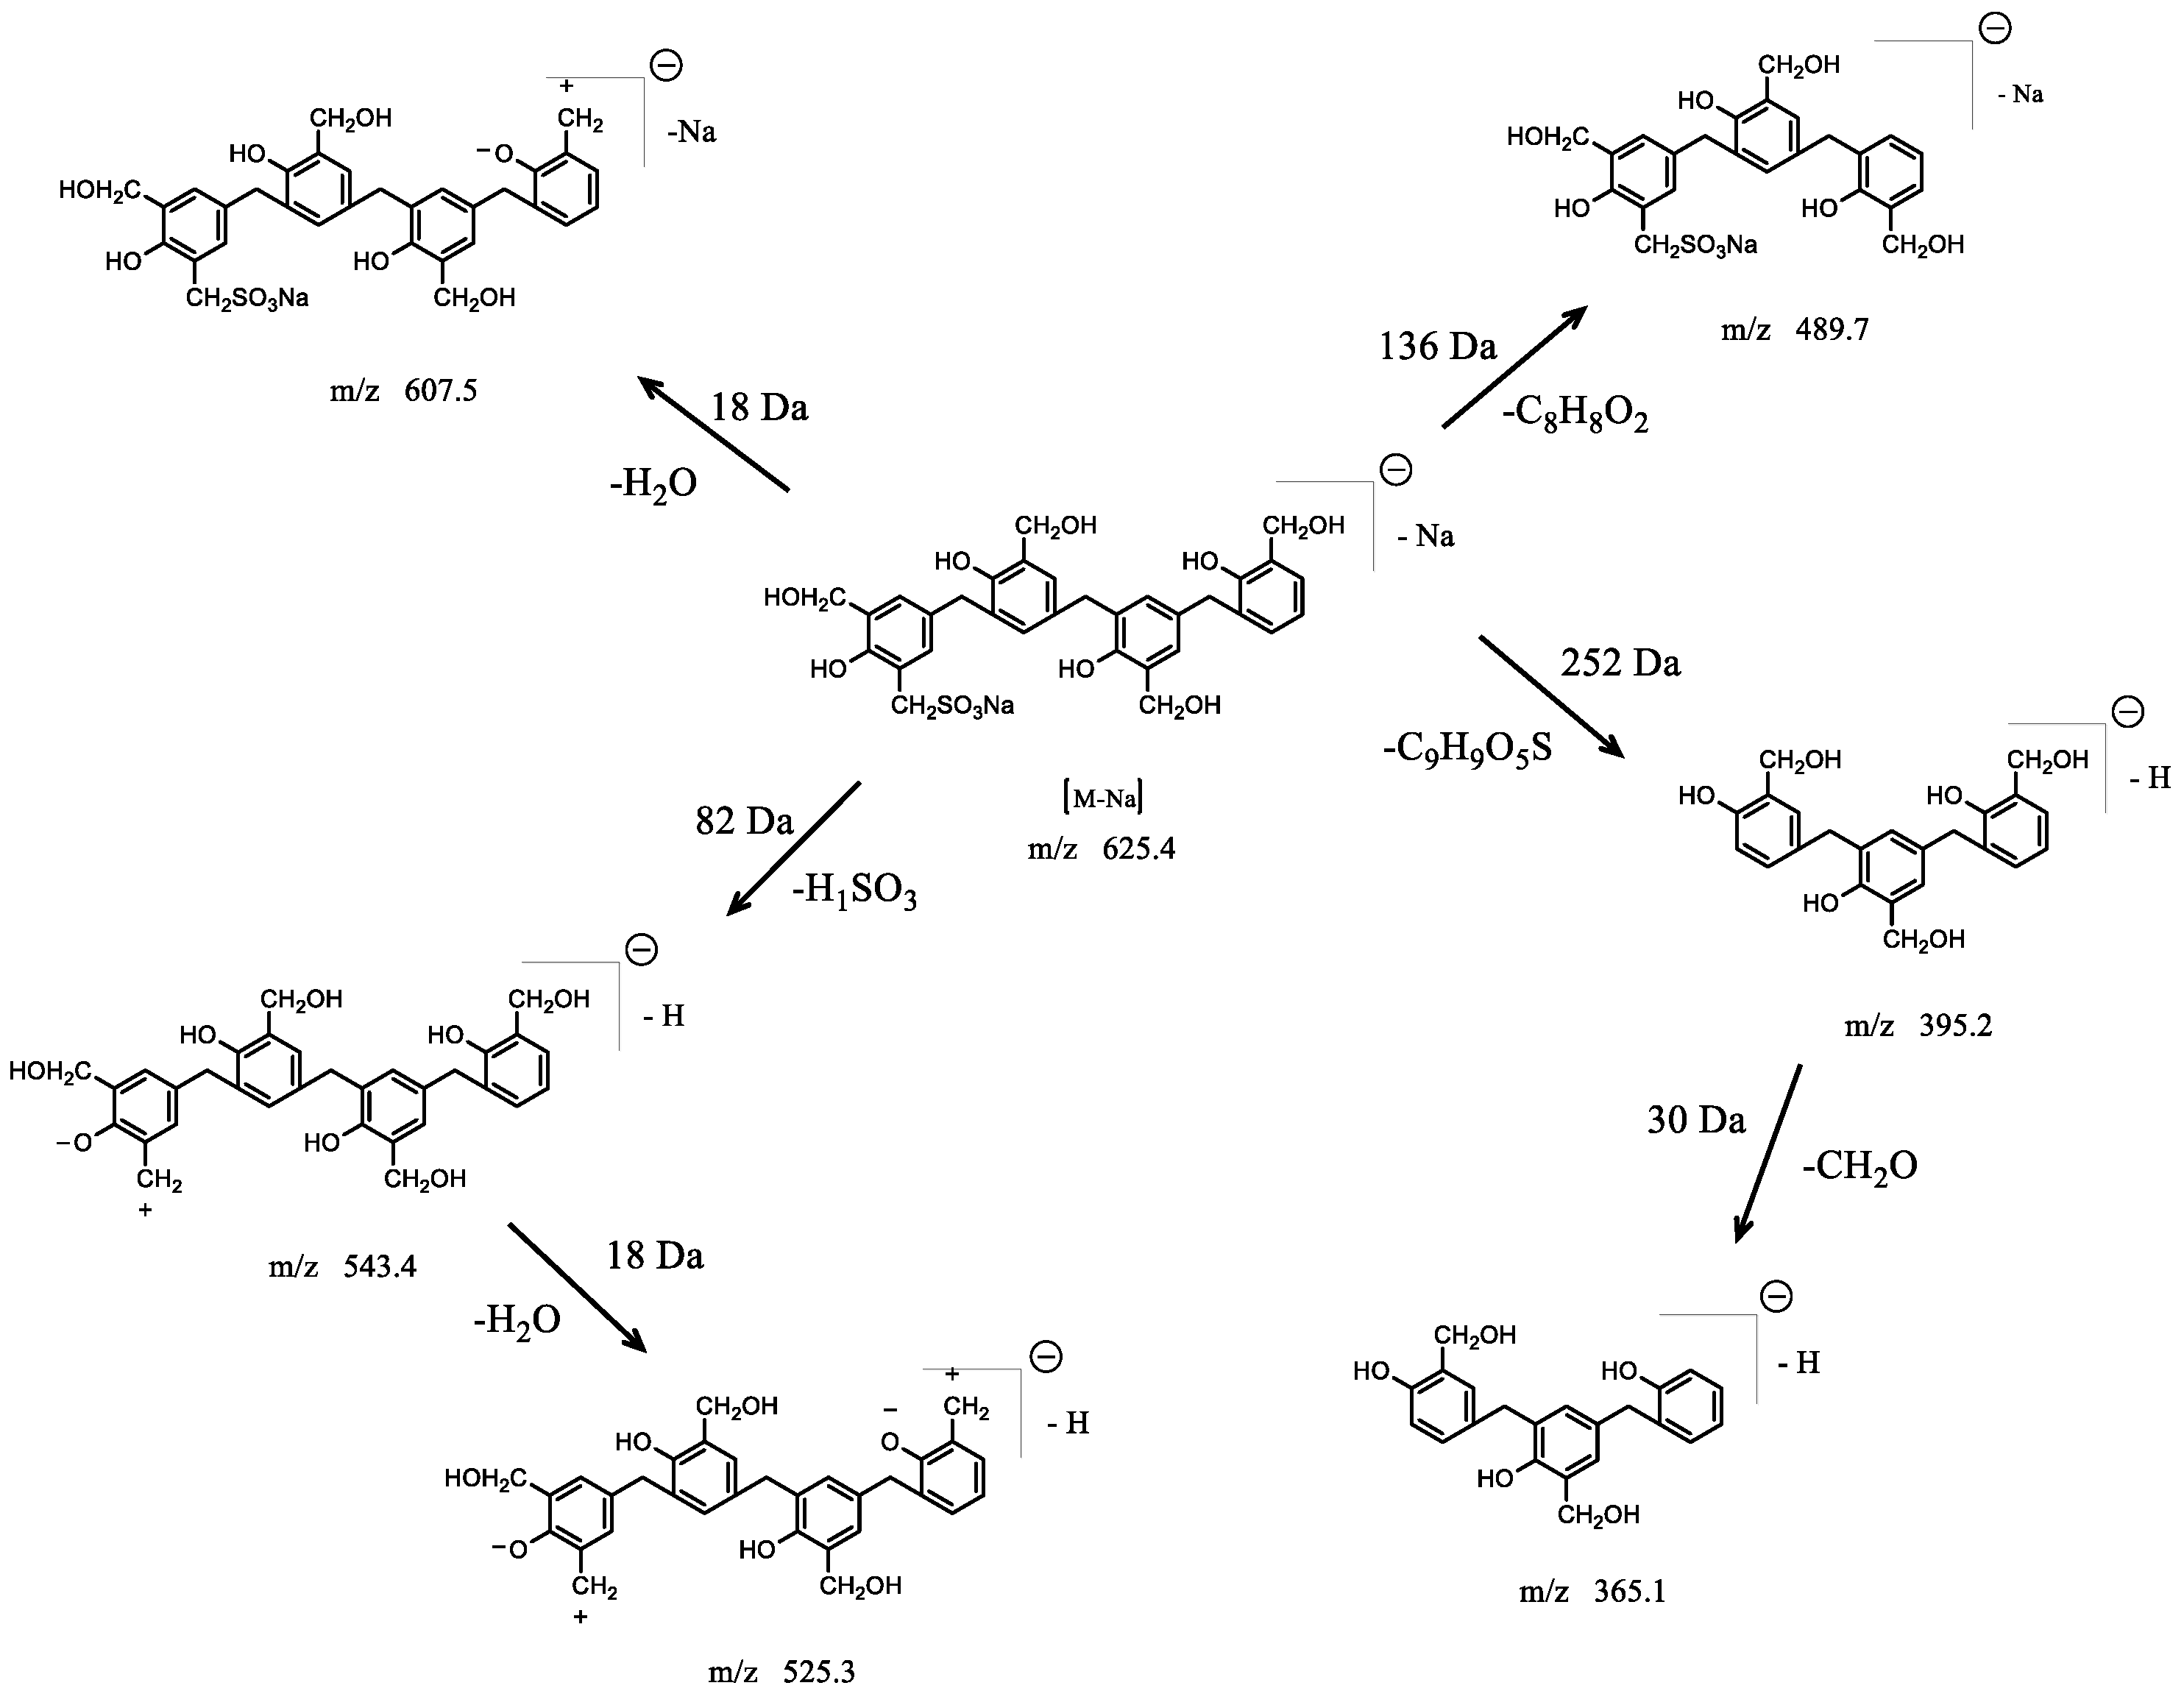
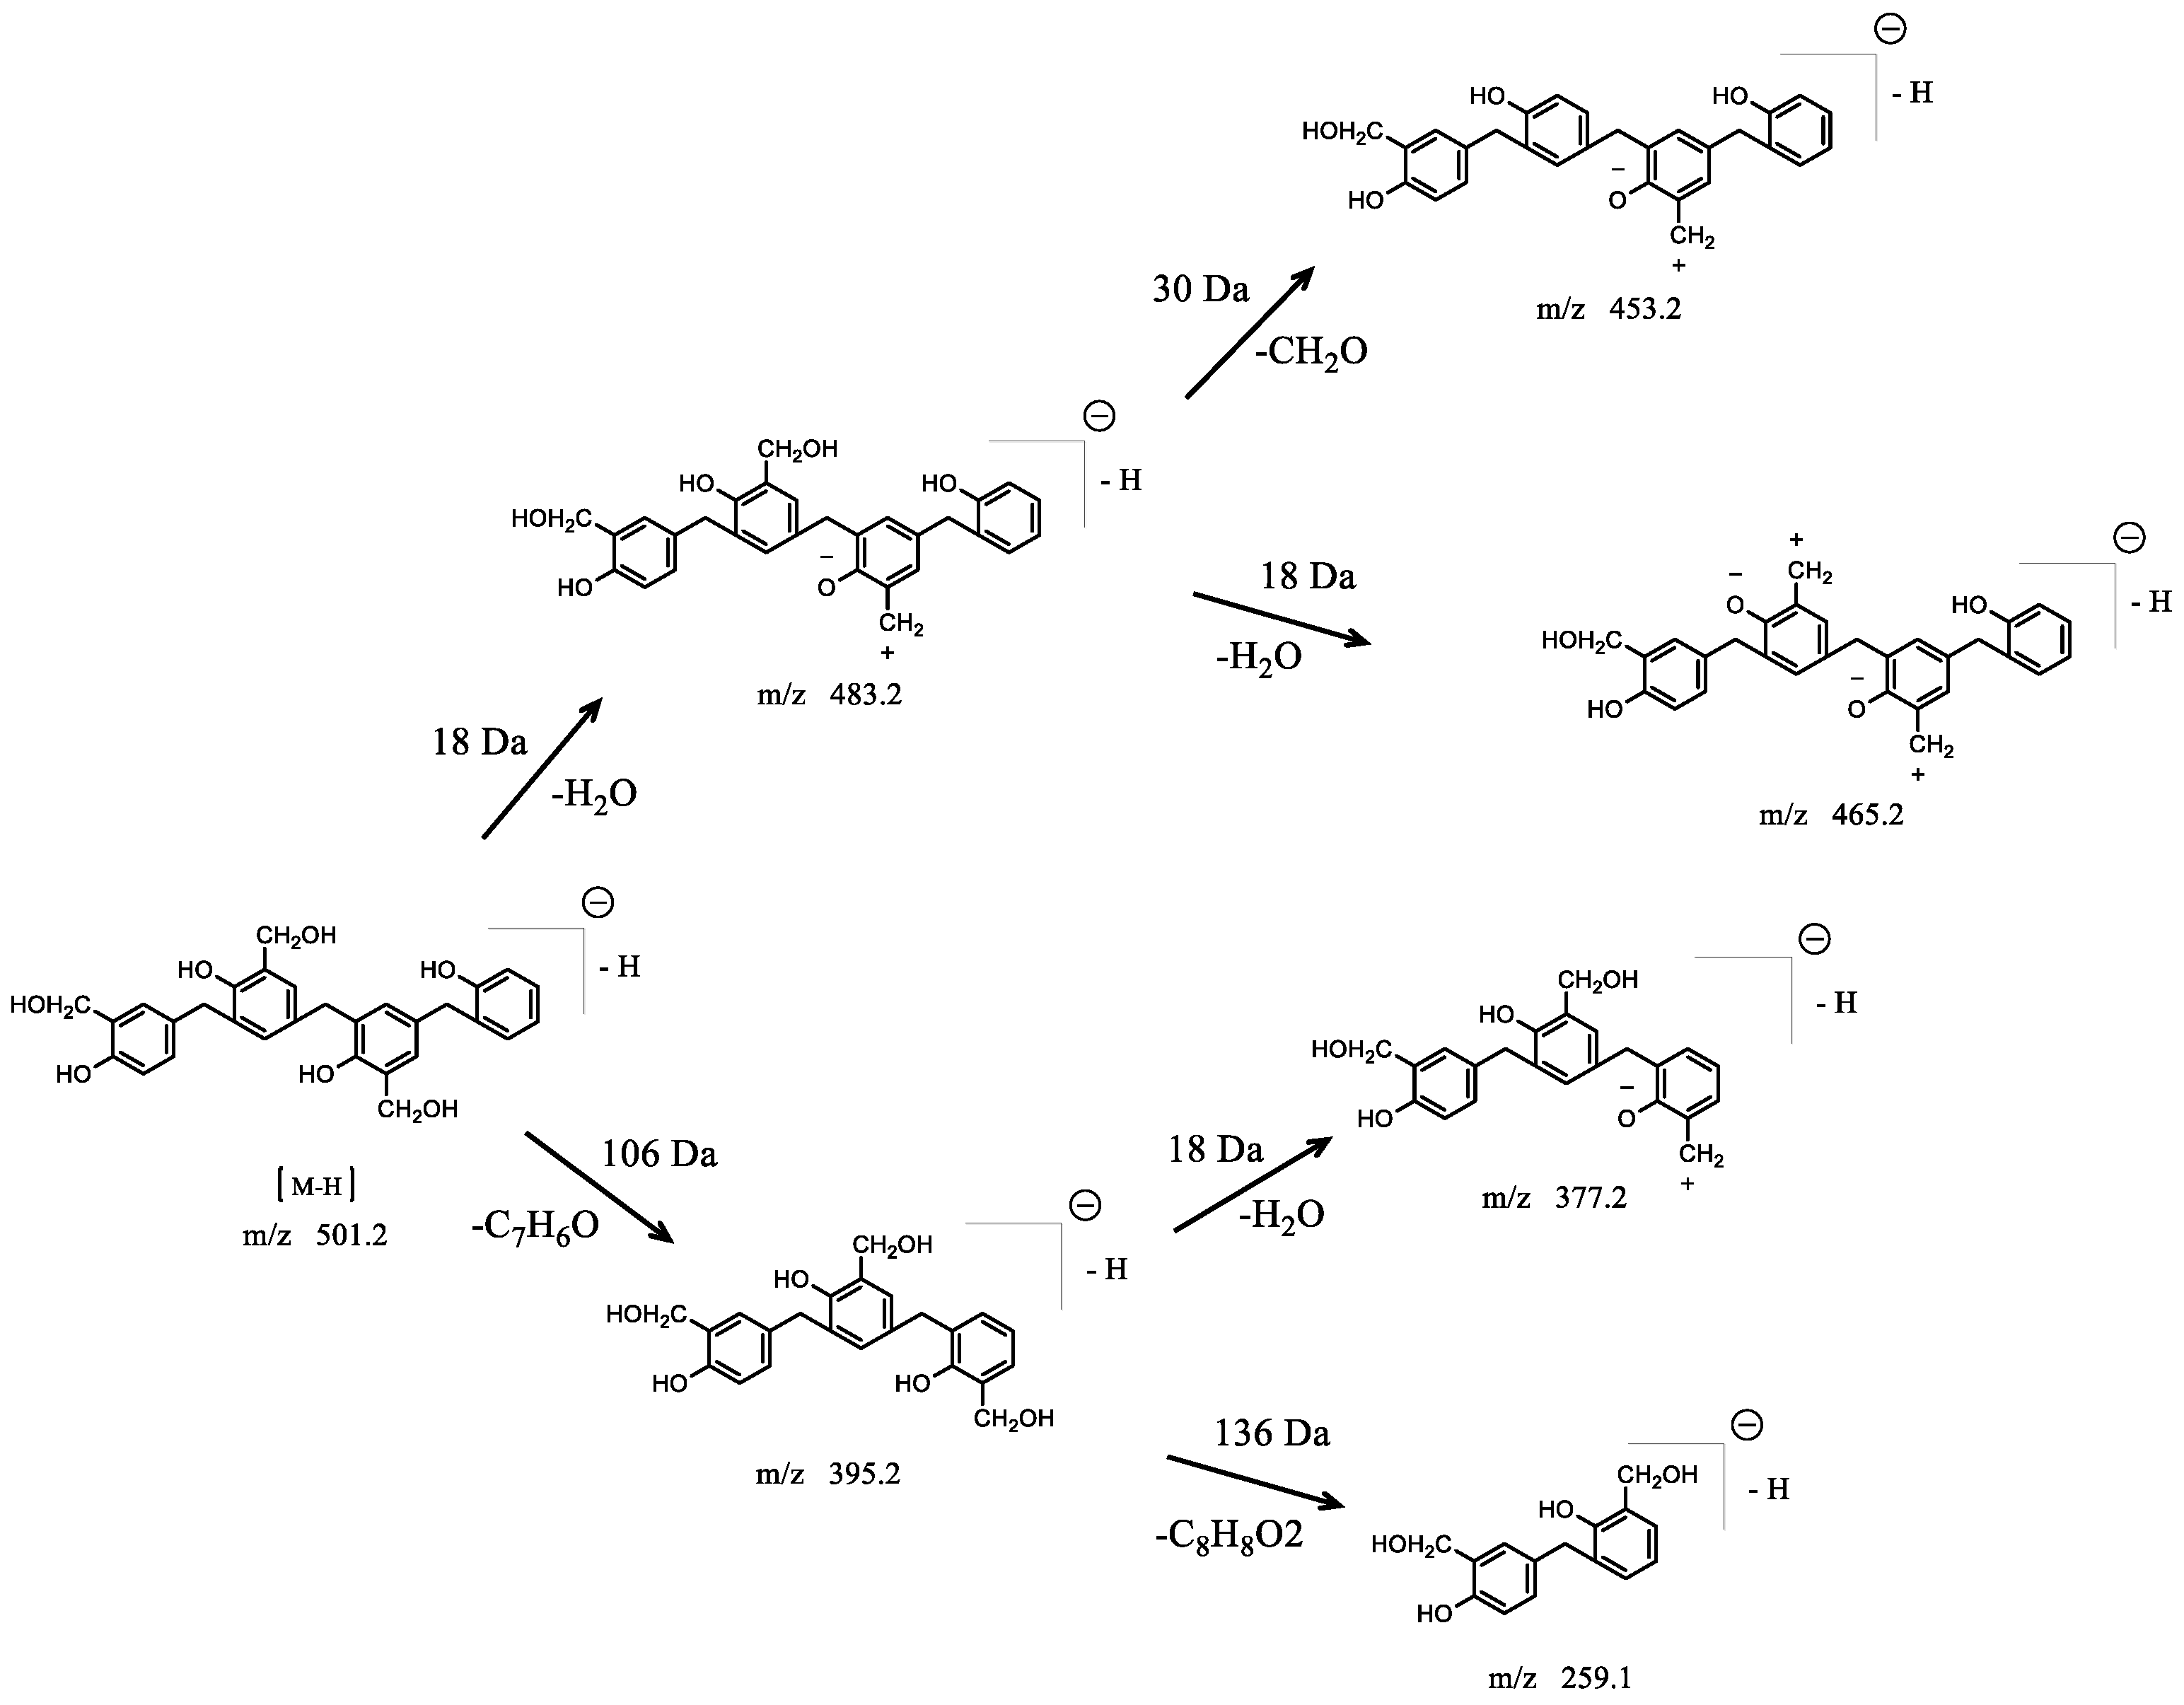
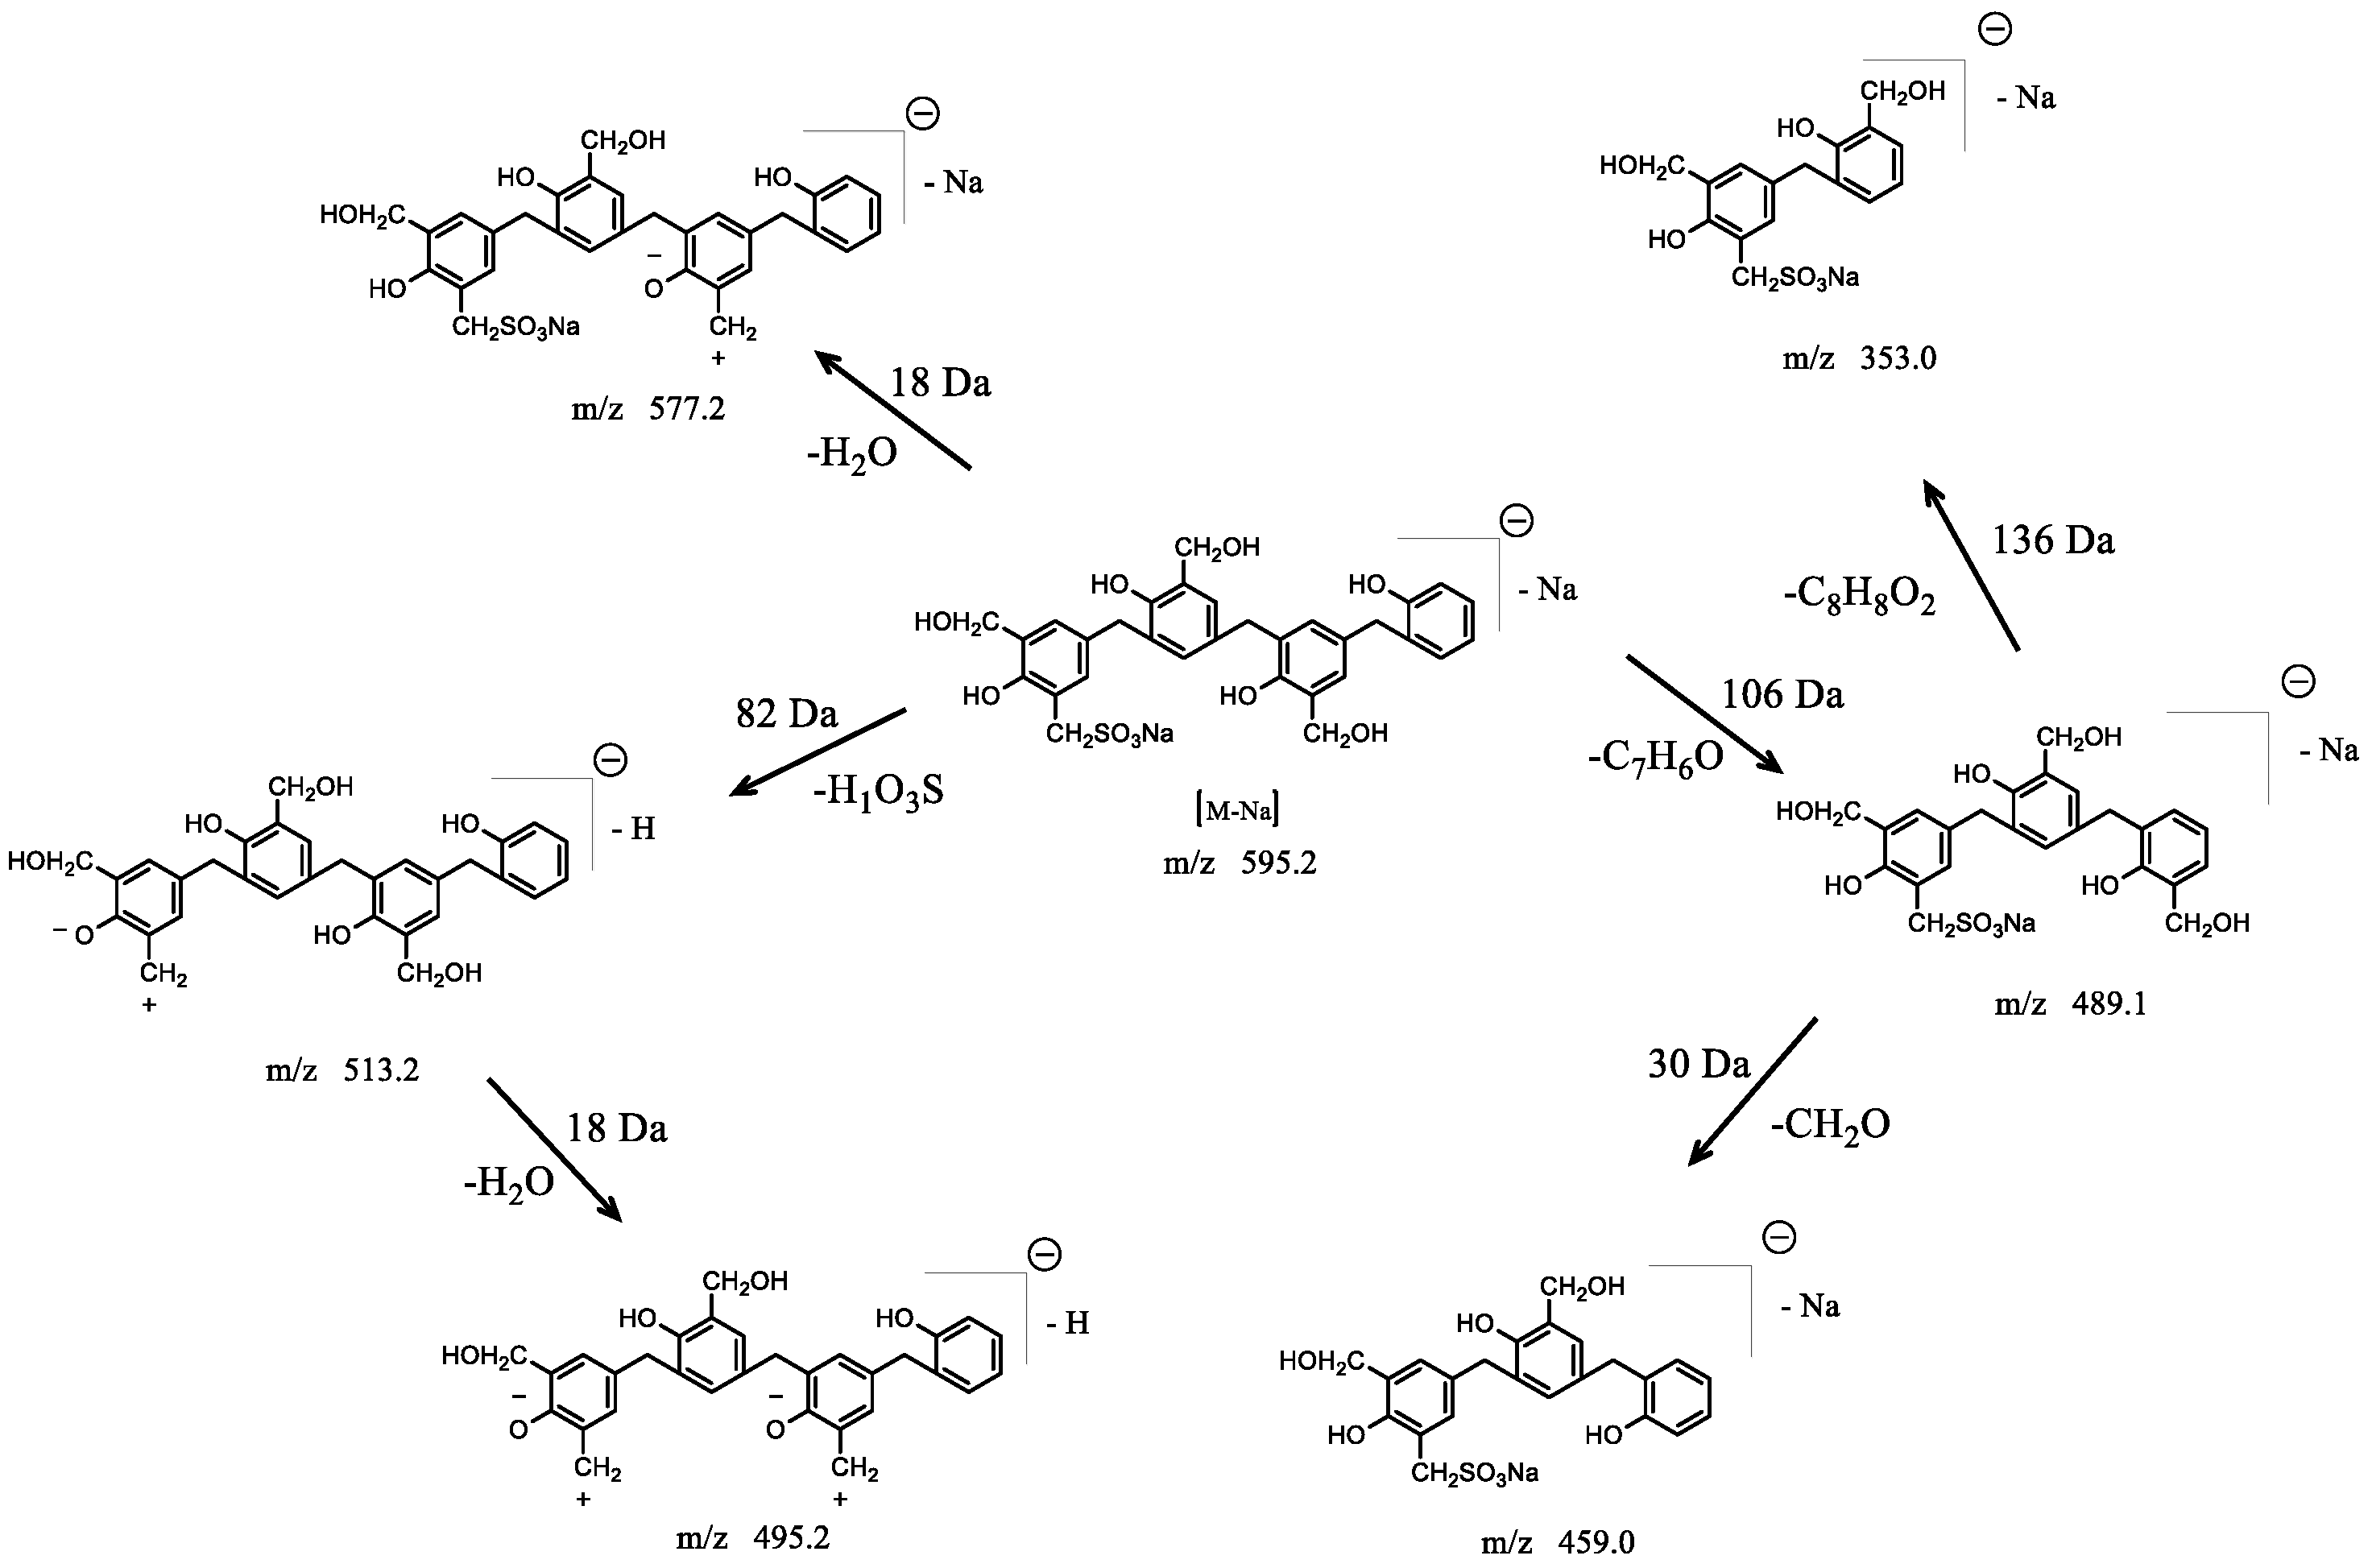
3.2.2. HPLC–MS/MS Technology
3.2.3. Effect of Formaldehyde/Phenol Molar Ratio(F/P) on SPF Resin Properties
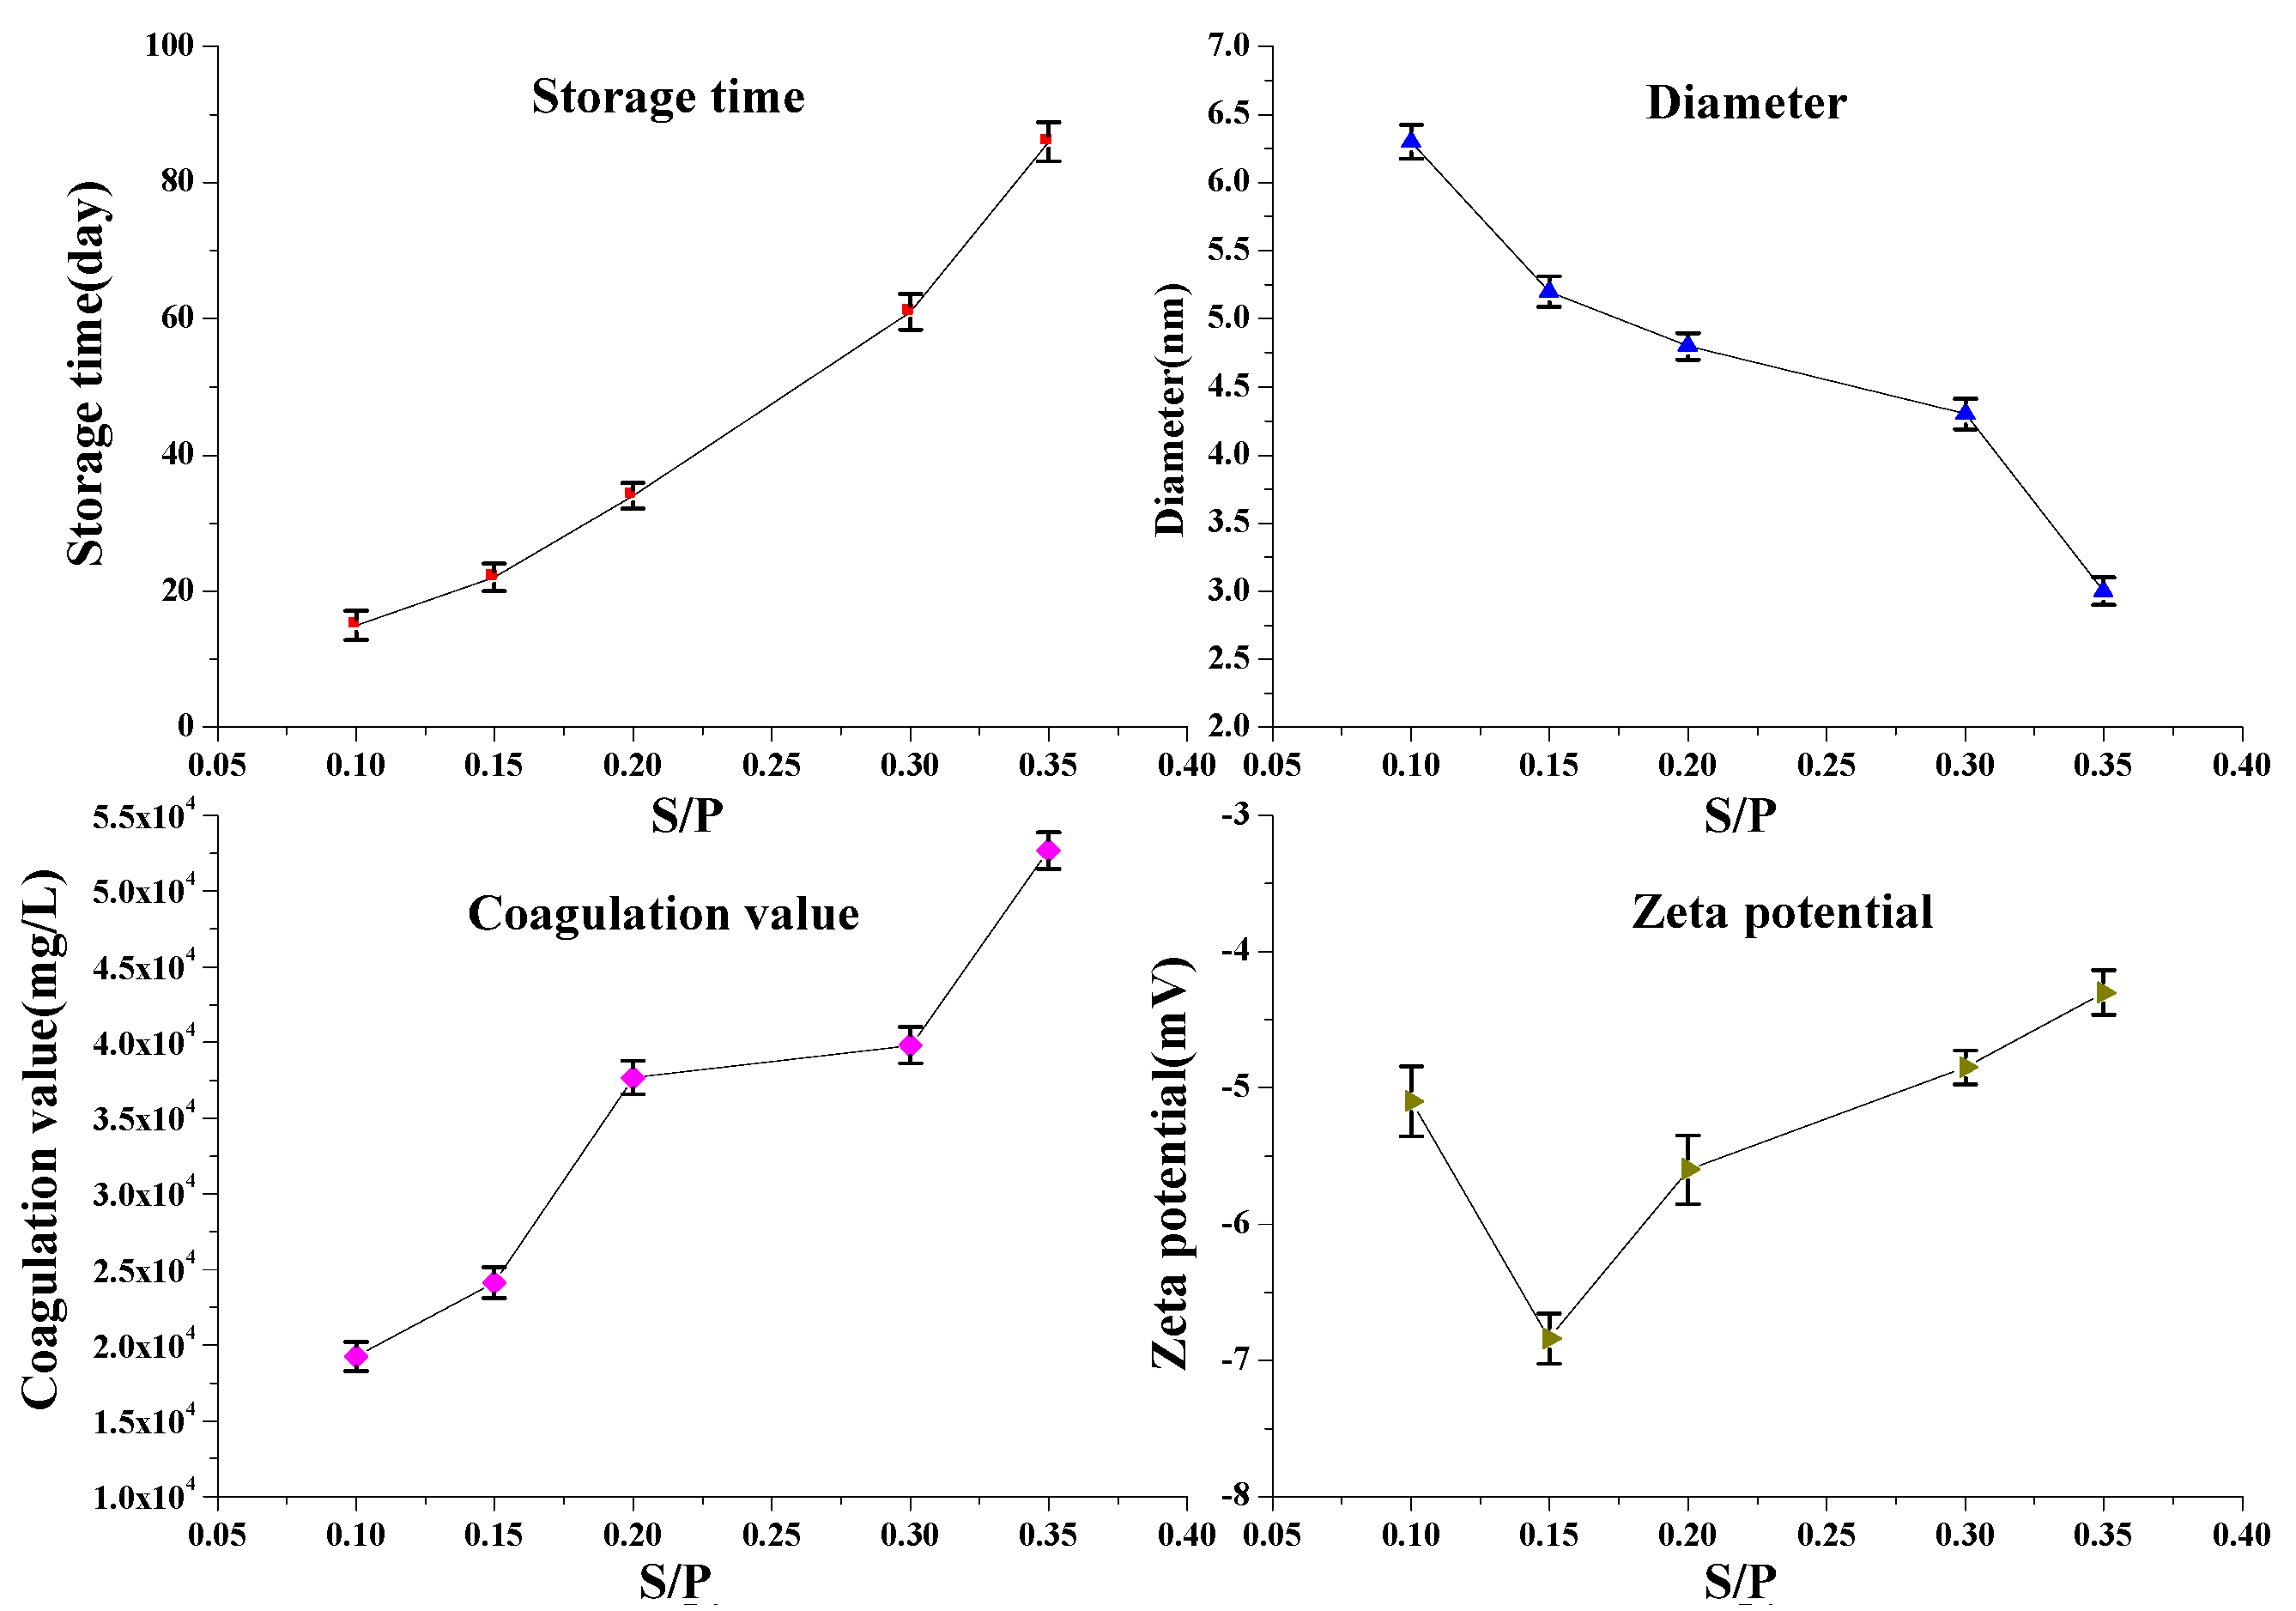
3.2.4. Effects of Sodium Formaldehyde Sulfoxylate/Phenol Molar Ratio (S/P) on PFR Performance
4. Discussion
5. Conclusions
Author Contributions
Funding
Data Availability Statement
Acknowledgments
Conflicts of Interest
References
- Liu, J.; Hou, Q.; Hu, R.; Wang, W. Summary of Modification and Application of Phenolic Resin. Sci. Technol. Innov. Mon. 2016, 29, 3. [Google Scholar]
- Huang, F.; Wan, L. Phenolic Resin and Its Application, 1st ed.; Chemical Industry Press: Beijing, China, 2011; pp. 21–22. [Google Scholar]
- Xu, G.; Chen, J.; Pan, T.; Zhang, L. Research Progress on heat-Resistant Modification of Phenolic Resin. Compos. Mater. Sci. Eng. 2021, 8, 120–128. [Google Scholar]
- Shipp, D.A.; Solomon, D.H. Functionality in phenol-formaldehyde step-growth polymerization. Polymer 1997, 38, 4229–4232. [Google Scholar] [CrossRef]
- Zhu, D.; Hou, J.; Meng, X.; Zheng, Z.; Wei, Q.; Chen, Y.; Bai, B. Effect of Different Phenolic Compounds on Performance of Organically Cross-Linked Terpolymer Gel Systems at Extremely High Temperatures. Energy Fuels 2017, 31, 8120–8130. [Google Scholar] [CrossRef]
- Meng, X.; Zhang, G.; Wu, J.; Zhao, X.; Wang, L.; Zhang, F. Experimental Study on Phenol-Formaldehyde Resin Aggregates as In-Depth Conformance Control Agents Stabilized by Polymer. Polymers 2022, 14, 3159. [Google Scholar] [CrossRef] [PubMed]
- Zhu, D.; Bai, B.; Hou, J. Polymer Gel Systems for Water Management in High-Temperature Petroleum Reservoirs: A Chemical Review. Energy Fuels 2017, 31, 13063–13087. [Google Scholar] [CrossRef]
- Zhu, D.; Hou, J.; Wei, Q.; Wu, X.; Bai, B. Terpolymer Gel System Formed by Resorcinol Hexamethylenetetramine for Water Management in Extremely High Temperature Reservoirs. Energy Fuels 2017, 31, 1519–1528. [Google Scholar] [CrossRef]
- Zhu, D.; Peng, S.; Zhao, S.; Wei, M.; Bai, B. Comprehensive Review of Sealant Materials for Leakage Remediation Technology in Geological CO2 Capture and Storage Process. Energy Fuels 2021, 35, 4711–4742. [Google Scholar] [CrossRef]
- Huang, R.; Jiao, Y. Phenolic Resin and Its Application; Chemical Industrial Press: Beijing, China, 2011. [Google Scholar]
- Tang, L.; Li, N.; Wu, P. High Performance Phenolic Resin and Its Application Technology; Chemical Industrial Press: Beijing, China, 2008. [Google Scholar]
- Yu, D.; Liu, X. Synthetic Resins and Plastics Performance Manual; China Machine Press: Beijing, China, 2011. [Google Scholar]
- Aierbe, G.A.; Echeverra, J.M.; Martin, M.; Etxeberria, A.M.; Mondragon, I. Influence of the initial formaldehyde to phenol molar ratio (F/P) on the formation of a phenolic resol resin catalyzed with amine. Polymer 2000, 41, 6797–6802. [Google Scholar] [CrossRef]
- Guo, R.; Huo, W.; Wang, N.; He, G.; Feng, W.; Li, X. Synthesis and Cross-Linking Mechanism of Hydroxymethyl Water-soluble Phenolic Resin Crosslinking Agent. J. Shaanxi Univ. Sci. Technol. 2020, 38, 81–86. [Google Scholar]
- Meng, X. Study on Synthesis of Water-soluble Novolak Resin and Its Property of In-depth Profile Control of Reservoir. Ph.D. Thesis, China University of Petroleum (Beijing), Beijing, China, 2016. [Google Scholar]
- Peng, T.; Li, Y.; Wang, Z.; Xu, L.; Shu, Z.; Zheng, J. Synthesis and Property Evaluation of High Temperature Resistant Thermosetting Phenolic Resin Plugging Agent. Petrochem. Eng. 2021, 50, 691–697. [Google Scholar]
- Zhao, D. Study on the Synthesis and Dispersion Property of Low-solubility Phenol Formaldehyde Resin. Ph.D. Thesis, China University of Petroleum (Beijing), Beijing, China, 2013. [Google Scholar]
- Grenier-Loustalot, M.F.; Larroque, S.; Grenier, P.; Leca, J.P.; Bedel, D. Phenolic resins: 1. Mechanisms and kinetics of phenol and of the first polycondensates towards formaldehyde in solution. Polymer 1994, 35, 3046–3054. [Google Scholar] [CrossRef]
- Manfredi, L.B.; Osa, O.; Fernández, N.; Vázquez, A. Structure–properties relationship for resols with different formaldehyde/phenol molar ratio. Polymer 1999, 40, 3867–3875. [Google Scholar] [CrossRef]
- Hu, X.; Zhao, Y.; Cheng, W.; Wang, D.; Nie, W. Synthesis and characterization of phenol-urea-formaldehyde foaming resin used to block air leakage in mining. Polym. Compos. 2014, 35, 2056–2066. [Google Scholar] [CrossRef]
- Roczniak, K.; Biernacka, T.; Skarżyński, M. Some properties and chemical structure of phenolic resins and their derivatives. J. Appl. Polym. Sci. 2010, 28, 531–542. [Google Scholar] [CrossRef]
- Ye, X.; Huang, H.-L.; Hsu, K.-C. A water-soluble acrylate/sulfonate copolymer. I. Its synthesis and dispersing ability on cement. J. Appl. Polym. Sci. 2006, 100, 2490–2496. [Google Scholar] [CrossRef]
- Ouyang, X.; Jiang, X.; Qiu, X.; Yang, D.; Pang, Y. Effect of molecular weight of sulfanilic acid-phenol-formaldehyde condensate on the properties of cementitious system. Cem. Concr. Res. 2009, 39, 283–288. [Google Scholar] [CrossRef]
- Andersen, P.J.; Roy, D.M.; Gaidis, J.M. The effect of superplasticizer molecular weight on its adsorption on, and dispersion of, cement. Cem. Concr. Res. 1988, 18, 980–986. [Google Scholar] [CrossRef]


| Retention Time | Exptl | [M-H]− | [M-Na]− | P | H | S |
|---|---|---|---|---|---|---|
| cacd | cacd | |||||
| 21–26 min | 319.5 | 320.3 | - | 2 | 4 | 0 |
| 425.6 | 426.4 | - | 3 | 4 | 0 | |
| 455.4 | 456.4 | - | 3 | 5 | 0 | |
| 531.6 | 532.5 | - | 4 | 3 | 0 | |
| 561.5 | 562.6 | - | 4 | 5 | 0 | |
| 591.5 | 592.6 | - | 4 | 6 | 0 | |
| 31.7–32.6 min | 459.5 | - | 459.5 | 3 | 2 | 1 |
| 489.5 | - | 489.5 | 3 | 3 | 1 | |
| 595.5 | - | 595.6 | 4 | 3 | 1 | |
| 625.5 | - | 625.6 | 4 | 4 | 1 | |
| 655.6 | - | 655.6 | 4 | 5 | 1 | |
| 761.9 | - | 761.7 | 5 | 5 | 1 | |
| 791.6 | - | 791.8 | 5 | 6 | 1 | |
| 927.7 | - | 927.9 | 6 | 7 | 1 | |
| 1063.7 | - | 1064.0 | 7 | 8 | 1 | |
| 34.7–35.0 min | 365.6 | 366.4 | - | 3 | 2 | 0 |
| 459.6 | 459.5 | 3 | 2 | 1 | ||
| 501.7 | 502.5 | - | 4 | 3 | 0 | |
| 595.8 | - | 595.6 | 4 | 3 | 1 | |
| 638.0 | 638.7 | - | 5 | 4 | 0 | |
| 701.3 | - | 701.7 | 5 | 3 | 1 | |
| 731.8 | - | 731.7 | 5 | 4 | 1 | |
| 773.9 | 774.8 | - | 6 | 5 | 0 | |
| 837.7 | - | 837.9 | 6 | 4 | 1 | |
| 867.9 | - | 867.9 | 6 | 5 | 1 | |
| 973.8 | - | 974.0 | 7 | 5 | 1 | |
| 1003.8 | - | 1004.0 | 7 | 6 | 1 | |
| 1033.9 | - | 1034.0 | 7 | 7 | 1 | |
| 1040 | - | 1140.1 | 8 | 7 | 1 | |
| 1276 | - | 1276.3 | 9 | 8 | 1 | |
| 1306 | - | 1306.3 | 9 | 9 | 1 |
Publisher’s Note: MDPI stays neutral with regard to jurisdictional claims in published maps and institutional affiliations. |
© 2022 by the authors. Licensee MDPI, Basel, Switzerland. This article is an open access article distributed under the terms and conditions of the Creative Commons Attribution (CC BY) license (https://creativecommons.org/licenses/by/4.0/).
Share and Cite
Meng, X.; Wang, L.; Wang, H.; Zhang, F.; Su, T.; Cheng, K. Development and Evaluation of a Novel Sulfonated Phenol–Formaldehyde Resin with High Dispersion Stability. Polymers 2022, 14, 4682. https://doi.org/10.3390/polym14214682
Meng X, Wang L, Wang H, Zhang F, Su T, Cheng K. Development and Evaluation of a Novel Sulfonated Phenol–Formaldehyde Resin with High Dispersion Stability. Polymers. 2022; 14(21):4682. https://doi.org/10.3390/polym14214682
Chicago/Turabian StyleMeng, Xianxing, Likun Wang, Hongwei Wang, Fang Zhang, Taying Su, and Kunmu Cheng. 2022. "Development and Evaluation of a Novel Sulfonated Phenol–Formaldehyde Resin with High Dispersion Stability" Polymers 14, no. 21: 4682. https://doi.org/10.3390/polym14214682