
Fatigue Crack Propagation Prediction of Corroded Steel Plate Strengthened with Carbon Fiber Reinforced Polymer (CFRP) Plates

Abstract
:1. Introduction
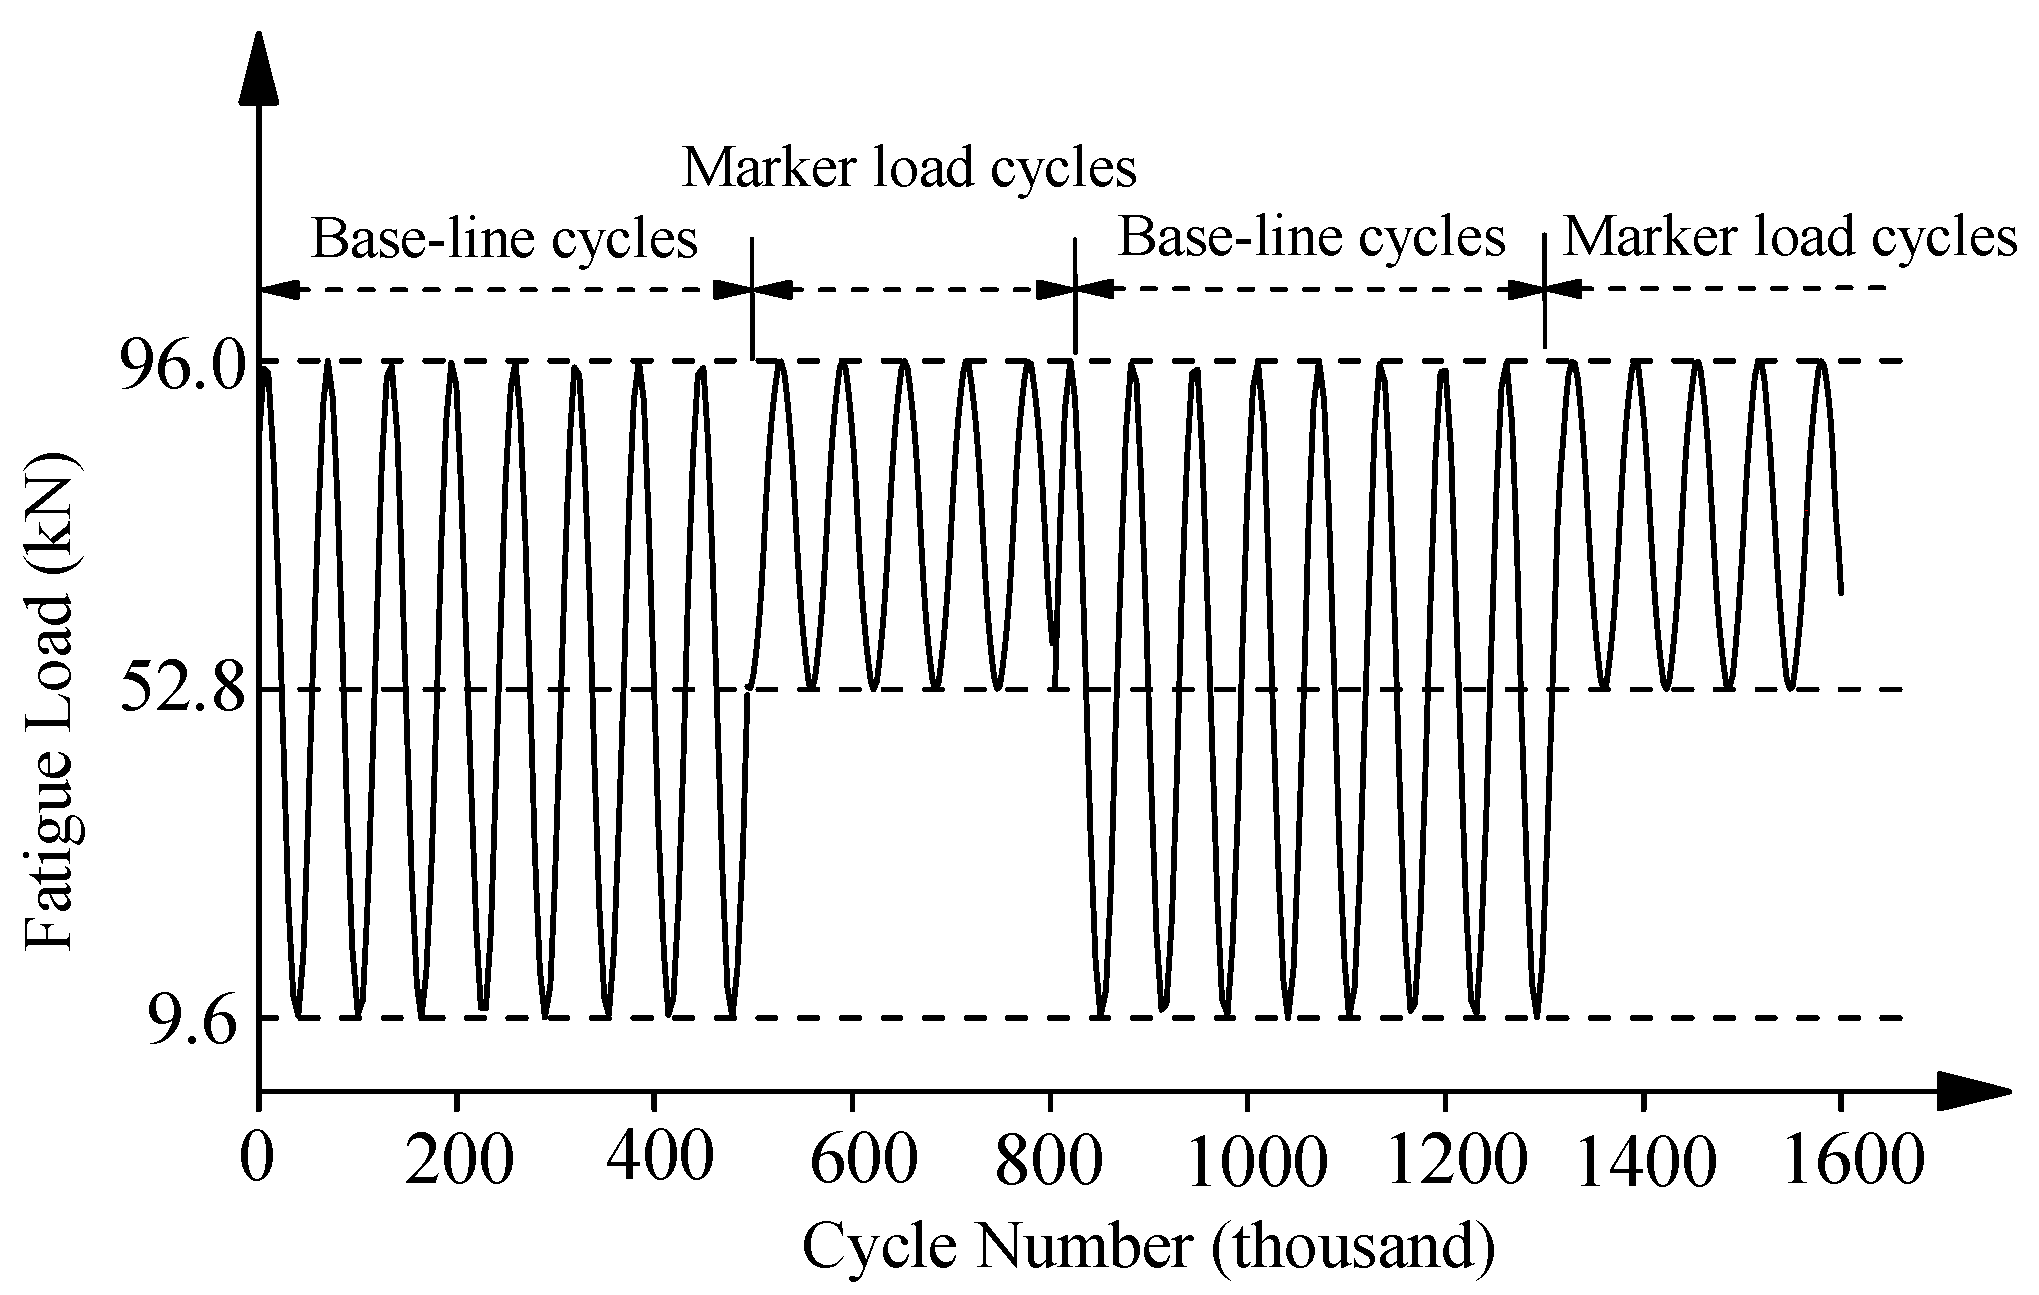
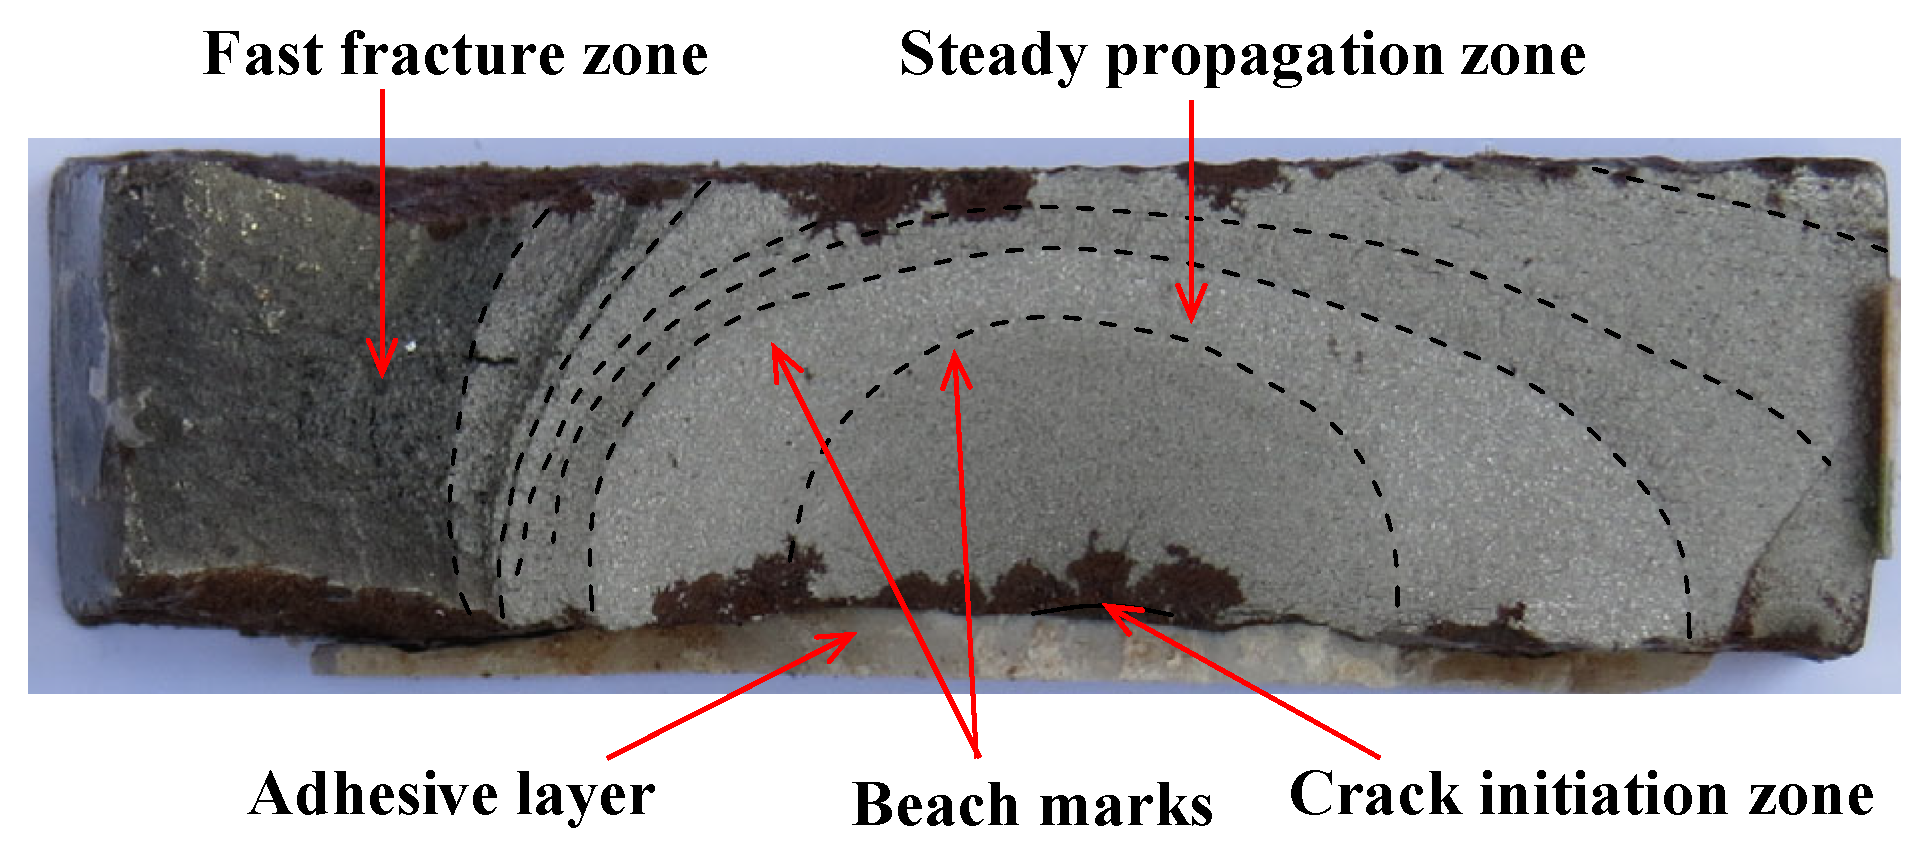
2. Experimental Evidence
3. Two-Stage Crack Propagation Analysis Model of Corroded Steel Plate Strengthened with CFRP Plates
- (1)
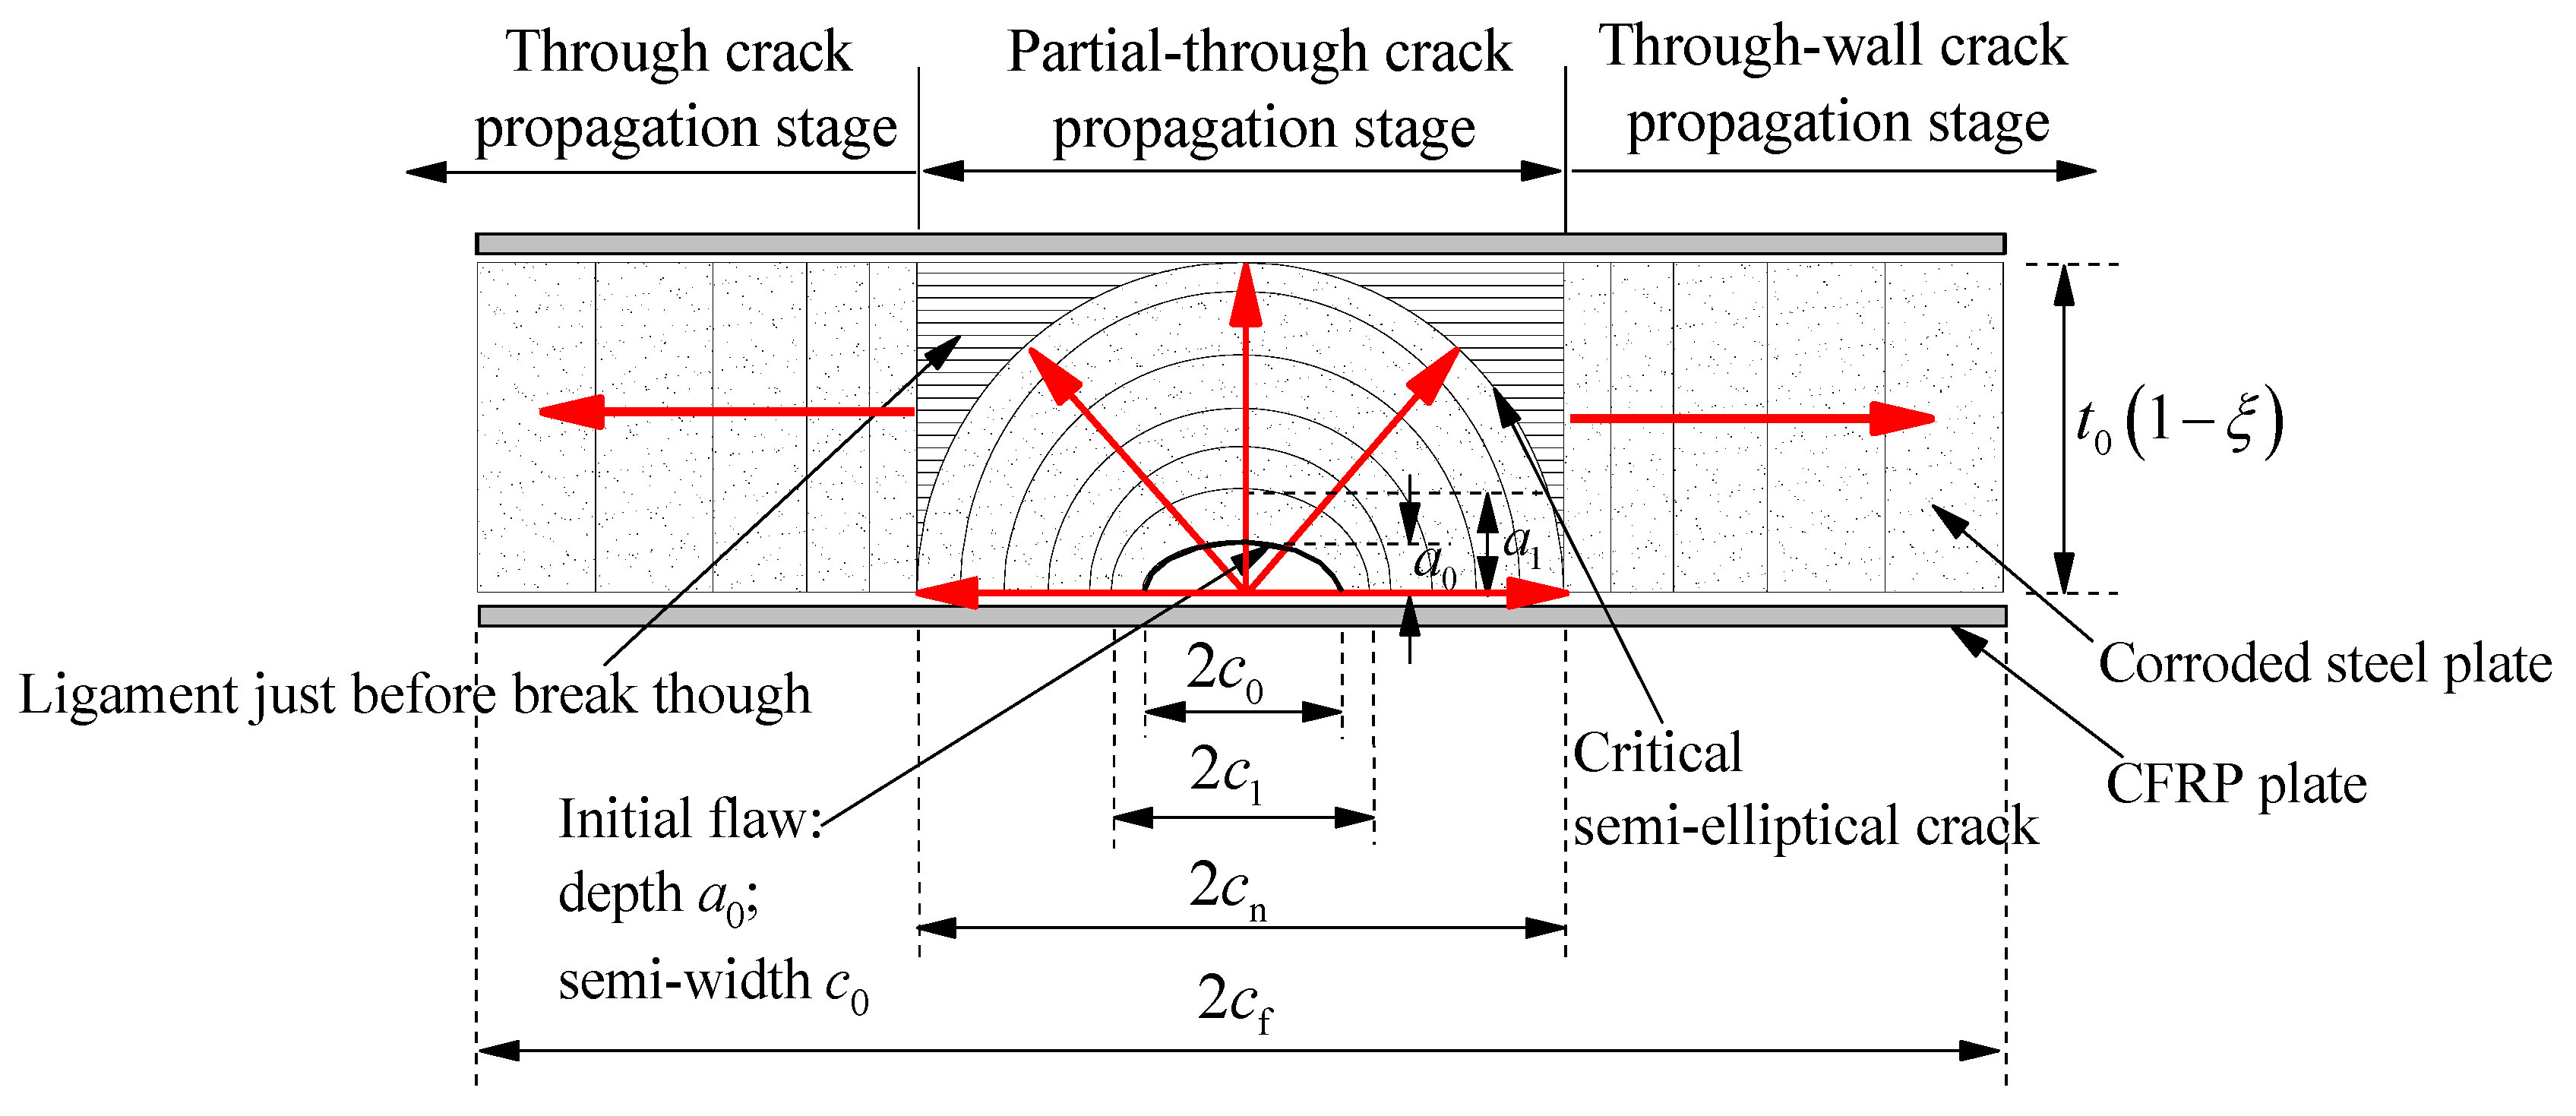
- The fatigue crack propagation process of the corroded steel plate strengthened with CFRP plates consists of the partial-through crack propagation stage and the through crack propagation stage.
- (2)
- The critical pit is equivalent to an initial semi-elliptical surface crack, and the shape of a growing crack remains semi-elliptical during the partial-through crack propagation stage.
- (3)
- Ignoring the rapid propagation process of the ligament just before break-though, the critical semi-elliptical crack at the end of the partial-though crack propagation stage is equivalent to a though-wall crack with the same width and is taken as the initial crack at the though crack propagation stage.
- (4)
- In the stage of through crack propagation, the difference in SIF along the thickness direction of the steel plate is ignored, and the crack propagation rate is calculated by taking the SIF of the crack tip in the middle of the thickness of the steel plate.
4. Material Constant Calibration
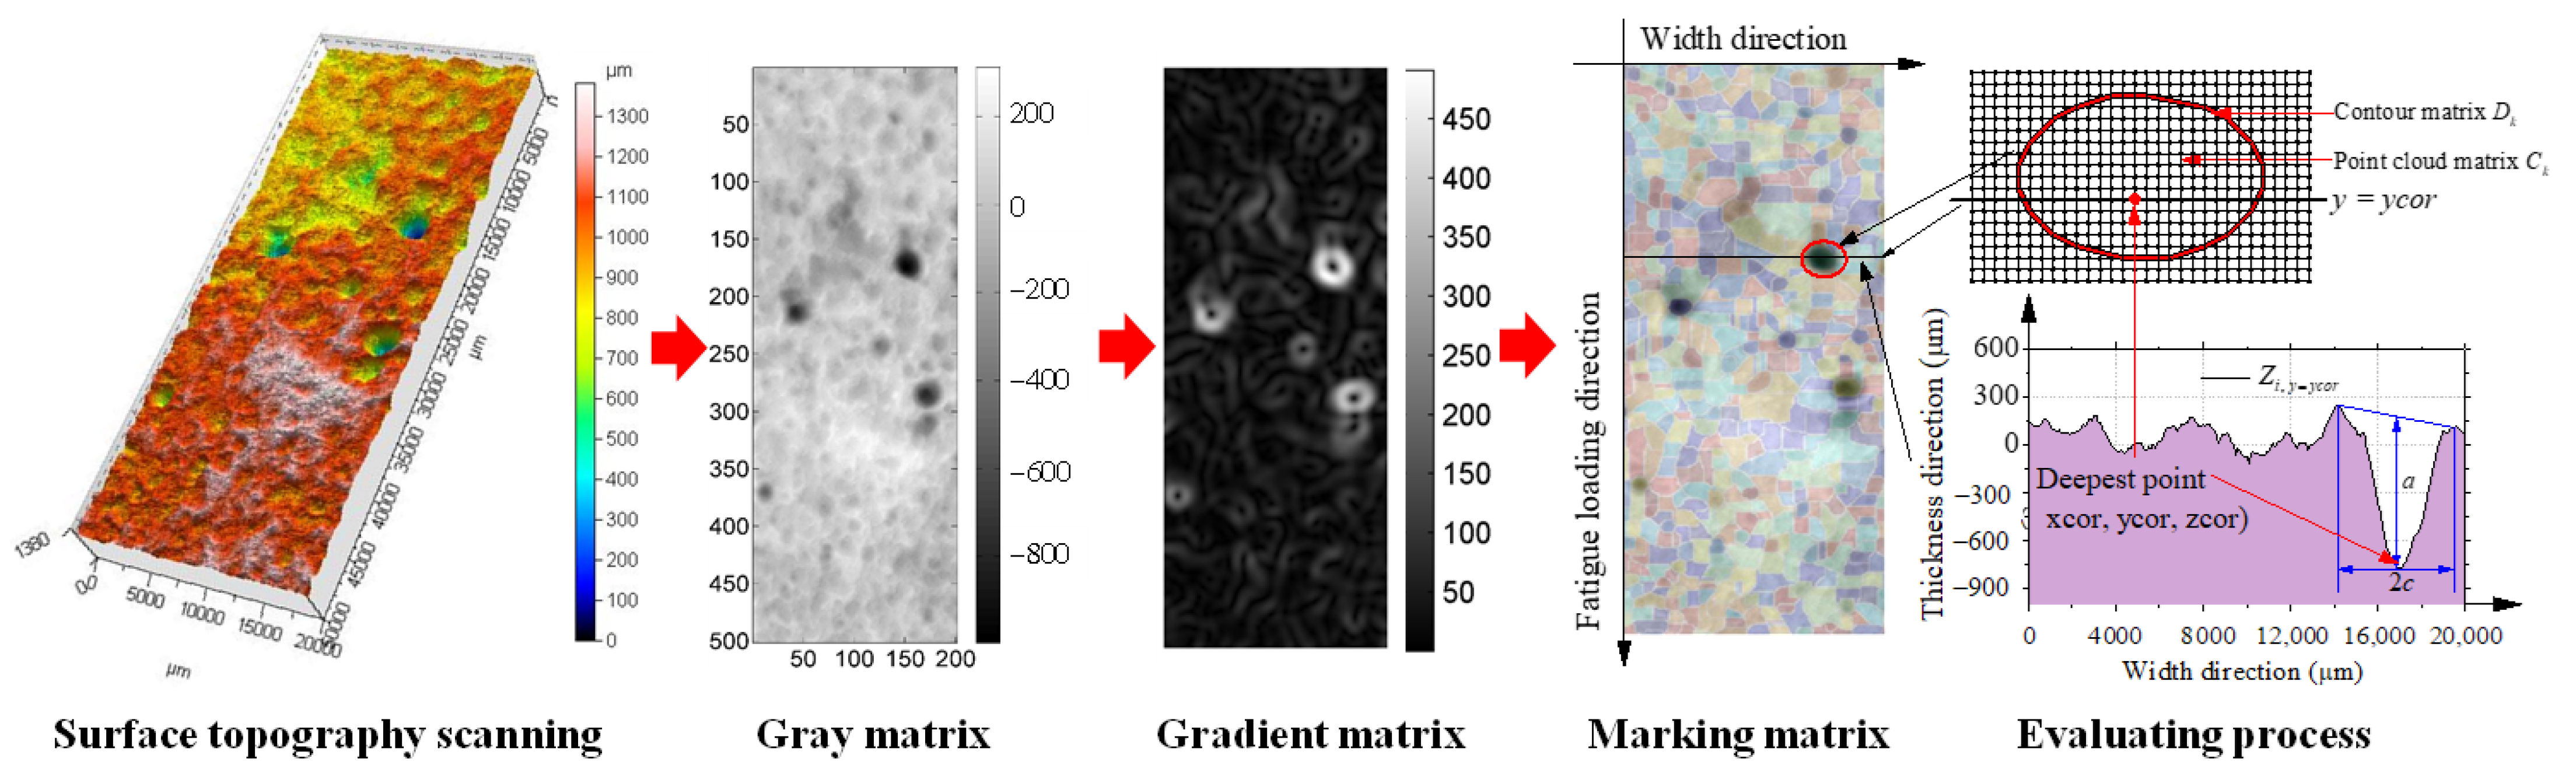
5. Identification of Critical Rust Pits and the Equivalent of Initial Cracks
- (1)
- The thickness of the corroded steel plate is converted according to the weight loss rate ξ and the thickness of the uncorroded steel plate, and the critical corrosion pit is equivalent to a semi-elliptical surface crack located at the center of the corroded steel plate.
- (2)
- The dimension (i.e., the depth and width) of the equivalent initial semi-elliptical surface crack includes two kinds of constitution, where the width and depth of the critical rust pit (i.e., the deepest rust pit) are taken as the equivalent dimension of type I crack, the maximum depth and the average width of the rust pits are taken as the equivalent dimension of type II crack.
- (3)
- The depth and width of the rust pit are calculated according to Equations (20) and (21), and the calculation process of the dimension of all corrosion pits on the corroded steel surface is carried out by adopting the developed rust pit identification, extraction and evaluation program.
6. Calculation Method of SIF at Crack Tip of Corroded Steel Plate Strengthened with CFRP Plates
6.1. Finite Element Model
6.2. Calculation Method of Strain Energy Release Rate
7. Case Analysis and Model Verification
7.1. Case Analysis
7.2. Model Verification
- (1)
- The depth of the rust pits is the most important factor determining the initiation and propagation of fatigue crack, and the idea that the maximum pit depth is taken as the depth of the equivalent crack has been verified in many literatures [45,47]. The average pit width of the rust pits is equivalent to the initial crack width, which makes the width more representative.
- (2)
- The widths of these two types of cracks in Table 2 are greater than the corresponding crack depths. As for semi-ellipsoidal rust pits, when the pit width is greater than its depth, the maximum stress point appears at the bottom of the rust pit, and the smaller the pit width/depth ratio, the more serious the stress concentration of the rust pit [53]. By comparing the widths of these two types of equivalent cracks in Table 2, it can be found that the average width () of every specimen is smaller than the width of the critical rust pit (). From the perspective of stress concentration, the deep and narrow rust pit corresponding to the type II equivalent crack is more prone to fatigue crack initiation than the deep and wide rust pit which corresponds to the type I equivalent crack.
- (3)
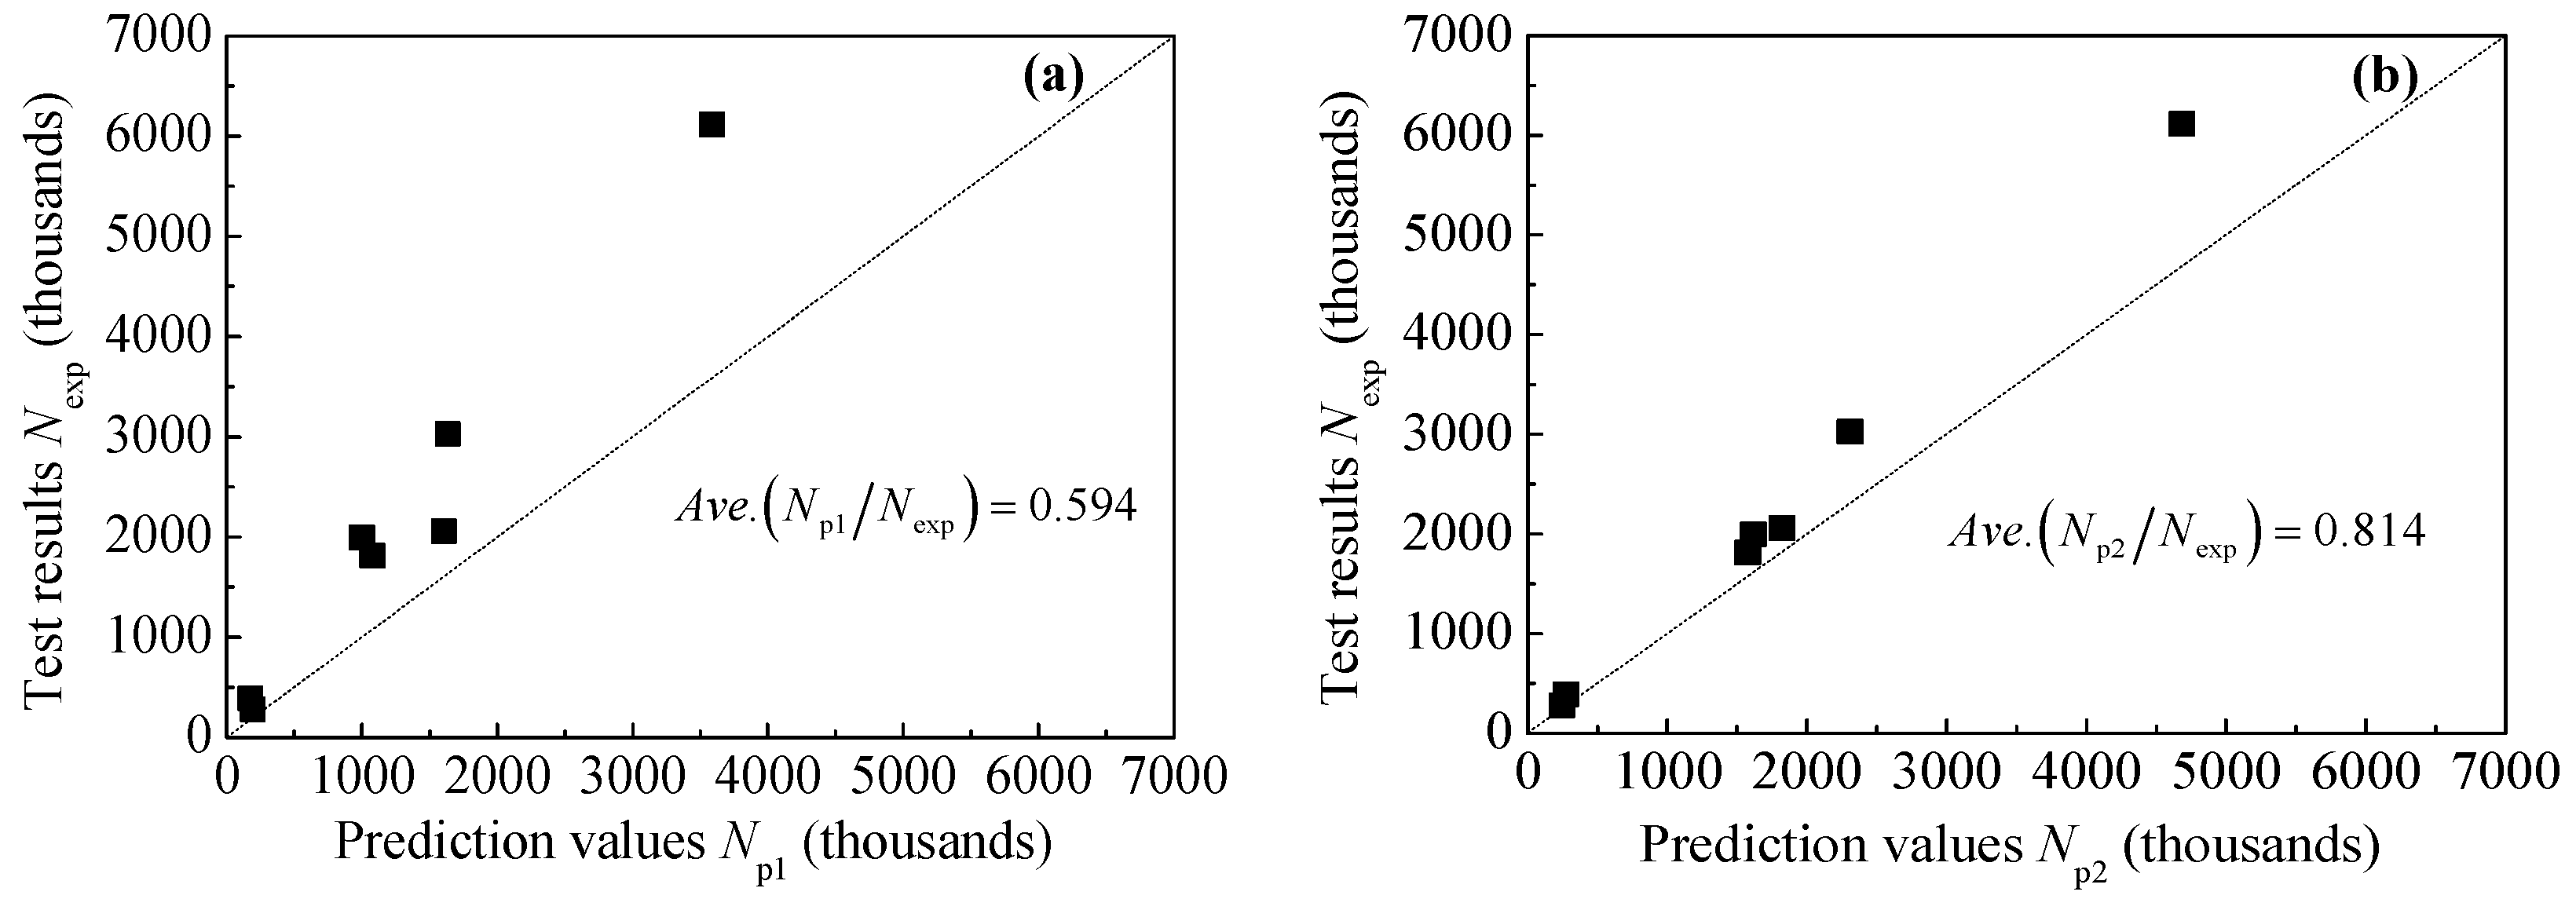
- From the perspective of calculation accuracy, the prediction values of fatigue crack propagation life corresponding to the type I equivalent crack are too conservative compared with the test results, whereas the prediction values of fatigue crack propagation life corresponding to type II equivalent crack are in better agreement with the test results. Figure 16 presents the comparison between the prediction values and test results. As presented in Figure 16, the average values of and are 0.595 and 0.814, respectively. Considering the discreteness of fatigue tests, the calculation accuracy corresponding to the type II equivalent crack is still satisfactory, and the prediction values are still safe compared to the test results, which is of great practical interest for engineering applications.
8. Parameter Analysis
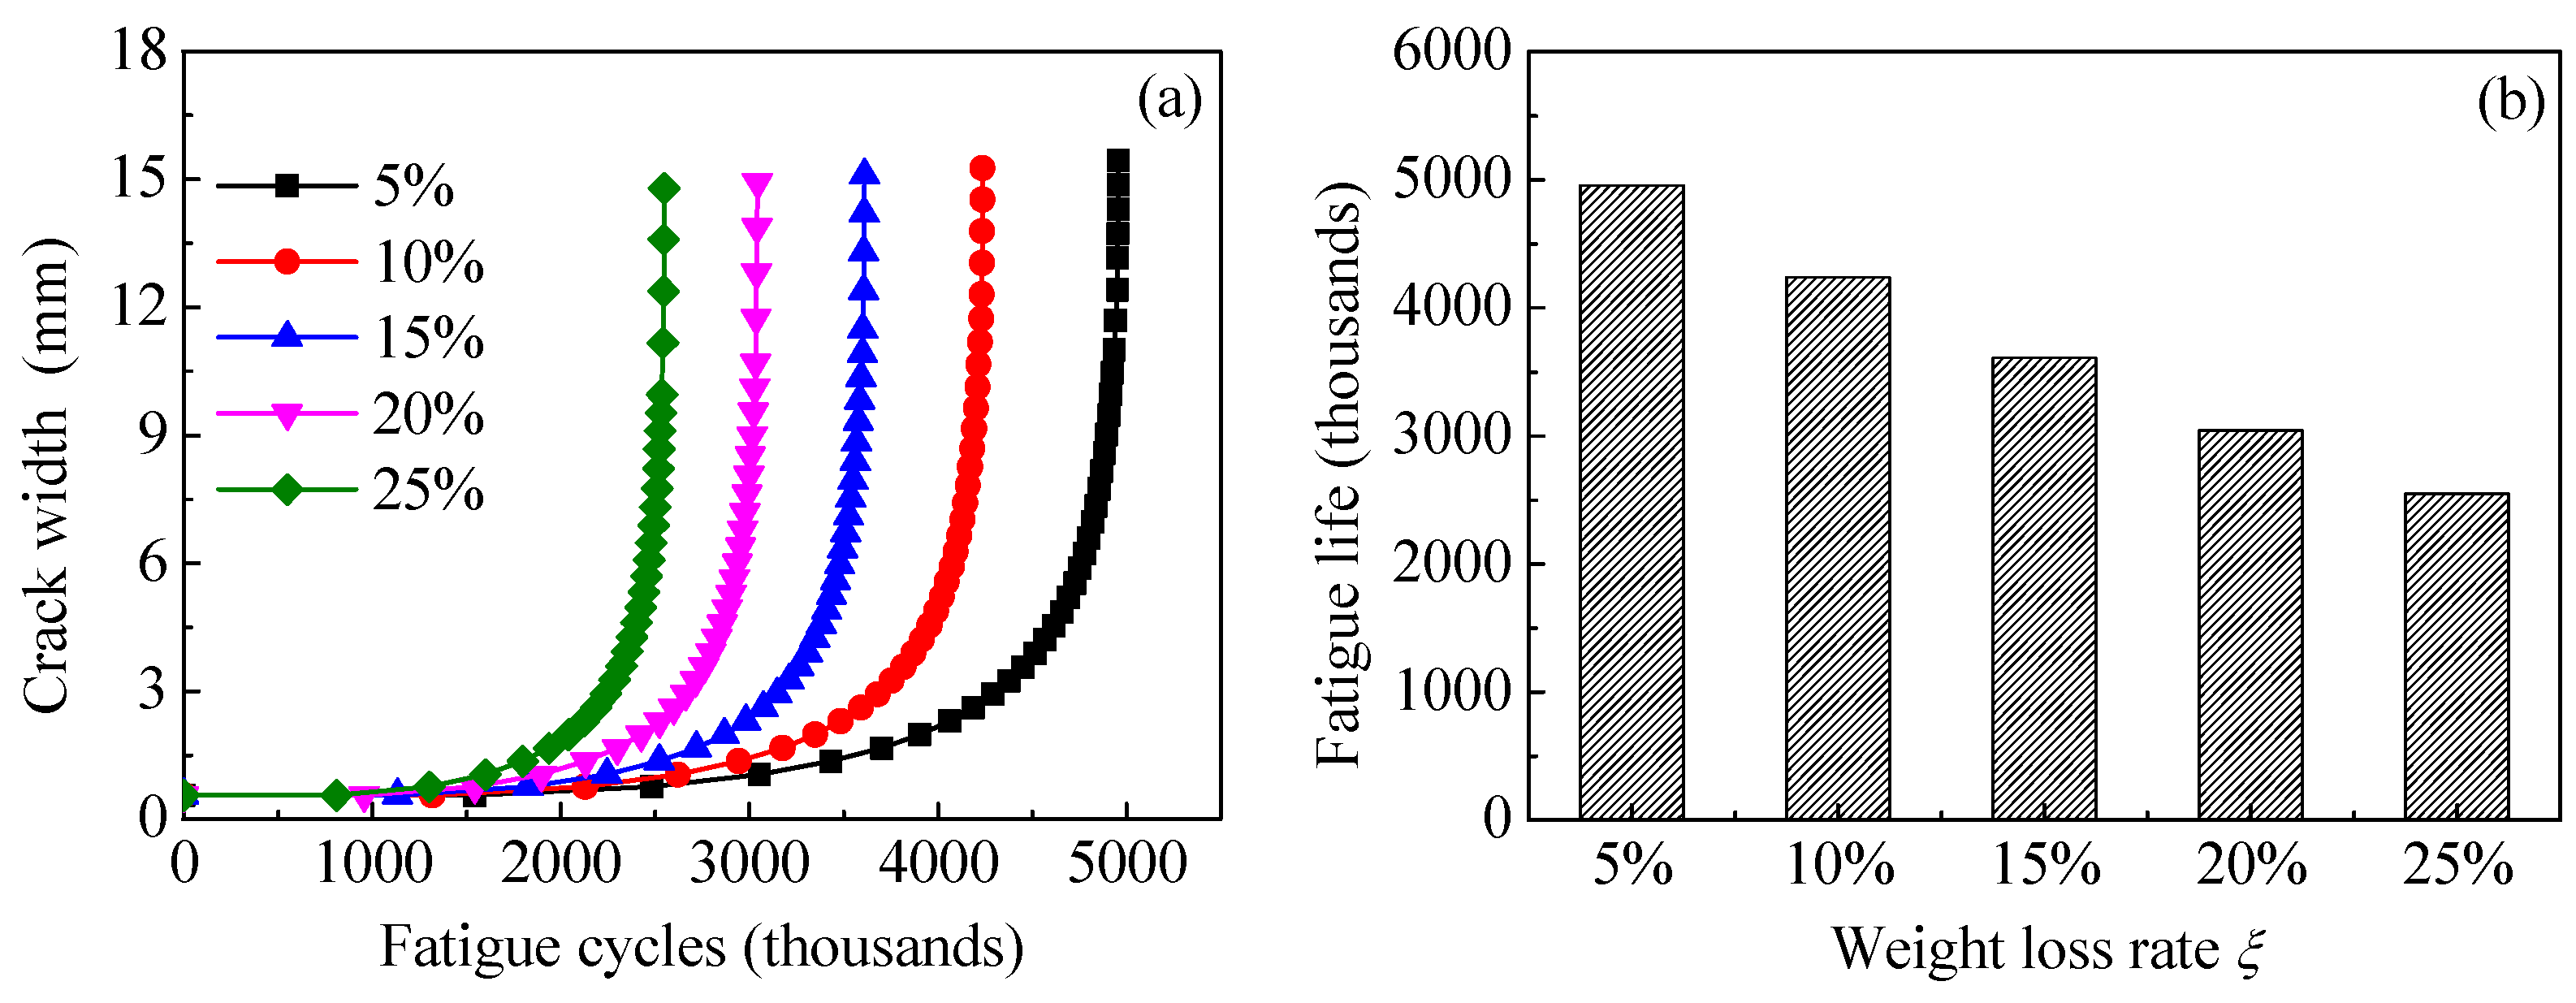
8.1. Effect of Weight-Loss Rate of the Corroded Steel Plate
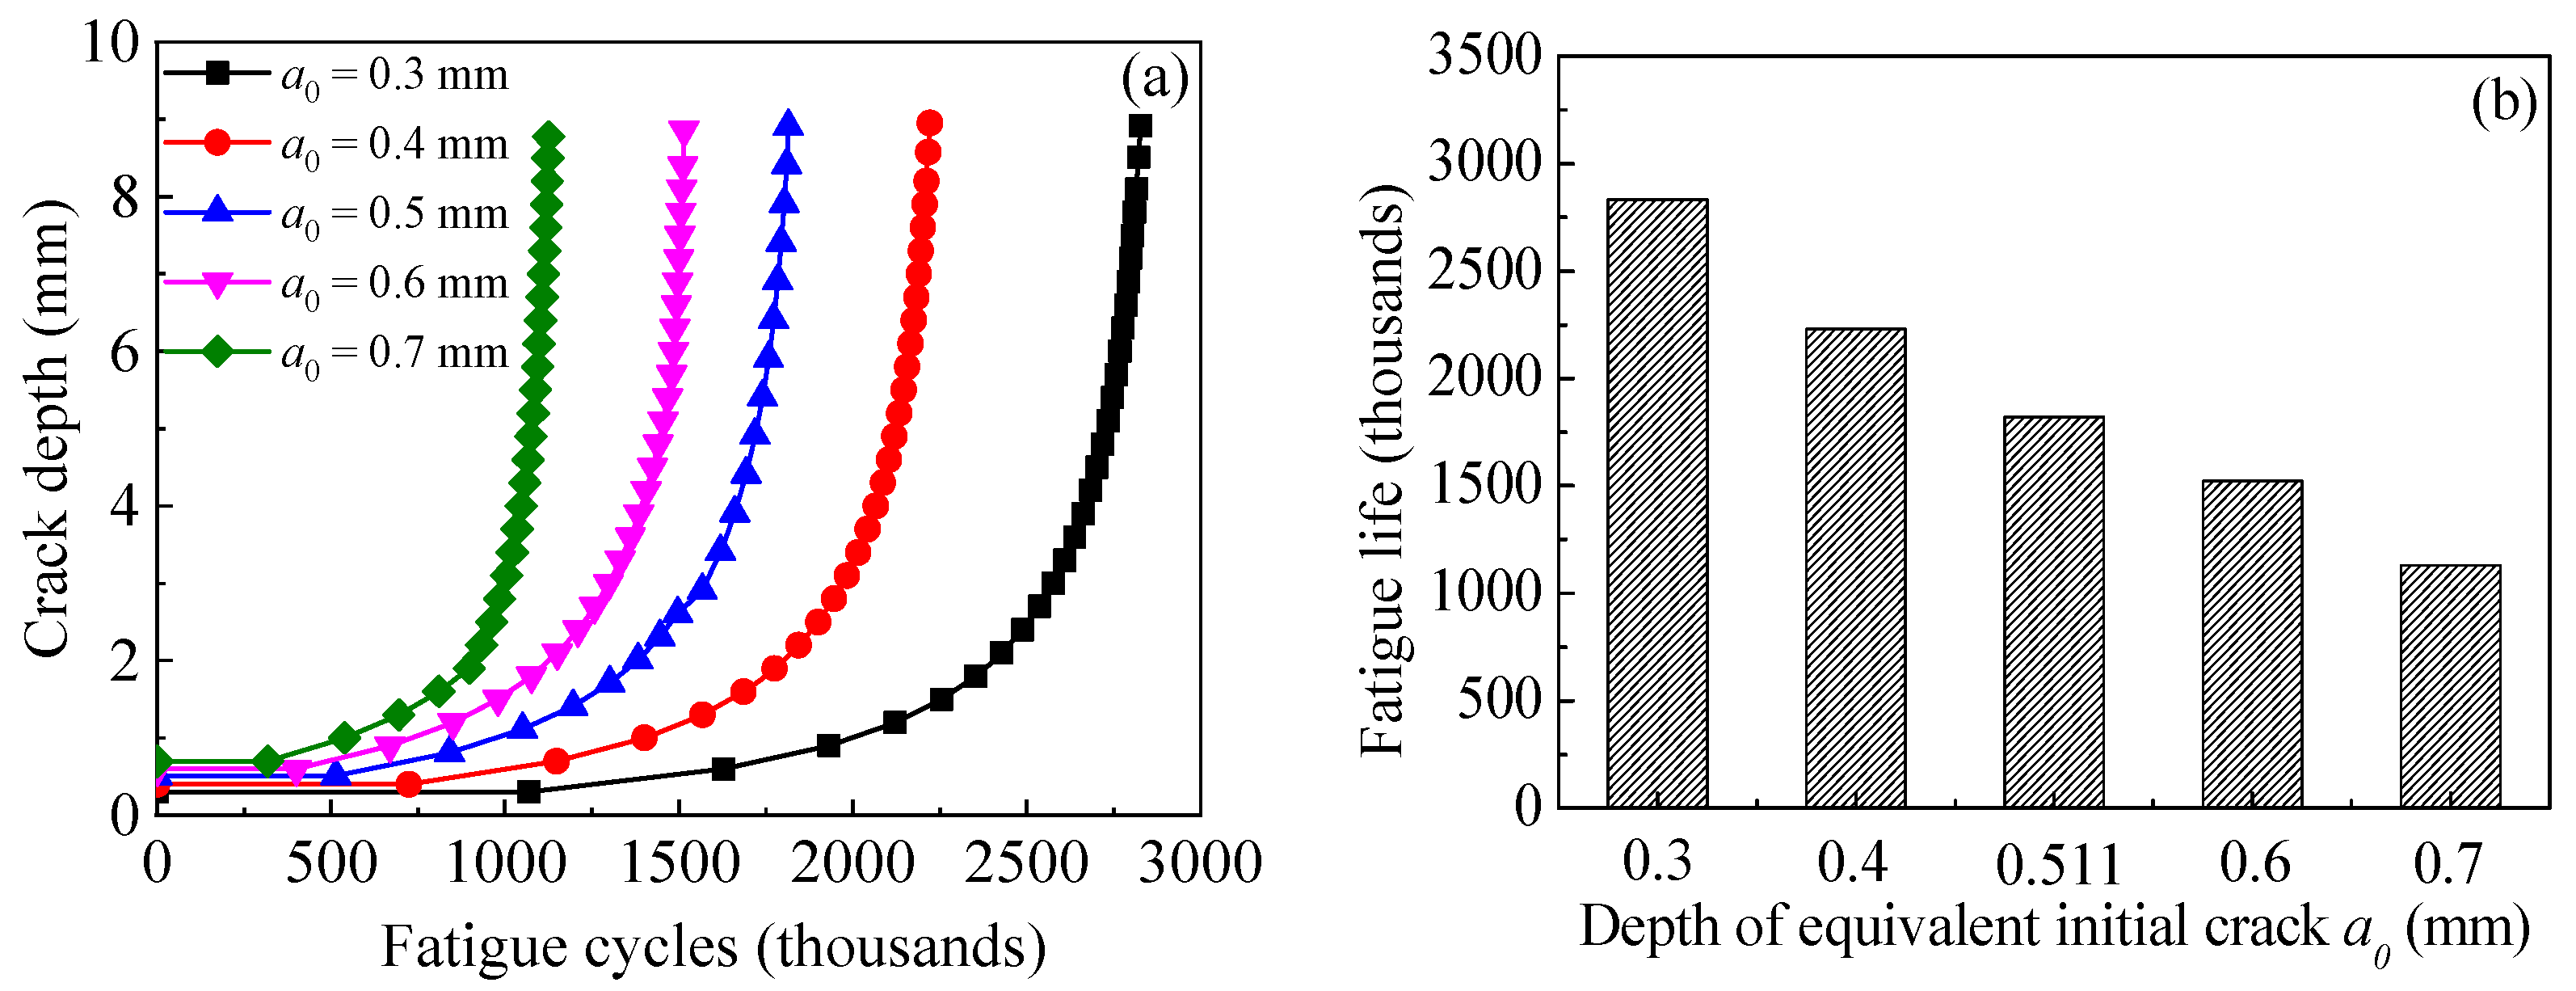
8.2. Effect of Equivalent Initial Crack Size
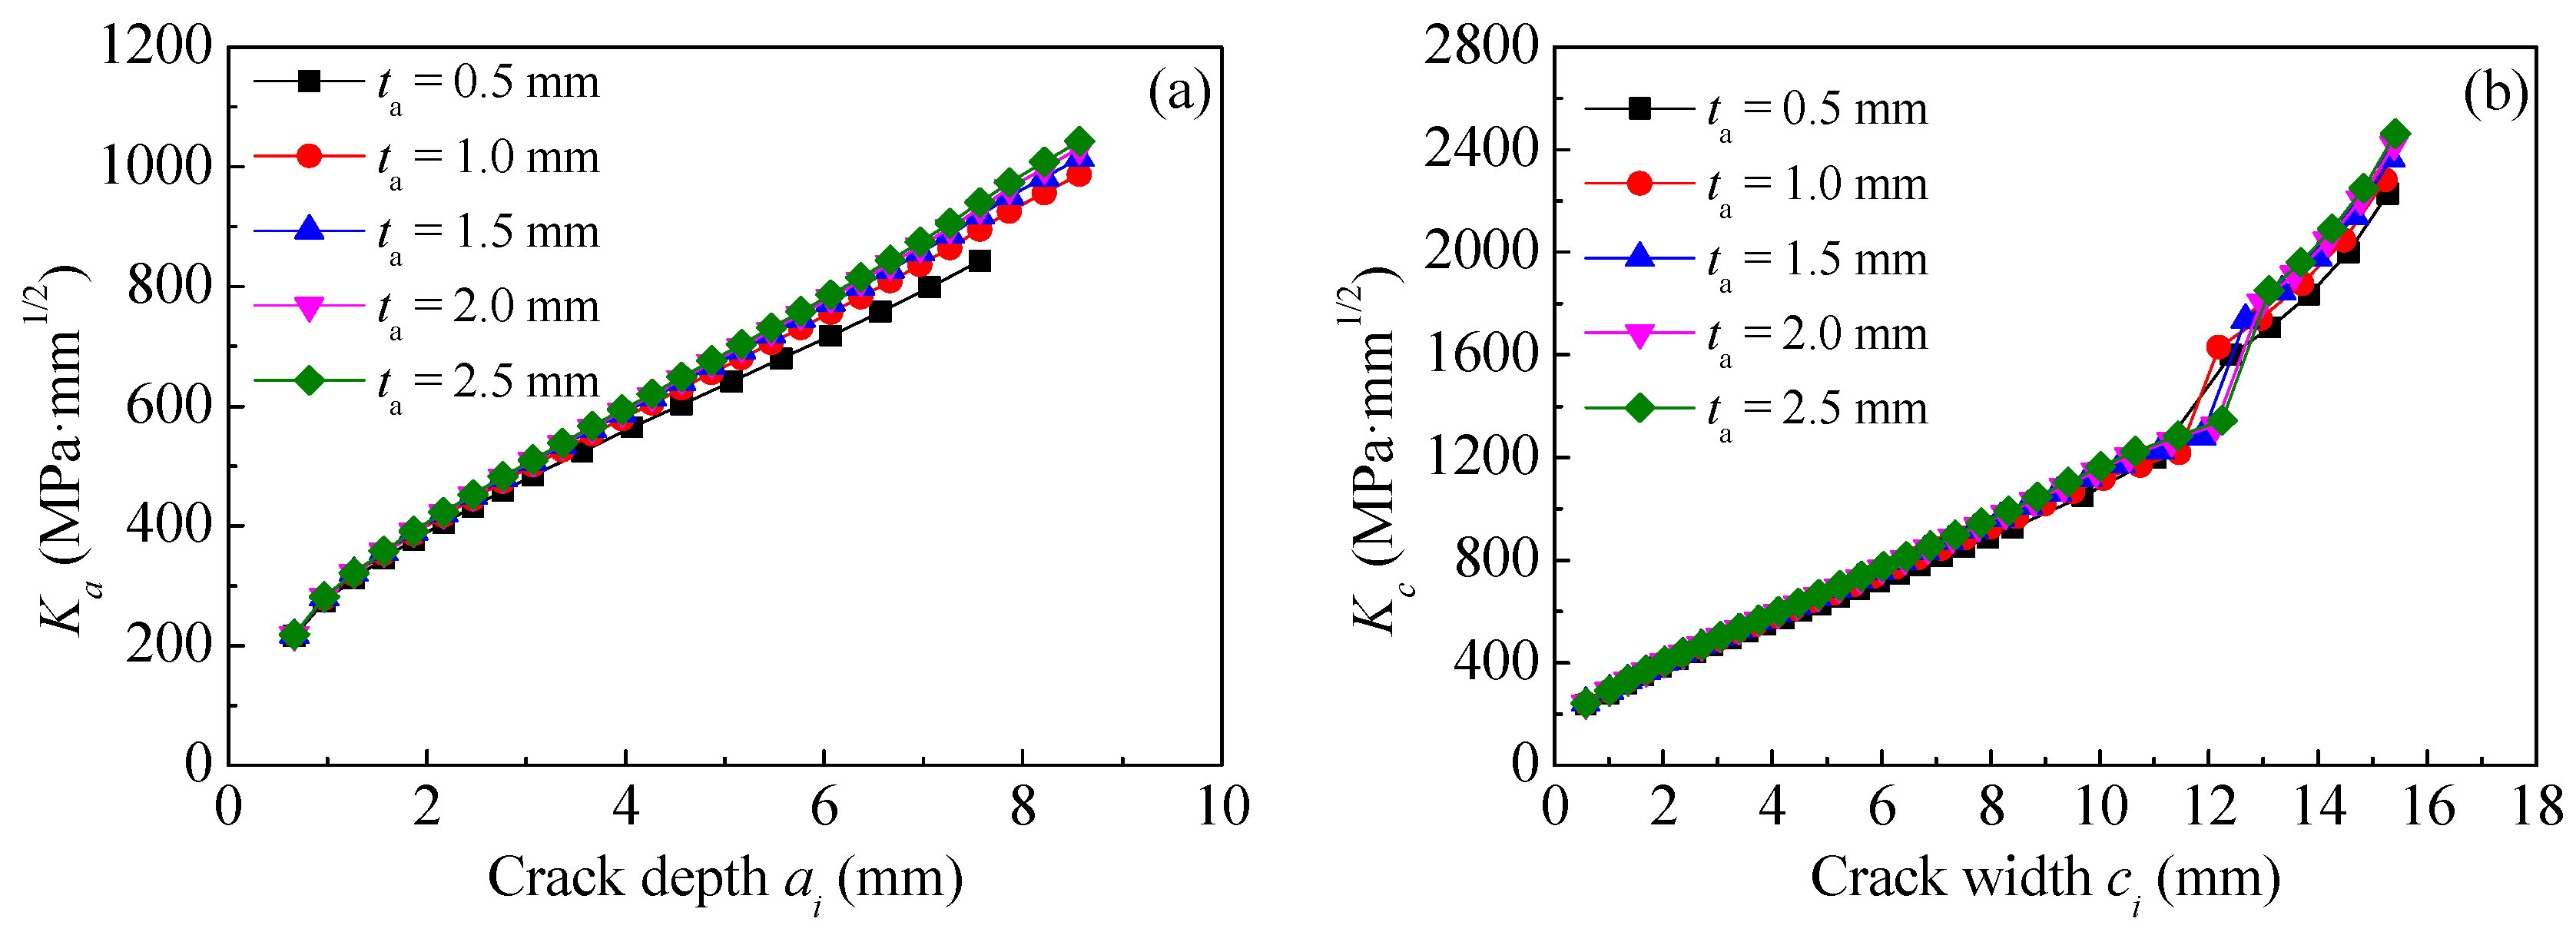
8.3. Effect of Adhesive Thickness
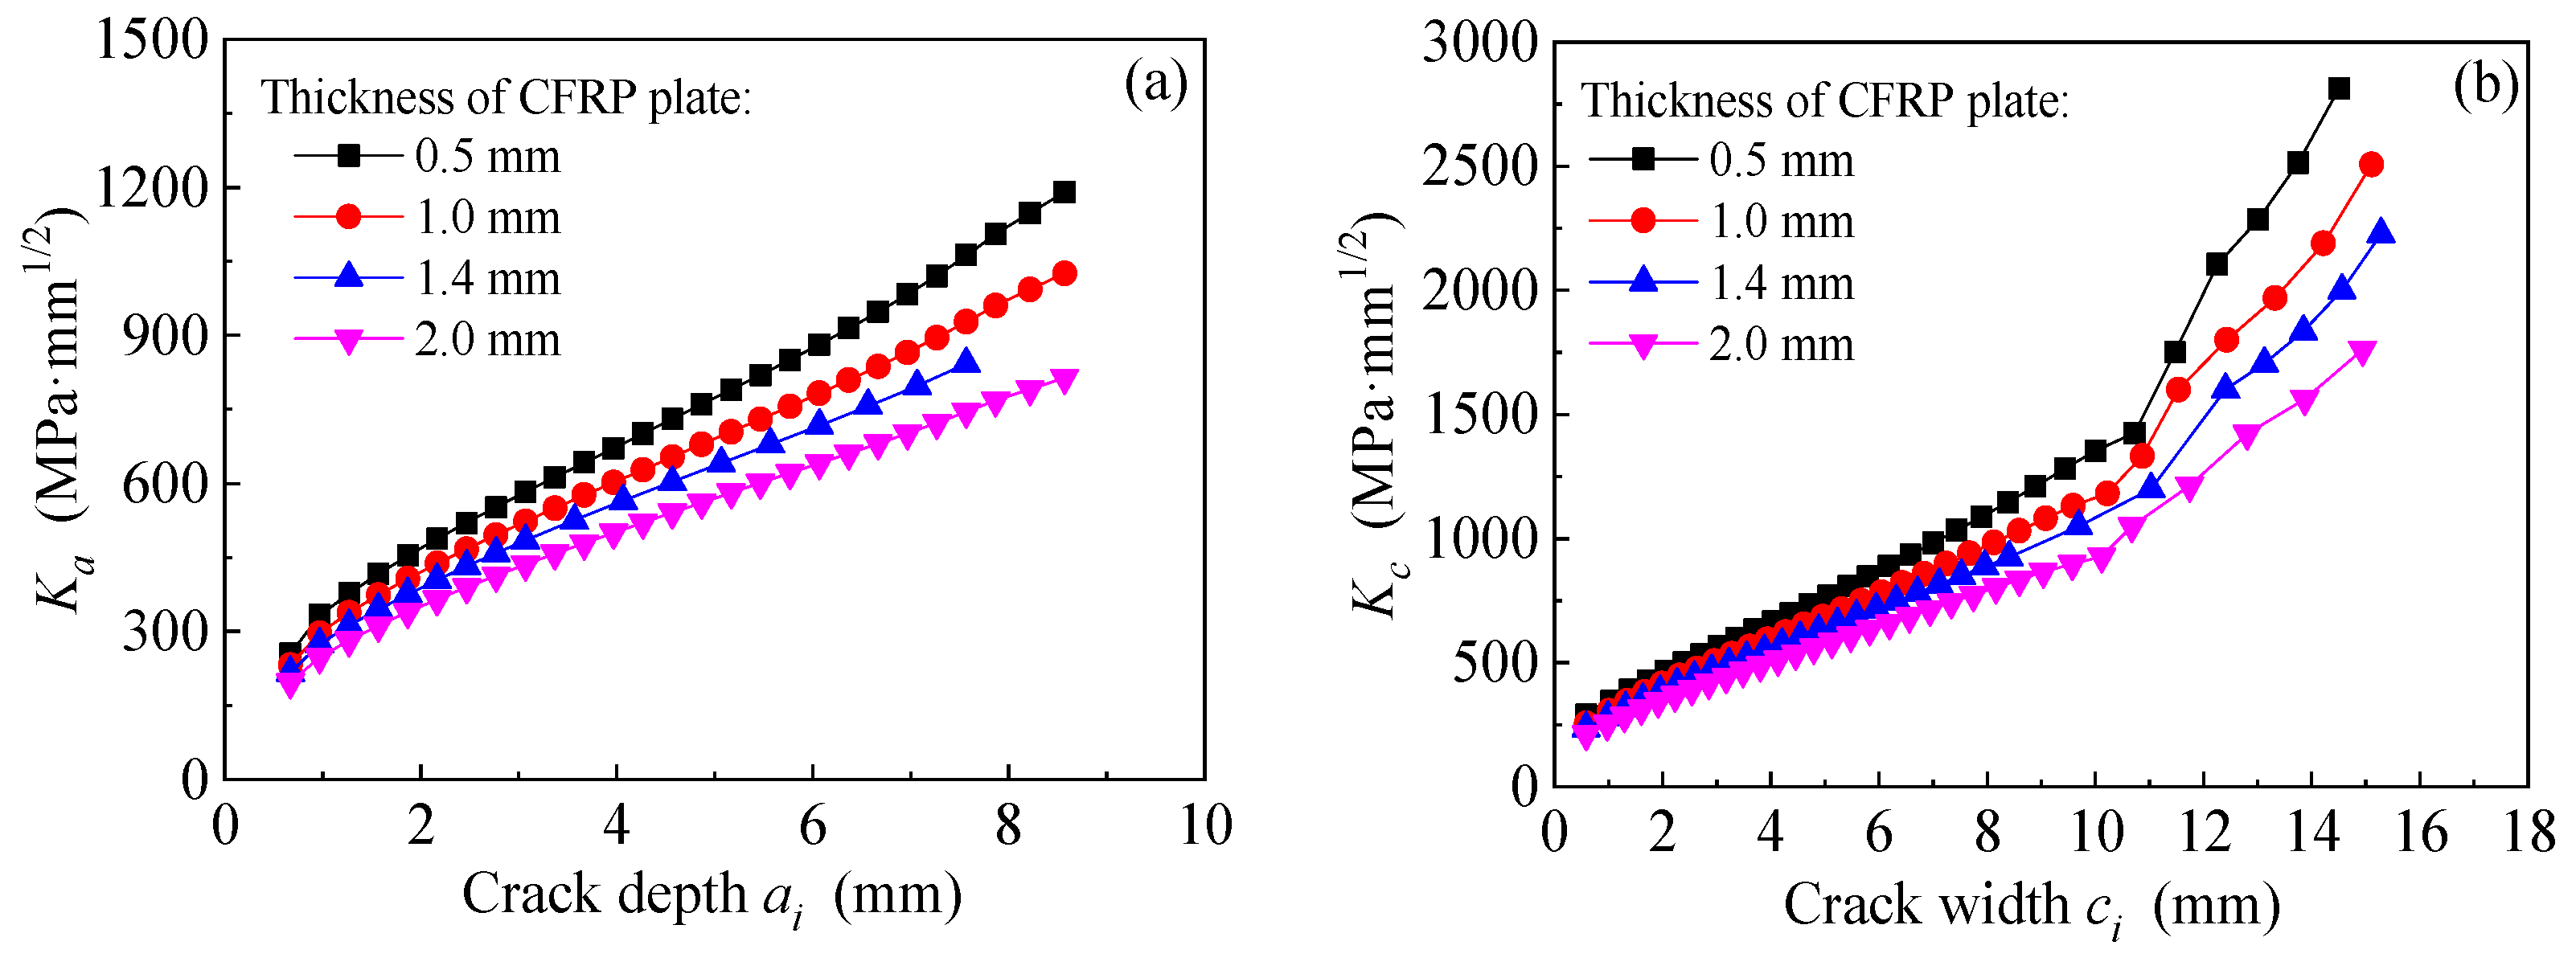
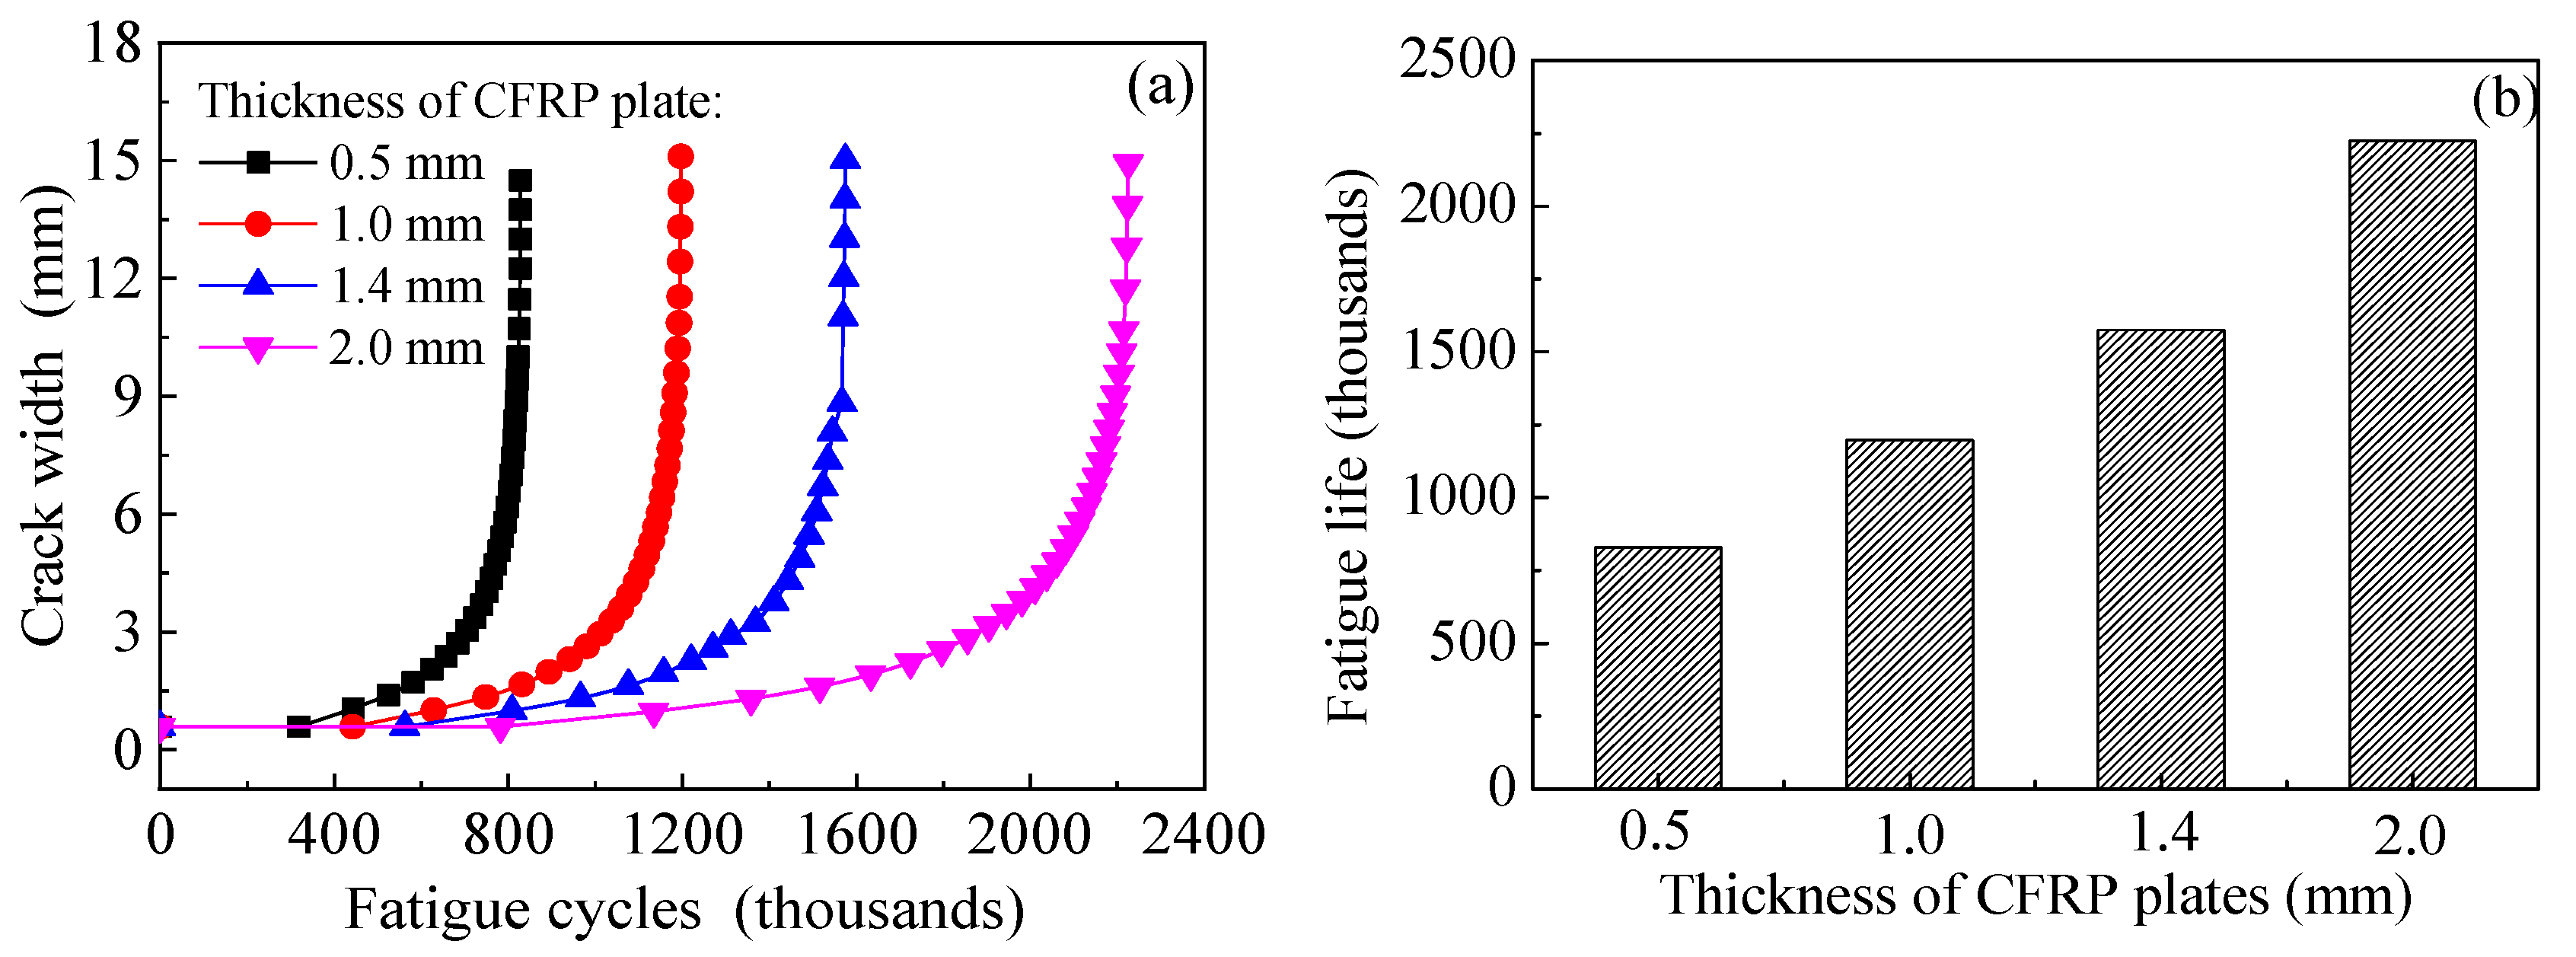
8.4. Effect of Stiffness of CFRP Plate
8.5. Effect of Prestress Level of CFRP Plate
9. Conclusions
- (1)
- The proposed two-stage fatigue crack propagation prediction model could be used to predict the fatigue crack propagation process of the corroded steel plate strengthened with CFRP plates with reasonable accuracy.
- (2)
- The maximum depth and the average width of the rust pits were suggested as the equivalent dimensions of the initial semi-elliptical surface crack for the fatigue crack propagation prediction of corroded steel plate strengthened with CFRP plates.
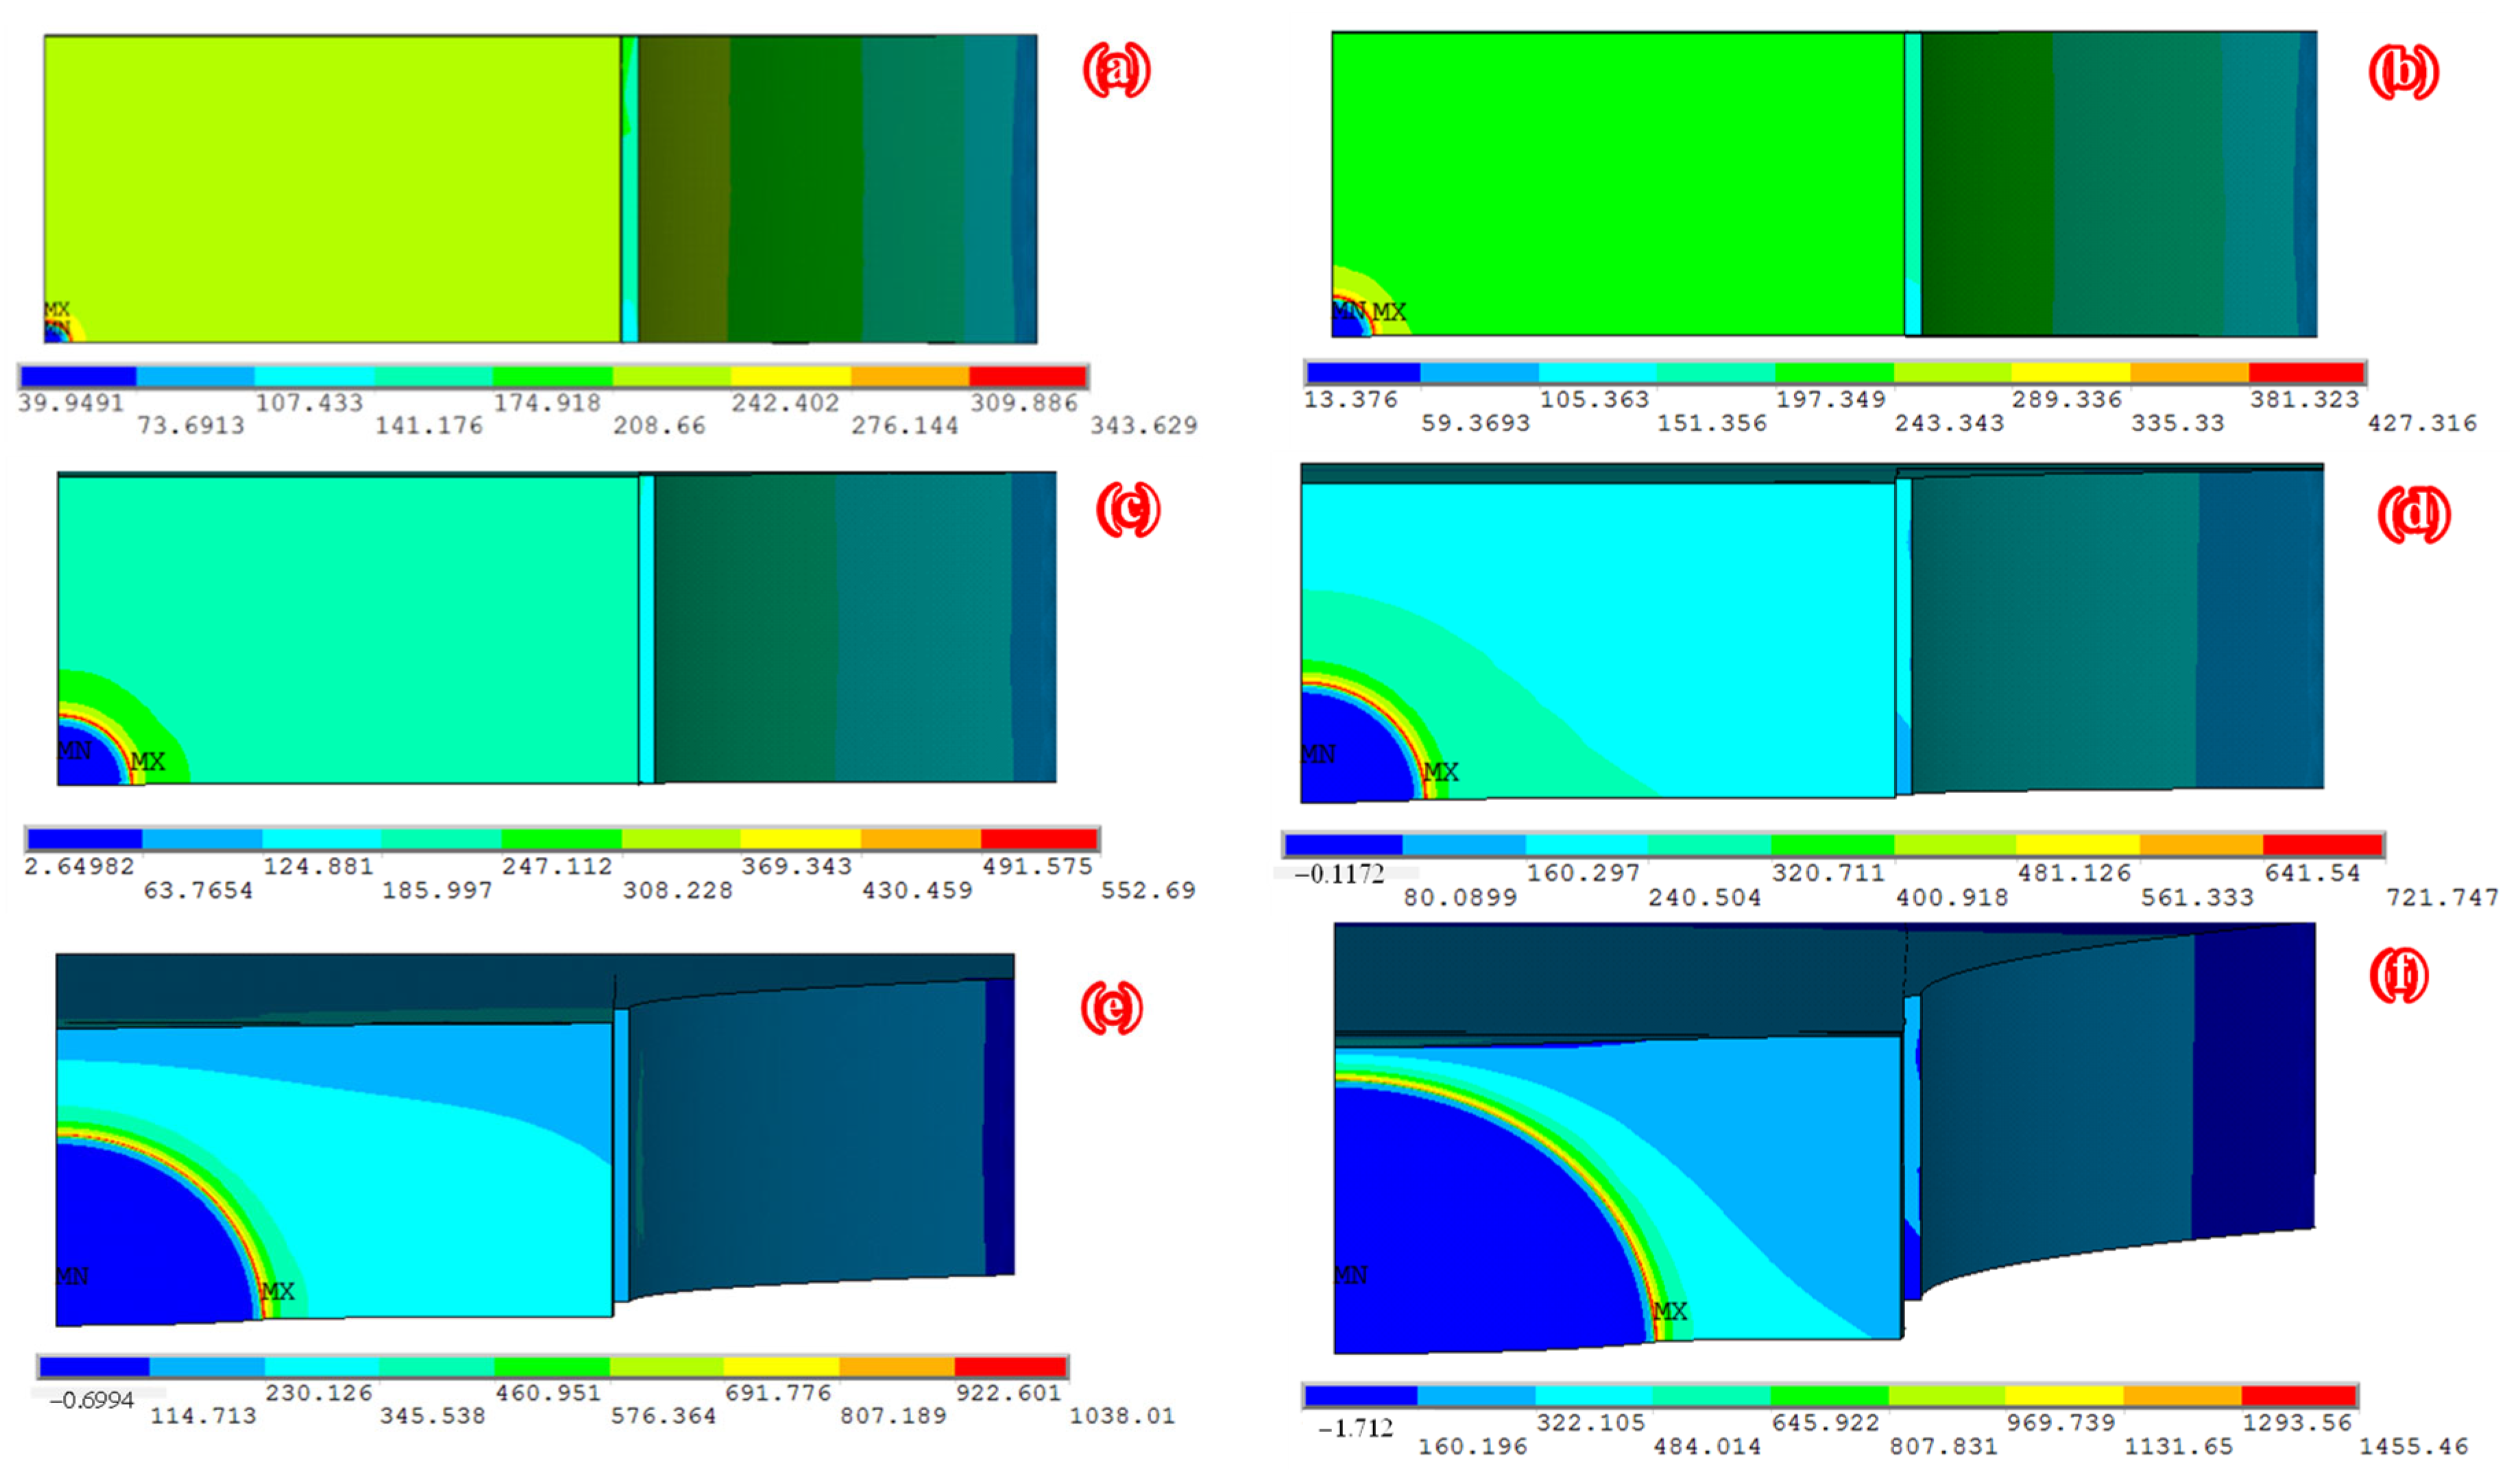
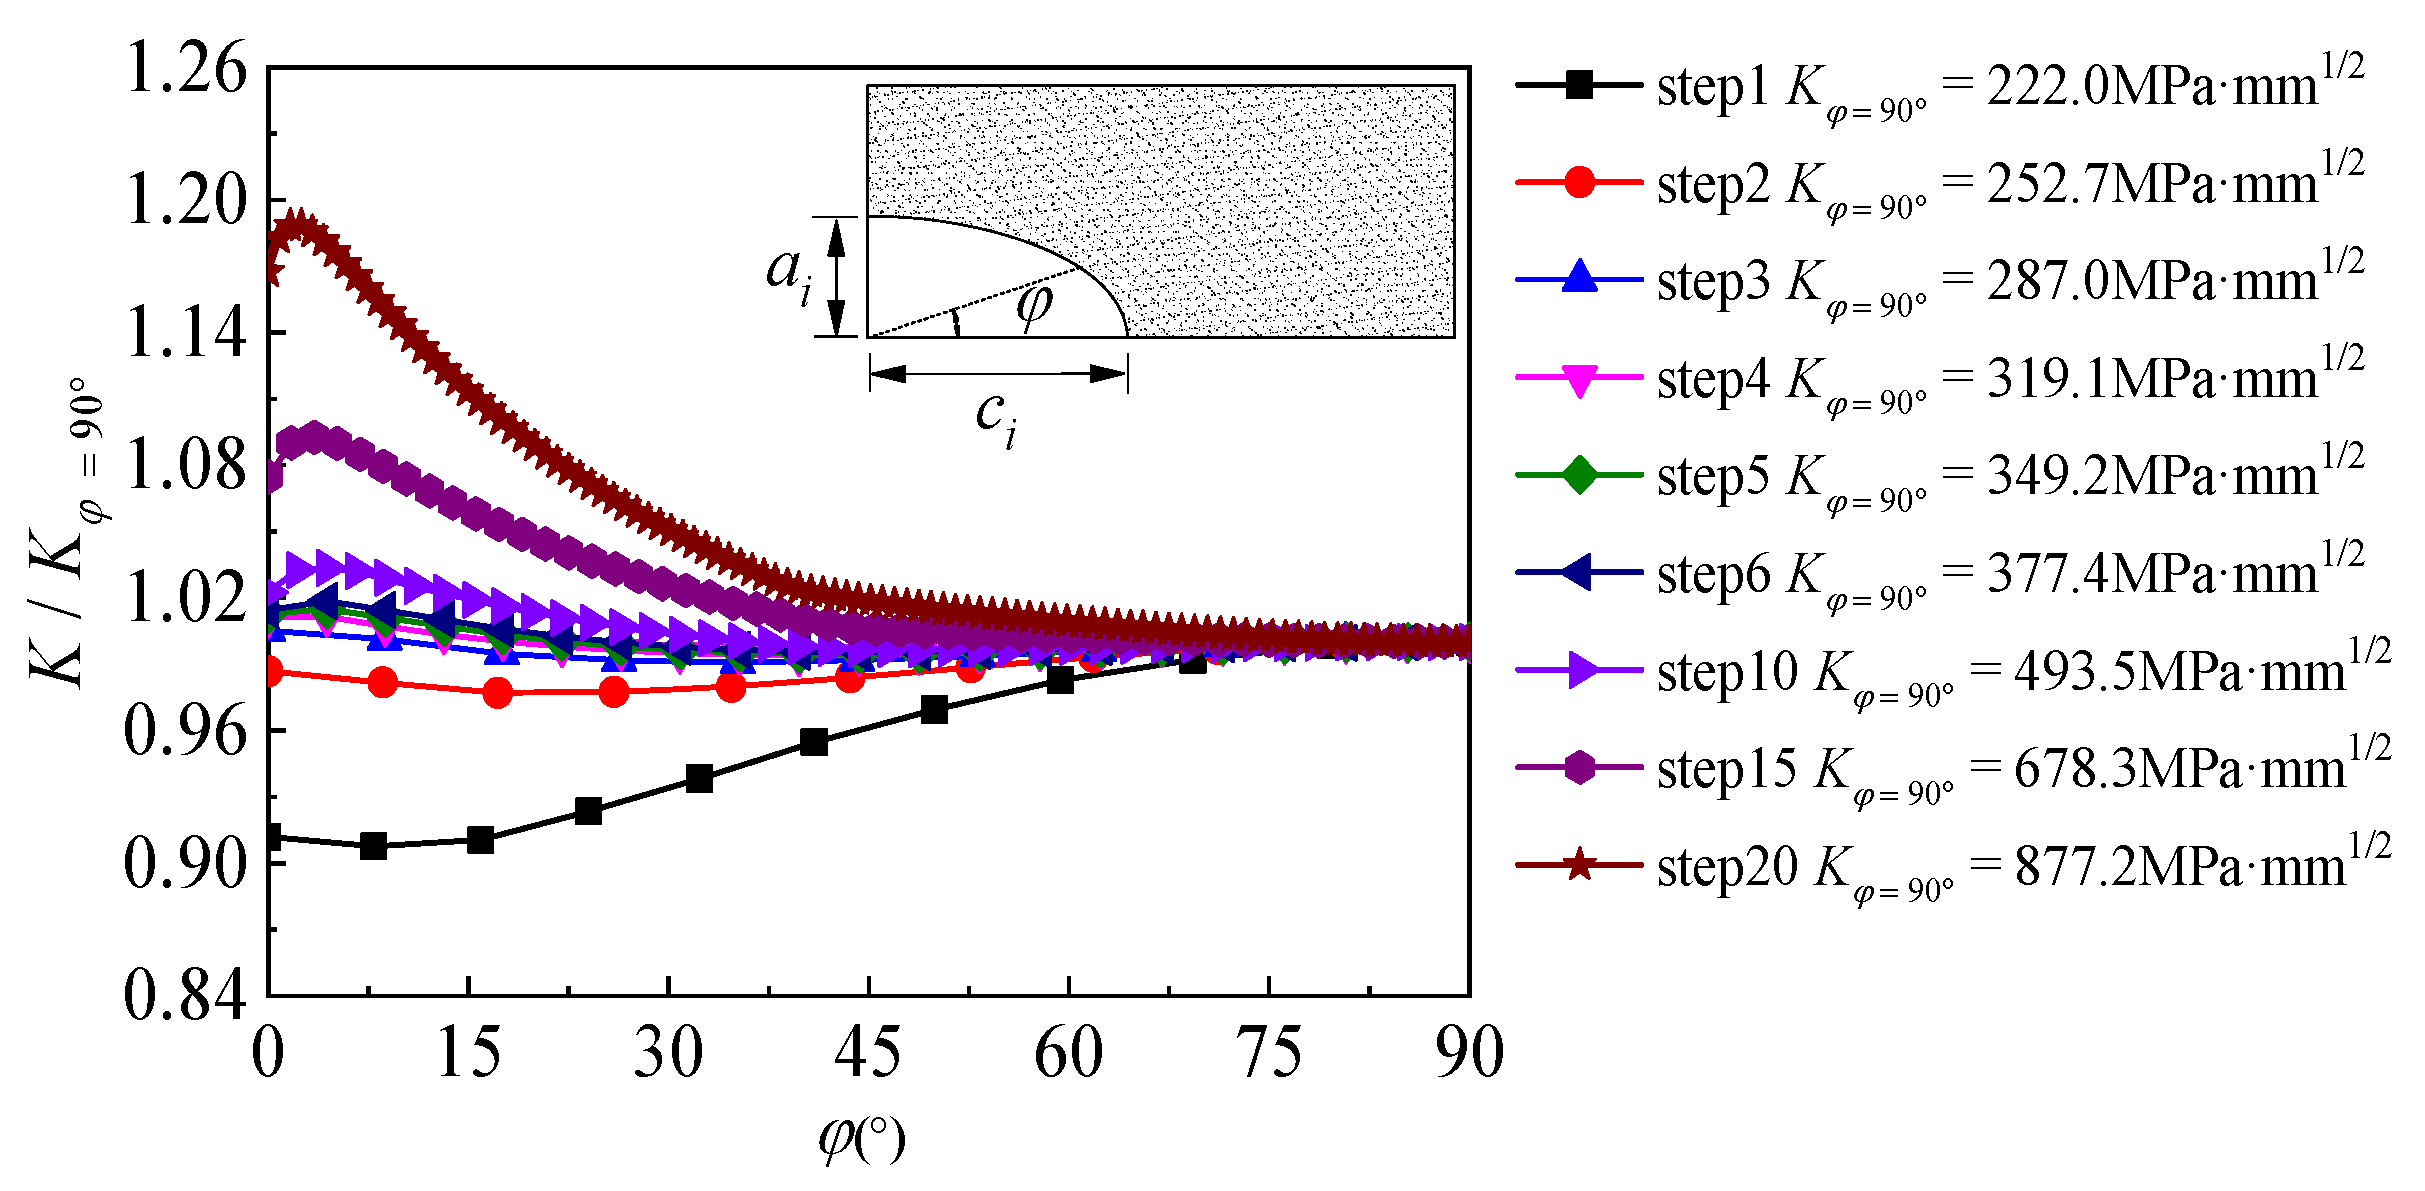
- (3)
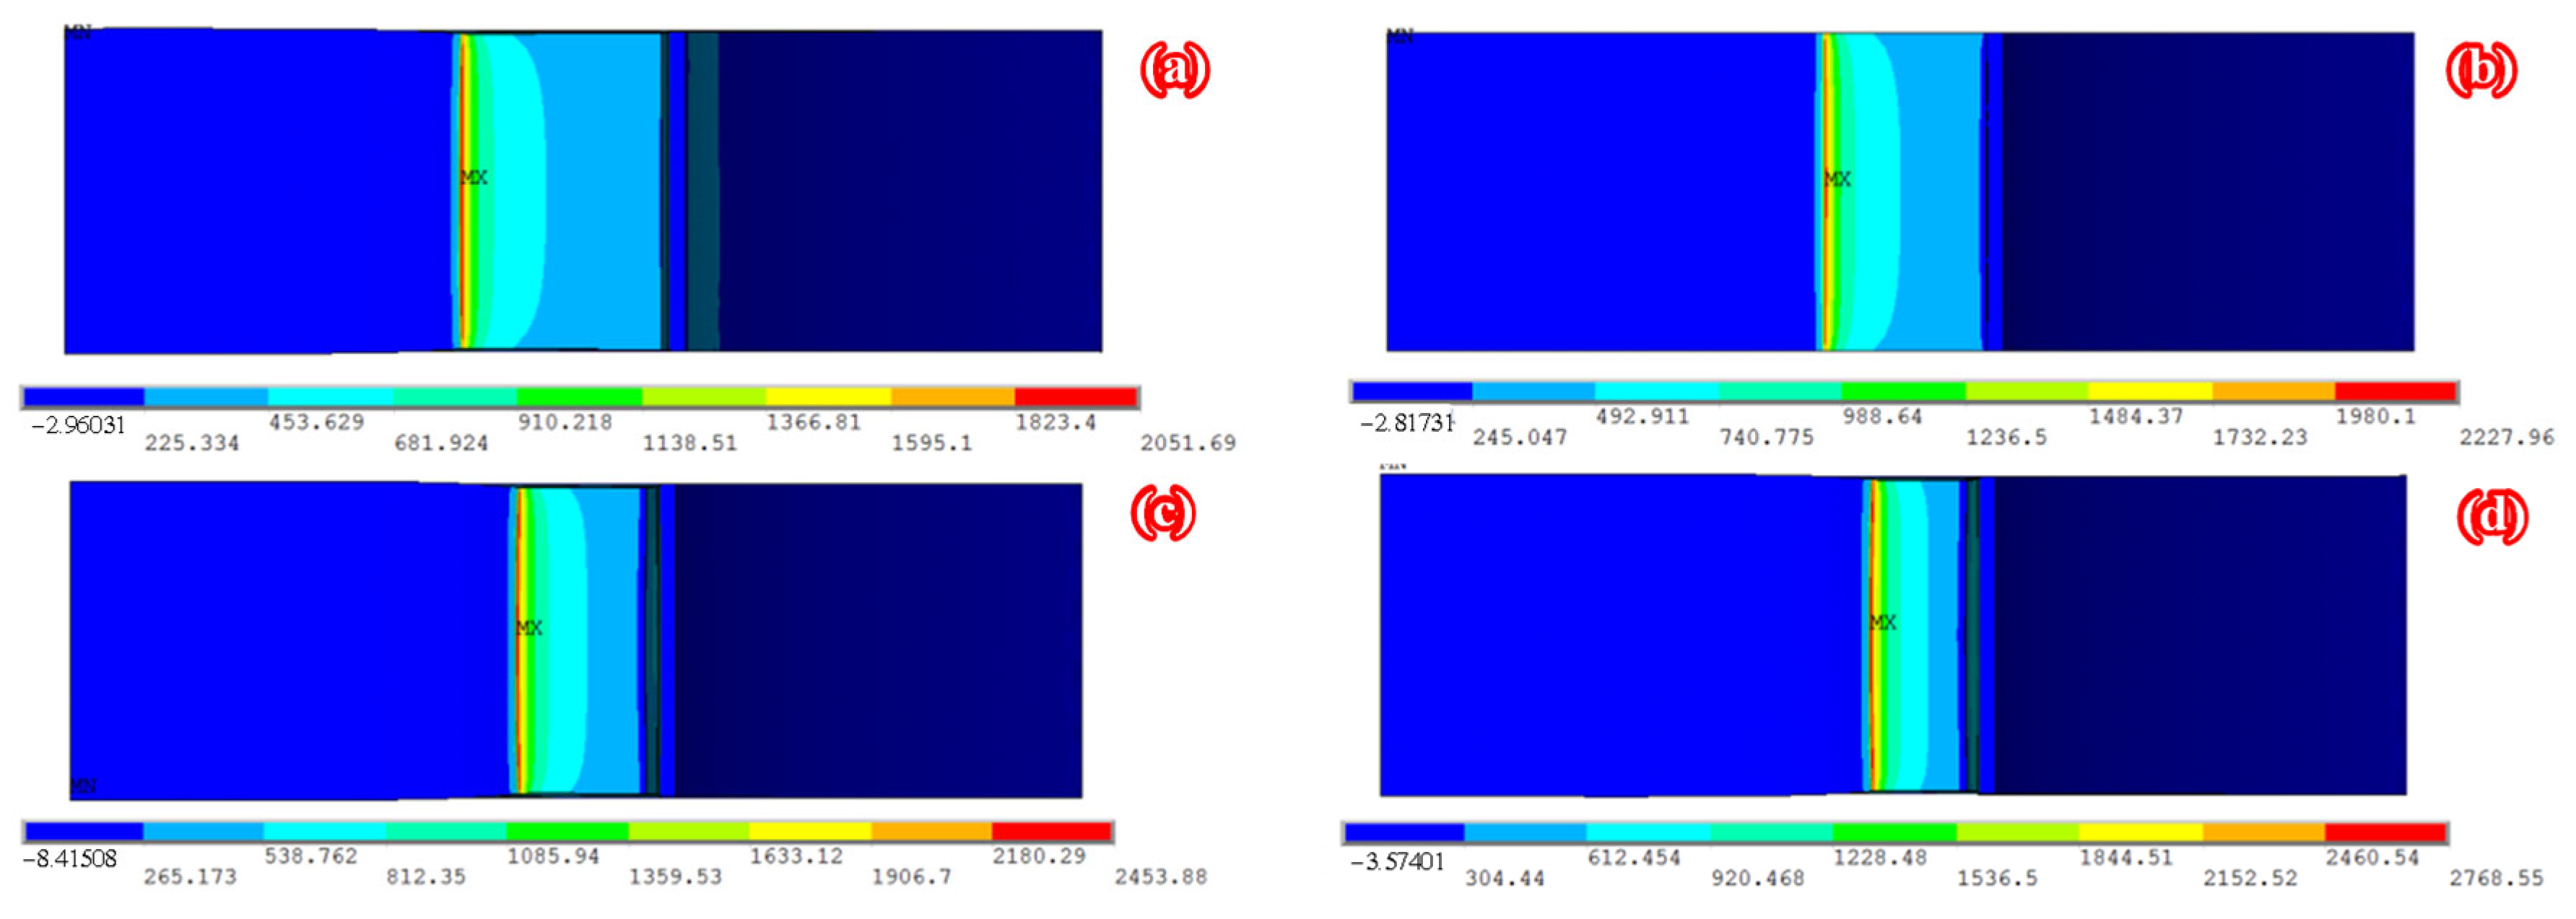
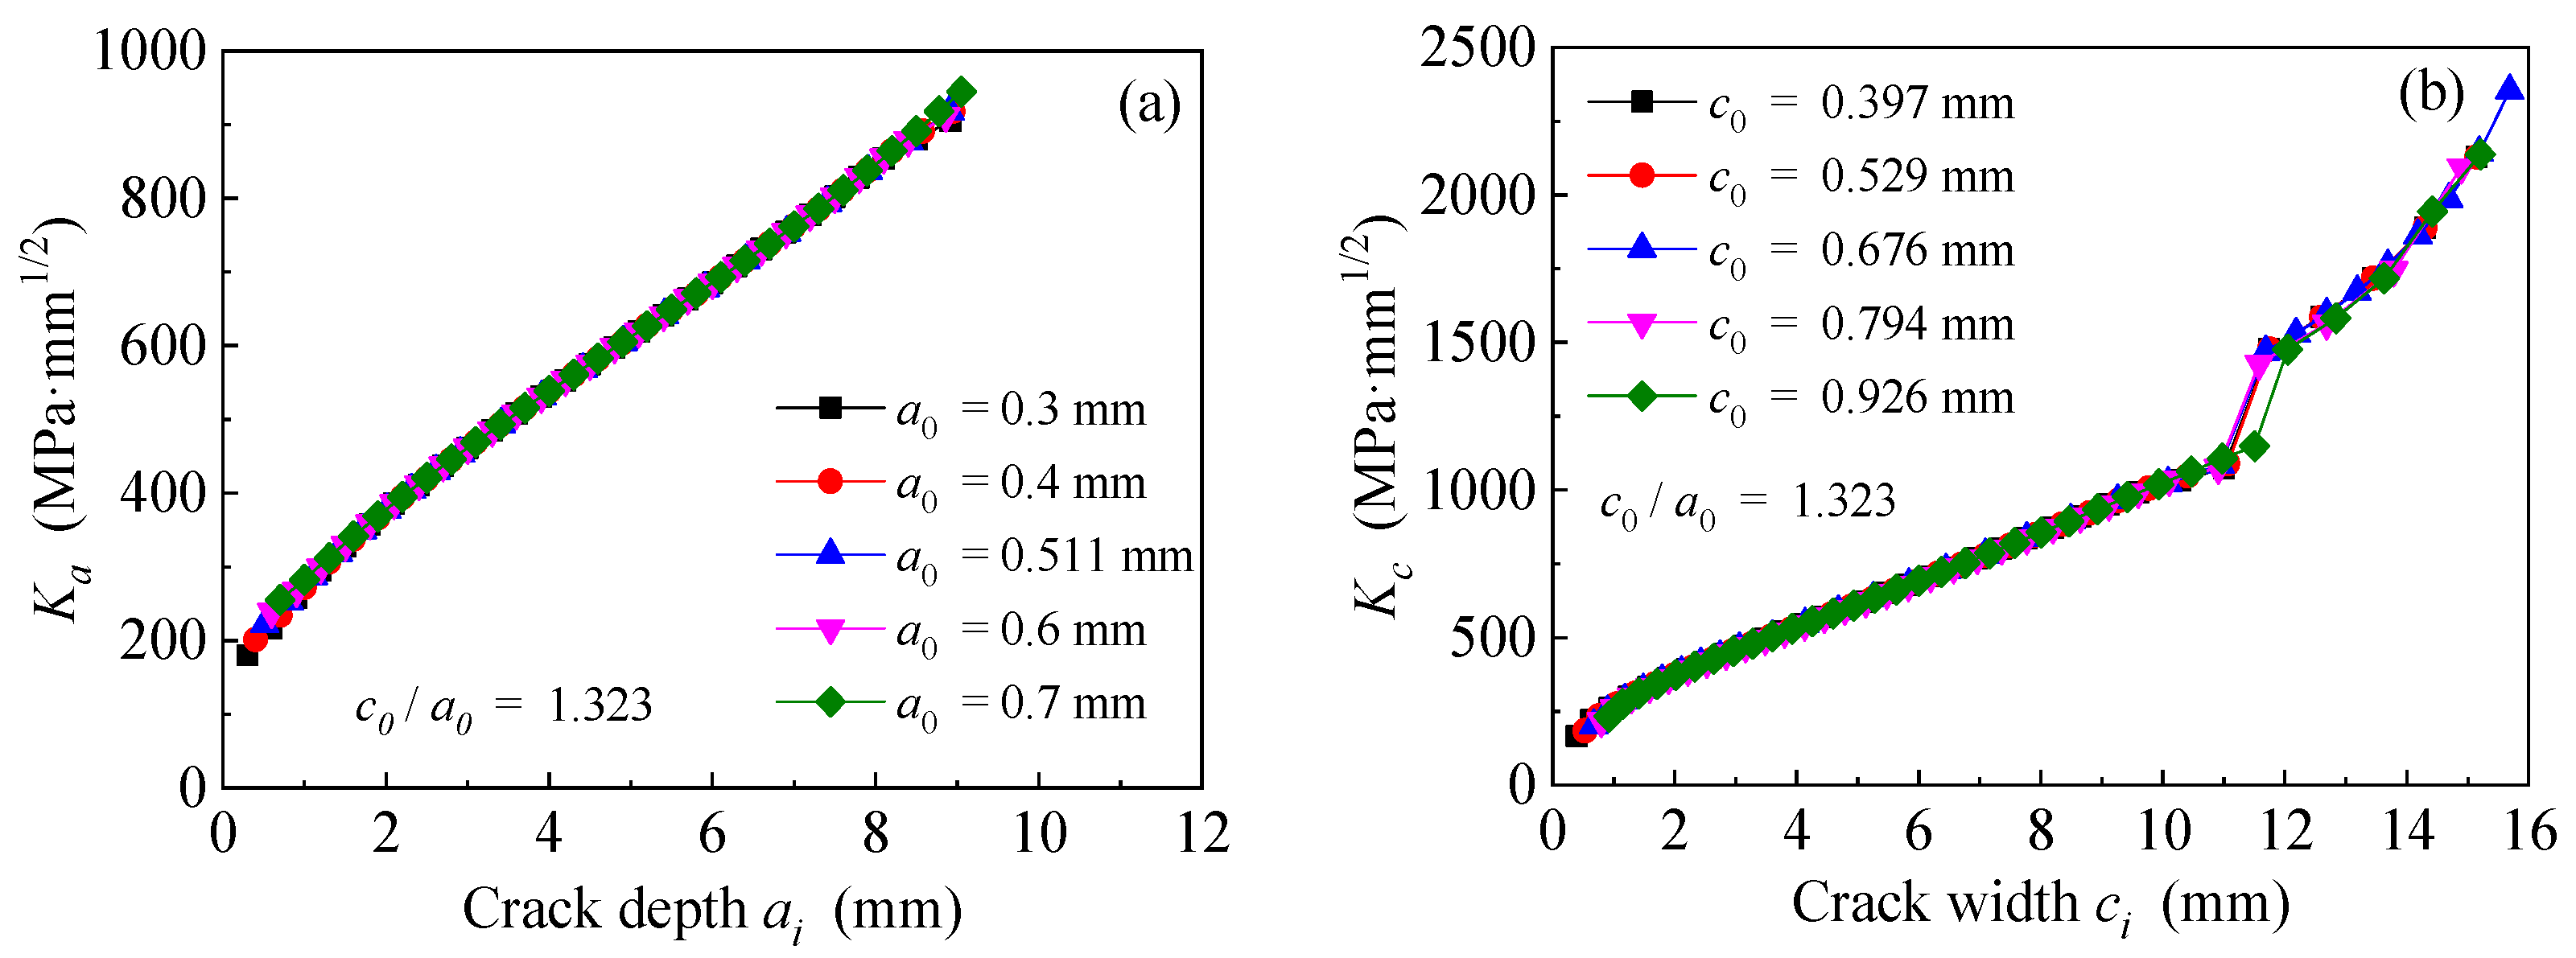
- As for the corroded steel plates double-side patched with CFRP plates, the maximum value of SIF gradually shifted from the deepest point of the crack to the surface of the steel plate during the partial-through crack propagation stage, whereas the SIF values during the through crack propagation stage were symmetrically distributed along the thickness direction of the steel plate, and the maximum value of SIF was located in the middle of the plate thickness.
- (4)
- Increasing the weight loss rate of the corroded steel plate, the initial crack size or the adhesive thickness would accelerate the crack growth and reduce the fatigue life, while increasing the stiffness or prestress level of CFRP plate would significantly reduce the crack growth rate and increase the fatigue life. The smaller the initial crack size, the more sensitive the crack propagation life was to the variations in equivalent initial crack size. The influence of adhesive thickness on the fatigue life was limited and convergent, and the application of prestressing could significantly improve the utilization rate of CFRP materials and the fatigue strengthening effect of the corroded steel plate.
Author Contributions
Funding
Institutional Review Board Statement
Informed Consent Statement
Data Availability Statement
Conflicts of Interest
References
- Xu, S.-H.; Qiu, B. Experimental study on fatigue behavior of corroded steel. Mater. Sci. Eng. A 2013, 584, 163–169. [Google Scholar] [CrossRef]
- Albrecht, P.; Lenwari, A. Fatigue Strength of Weathered A588 Steel Beams. J. Bridge Eng. 2009, 14, 436–443. [Google Scholar] [CrossRef]
- Aksoylu, C.; Yazman, S.; Ozkilic, Y.O.; Gemi, L.; Arslan, M.H. Experimental analysis of reinforced concrete shear deficient beams with circular web openings strengthened by CFRP composite. Compos. Struct. 2020, 249, 112561. [Google Scholar] [CrossRef]
- Gemi, L.; Alsdudi, M.; Aksoylu, C.; Yazman, S.; Ozkilic, Y.O.; Arslan, M.H. Optimum amount of CFRP for strengthening shear deficient reinforced concrete beams. Steel Compos. Struct. 2022, 43, 735–757. [Google Scholar]
- Ozkilic, Y.O.; Aksoylu, C.; Yazman, S.; Gemi, L.; Arslan, M.H. Behavior of CFRP-strengthened RC beams with circular web openings in shear zones: Numerical study. Structures 2022, 41, 1369–1389. [Google Scholar] [CrossRef]
- Jones, S.C.; Civjan, S.A. Application of Fiber Reinforced Polymer Overlays to Extend Steel Fatigue Life. J. Compos. Constr. 2003, 7, 331–338. [Google Scholar] [CrossRef]
- Lenwari, A.; Thepchatri, T.; Albrecht, P. Flexural Response of Steel Beams Strengthened with Partial-Length CFRP Plates. J. Compos. Constr. 2005, 9, 296–303. [Google Scholar] [CrossRef]
- Patnaik, A.K.; Bauer, C.L.; Srivatsan, T.S. The extrinsic influence of carbon fibre reinforced plastic laminates to strengthen steel structures. Sadhana 2008, 33, 261–272. [Google Scholar] [CrossRef] [Green Version]
- Lu, Y.; Li, W.; Shan, L.; Li, X.; Tao, Z. Study of the Tensile Properties of CFRP Strengthened Steel Plates. Polymers 2015, 7, 2595–2610. [Google Scholar] [CrossRef] [Green Version]
- Ghafoori, E.; Motavalli, M.; Botsis, J.; Herwig, A.; Galli, M. Fatigue strengthening of damaged metallic beams using prestressed unbonded and bonded CFRP plates. Int. J. Fatigue 2012, 44, 303–315. [Google Scholar] [CrossRef]
- Zhao, X.-L.; Zhang, L. State-of-the-art review on FRP strengthened steel structures. Eng. Struct. 2007, 29, 1808–1823. [Google Scholar] [CrossRef]
- Teng, J.G.; Yu, T.; Fernando, D. Strengthening of steel structures with fiber-reinforced polymer composites. J. Constr. Steel Res. 2012, 78, 131–143. [Google Scholar] [CrossRef]
- Wang, Z.; Li, C.G.; Sui, L.L.; Xian, G.J. Effects of adhesive property and thickness on the bond performance between carbon fiber reinforced polymer laminate and steel. Thin-Walled Struct. 2021, 158, 107176. [Google Scholar] [CrossRef]
- Li, A.; Xu, S.; Wang, Y.; Wu, C.; Nie, B. Fatigue behavior of corroded steel plates strengthened with CFRP plates. Constr. Build. Mater. 2022, 314, 125707. [Google Scholar] [CrossRef]
- Wang, Z.-Y.; Wang, Q.-Y.; Li, L.; Zhang, N. Fatigue behaviour of CFRP strengthened open-hole steel plates. Thin-Walled Struct. 2017, 115, 176–187. [Google Scholar] [CrossRef]
- Colombi, P.; Bassetti, A.; Nussbaumer, A. Analysis of cracked steel members reinforced by pre-stress composite patch. Fatigue Fract. Eng. Mater. Struct. 2003, 26, 59–66. [Google Scholar] [CrossRef] [Green Version]
- Zheng, Y.; Ye, L.; Lu, X.; Yue, Q. Experimental study on fatigue behavior of tensile steel plates strengthened with CFRP plates. In Proceedings of the Third International Conference on FRP in Composites in Civil Engineering (CICE 2006), Miami, FL, USA, 13–15 December 2006. [Google Scholar]
- Lepretre, E.; Chataigner, S.; Dieng, L.; Gaillet, L. Fatigue strengthening of cracked steel plates with CFRP laminates in the case of old steel material. Constr. Build. Mater. 2018, 174, 421–432. [Google Scholar] [CrossRef]
- Monfared, A.; Soudki, K.; Walbridge, S. CFRP reinforcing to extend the fatigue lives of steel structures. In Proceedings of the Fourth International Conference on FRP Composites in Civil Engineering (CICE 2008), Zurich, Switzerland, 22–24 July 2008. [Google Scholar]
- Tsouvalis, N.G.; Mirisiotis, L.S.; Dimou, D.N. Experimental and numerical study of the fatigue behaviour of composite patch reinforced cracked steel plates. Int. J. Fatigue 2009, 31, 1613–1627. [Google Scholar] [CrossRef]
- Colombi, P.; Fava, G.; Sonzogni, L. Fatigue crack growth in CFRP-strengthened steel plates. Compos. Part B 2015, 72, 87–96. [Google Scholar] [CrossRef] [Green Version]
- Huawen, Y.; König, C.; Ummenhofer, T.; Shizhong, Q.; Plum, R. Fatigue Performance of Tension Steel Plates Strengthened with Prestressed CFRP Laminates. J. Compos. Constr. 2010, 14, 609–615. [Google Scholar] [CrossRef]
- Haitao, W. Study on the Fatigue Behavior of CFRP Plate Strengthened Steel Structures and its Design Method. Ph.D. Thesis, Southeast University, Nanjing, China, 2016. [Google Scholar]
- Tong-tong, Z.; Jian, W.; Hong-yun, L.; Wei-bo, W. Study on tension and fatigue property of cracked steel plates reinforced by CFRP plates. J. Ship Mech. 2017, 21, 1271–1281. [Google Scholar]
- Colombi, P.; Fava, G.; Sonzogni, L. Effect of initial damage level and patch configuration on the fatigue behaviour of reinforced steel plates. Fatigue Fract. Eng. Mater. Struct. 2015, 38, 368–378. [Google Scholar] [CrossRef]
- Aljabar, N.J.; Zhao, X.L.; Al-Mahaidi, R.; Ghafoori, E.; Motavalli, M.; Powers, N. Effect of crack orientation on fatigue behavior of CFRP-strengthened steel plates. Compos. Struct. 2016, 152, 295–305. [Google Scholar] [CrossRef]
- Aljabar, N.J.; Zhao, X.L.; Al-Mahaidi, R.; Ghafoori, E.; Motavalli, M.; Koay, Y.C. Fatigue tests on UHM-CFRP strengthened steel plates with central inclined cracks under different damage levels. Compos. Struct. 2017, 160, 995–1006. [Google Scholar] [CrossRef]
- Yun, Z.; Lie-ping, Y.E.; Qing-rui, Y.U. Study on fatigue behavior of cracked tensile steel plates reinforced with CFRP plates. Eng. Mech. 2007, 24, 91–97. [Google Scholar]
- Wu, C.; Zhao, X.L.; Al-Mahaidi, R.; Duan, W.H. Effects of CFRP bond locations on the Mode I stress intensity factor of centre-cracked tensile steel plates. Fatigue Fract. Eng. Mater. Struct. 2012, 36, 154–167. [Google Scholar] [CrossRef]
- Wang, H.T.; Wu, G.; Wu, Z.S. Effect of FRP Configurations on the Fatigue Repair Effectiveness of Cracked Steel Plates. J. Compos. Constr. 2014, 18, 04013023. [Google Scholar] [CrossRef]
- Hosseini, A.; Ghafoori, E.; Motavalli, M.; Nussbaumer, A.; Zhao, X.-L. Mode I fatigue crack arrest in tensile steel members using prestressed CFRP plates. Compos. Struct. 2017, 178, 119–134. [Google Scholar] [CrossRef]
- Liu, H.; Zhao, X.-L.; Al-Mahaidi, R. Boundary element analysis of CFRP reinforced steel plates. Compos. Struct. 2009, 91, 74–83. [Google Scholar] [CrossRef]
- Tao, C.; Liang, H.; Zhang, N.; Yu, Q.Q. Boundary element analysis of fatigue behavior for CFRP-strengthened steel plates with center inclined cracks. Thin-Walled Struct. 2018, 125, 164–171. [Google Scholar]
- Yu, Q.Q.; Zhao, X.L.; Chen, T.; Gu, X.L.; Xiao, Z.G. Crack propagation prediction of CFRP retrofitted steel plates with different degrees of damage using BEM. Thin-Walled Struct. 2014, 82, 145–158. [Google Scholar] [CrossRef]
- Li, A.; Xu, S.; Wang, H.; Zhang, H.; Wang, Y. Bond behaviour between CFRP plates and corroded steel plates. Compos. Struct. 2019, 220, 221–235. [Google Scholar] [CrossRef]
- Li, A.B.; Wang, H.; Li, H.; Kong, D.L.; Xu, S.H. Estimation of Bond Strength and Effective Bond Length for the Double Strap Joint between Carbon Fiber Reinforced Polymer (CFRP) Plate and Corroded Steel Plate. Polymers 2022, 14, 3069. [Google Scholar] [CrossRef]
- Li, A. Fatigue Behavior and Design Method of Corroded Steel Plate Strengthened with CFRP Plates. Ph.D. Thesis, Xi’an University of Architecture & Technology, Xi’an, China, 2020. [Google Scholar]
- GB/T2567-2008; Test Methods for Properties of Resin Casting Body. Standards Press of China: Beijing, China, 2008.
- GB/T 228.1-2010; Metallic Materials—Tensile Testing—Part 1: Method of Test at Room Temperature. Standards Press of China: Beijing, China, 2010.
- Paris, P.; Erdogan, F. A Critical Analysis of Crack Propagation Laws. ASME J. Basic Eng. 1996, 85, 528–533. [Google Scholar] [CrossRef]
- Elber, W. The significance of fatigue crack closure. In Damage Tolerance in Aircraft Structures; American Society for Testing and Materials: West Conshohocken, PA, USA, 1971; pp. 230–242. [Google Scholar]
- Schijve, J. Fatigue crack closure, observations and technical significance. In Mechanics of Fatigue Crack Closure; American Society for Testing and Materials: West Conshohocken, PA, USA, 1986; Report LR-485. [Google Scholar]
- Dashan, D.; Xiao, M. Testing for paris coefficients C, m and ΔKth of Q235. J. Mech. Strength 2003, 25, 215–218. [Google Scholar]
- Wang, B. Experimental Study on the Effect of Corrosion on Fatigue Life and Crack Growth Rate of Low Carbon Steel. Master’s Thesis, Shandong University, Jinan, China, 2008. [Google Scholar]
- Dolley, E.J.; Lee, B.; Wei, R.P. The effect of pitting corrosion on fatigue life. Fatigue Fract. Eng. Mater. Struct. 2010, 23, 555–560. [Google Scholar] [CrossRef]
- Sankaran, K.K.; Perez, R.; Jata, K.V. Effects of pitting corrosion on the fatigue behavior of aluminum alloy 7075-T6: Modeling and experimental studies. Mater. Sci. Eng. A 2001, 297, 223–229. [Google Scholar] [CrossRef]
- Duquesnay, D.L.; Underhill, P.R.; Britt, H.J. Fatigue crack growth from corrosion damage in 7075-T6511 aluminium alloy under aircraft loading. Int. J. Fatigue 2003, 25, 371–377. [Google Scholar] [CrossRef]
- Zhang, C.; Yao, W. Judgment of critical pits and calculation of fatigue life. J. Mech. Strength 2013, 35, 207–213. [Google Scholar]
- Xu, S.H.; Wang, Y.D. Estimating the effects of corrosion pits on the fatigue life of steel plate based on the 3D profile. Int. J. Fatigue 2015, 72, 27–41. [Google Scholar] [CrossRef]
- Li, A.B.; Wang, H.; Li, H.; Kong, D.L.; Xu, S.H. Stress Concentration Analysis of the Corroded Steel Plate Strengthened with Carbon Fiber Reinforced Polymer (CFRP) Plates. Polymers 2022, 14, 3845. [Google Scholar] [CrossRef] [PubMed]
- Krueger, R. The Virtual Crack Closure Technique: History, Approach and Applications. Appl. Mech. Rev. 2004, 57, 109–143. [Google Scholar] [CrossRef]
- Newman, J.C., Jr.; Raju, I.S. Stress Intensity Factor Equations for Cracks in Three-Dimensional Finite Bodies Subjected to Tension and Bending Loads. In NASA Technical Memorandum; Langley Research Center, National Aeronautics and Space Administration: Hampton, VA, USA, 1984. [Google Scholar]
- Cerit, M.; Genel, K.; Eksi, S. Numerical investigation on stress concentration of corrosion pit. Eng. Fail. Anal. 2009, 16, 2467–2472. [Google Scholar] [CrossRef]


| Material | Specification | Thickness/mm | Tensile Modulus of Elasticity/GPa | Yield Strength/MPa | Tensile Strength/MPa | Elongation at Break % |
|---|---|---|---|---|---|---|
| CFRP plate | CFP-514 | 1.4 | 165 a | N/A | 2400 a | 1.61 a |
| CFP-520 | 2.0 | 165 a | N/A | 2400 a | 1.61 a | |
| Adhesive | Sikadur-30CN | N/A | 5.3 | N/A | 41.75 | 1.13 |
| Steel plate | Q235B | 10.75 b | 181.9 | 275.6 | 421.2 | 20.8 |
| Specimens No. | Cd /Month | ξ /% | Strengthening Configurations | CFRP Prestress Level | CFRP Specification | /×103 | /μm | /μm | /μm | /×103 | /×103 | ||
|---|---|---|---|---|---|---|---|---|---|---|---|---|---|
| C6-DS1-A | 6 | 9.16 | Case D | - | CFP-514 | 6115.896 | 2200 | 390 | 1124 | 3584.865 | 4684.312 | 0.586 | 0.766 |
| C6-U-S1 | 6 | 9.59 | Case A | - | - | 332.413 | 2400 | 356 | 1351 | - | - | - | - |
| C9-DS1-A | 9 | 13.25 | Case D | - | CFP-514 | 2057.247 | 1700 | 511 | 1351 | 1607.245 | 1820.874 | 0.781 | 0.885 |
| C9-U-S1 | 9 | 13.54 | Case A | - | - | 220.484 | 2200 | 441 | 1159 | - | - | - | - |
| C15-DS2-A | 15 | 16.38 | Case D | - | CFP-520 | 17,240 * | 3300 | 383 | 1275 | 1691.626 | 3124.658 | - | - |
| C15-DS1-PS-A | 15 | 15.27 | Case D | 4.5% | CFP-514 | 3025.477 | 2400 | 612 | 1264 | 1634.713 | 2309.643 | 0.540 | 0.763 |
| C15-DS1-A | 15 | 16.99 | Case D | - | CFP-514 | 1808.695 | 2300 | 667 | 1166 | 1078.600 | 1574.935 | 0.596 | 0.871 |
| C15-DS1 | 15 | 16.26 | Case B | - | - | 280.840 | 2200 | 553 | 1211 | 195,232 | 248.567 | 0.695 | 0.885 |
| C15-SS1-A | 15 | 16.42 | Case C | - | CFP-514 | 389.139 | 1900 | 520 | 1216 | 178.099 | 277.928 | 0.458 | 0.714 |
| C15-U-S1 | 15 | 16.52 | Case A | - | - | 202.164 | 2600 | 434 | 1199 | - | - | - | - |
| C18-DS1-A | 18 | 21.78 | Case D | - | CFP-514 | 1995.725 | 3300 | 365 | 1229 | 1001.530 | 1617.287 | 0.502 | 0.810 |
| C18-U-S1 | 18 | 21.19 | Case A | - | - | 175.414 | 3700 | 493 | 1097 | - | - | - | - |
| Analysis Step | /mm | /mm | /MPa·mm1/2 | /MPa·mm1/2 | /MPa·mm1/2 | /MPa·mm1/2 | /mm | /mm | ||
|---|---|---|---|---|---|---|---|---|---|---|
| 1 | 0.68 | 0.51 | 202.6 | 222.0 | 132.1 | 144.8 | 0.30 | 0.22 | 513,661 | 513,661 |
| 2 | 0.89 | 0.81 | 249.5 | 252.7 | 162.7 | 164.8 | 0.30 | 0.29 | 326,988 | 840,649 |
| 3 | 1.18 | 1.11 | 288.5 | 287.0 | 188.1 | 187.1 | 0.30 | 0.31 | 209,929 | 1,050,578 |
| 4 | 1.49 | 1.41 | 322.7 | 319.1 | 210.4 | 208.1 | 0.30 | 0.31 | 145,000 | 1,195,578 |
| 5 | 1.80 | 1.71 | 353.6 | 349.2 | 230.6 | 227.7 | 0.30 | 0.31 | 105,918 | 1,301,496 |
| 6 | 2.11 | 2.01 | 382.9 | 377.4 | 249.7 | 246.1 | 0.30 | 0.32 | 80,745 | 1,382,241 |
| 7 | 2.43 | 2.31 | 411.2 | 404.6 | 268.1 | 263.9 | 0.30 | 0.32 | 63,348 | 1,445,588 |
| 8 | 2.74 | 2.61 | 436.8 | 430.2 | 284.8 | 280.5 | 0.30 | 0.32 | 51,179 | 1,496,768 |
| 9 | 3.06 | 2.91 | 462.7 | 454.2 | 301.7 | 296.2 | 0.50 | 0.53 | 70,567 | 1,567,335 |
| 10 | 3.59 | 3.41 | 504.6 | 493.5 | 329.0 | 321.8 | 0.50 | 0.54 | 52,824 | 1,620,159 |
| 11 | 4.13 | 3.91 | 546.5 | 531.3 | 356.3 | 346.4 | 0.50 | 0.55 | 40,856 | 1,661,015 |
| 12 | 4.69 | 4.41 | 589.1 | 568.4 | 384.1 | 370.6 | 0.50 | 0.57 | 32,287 | 1,693,302 |
| 13 | 5.25 | 4.91 | 633.3 | 605.1 | 413.0 | 394.6 | 0.50 | 0.59 | 25,952 | 1,719,254 |
| 14 | 5.84 | 5.41 | 679.5 | 641.8 | 443.1 | 418.5 | 0.50 | 0.61 | 21,142 | 1,740,396 |
| 15 | 6.45 | 5.91 | 728.9 | 678.3 | 475.3 | 442.3 | 0.50 | 0.64 | 17,434 | 1,757,830 |
| 16 | 7.09 | 6.41 | 781.3 | 715.5 | 509.5 | 466.5 | 0.50 | 0.68 | 14,469 | 1,772,299 |
| 17 | 7.77 | 6.91 | 837.3 | 753.8 | 546.0 | 491.5 | 0.50 | 0.72 | 12,065 | 1,784,364 |
| 18 | 8.49 | 7.41 | 898.5 | 794.0 | 585.9 | 517.7 | 0.50 | 0.77 | 10,065 | 1,794,430 |
| 19 | 9.26 | 7.91 | 965.2 | 836.9 | 629.4 | 545.7 | 0.50 | 0.82 | 8377 | 1,802,806 |
| 20 | 10.08 | 8.41 | 1023.9 | 877.2 | 667.7 | 572.0 | 0.50 | 0.86 | 7111 | 1,809,917 |
| 21 | 10.94 | 8.91 | 1085.9 | 918.2 | 708.1 | 598.7 | 0.42 | 0.75 | 5033 | 1,814,950 |
| 22 | 11.69 | 9.33 | 1469.7 | - | 958.3 | - | - | 0.50 | 1176 | 1,816,126 |
| 23 | 12.19 | - | 1530.4 | - | 997.9 | - | - | 0.50 | 1021 | 1,817,147 |
| 24 | 12.69 | - | 1596.6 | - | 1041.0 | - | - | 0.50 | 881 | 1,818,028 |
| 25 | 13.19 | - | 1672.8 | - | 1090.8 | - | - | 0.50 | 749 | 1,818,777 |
| 26 | 13.69 | - | 1759.4 | - | 1147.2 | - | - | 0.50 | 628 | 1,819,405 |
| 27 | 14.19 | - | 1862.9 | - | 1214.7 | - | - | 0.50 | 514 | 1,819,919 |
| 28 | 14.69 | - | 1986.7 | - | 1295.4 | - | - | 0.50 | 411 | 1,820,331 |
| 29 | 15.19 | - | 2143.0 | - | 1397.4 | - | - | 0.50 | 316 | 1,820,646 |
| 30 | 15.69 | - | 2353.9 | - | 1534.9 | - | - | 0.50 | 228 | 1,820,874 |
Publisher’s Note: MDPI stays neutral with regard to jurisdictional claims in published maps and institutional affiliations. |
© 2022 by the authors. Licensee MDPI, Basel, Switzerland. This article is an open access article distributed under the terms and conditions of the Creative Commons Attribution (CC BY) license (https://creativecommons.org/licenses/by/4.0/).
Share and Cite
Li, A.; Wang, L.; Xu, S. Fatigue Crack Propagation Prediction of Corroded Steel Plate Strengthened with Carbon Fiber Reinforced Polymer (CFRP) Plates. Polymers 2022, 14, 4738. https://doi.org/10.3390/polym14214738
Li A, Wang L, Xu S. Fatigue Crack Propagation Prediction of Corroded Steel Plate Strengthened with Carbon Fiber Reinforced Polymer (CFRP) Plates. Polymers. 2022; 14(21):4738. https://doi.org/10.3390/polym14214738
Chicago/Turabian StyleLi, Anbang, Lu Wang, and Shanhua Xu. 2022. "Fatigue Crack Propagation Prediction of Corroded Steel Plate Strengthened with Carbon Fiber Reinforced Polymer (CFRP) Plates" Polymers 14, no. 21: 4738. https://doi.org/10.3390/polym14214738