
Electrospun Polycrown Ether Composite Nanofibers as an Adsorbent for On-Line Solid Phase Extraction of Eight Bisphenols from Drinking Water Samples with Column-Switching Prior to High Performance Liquid Chromatography


Abstract
:
1. Introduction
2. Experimental
2.1. Materials
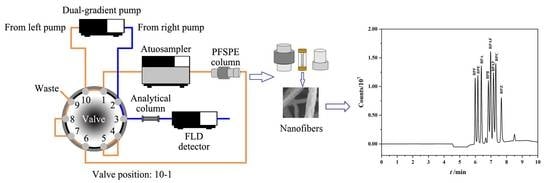
2.2. Instrumentation
2.3. Preparation of Standard Solutions and Samples
2.4. Preparation of Electrospun Nanofibers
2.5. Preparation of Column for On-Line PFSPE and Off-Line PFSPE
2.6. The On-Line PFSPE-HPLC Analysis Procedure
2.7. Preparation of Drinking Water
3. Results and Discussion
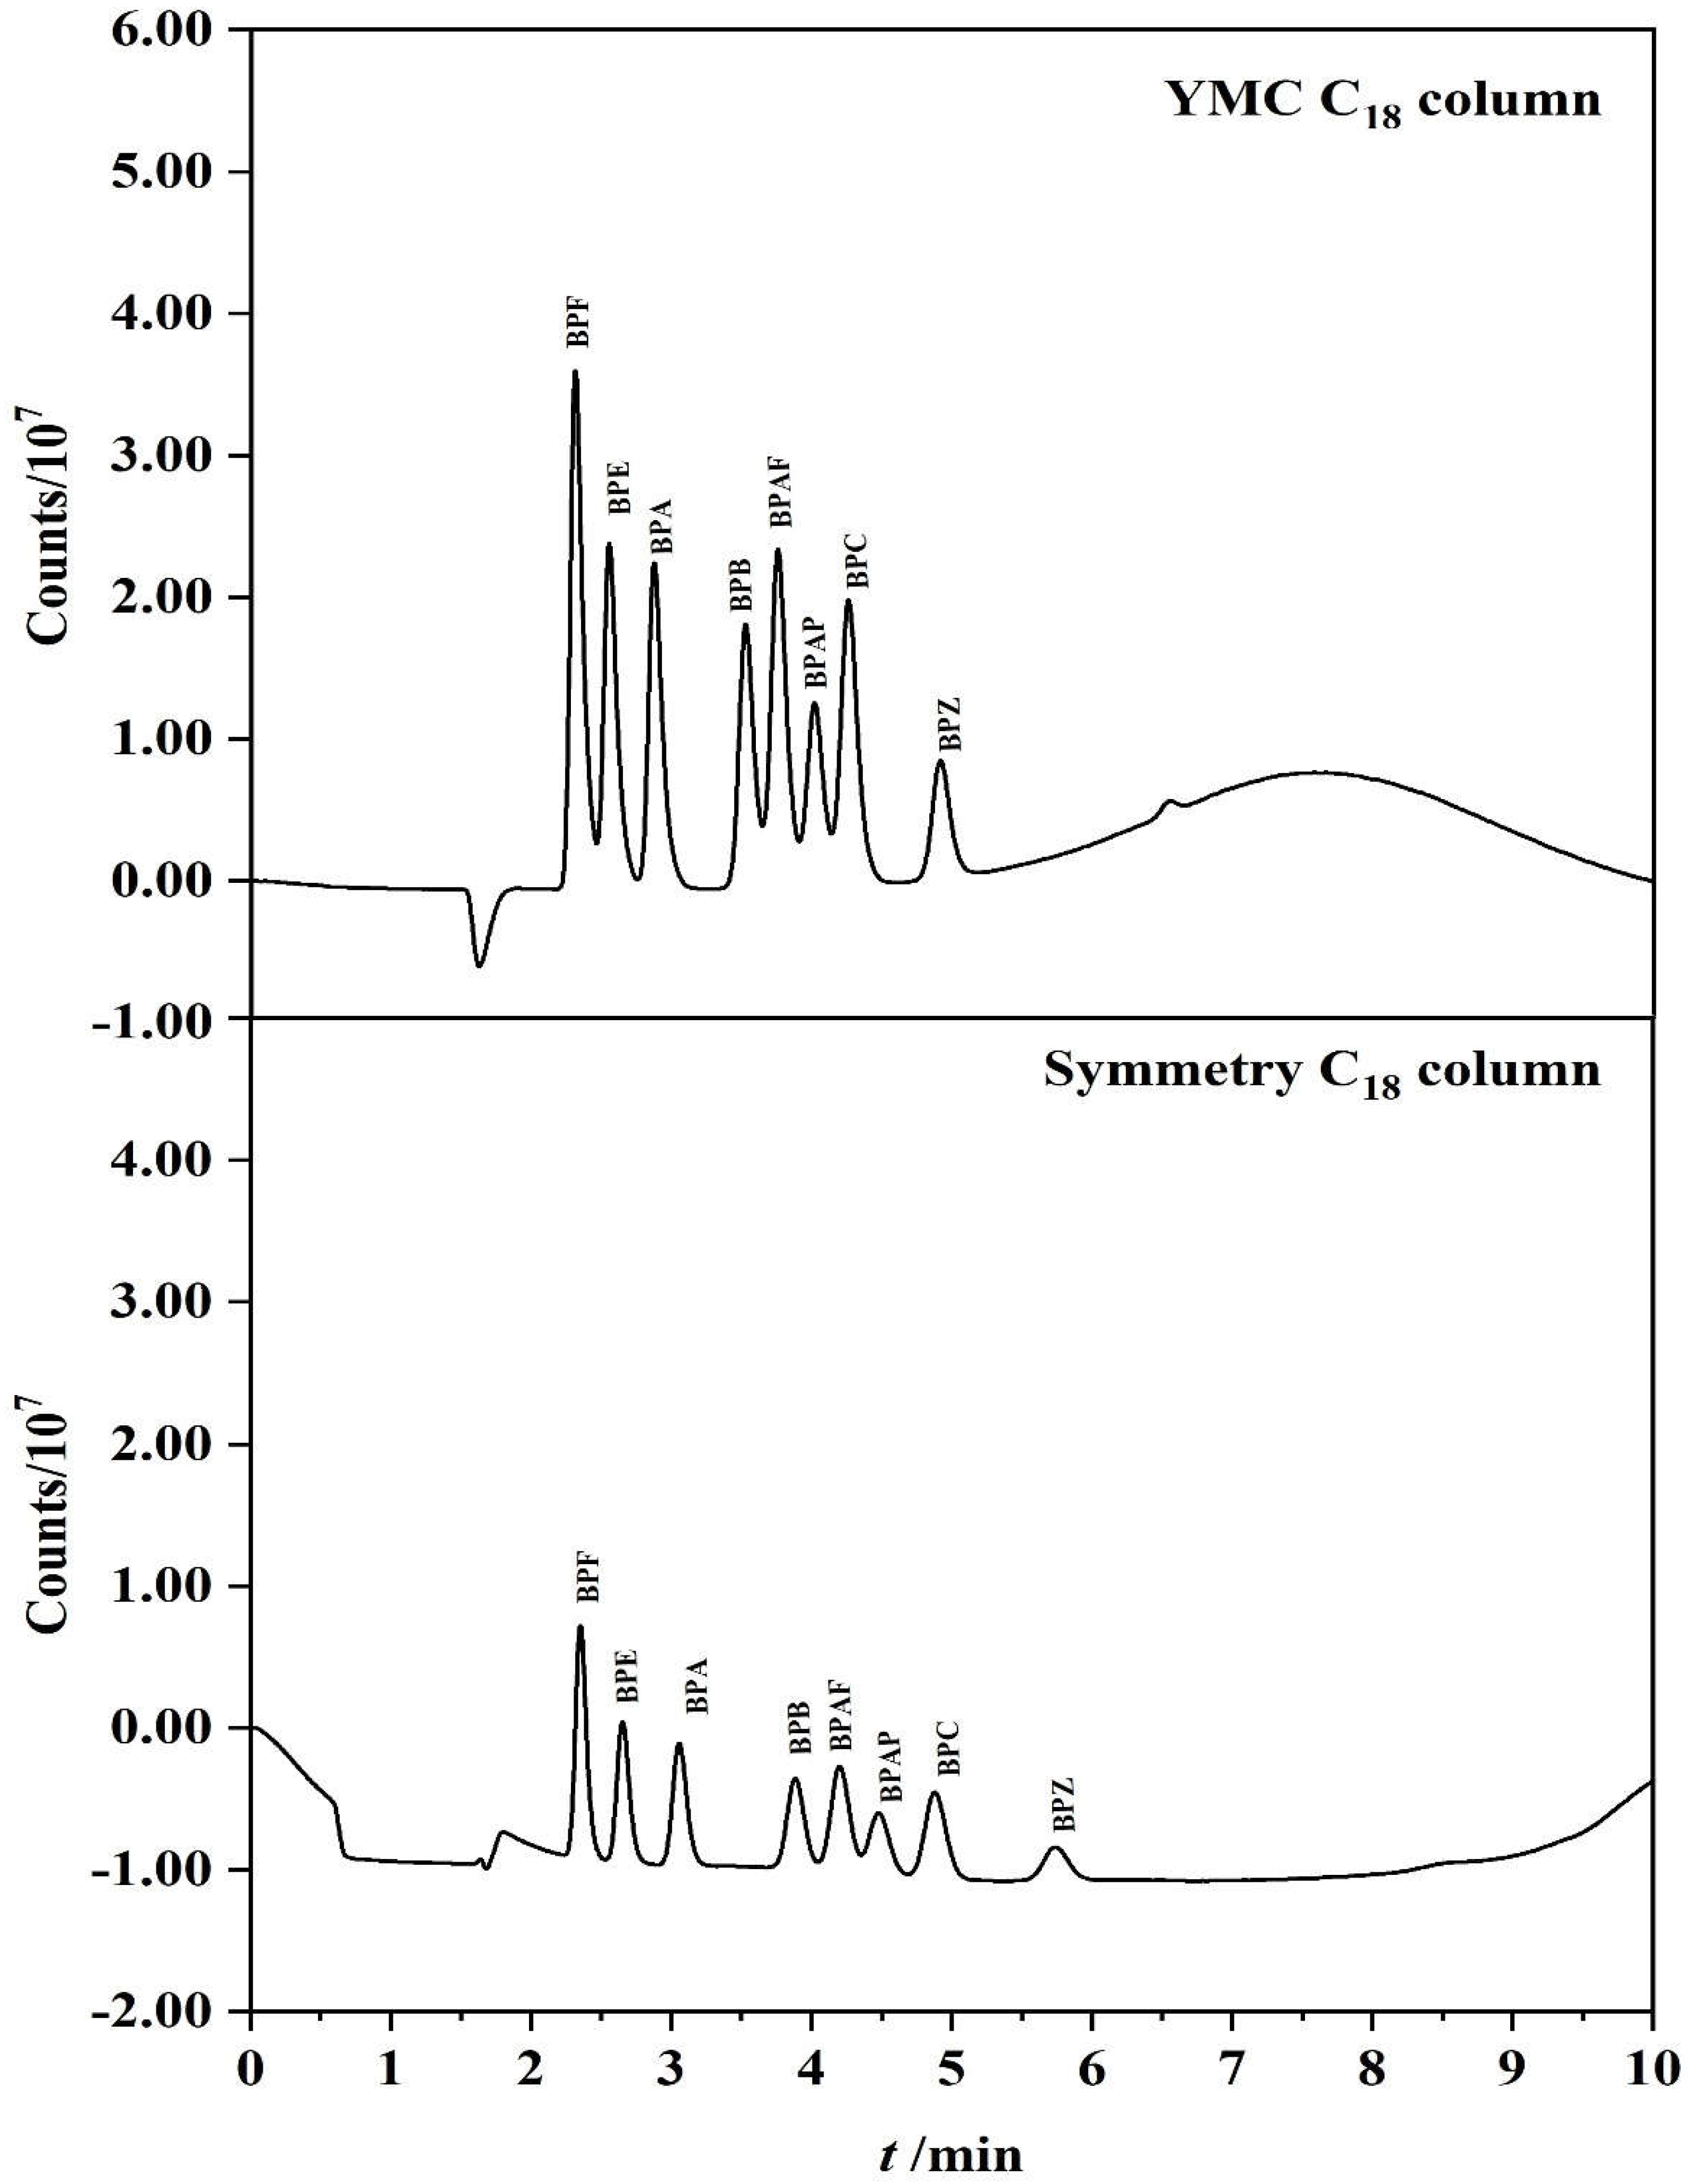
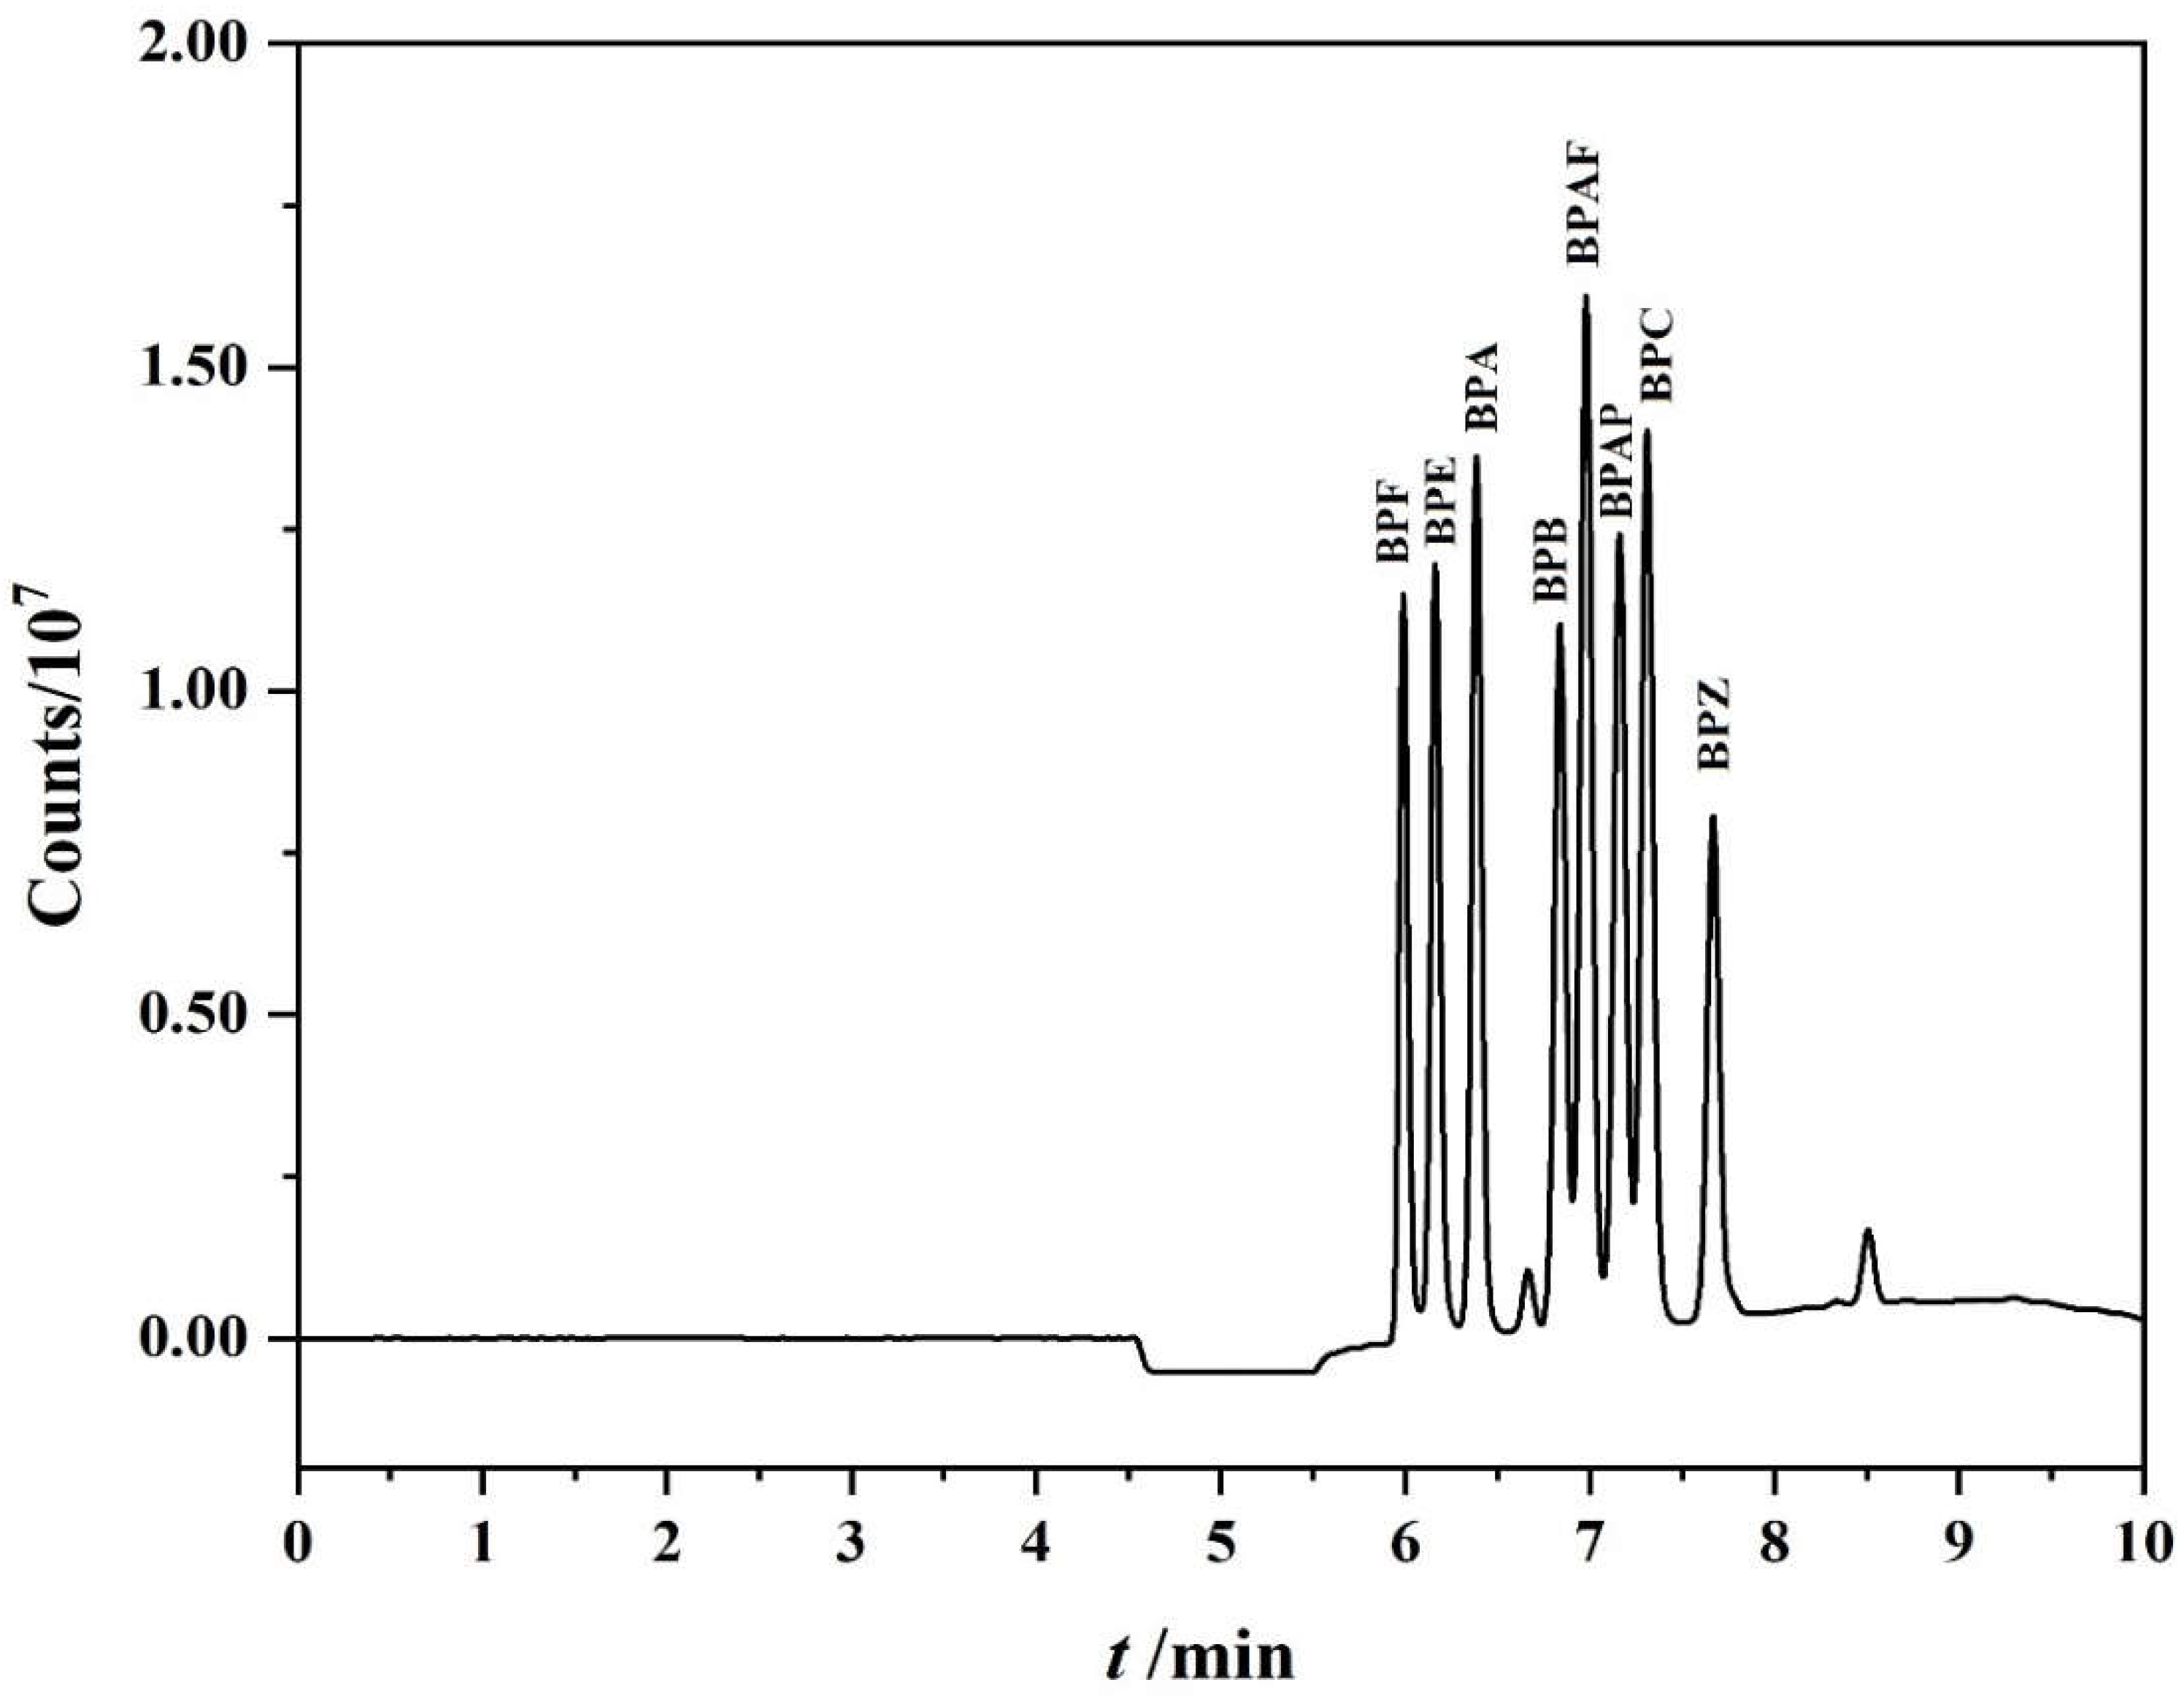
3.1. Optimization of Chromatographic Separation Conditions
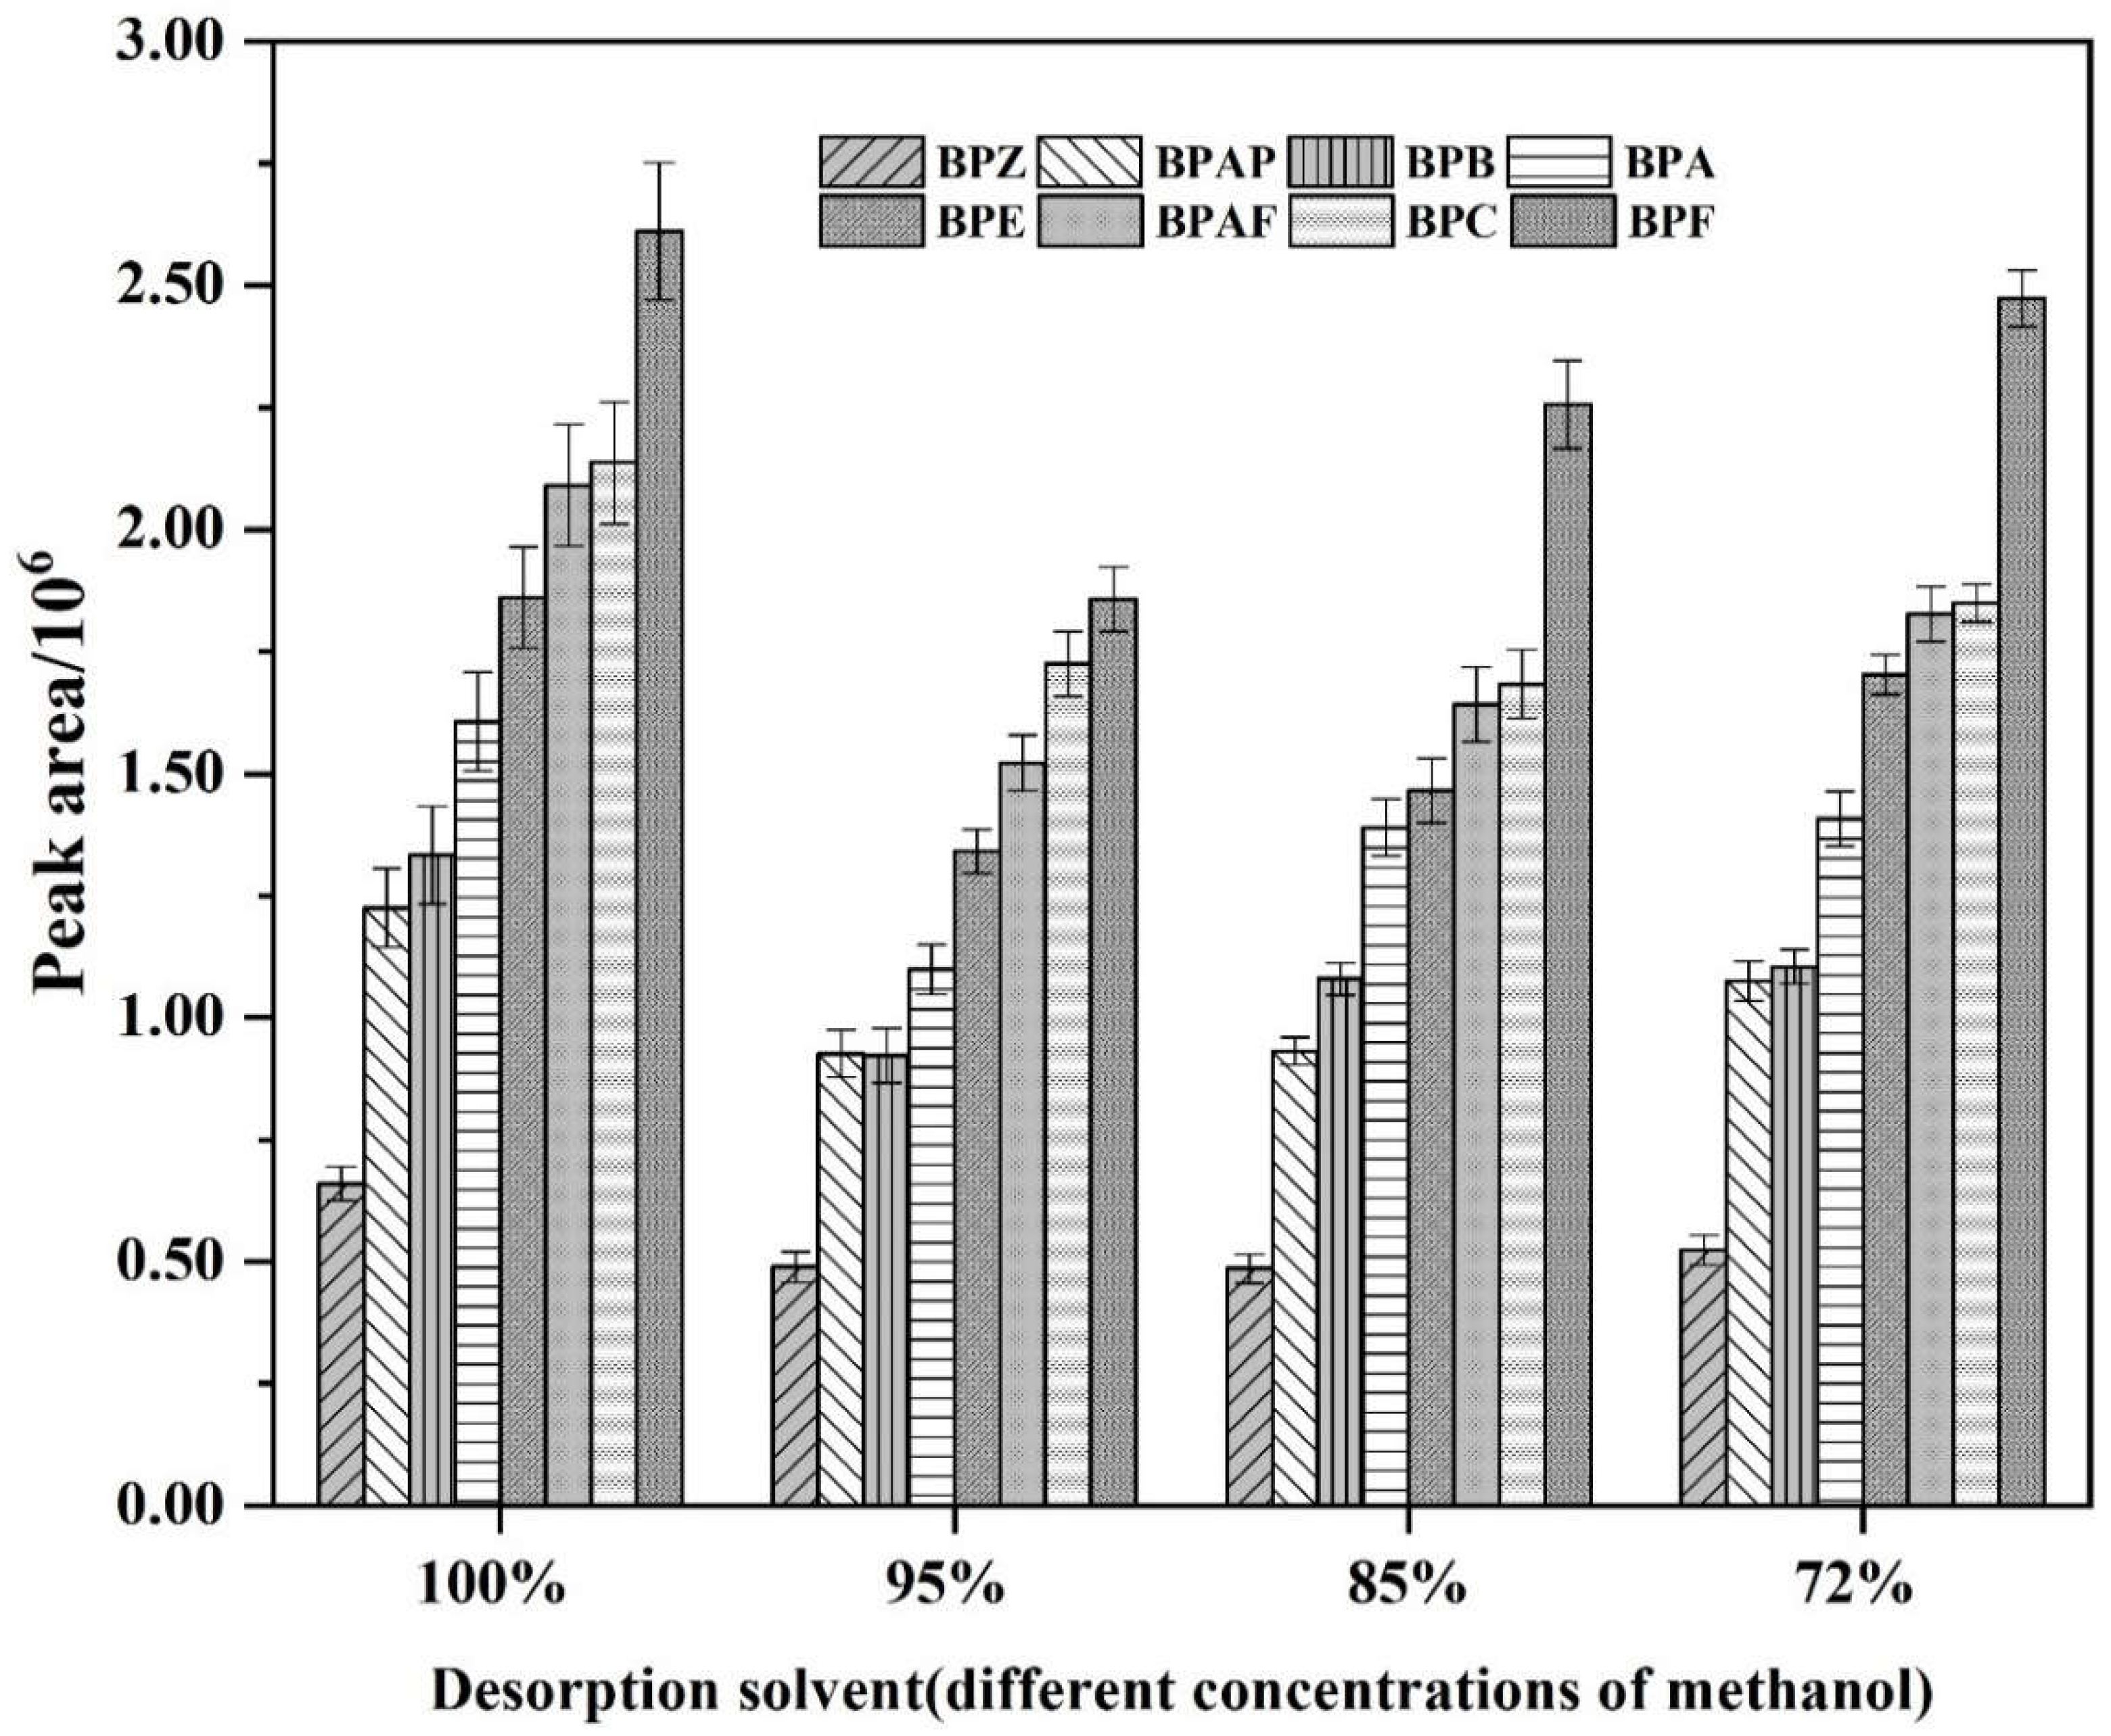
3.2. The Influence of the Desorption Solvent
3.3. Optimization of the On-Line PFSPE Procedure
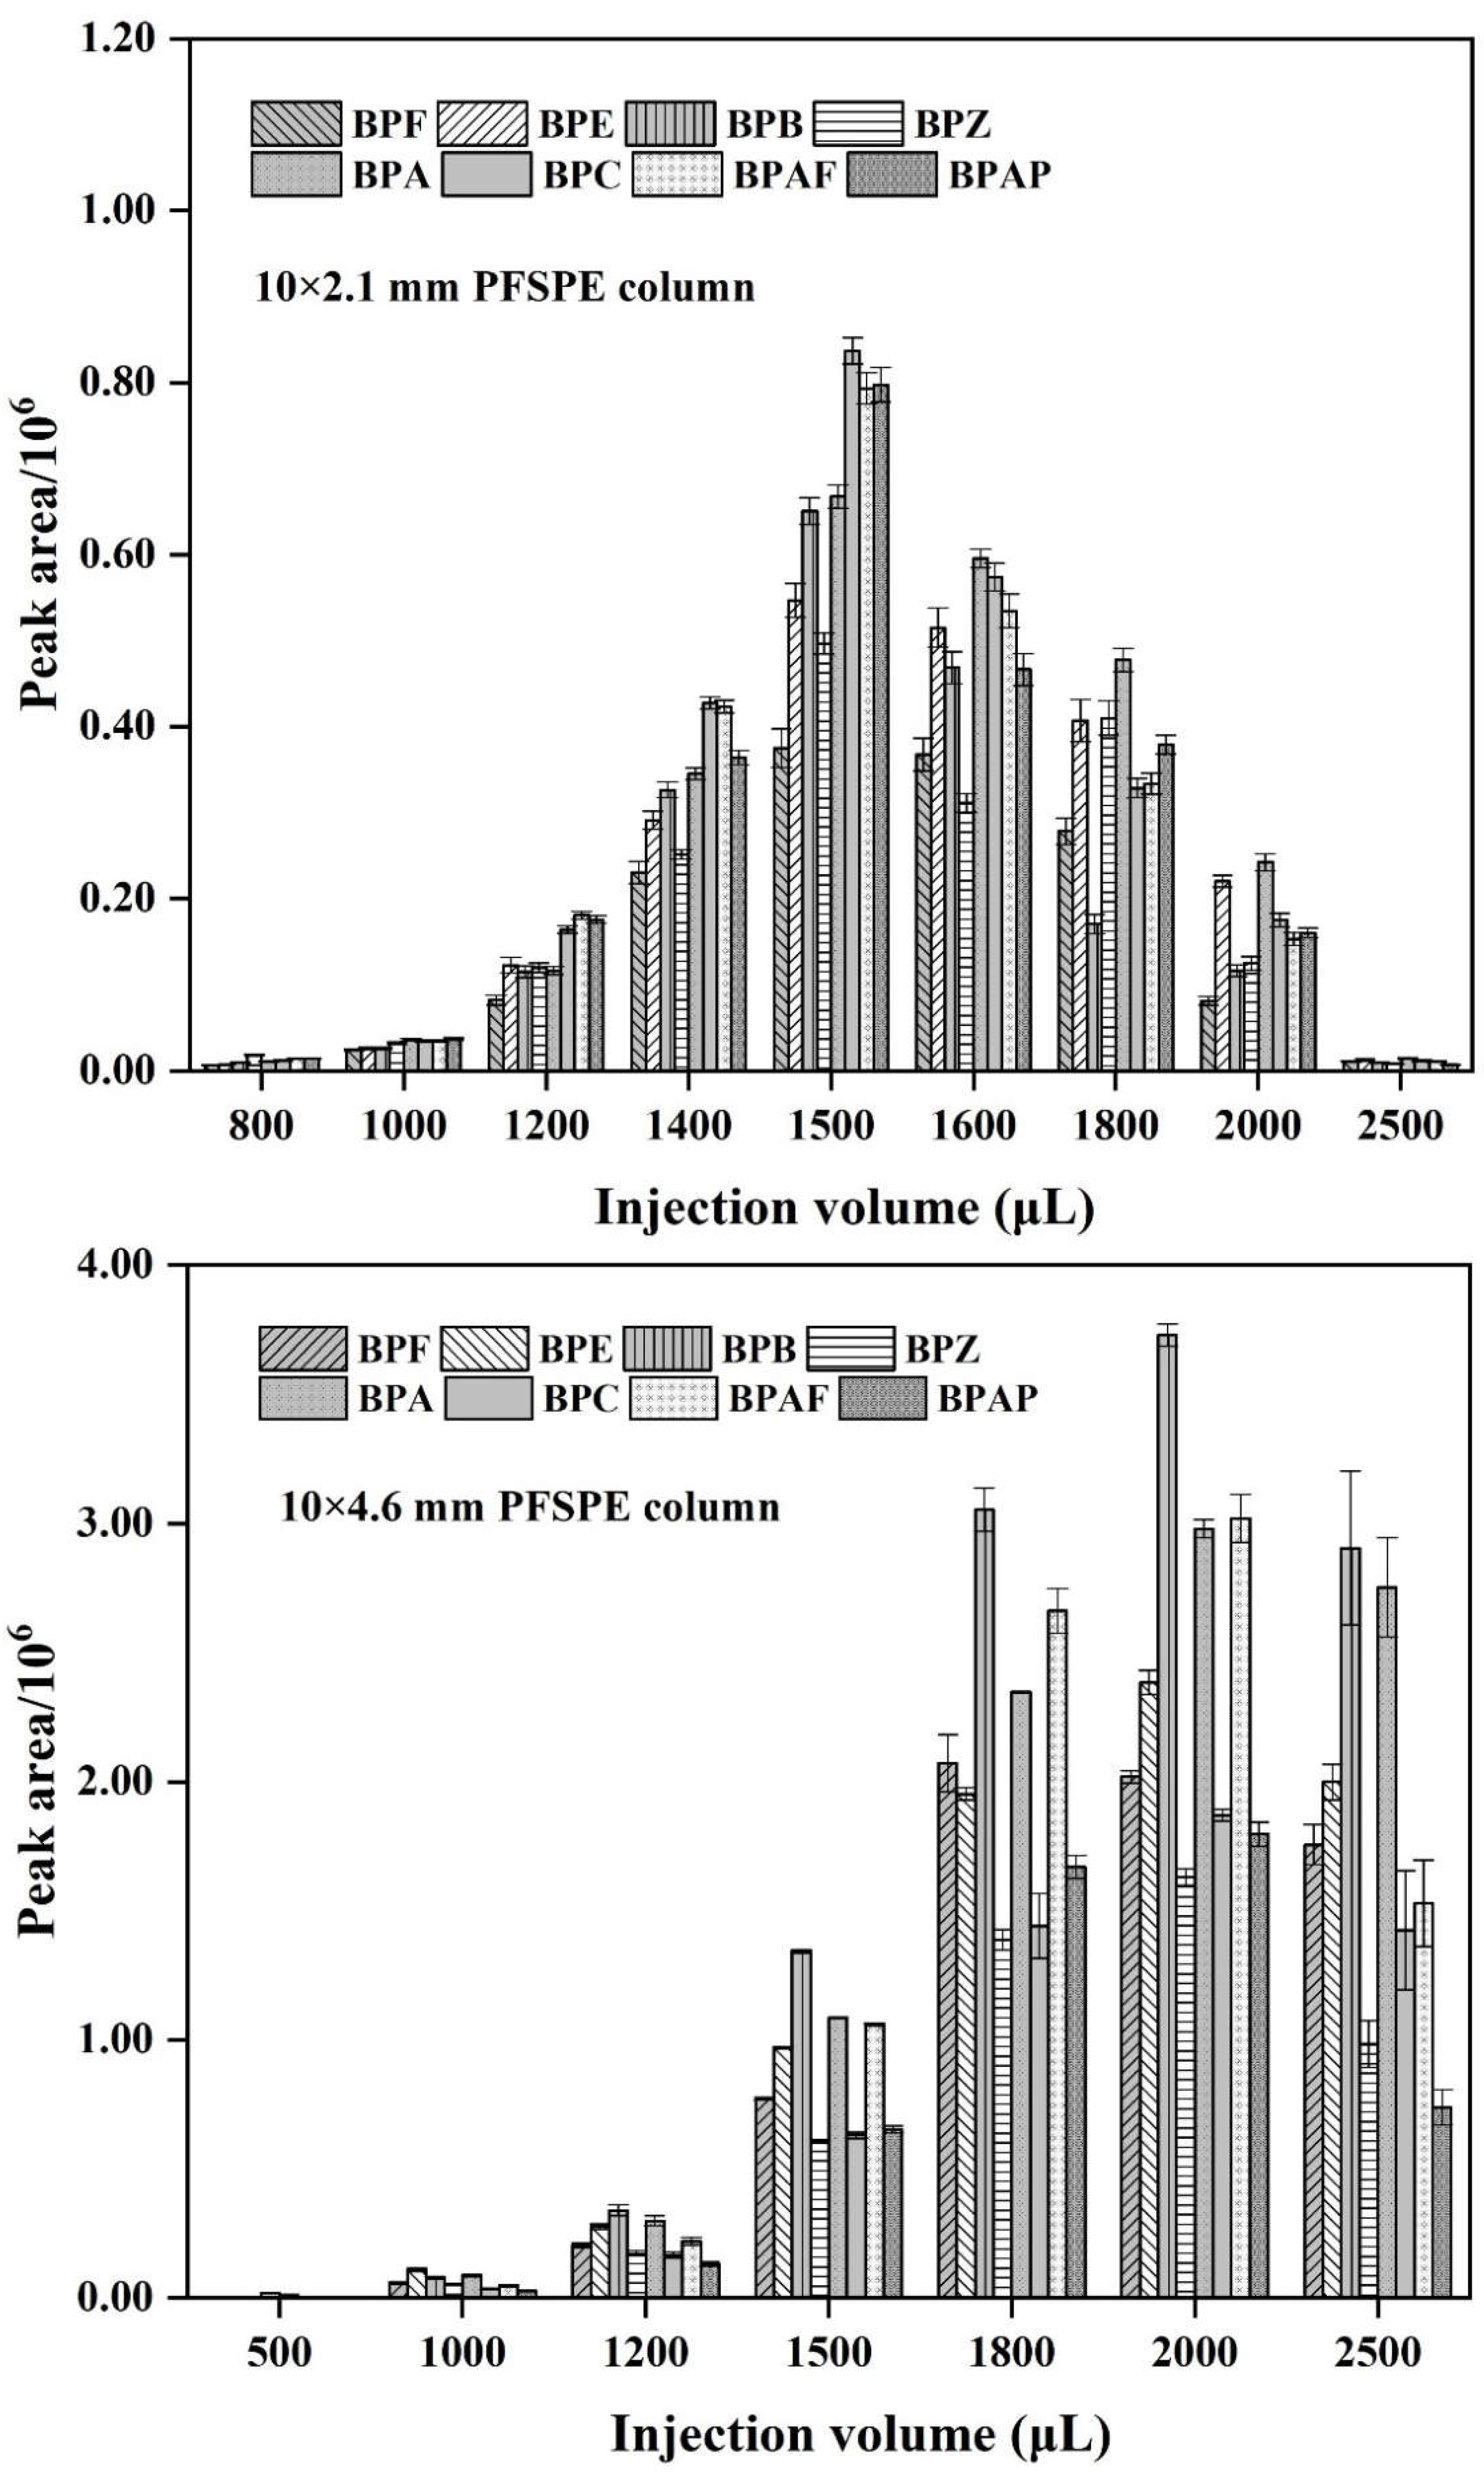
3.4. Selecting PFSPE Column Types and Injection Volume
3.5. Stability of Nanofibers during On-Line PFSPE Chromatography Testing
3.6. Stability Test of BPs
3.7. Linearity and Recovery of the On-Line PFSPE-HPLC Method
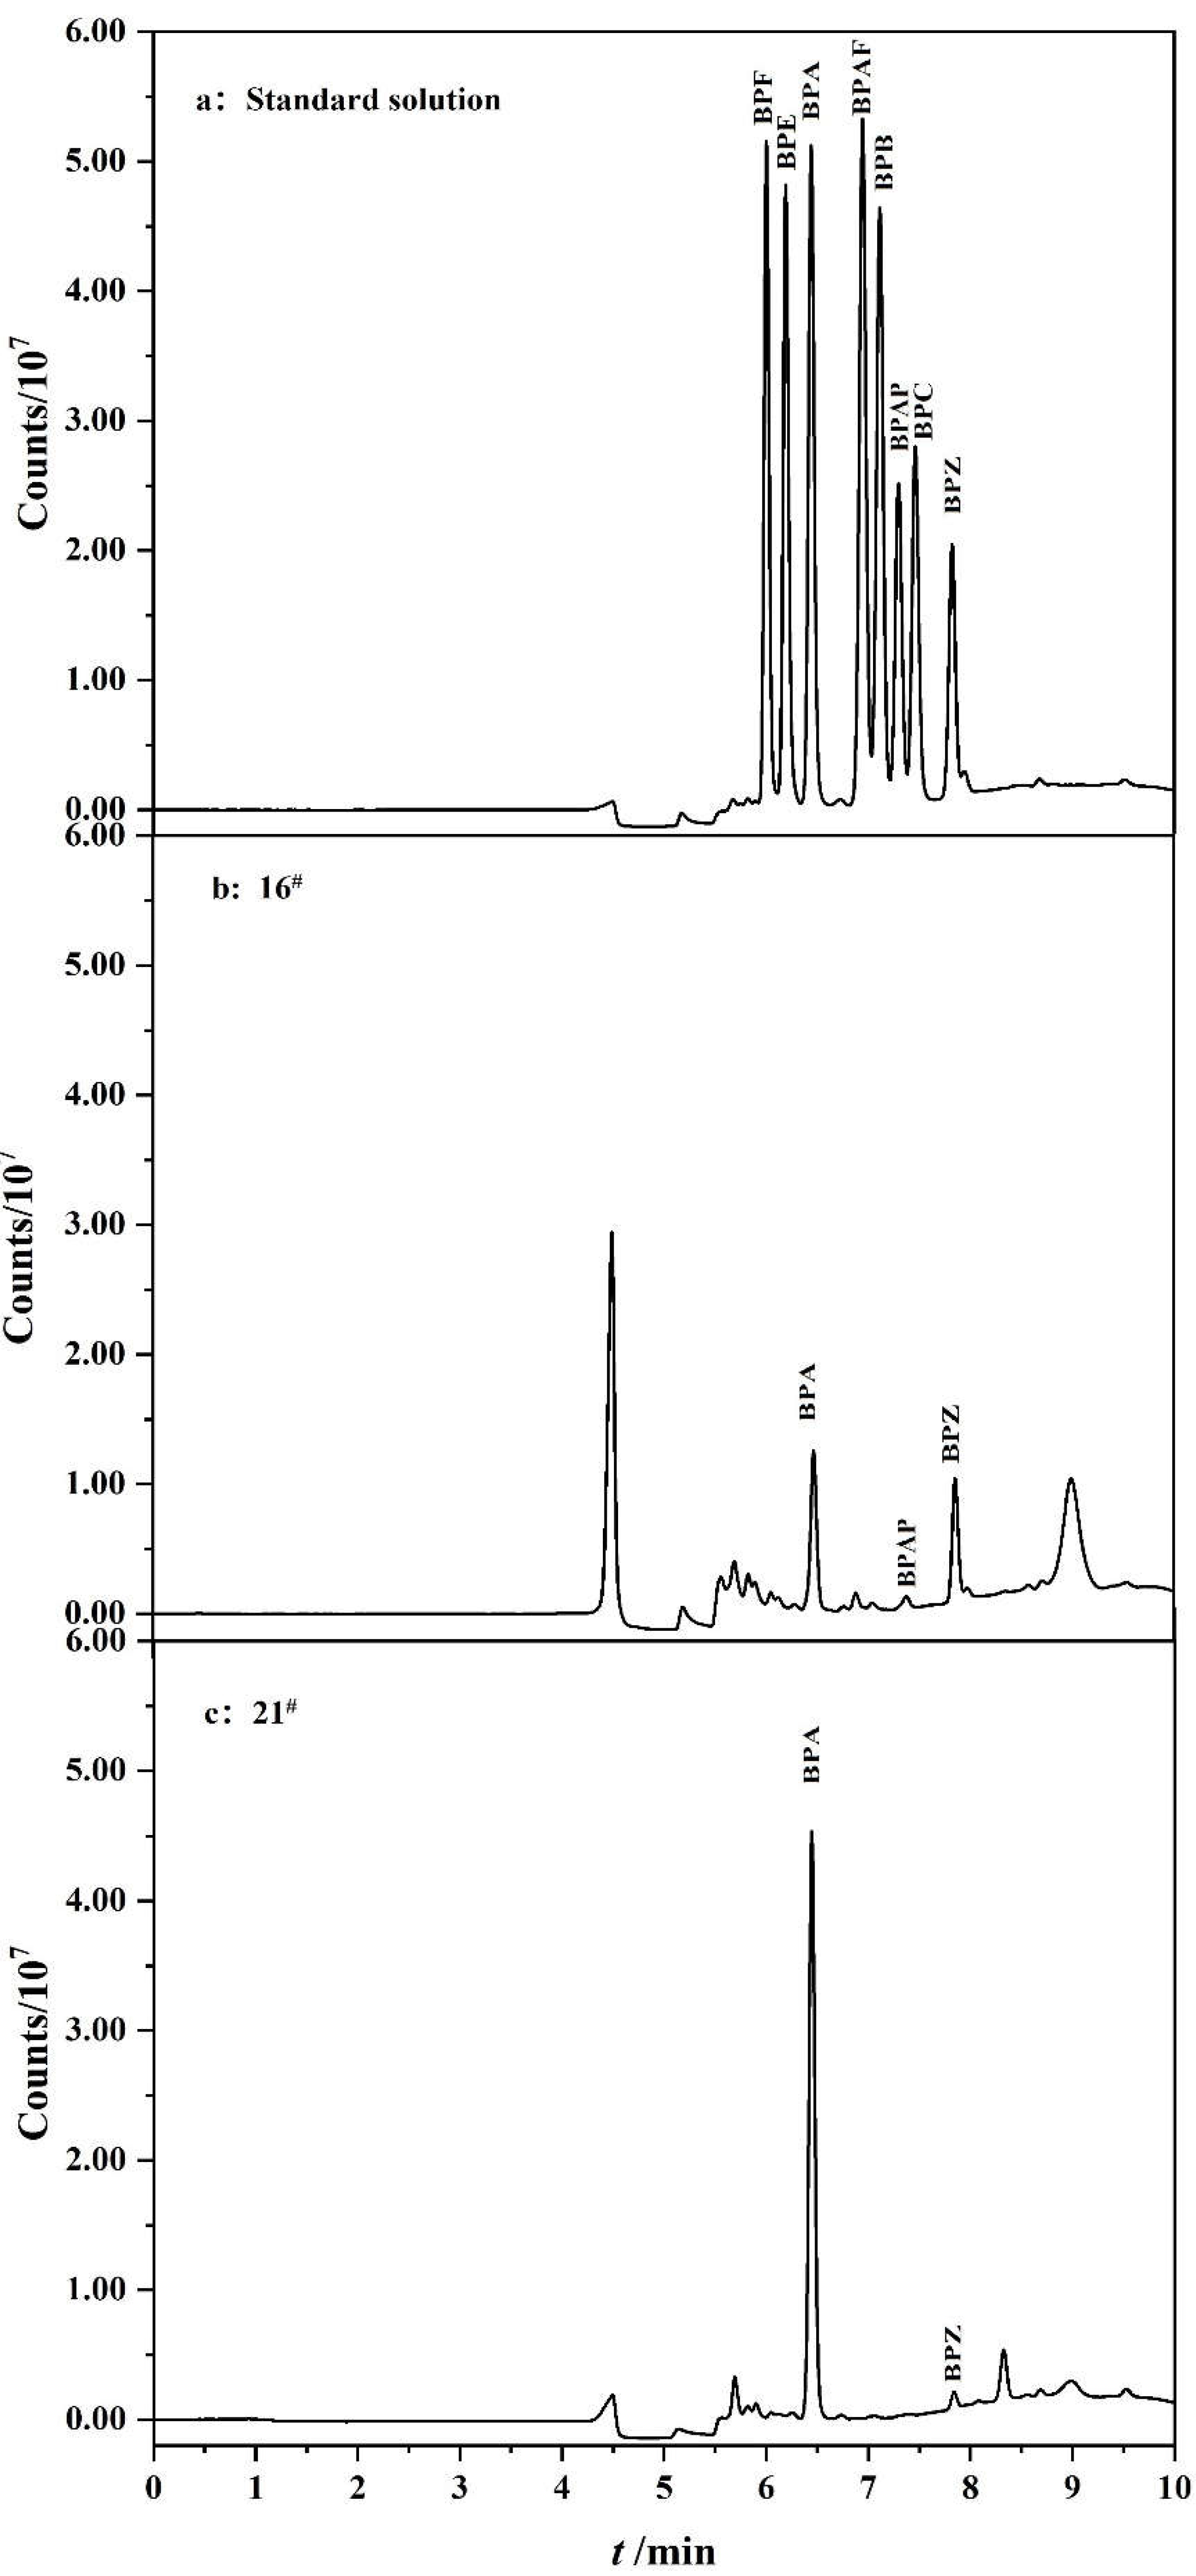
3.8. Analysis of Real Samples
3.9. Comparison of Analytical Performance with Available Methods
4. Conclusions
Supplementary Materials
Author Contributions
Funding
Institutional Review Board Statement
Informed Consent Statement
Data Availability Statement
Acknowledgments
Conflicts of Interest
References
- Saini, S.S.; Martini, M.F. A green hybrid microextraction for sensitive determination of bisphenol A in aqueous samples using three different sorbents: Analytical and computational studies. Microchem. J. 2021, 160, 105612. [Google Scholar] [CrossRef]
- Amir, S.; Shah, S.T.A.; Mamoulakis, C.; Docea, A.O.; Kalantzi, O.I.; Zachariou, A.; Calina, D.; Carvalho, F.; Sofikitis, N.; Makrigiannakis, A.; et al. Endocrine Disruptors Acting on Estrogen and Androgen Pathways Cause Reproductive Disorders through Multiple Mechanisms: A Review. Int. J. Environ. Res. Public Health 2021, 18, 1464. [Google Scholar] [CrossRef]
- Scsukova, S.; Rollerova, E.; Bujnakova Mlynarcikova, A. Impact of endocrine disrupting chemicals on onset and development of female reproductive disorders and hormone-related cancer. Reprod. Biol. 2016, 16, 243–254. [Google Scholar] [CrossRef]
- Hansen, J.B.; Bilenberg, N.; Timmermann, C.A.G.; Jensen, R.C.; Frederiksen, H.; Andersson, A.M.; Kyhl, H.B.; Jensen, T.K. Prenatal exposure to bisphenol A and autistic- and ADHD-related symptoms in children aged 2 and5 years from the Odense Child Cohort. Environ. Health 2021, 20, 24. [Google Scholar] [CrossRef]
- Geens, T.; Goeyens, L.; Covaci, A. Are potential sources for human exposure to bisphenol-A overlooked? Int. J. Hyg. Environ. Health 2011, 214, 339–347. [Google Scholar] [CrossRef]
- Santonicola, S.; Albrizio, S.; Ferrante, M.C.; Raffaelina, M. Study on bisphenol F, a bisphenol A analogue, at a dairy company: Health hazard and risk assessment. Food Chem. Toxicol. 2021, 154, 112334. [Google Scholar] [CrossRef]
- Jo, M.J.; Park, J.H.; An, K.A.; Choi, H.; Kang, Y.S.; Hwang, M. Quantification of bisphenols in Korean urine using online solid-phase extraction-high-performance liquid chromatography-tandem mass spectrometry. Environ. Toxicol. Pharmacol. 2020, 80, 103491. [Google Scholar] [CrossRef]
- Ho, S.M.; Rao, R.; To, S.; Schoch, E.; Tarapore, P. Bisphenol A and its analogues disrupt centrosome cycle and microtubule dynamics in prostate cancer. Endocr. Relat. Cancer 2017, 24, 83–96. [Google Scholar] [CrossRef] [Green Version]
- Beg, M.A.; Sheikh, I.A. Endocrine disruption: Molecular interactions of environmental bisphenol contaminants with thyroid hormone receptor and thyroxine-binding globulin. Toxicol. Ind. Health 2020, 36, 322–335. [Google Scholar] [CrossRef]
- Rochester, J.R. Bisphenol A and human health: A review of the literature. Reprod. Toxicol. 2013, 42, 132–155. [Google Scholar] [CrossRef]
- Russo, G.; Barbato, F.; Grumetto, L. Development and Validation of a LC-FD Method for the Simultaneous Determination of Eight Bisphenols in Soft Drinks. Food Anal. Methods 2016, 9, 2732–2740. [Google Scholar] [CrossRef]
- Zhang, J.; Zang, L.; Wang, T.; Wang, X.; Jia, M.; Zhang, D.; Zhang, H. A solid-phase extraction method for estrogenic disrupting compounds based on the estrogen response element. Food Chem. 2020, 333, 127529. [Google Scholar] [CrossRef]
- Maragou, N.C.; Thomaidis, N.S.; Theodoridis, G.A.; Lampi, E.N.; Koupparis, M.A. Determination of bisphenol A in canned food by microwave assisted extraction, molecularly imprinted polymer-solid phase extraction and liquid chromatography-mass spectrometry. J. Chromatogr. B Anal. Technol. Biomed. Life Sci. 2020, 1137, 121938. [Google Scholar] [CrossRef]
- Guo, X.; Huang, Y.; Yu, W.; Yu, X.; Han, X.; Zhai, H. Multi-walled carbon nanotubes modified with iron oxide and manganese dioxide (MWCNTs-Fe3O4−MnO2) as a novel adsorbent for the determination of BPA. Microchem. J. 2020, 157, 104867. [Google Scholar] [CrossRef]
- Alnaimat, A.S.; Barciela-Alonso, M.C.; Bermejo-Barrera, P. Determination of bisphenol A in tea samples by solid phase extraction and liquid chromatography coupled to mass spectrometry. Microchem. J. 2019, 147, 598–604. [Google Scholar] [CrossRef]
- Yoshiyuki, W.; Takuya, K.; Hiroe, I.; Masatoshi, M.; Nobuo, T.; Hosoy, K. Reducing Bisphenol A contamination from analytical procedures to determine ultralow levels in environmental samples using automated HPLC microanalysis. Anal. Chem. 2004, 76, 105–109. [Google Scholar]
- Han, S.; Song, Y.; Hu, J.; Liu, R.; Chi, Y.; Kang, A.; Deng, H.; Zhu, D. Novel computer-assisted separation prediction strategy for online-enrichment-HPLC-FLD in simultaneous monitoring of bisphenols in children’s water bottles. Food Chem. 2021, 339, 127766. [Google Scholar] [CrossRef]
- Villarreal-Morales, R.; Hinojosa-Reyes, L.; Hernández-Ramírez, A.; Ruíz-Ruíz, E.; Maya Treviño, M.d.L.; Guzmán-Mar, J.L. Automated SPE-HPLC-UV methodology for the on-line determination of plasticisers in wastewater samples. Int. J. Environ. Anal. Chem. 2020, 102, 1683–1696. [Google Scholar] [CrossRef]
- Goeury, K.; Vo Duy, S.; Munoz, G.; Prevost, M.; Sauve, S. Analysis of Environmental Protection Agency priority endocrine disruptor hormones and bisphenol A in tap, surface and wastewater by online concentration liquid chromatography tandem mass spectrometry. J. Chromatogr. A 2019, 1591, 87–98. [Google Scholar] [CrossRef]
- Háková, M.; Havlíková, L.C.; Chvojka, J.; Solich, P.; Satinsky, D. An on-line coupling of nanofibrous extraction with column-switching high performance liquid chromatography—A case study on the determination of bisphenol A in environmental water samples. Talanta 2018, 178, 141–146. [Google Scholar] [CrossRef]
- Kang, X.; Pan, C.; Xu, Q.; Yao, Y.; Wang, Y.; Qi, D.; Gu, Z. The investigation of electrospun polymer nanofibers as a solid-phase extraction sorbent for the determination of trazodone in human plasma. Anal. Chim. Acta 2007, 587, 75–81. [Google Scholar] [CrossRef]
- Chen, L.Q.; Wang, H.; Xu, Z.; Zhang, Q.Y.; Liu, J.; Shen, J.; Zhang, W.Q. High-throughput and selective solid-phase extraction of urinary catecholamines by crown ether-modified resin composite fiber. J. Chromatogr. A 2018, 1561, 48–55. [Google Scholar] [CrossRef]
- Chen, L.Q.; Tang, Y.; Xu, B.; Xu, Z.; Shen, J.; Zhang, W.Q. Automated on-line packed fiber solid phase extraction for determination of urinary catecholamines. J. Chromatogr. B Anal. Technol. Biomed. Life Sci. 2020, 1139, 121983. [Google Scholar] [CrossRef]
- Chen, L.Q.; Zhu, X.H.; Huang, D.N.; Xu, Z.; Shen, J.; Zhang, W.Q. Polystyrene/poly(dibenzo-18-crown-6) composite nanofibers for the selective adsorption of plasma catecholamines. RSC Adv. 2017, 7, 13263–13271. [Google Scholar] [CrossRef] [Green Version]
- Li, L.; Wang, J.; Zhou, S.; Zhao, M. Development and characterization of an immunoaffinity monolith for selective on-line extraction of bisphenol A from environmental water samples. Anal. Chim. Acta 2008, 620, 1–7. [Google Scholar] [CrossRef]
- Erben, J.; Klicova, M.; Klapstova, A.; Hakova, M.; Lhotská, I.; Zatrochová, S.; Šatínský, D.; Chvojka, J. New polyamide 6 nanofibrous sorbents produced via alternating current electrospinning for the on-line solid phase extraction of small molecules in chromatography systems. Microchem. J. 2022, 174, 107084. [Google Scholar] [CrossRef]

| Time (min) | Left Pump | Right Pump | Valve Position | |
|---|---|---|---|---|
| A (%) | A (%) | B (%) | ||
| 0 3.5 4.5 4.55 5.6 7.7 7.8 10 | 100 | 28 | 72 | 10_1 |
| 100 | 28 | 72 | 1_2 | |
| 100 | 28 | 72 | 10_1 | |
| 100 | 28 | 72 | 10_1 | |
| 100 | 20 | 80 | 10_1 | |
| 100 | 20 | 80 | 10_1 | |
| 100 | 28 | 72 | 10_1 | |
| 100 | 28 | 72 | 10_1 | |
| BPF | BPE | BPA | BPB | BPAF | BPAP | BPC | BPZ | |
|---|---|---|---|---|---|---|---|---|
| Calibration parameters | ||||||||
| Slope | 2913.4 | 2789.4 | 3347.8 | 3990 | 3379.2 | 1683.7 | 2004.4 | 1424.9 19898 0.9982 50.0–1000.0 |
| Intercept | −61,320 | 108,056 | −5056.9 | −48,949 | −36,578 | −20,958 | −22,048 | |
| r2 | 0.9982 | 0.9999 | 0.9994 | 0.9988 | 0.9993 | 0.9987 | 0.9991 | |
| Linear range (pg/mL) | 50.0–1000.0 | 50.0–1000.0 | 50.0–1000.0 | 50.0–1000.0 | 50.0–1000.0 | 50.0–1000.0 | 50.0–1000.0 | |
| Precision of the analytical method | ||||||||
| Intra-day repeatability (RSD %, n = 6) | ||||||||
| Spiking level (pg/mL) | ||||||||
| 50.0 | 1.8 | 6.9 | 2.9 | 8.9 | 6.9 | 4.1 | 5.7 | 7.2 1.5 7.4 |
| 500.0 | 1.1 | 3.0 | 2.3 | 0.5 | 0.9 | 1.9 | 2.0 | |
| 1000.0 | 4.1 | 0.5 | 0.9 | 0.8 | 1.6 | 3.1 | 6.3 | |
| Accuracy of the analytical method (Recovery, %) | ||||||||
| Spiking level (pg/mL) | ||||||||
| 50.0 | 127.3 | 120.4 | 110.6 | 100.0 | 105.0 | 110.6 | 118.2 | 126.2 98.2 102.7 20 50 |
| 500.0 | 94.8 | 96.2 | 98.0 | 100.1 | 99.1 | 98.1 | 96.6 | |
| 1000.0 | 101.2 | 100.9 | 100.5 | 100.0 | 100.3 | 100.5 | 100.8 | |
| LOD (pg/mL) | 20 | 20 | 20 | 20 | 20 | 20 | 20 | |
| LOQ (pg/mL) | 50 | 50 | 50 | 50 | 50 | 50 | 50 | |
| Sample No. | BPZ | BPF | BPA | BPAF | BPAP |
|---|---|---|---|---|---|
| 01 | 164.5 | - | - | - | - |
| 02-1 | + | - | - | - | - |
| 02-2 | 72.8 | - | - | - | - |
| 02-3 | 203.2 | - | - | - | - |
| 04-1 | 666.2 | - | - | - | - |
| 04-2 | 195.6 | - | - | - | - |
| 05 | + | - | - | - | - |
| 06 | 95.7 | - | - | - | - |
| 07 | 128.6 | - | - | - | - |
| 08-1 | 1131.5 | - | - | - | - |
| 08-2 | 486.6 | - | - | - | - |
| 09 | 49.7 | - | - | - | - |
| 10 | 49.7 | - | - | - | - |
| 11 | 192.2 | - | - | - | - |
| 12 | 335.1 | - | - | - | - |
| 13 | 85.8 | - | - | - | - |
| 14 | 733.9 | - | - | - | - |
| 15 | 115.3 | 1600.0 | - | 847.7 | - |
| 16 | 441.0 | - | 257.7 | - | 56.2 |
| 17 | 254.9 | - | - | - | - |
| 18 | 268.0 | - | - | - | - |
| 20 | 899.1 | - | 2143.5 | - | 612.2 |
| 21 | + | - | 915.1 | - | - |
| 22 | 220.2 | - | 694.4 | - | - |
| 26-1 | 340.1 | - | - | - | - |
| 26-2 | + | - | - | - | - |
| 28 | 57.2 | - | - | - | - |
| Sample Preparation | Analytes | Linearity | LOD | Colum Size | Sample Volume | Run Time (min) | Detector | Ref. & Year |
|---|---|---|---|---|---|---|---|---|
| On-line SPE poly (EDMA-GMA) monoliths | BPA | 1.0–160 (pg/mL) | 0.3 (pg/mL) | 50×4.6 mm | 100 mL | 16 | LC–ESI /MS/MS | [25] 2008 |
| On-line column-switching SPE (Polyamide 6 nanofiber) | BPA | 2–500 (ng/mL) | 0.6 (ng/mL) | 5 × 4.6 mm | 50 µL | 5 | FD 225/320 nm | [20] 2018 |
| On-line SPE (Hypersil Gold aQ C18) | BPA | 0.80–2.8 (pg/mL) | 0.5 (pg/mL) | 20 × 2 mm | 10 mL | 15.5 | UHPLC–MS/MS | [19] 2019 |
| SIA On-line SPE (SDB-RPS) | BPA 4tBP | 5–80 (ng/mL) | 0.77 (ng/mL) 1.46 (ng/mL) | 10 × 10 mm | 15 mL | 82 8 | HPLC–UV 225 nm | [18] 2020 |
| On-line SPE (C18) | BPA BPB BPC BPP BPZ BHPF BPAF BPAP TMBPA | 0.4–80.0 (pg/mL) (BPA, BPB) | 0.13 (pg/mL) (BPA, BPB) | 150 × 4.6 mm | 5 mL | 30 | LC–FD 228/306 nm 230/319 nm | [17] 2021 |
| 0.2–80.0 (ng/mL) (BPHF) | 66.7 (pg/mL) (BPHF) | |||||||
| 4.0–800.0 (pg/mL) (BPAP, TMBPA) | 1.33 (pg/mL) (BPAP, TMBPA) | |||||||
| 10.0–800.0 (pg/mL) (BPAF, BPC, BPP) | 0.67 (pg/mL) (BPZ) | |||||||
| 2.0–800.0 (pg/mL) (BPZ) | 3.33 (pg/mL) others | |||||||
| On-line SPE (polyamide 6 nanofibrous) | BPA BPS BTP FXC | 0.1–50 (μg/mL) | 30 ng/mL | 5 × 4.6 mm | 50 µL | 5 | UHPLC–UV 230 nm | [26] 2022 |
| 0.1–50 (μg/mL) | 30 ng/mL | |||||||
| 0.2–50 (μg/mL) | 60 ng/mL | |||||||
| 0.1–50 (μg/mL) | 30 ng/mL | |||||||
| On-line PFSPE (PS/PDB18C6 composite nanofibers) | BPA BPB BPC BPE BPF BPZ BPAF BPAP | 50–1000 (pg/mL) | 20 (pg/mL) | 10 × 4.6 mm | 2 mL | 10 | LC–FD 228/306 nm | This work |
Publisher’s Note: MDPI stays neutral with regard to jurisdictional claims in published maps and institutional affiliations. |
© 2022 by the authors. Licensee MDPI, Basel, Switzerland. This article is an open access article distributed under the terms and conditions of the Creative Commons Attribution (CC BY) license (https://creativecommons.org/licenses/by/4.0/).
Share and Cite
Xu, T.; Zhang, R.; Bi, Y.; Li, J.; Li, X.; Chen, L.; Fang, Z. Electrospun Polycrown Ether Composite Nanofibers as an Adsorbent for On-Line Solid Phase Extraction of Eight Bisphenols from Drinking Water Samples with Column-Switching Prior to High Performance Liquid Chromatography. Polymers 2022, 14, 4765. https://doi.org/10.3390/polym14214765
Xu T, Zhang R, Bi Y, Li J, Li X, Chen L, Fang Z. Electrospun Polycrown Ether Composite Nanofibers as an Adsorbent for On-Line Solid Phase Extraction of Eight Bisphenols from Drinking Water Samples with Column-Switching Prior to High Performance Liquid Chromatography. Polymers. 2022; 14(21):4765. https://doi.org/10.3390/polym14214765
Chicago/Turabian StyleXu, Tong, Rui Zhang, Yueling Bi, Jingjing Li, Xiaohuan Li, Liqin Chen, and Zhongze Fang. 2022. "Electrospun Polycrown Ether Composite Nanofibers as an Adsorbent for On-Line Solid Phase Extraction of Eight Bisphenols from Drinking Water Samples with Column-Switching Prior to High Performance Liquid Chromatography" Polymers 14, no. 21: 4765. https://doi.org/10.3390/polym14214765
APA StyleXu, T., Zhang, R., Bi, Y., Li, J., Li, X., Chen, L., & Fang, Z. (2022). Electrospun Polycrown Ether Composite Nanofibers as an Adsorbent for On-Line Solid Phase Extraction of Eight Bisphenols from Drinking Water Samples with Column-Switching Prior to High Performance Liquid Chromatography. Polymers, 14(21), 4765. https://doi.org/10.3390/polym14214765