
Influence of Different Activators on the Structure and Properties of Activated Carbon Based on Bamboo Fiber

Abstract
:
1. Introduction
2. Experimental
2.1. Materials and Instruments
2.2. Activated Carbon Preparation
2.3. Characterization
2.4. Electrochemical Performance Test
2.5. Adsorption Performance Test
3. Results and Discussion
3.1. Specific Surface Area and Pore Size Distribution Analysis
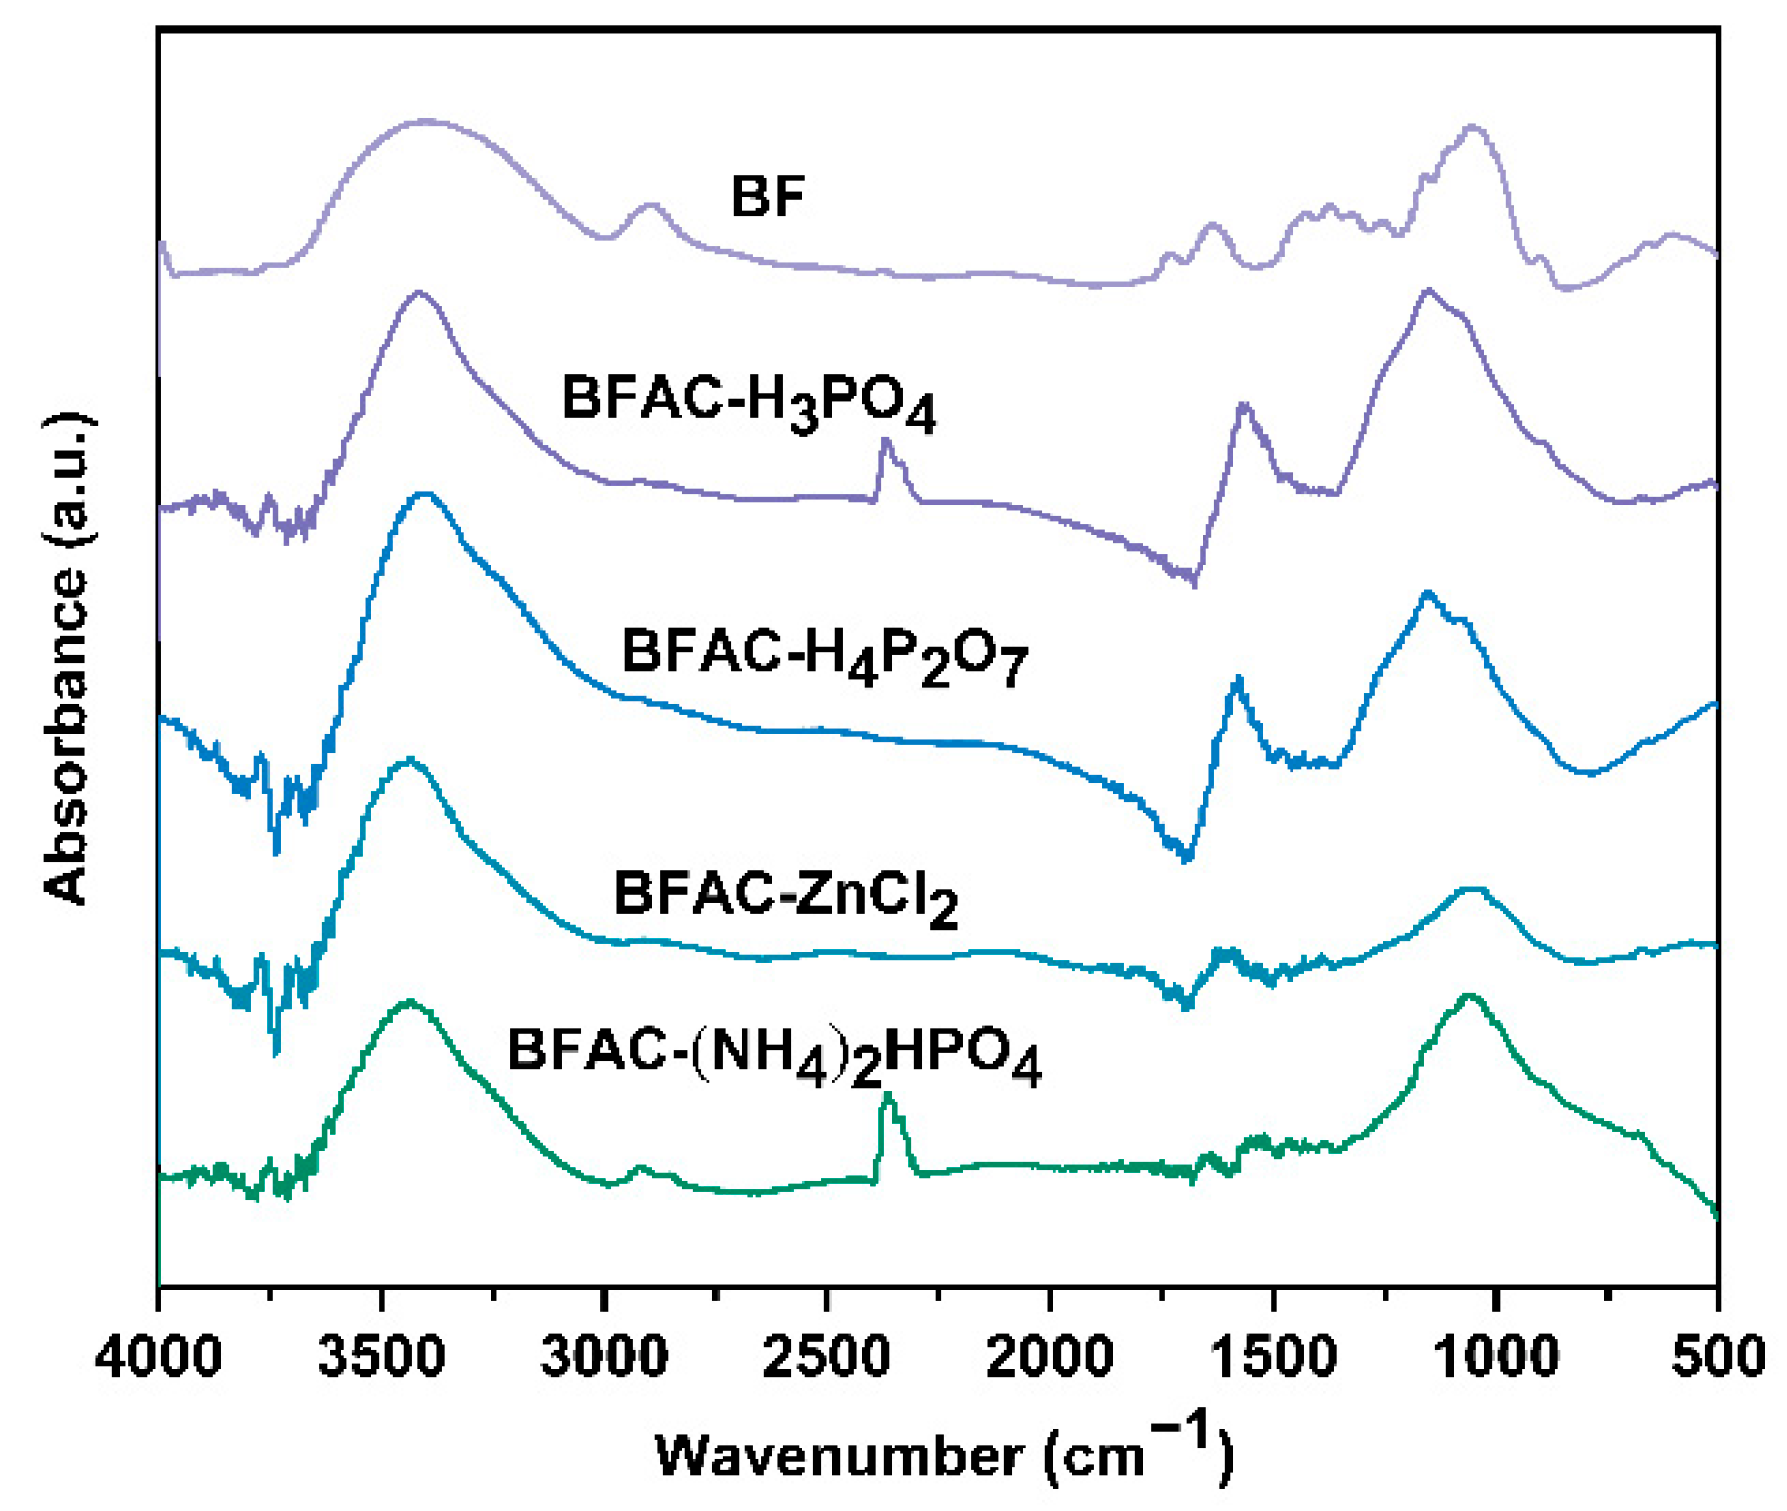
3.2. FT-IR Analysis
3.3. X-ray Diffraction Analysis
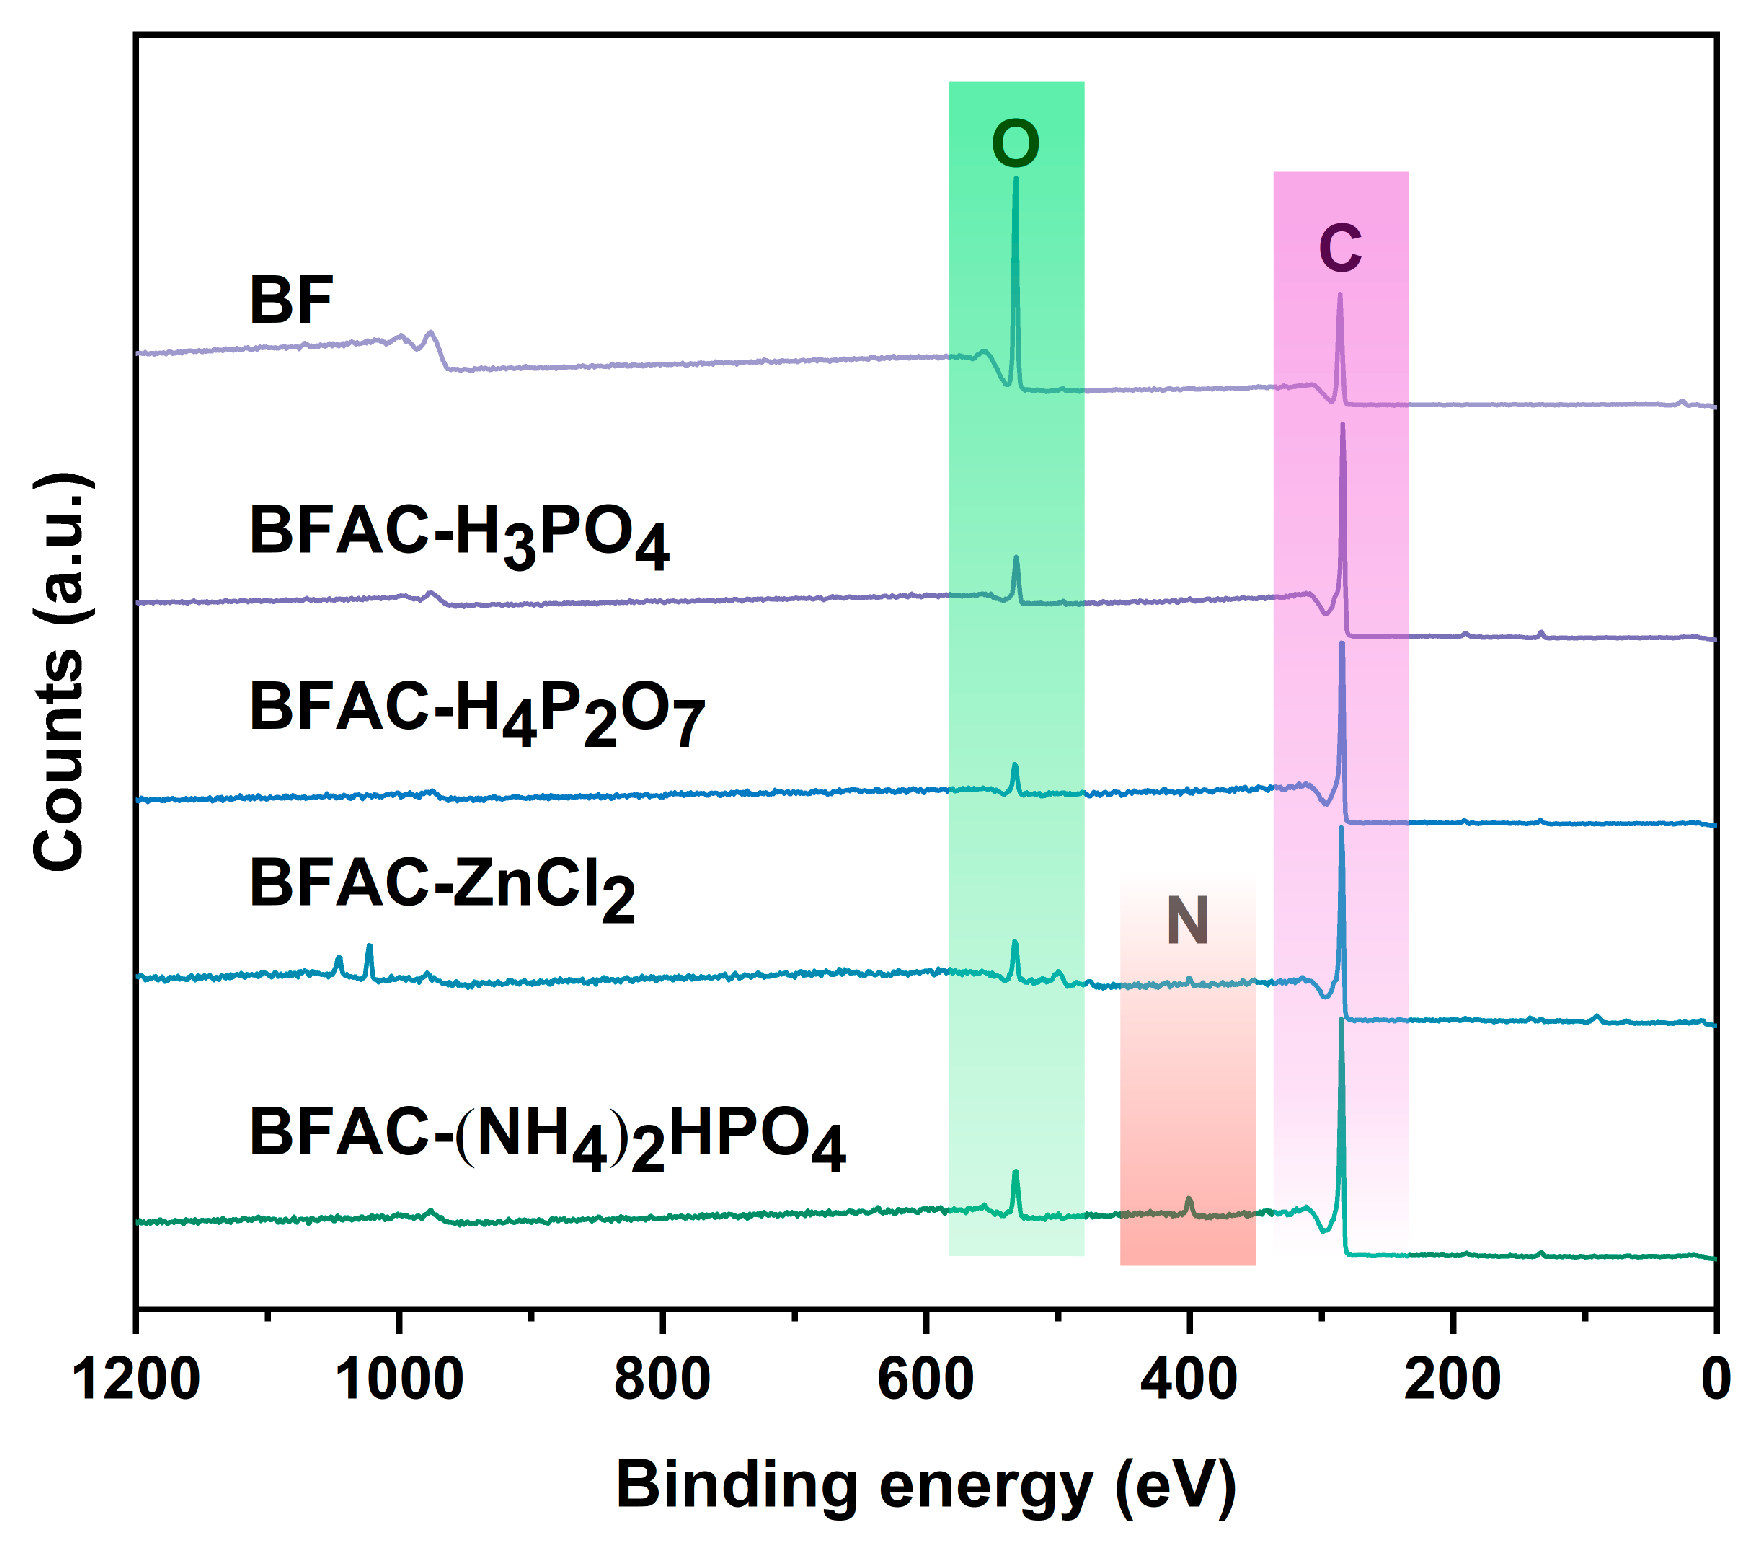
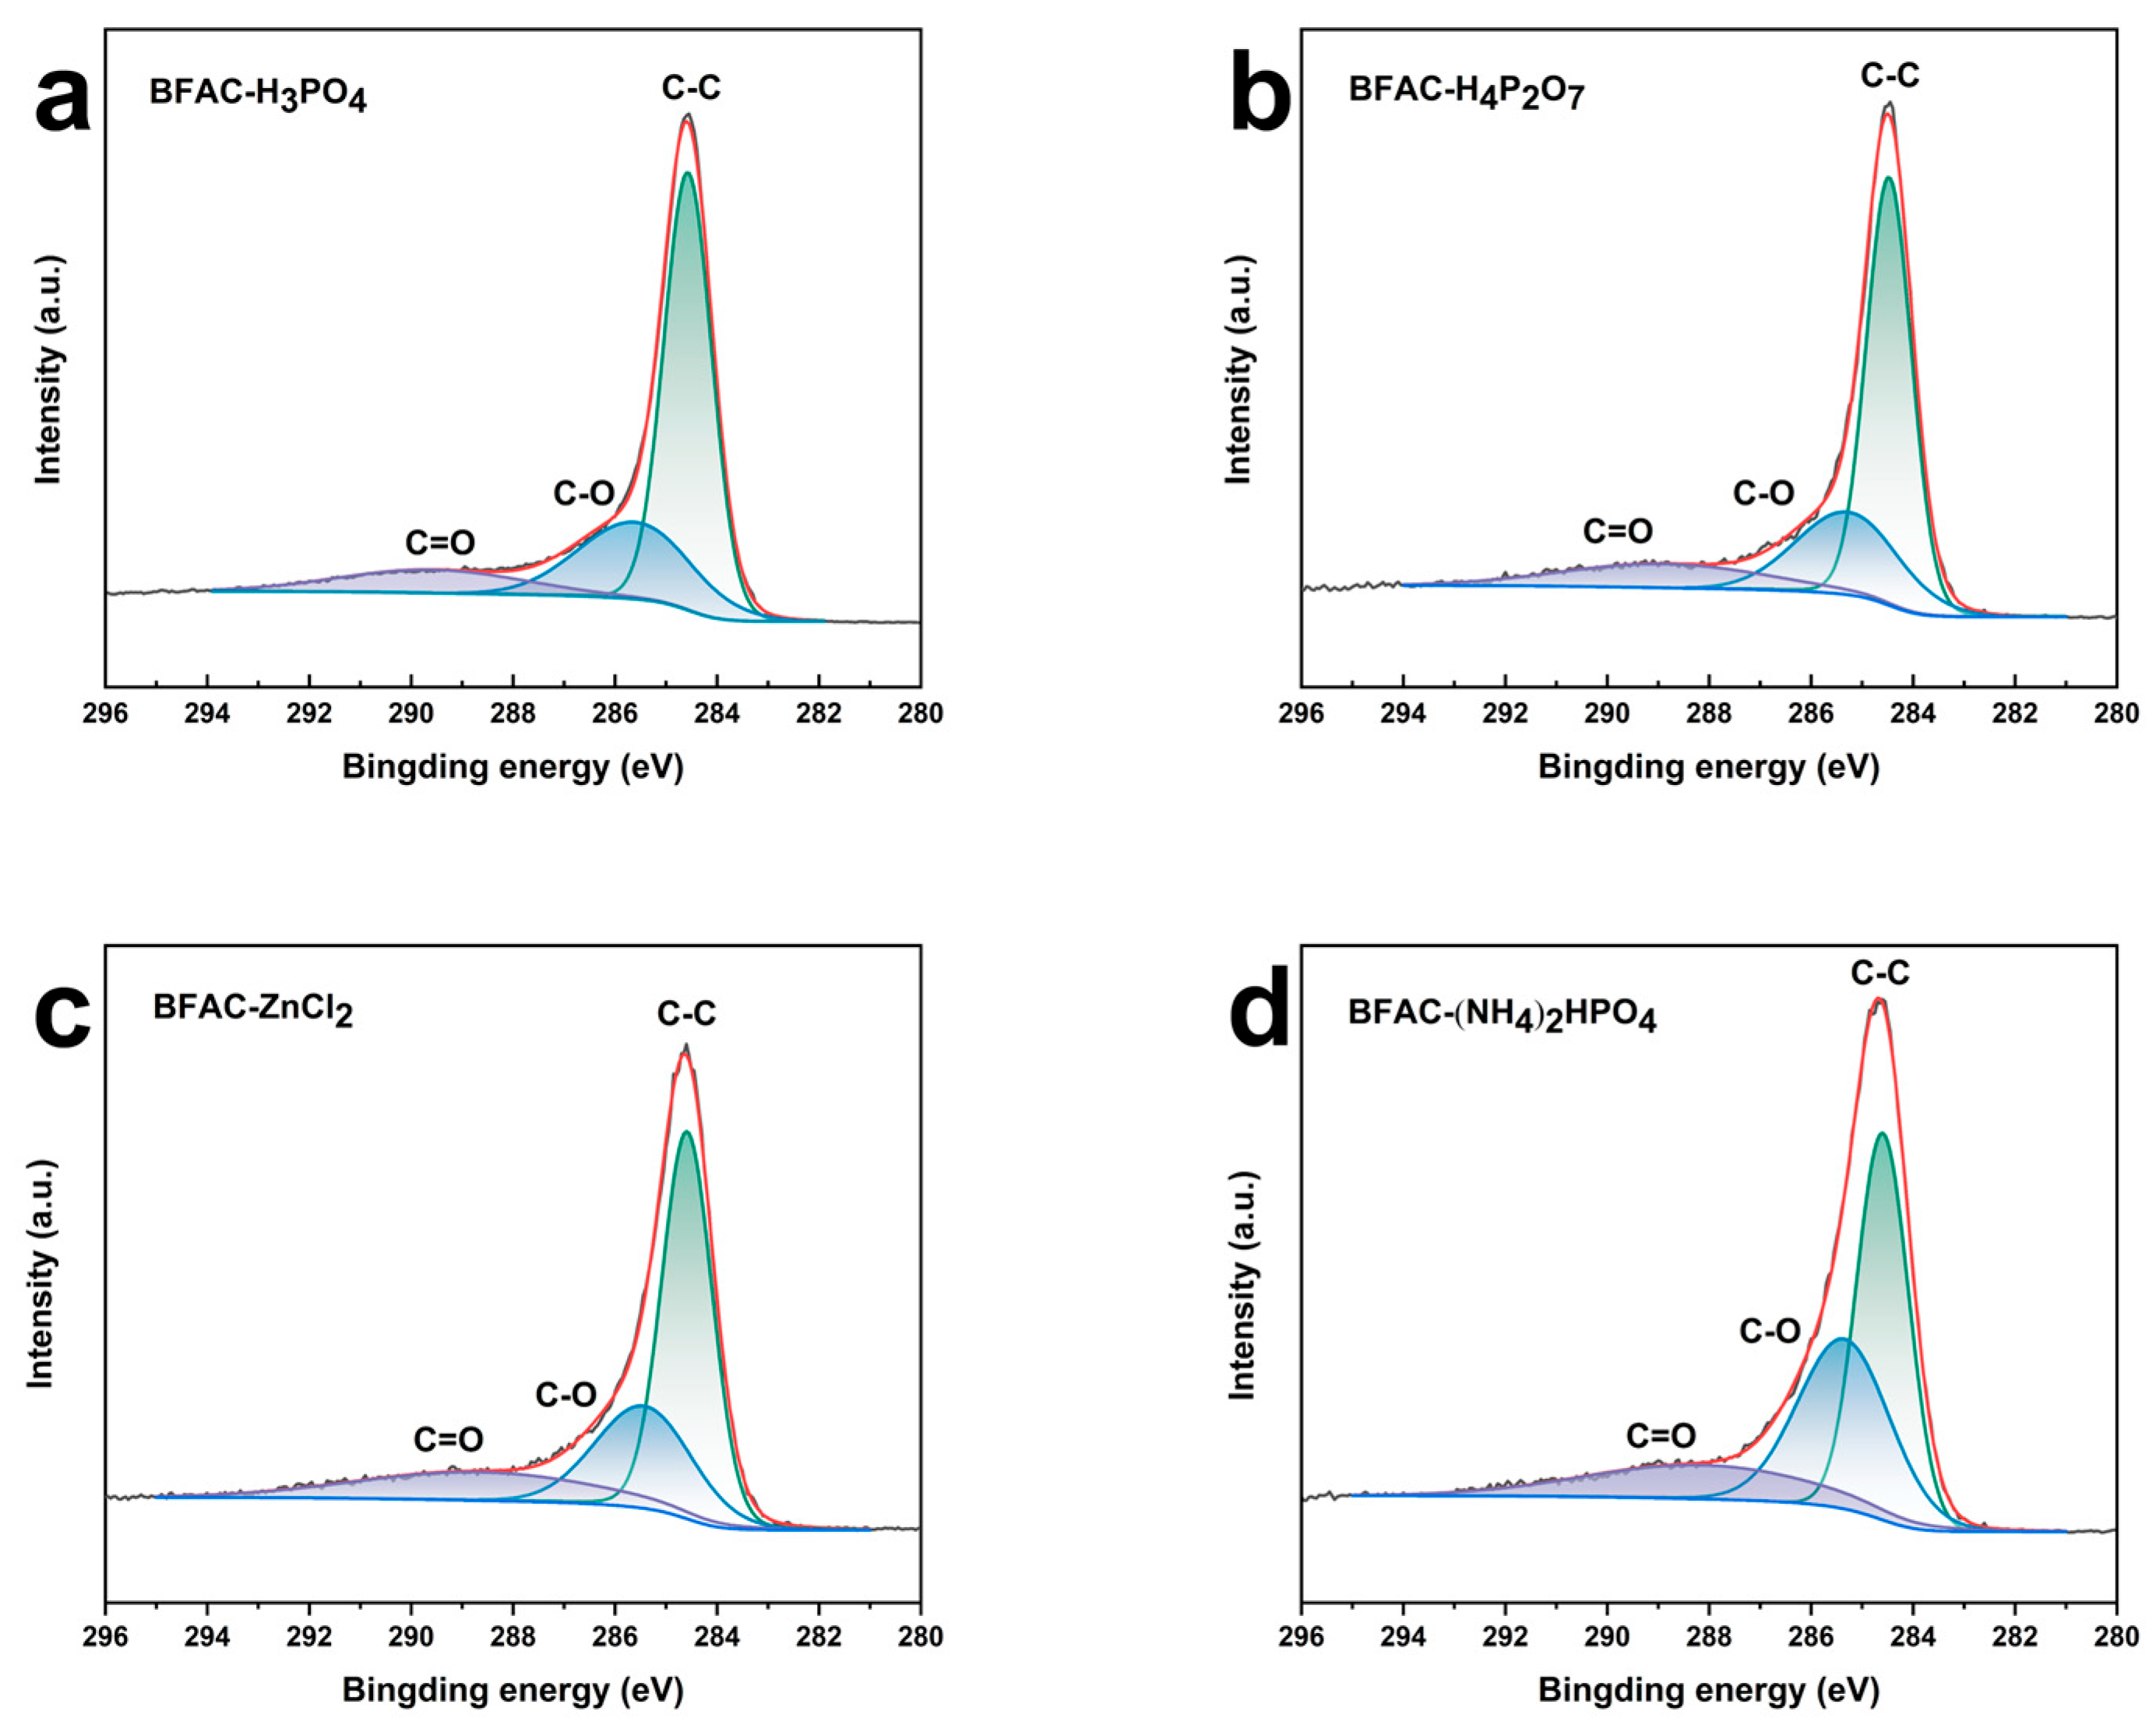
3.4. XPS Analysis
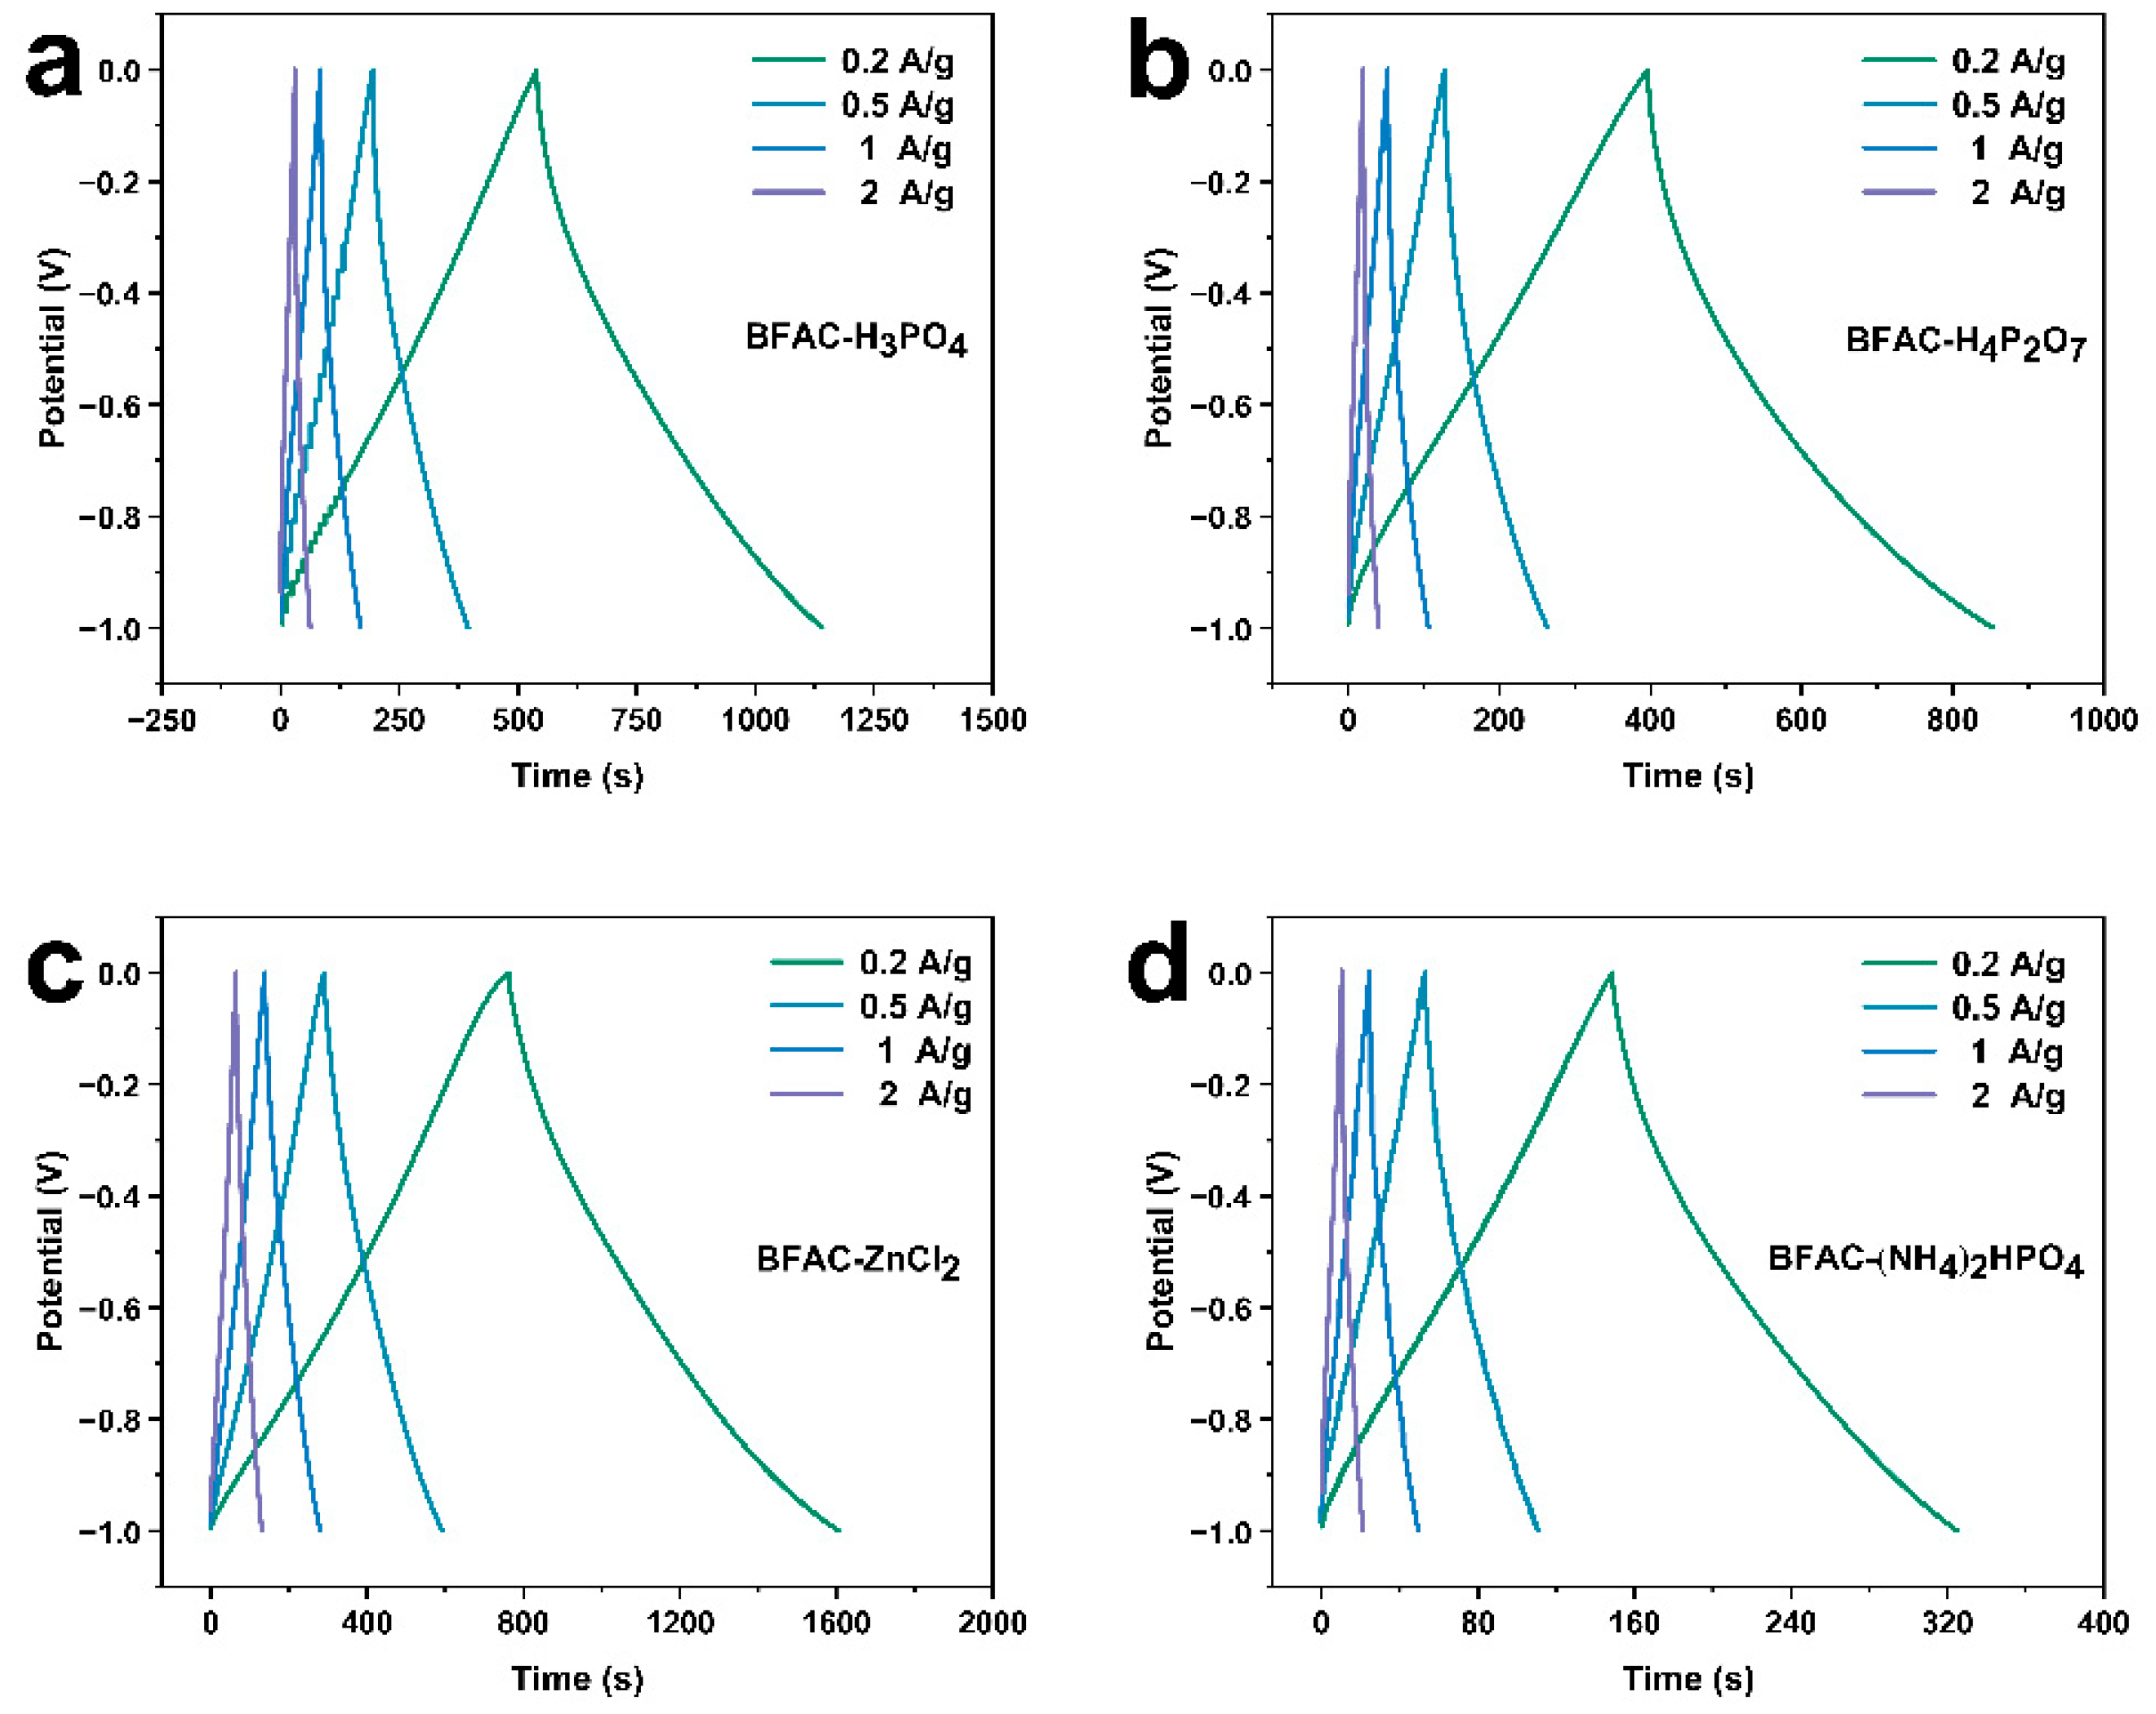
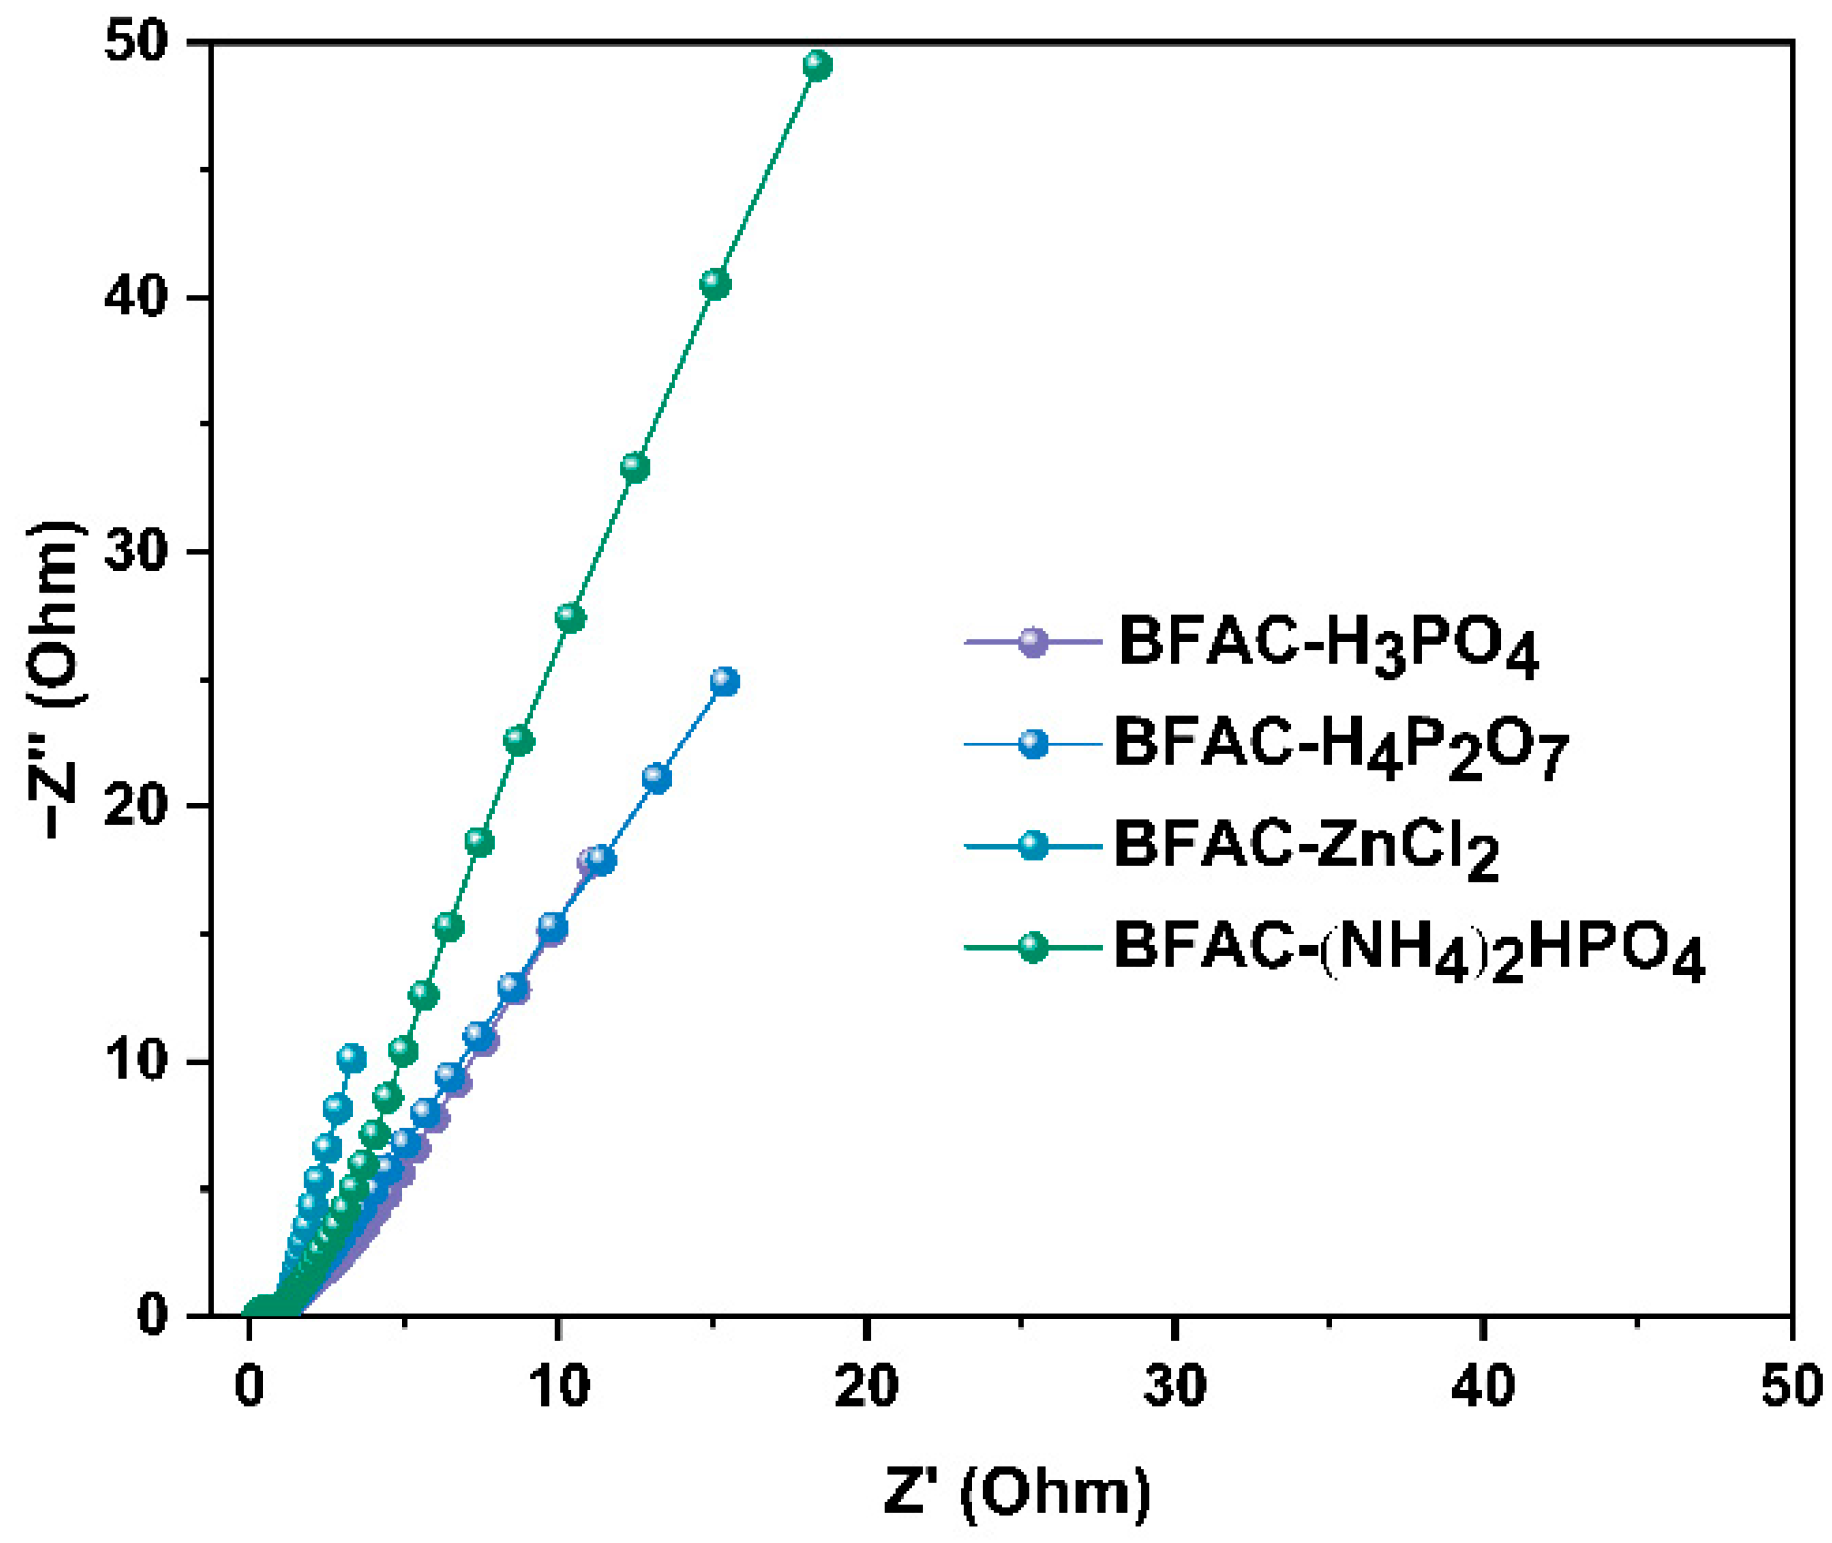
3.5. Electrochemical Performance Analysis
3.6. Adsorption Performance Analysis
4. Conclusions
Supplementary Materials
Author Contributions
Funding
Institutional Review Board Statement
Informed Consent Statement
Data Availability Statement
Conflicts of Interest
References
- Crini, G.; Lichtfouse, E.; Wilson, L.D.; Morin-Crini, N. Conventional and non-conventional adsorbents for wastewater treatment. Environ. Chem. Lett. 2019, 17, 195–213. [Google Scholar] [CrossRef]
- Karaman, C.; Karaman, O.; Atar, N.; Yola, M.L. Sustainable electrode material for high-energy supercapacitor: Biomass-derived graphene-like porous carbon with three-dimensional hierarchically ordered ion highways. Phys. Chem. Chem. Phys. 2021, 23, 12807–12821. [Google Scholar] [CrossRef] [PubMed]
- Huang, H.J.; Li, S.J.; Shang, L.L.; Ma, J.B. Study on adsorption of formaldehyde on bamboo activated carbon modified by low concentration acid and alkali. Mater. Guide 2021, 35, 24041–24046. [Google Scholar]
- Danish, M.; Ahmad, T. A review on utilization of wood biomass as a sustainable precursor for activated carbon production and application. Renew. Sustain. Energy Rev. 2018, 87, 1–21. [Google Scholar] [CrossRef]
- Li, G.Q.; Tian, F.H.; Zhang, Y.F.; Ding, J.L.; Fu, Y.L.; Wang, Y.; Zhang, G.J. Surface characteristics of aminated bamboo/lignite activated carbon and its so2 removal performance. New Carbon Mater. 2014, 29, 486–492. [Google Scholar]
- Jain, A.; Balasubramanian, R.; Srinivasan, M.P. Hydrothermal conversion of biomass waste to activated carbon with high porosity: A review. Chem. Eng. J. 2016, 283, 789–805. [Google Scholar] [CrossRef]
- Maneerung, T.; Liew, J.; Dai, Y.; Kawi, S.; Chong, C.; Wang, C. Activated carbon derived from carbon residue from biomass gasification and its application for dye adsorption: Kinetics, isotherms and thermodynamic studies. Bioresour. Technol. 2016, 200, 350–359. [Google Scholar] [CrossRef]
- He, T.; Xu, Z.F.; Shi, H. Preparation and research and application progress of fiber activated carbon. Shanghai Chem. 2006, 31, 22–26. [Google Scholar]
- Lin, Q.; Gao, R.; Li, D.; Lu, Y.; Liu, S.; Yu, Y.; Huang, Y.; Yu, W. Bamboo-inspired cell-scale assembly for energy device applications. Npj Flex. Electron. 2022, 6, 13. [Google Scholar] [CrossRef]
- Tran, T.H.; Le, H.H.; Pham, T.H.; Nguyen, D.T.; La, D.D.; Chang, S.W.; Lee, S.M.; Chung, W.J.; Nguyen, D.D. Comparative study on methylene blue adsorption behavior of coffee husk-derived activated carbon materials prepared using hydrothermal and soaking methods. J. Environ. Chem. Eng. 2021, 9, 105362. [Google Scholar] [CrossRef]
- Chaparro-Garnica, J.; Salinas-Torres, D.; Mostazo-López, M.J.; Morallón, E.; Cazorla-Amorós, D. Biomass waste conversion into low-cost carbon-based materials for supercapacitors: A sustainable approach for the energy scenario. J. Electroanal. Chem. 2021, 880, 114899. [Google Scholar] [CrossRef]
- Mohammad, M.; Yakub, I.; Yaakob, Z.; Asim, N.; Sopian, K. Adsorption isotherm of chromium (vi) into ZnCl2 impregnated activated carbon derived by jatropha curcas seed hull. IOP Conf. Series. Mater. Sci. Eng. 2017, 293, 012013. [Google Scholar] [CrossRef] [Green Version]
- Hekmatshoar, R.; Khoramnejadian, S.; Allahabadi, A.; Saghi, M.H. Synthesis and characterization of an NH4Cl-induced eskanbil activated carbon (eac) for the removal of penicillin g from contaminated water. J. Environ. Health Sci. Eng. 2020, 18, 483–493. [Google Scholar] [CrossRef] [PubMed]
- Ding, Y.; Pang, Z.; Lan, K.; Yao, Y.; Panzarasa, G.; Xu, L.; Lo Ricco, M.; Rammer, D.R.; Zhu, J.Y.; Hu, M.; et al. Emerging engineered wood for building applications. Chem. Rev. 2022. [Google Scholar] [CrossRef] [PubMed]
- Fu, K.; Yue, Q.; Gao, B.; Sun, Y.; Zhu, L. Preparation, characterization and application of lignin-based activated carbon from black liquor lignin by steam activation. Chem. Eng. J. 2013, 228, 1074–1082. [Google Scholar] [CrossRef]
- Lin, G.F. Research and mechanism of the preparation process and mechanism of the self-forming wooden granules of the phosphate (Abstract). Biomass Chem. Eng. 2014, 48, 55. [Google Scholar]
- Luo, H.; Jiang, X.Y.; Li, X.Z.; Hu, X. The research progress of bamboo charcoal for bamboo carbon processing of bamboo materials. Environ. Sci. Manag. 2008, 33, 156–160. [Google Scholar]
- Syafiqah, I.I.; Adilla, R.N.; Suzana, Y. Production and characterization of bamboo-based activated carbon through single-step H3PO4 activation for CO2 capture. Environ. Sci. Pollut. Res. Int. 2021, 29, 12434–12440. [Google Scholar]
- Krittamet, P.; Chaiyot, T.; Panuwat, L. The analysis of pore development and formation of surface functional groups in bamboo-based activated carbon during CO2 activation. Molecules 2021, 26, 5641. [Google Scholar]
- Lin, Y.Z.; Qian, Q.R.; Huang, B.S.; Gong, B.L.; Chen, Q.H. The preparation of tung shell base carbon and its adsorption performance on organic matter. For. Chem. Ind. 2007, 27, 55–60. [Google Scholar]
- Belhamdi, B.; Merzougui, Z.; Laksaci, H.; Trari, M. The removal and adsorption mechanisms of free amino acid l-tryptophan from aqueous solution by biomass-based activated carbon by H3PO4 activation: Regeneration study. Phys. Chem. Earth 2019, 114, 102791. [Google Scholar] [CrossRef]
- Barth, A. Infrared spectroscopy of proteins. Biochim. Et Biophys. Acta (BBA) Bioenerg. 2007, 1767, 1073–1101. [Google Scholar] [CrossRef] [PubMed] [Green Version]
- Guo, Y.; Tan, C.; Sun, J.; Li, W.; Zhang, J.; Zhao, C. Porous activated carbons derived from waste sugarcane bagasse for CO2 adsorption. Chem. Eng. J. 2020, 381, 122736. [Google Scholar] [CrossRef]
- Kılıç, M.; Apaydın-Varol, E.; Pütün, A.E. Preparation and surface characterization of activated carbons from euphorbia rigida by chemical activation with ZnCl2, K2CO3, NaOH and H3PO4. Appl. Surf. Sci. 2012, 261, 247–254. [Google Scholar] [CrossRef]
- Karadirek, Ş.; Okkay, H. Statistical modeling of activated carbon production from spent mushroom compost. J. Ind. Eng. Chem. 2018, 63, 340–347. [Google Scholar] [CrossRef]
- Rasheed, M.; Jawaid, M.; Parveez, B.; Zuriyati, A.; Khan, A. Morphological, chemical and thermal analysis of cellulose nanocrystals extracted from bamboo fiber. Int. J. Biol. Macromol. 2020, 160, 183–191. [Google Scholar] [CrossRef]
- Abdulhameed, A.S.; Firdaus Hum, N.N.M.; Rangabhashiyam, S.; Jawad, A.H.; Wilson, L.D.; Yaseen, Z.M.; Al-Kahtani, A.A.; Alothman, Z.A. Statistical modeling and mechanistic pathway for methylene blue dye removal by high surface area and mesoporous grass-based activated carbon using K2CO3 activator. J. Environ. Chem. Eng. 2021, 9, 105530. [Google Scholar] [CrossRef]
- Somsesta, N.; Sricharoenchaikul, V.; Aht-Ong, D. Adsorption removal of methylene blue onto activated carbon/cellulose biocomposite films: Equilibrium and kinetic studies. Mater. Chem. Phys. 2020, 240, 122221. [Google Scholar] [CrossRef]
- Yumak, T.; Yakaboylu, G.A.; Oginni, O.; Singh, K.; Ciftyurek, E.; Sabolsky, E.M. Comparison of the electrochemical properties of engineered switchgrass biomass-derived activated carbon-based edlcs. Colloids Surf. A Physicochem. Eng. Asp. 2020, 586, 124150. [Google Scholar] [CrossRef]
- Li, H.; Zhang, Y.; Guo, J.; Lv, J.; Huan, W.; Li, B. Preparation of hydrochar with high adsorption performance for methylene blue by co-hydrothermal carbonization of polyvinyl chloride and bamboo. Bioresour. Technol. 2021, 337, 125442. [Google Scholar] [CrossRef]
- Shah, S.S.; Cevik, E.; Aziz, M.A.; Qahtan, T.F.; Bozkurt, A.; Yamani, Z.H. Jute sticks derived and commercially available activated carbons for symmetric supercapacitors with bio-electrolyte: A comparative study. Synth. Met. 2021, 277, 116765. [Google Scholar] [CrossRef]
- Zhang, Y.; Jiang, H.; Wang, Q.; Meng, C. In-situ hydrothermal growth of Zn4Si2O7(OH)2·H2O anchored on 3D N, S-enriched carbon derived from plant biomass for flexible solid-state asymmetrical supercapacitors. Chem. Eng. J. 2018, 352, 519–529. [Google Scholar] [CrossRef]
- Yakaboylu, G.A.; Jiang, C.; Yumak, T.; Zondlo, J.W.; Wang, J.; Sabolsky, E.M. Engineered hierarchical porous carbons for supercapacitor applications through chemical pretreatment and activation of biomass precursors. Renew. Energ. 2021, 163, 276–287. [Google Scholar] [CrossRef]
- Sun, Z.; Zheng, M.; Hu, H.; Dong, H.; Liang, Y.; Xiao, Y.; Lei, B.; Liu, Y. From biomass wastes to vertically aligned graphene nanosheet arrays: A catalyst-free synthetic strategy towards high-quality graphene for electrochemical energy storage. Chem. Eng. J. 2018, 336, 550–561. [Google Scholar] [CrossRef]
- Yu, M.; Han, Y.; Li, J.; Wang, L. CO2 -activated porous carbon derived from cattail biomass for removal of malachite green dye and application as supercapacitors. Chem. Eng. J. 2017, 317, 493–502. [Google Scholar] [CrossRef]
- Khalafallah, D.; Quan, X.; Ouyang, C.; Zhi, M.; Hong, Z. Heteroatoms doped porous carbon derived from waste potato peel for supercapacitors. Renew. Energ. 2021, 170, 60–71. [Google Scholar] [CrossRef]


| Sample | SBET (m2/g) | Smic (m2/g) | Smes (m2/g) | Vtot (cm3/g) | Micro- Porosity (%) | Meso- Porosity (%) | Average Pore Size (nm) |
|---|---|---|---|---|---|---|---|
| BFAC-H3PO4 | 1318.06 | 240.77 | 900.50 | 1.92 | 5.12 | 85.94 | 7.32 |
| BFAC-H4P2O7 | 1264.14 | 207.89 | 876.58 | 2.17 | 3.91 | 76.34 | 7.57 |
| BFAC-ZnCl2 | 1908.51 | 1092.21 | 761.39 | 1.05 | 44.99 | 48.61 | 2.20 |
| BFAC- (NH4)2HPO4 | 641.59 | 613.34 | 22.29 | 0.32 | 92.95 | 5.47 | 2.00 |
| Sample | 2θ002 (°) | 2θ100 (°) | d002 (nm) | Lc (nm) | La (nm) | Lc/d002 |
|---|---|---|---|---|---|---|
| BFAC-H3PO4 | 23.0 | 43.2 | 0.386 | 0.685 | 3.175 | 1.773451 |
| BFAC-H4P2O7 | 22.5 | 43.3 | 0.395 | 0.793 | 3.425 | 2.008551 |
| BFAC-ZnCl2 | 23.0 | 43.4 | 0.372 | 0.764 | 3.013 | 2.055704 |
| BFAC-(NH4)2HPO4 | 24.3 | 43.5 | 0.366 | 0.883 | 3.121 | 2.412869 |
| Sample | Current Density (A/g) | Charging Time (s) | Discharge Time (s) | Specific Capacitance (F/g) |
|---|---|---|---|---|
| BFAC- H3PO4 | 0.2 | 534.20 | 600.67 | 121.2730 |
| 0.5 | 190.53 | 201.13 | 102.9170 | |
| 1 | 81.633 | 84.033 | 87.9411 | |
| 2 | 31.100 | 31.433 | 68.8513 | |
| BFAC- H4P2O7 | 0.2 | 396.73 | 456.47 | 92.2130 |
| 0.5 | 127.77 | 136.07 | 69.6466 | |
| 1 | 52.300 | 54.167 | 56.6848 | |
| 2 | 19.967 | 20.167 | 44.0601 | |
| BFAC- ZnCl2 | 0.2 | 760.70 | 844.93 | 169.7910 |
| 0.5 | 290.70 | 302.17 | 152.8050 | |
| 1 | 138.67 | 141.37 | 144.4940 | |
| 2 | 65.133 | 65.733 | 137.2640 | |
| BFAC- (NH4)2HPO4 | 0.2 | 148.80 | 176.2 | 35.6055 |
| 0.5 | 54.167 | 57.833 | 29.6374 | |
| 1 | 24.200 | 24.933 | 26.1562 | |
| 2 | 10.567 | 10.567 | 23.1743 |
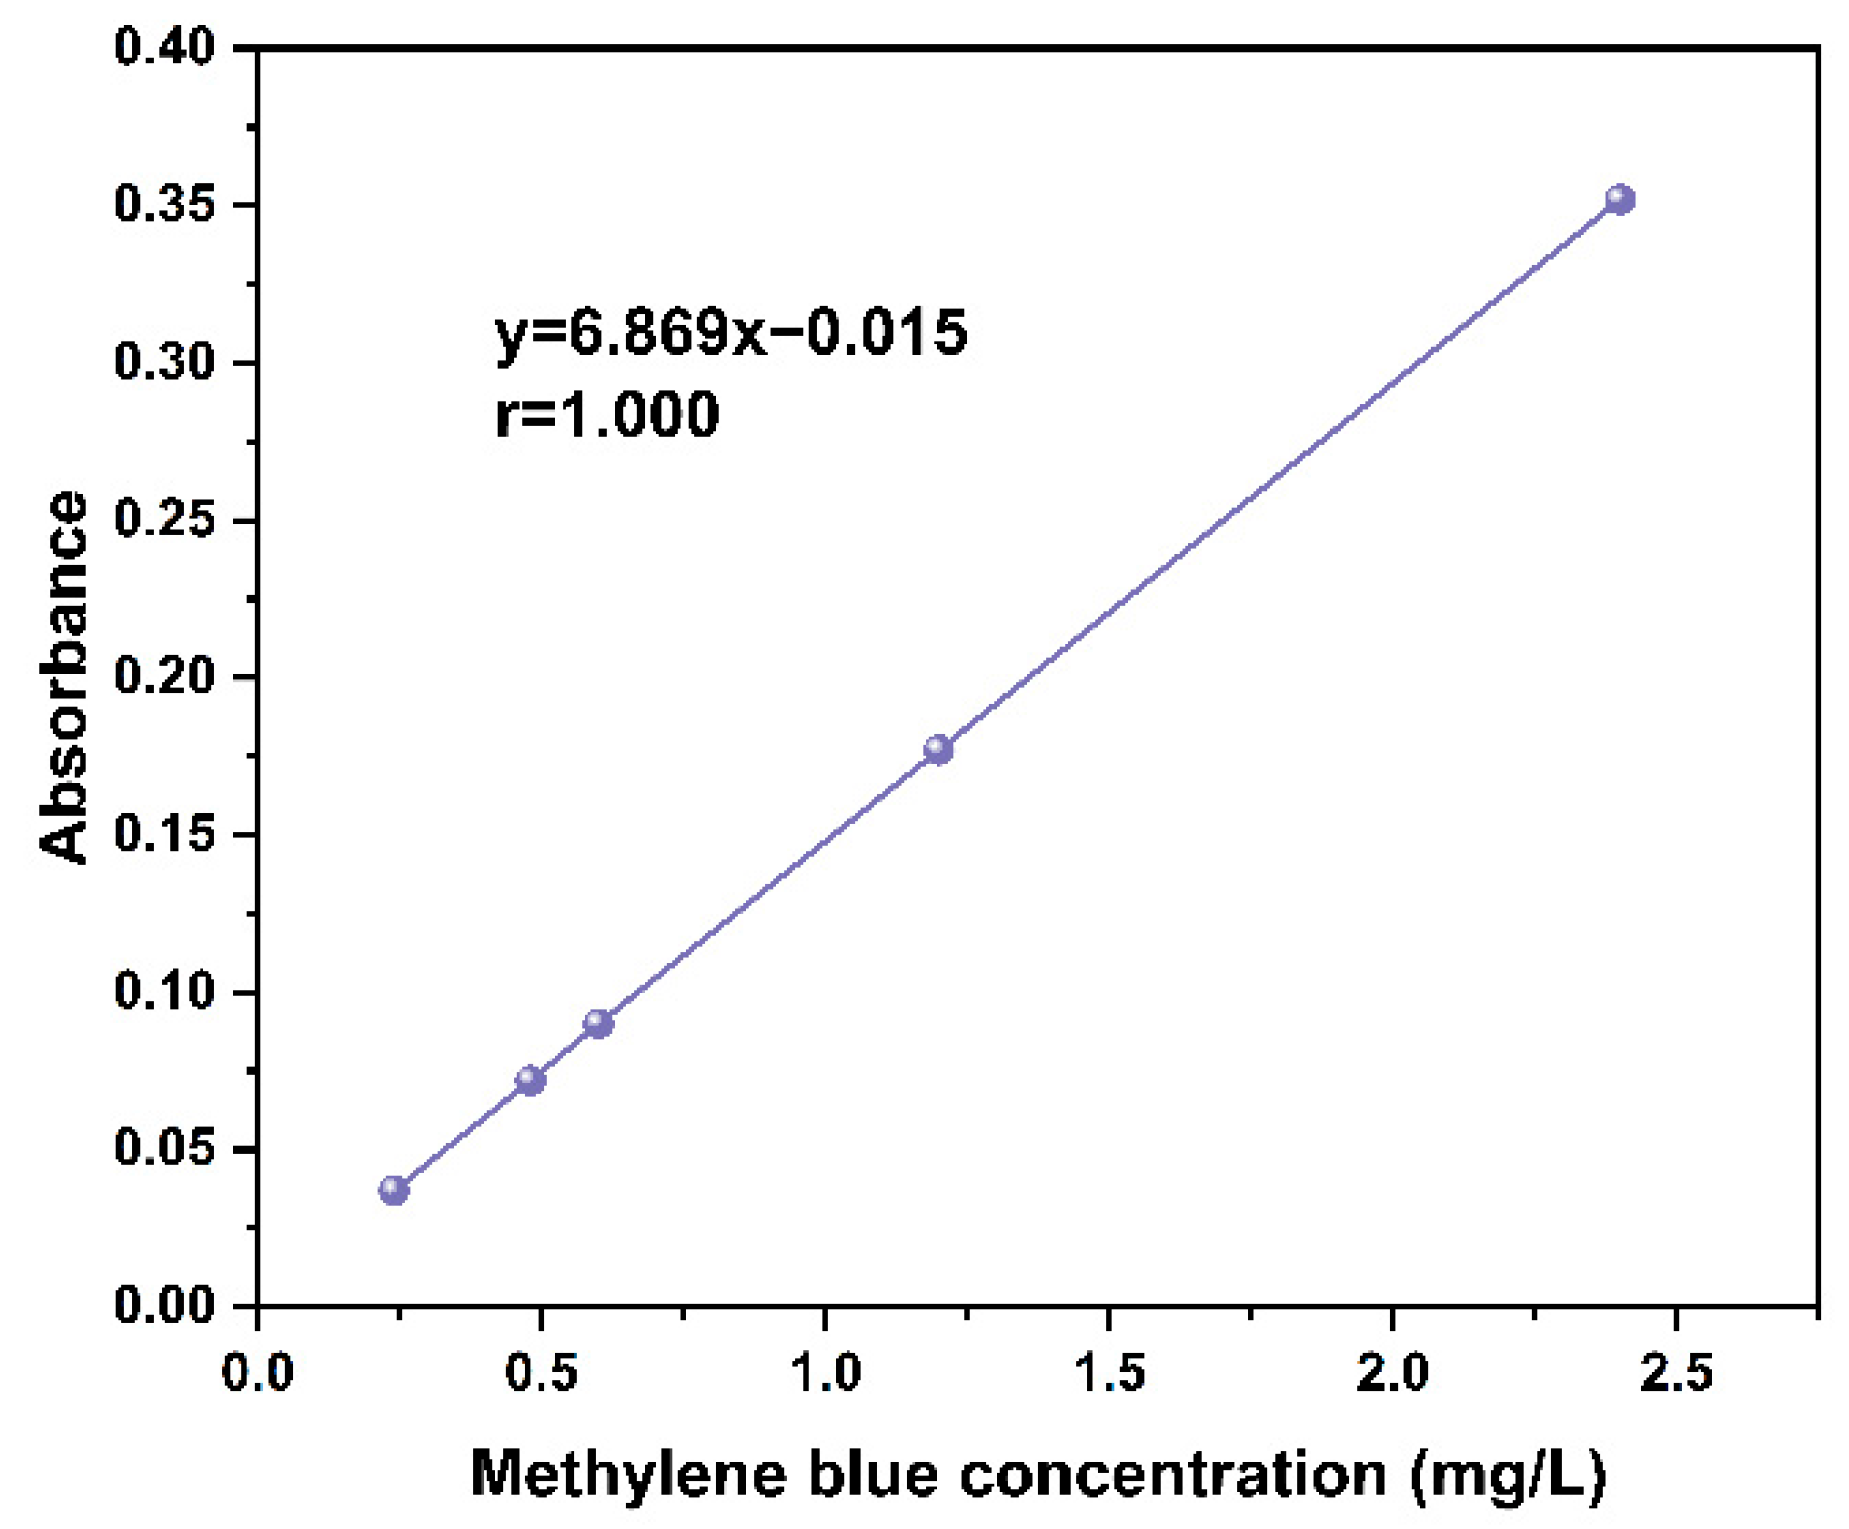
| Sample | MB Initial Concentration (mg/L) | MB Termination Concentration (mg/L) | Adsorption Capacity (mg/g) | Termination Absorbance |
|---|---|---|---|---|
| BFAC- H3PO4 | 300 | 225.33 | 373.33 | 0.133 |
| BFAC- H4P2O7 | 300 | 190.25 | 548.75 | 0.113 |
| BFAC- ZnCl2 | 300 | 170.25 | 648.75 | 0.101 |
| BFAC- (NH4)2HPO4 | 300 | 256.25 | 218.75 | 0.151 |
Publisher’s Note: MDPI stays neutral with regard to jurisdictional claims in published maps and institutional affiliations. |
© 2022 by the authors. Licensee MDPI, Basel, Switzerland. This article is an open access article distributed under the terms and conditions of the Creative Commons Attribution (CC BY) license (https://creativecommons.org/licenses/by/4.0/).
Share and Cite
Lin, P.; Xia, Y.; Liu, Z. Influence of Different Activators on the Structure and Properties of Activated Carbon Based on Bamboo Fiber. Polymers 2022, 14, 5500. https://doi.org/10.3390/polym14245500
Lin P, Xia Y, Liu Z. Influence of Different Activators on the Structure and Properties of Activated Carbon Based on Bamboo Fiber. Polymers. 2022; 14(24):5500. https://doi.org/10.3390/polym14245500
Chicago/Turabian StyleLin, Peng, Yao Xia, and Zhigao Liu. 2022. "Influence of Different Activators on the Structure and Properties of Activated Carbon Based on Bamboo Fiber" Polymers 14, no. 24: 5500. https://doi.org/10.3390/polym14245500