3.1. In Situ Polymerization Process and Hydrogel Development
The hydrogels or polymer electrolytes reported in the literature are free-standing films that are placed on electrodes of low areal capacity and cycled. The polymerization process can be described as ex situ as it is a different step compared to the cell assembly. Commercialization of these cells is impractical and unfeasible. Another drawback is the low interfacial contact area between the porous electrodes and the gelled electrolyte, which leads to poor active material utilization and rate capability. Our motivation and primary aim were to develop a synthesis procedure that develops hydrogels that retain the properties of the ex situ films, such as good mechanical strength (to develop leakproof cells), good chemical and electrochemical stability for long cycles and ionic conductivity, and can be made into a continuous process for large-scale manufacturing. This entails the creation of an in situ polymerization process where the solution is first filled in the cell in its liquid state and then gelled over time. This allows increased and better contact area between the gelled electrolyte and porous electrodes. The synthesis procedure for the hydrogels is described in detail in the experimental section and schematically depicted in
Figure 1, where we have used a free-radical polymerization process.
The schematic process in
Figure 1 describes the important parameters that determine the polymerization rate of the free radical polymerization process. Temperature, monomer (acrylic acid), initiator (potassium persulfate) and electrolyte (KOH) concentration influence the polymerization process. First, we studied the impact of initiator volume fraction (initiator solution/total solution) and KOH concentration on gelation time, as shown in
Figure 3a. The results showed that reducing the initiator and KOH concentration significantly lowered the polymerization rate and resulted in longer gelation times, which is required for successful in situ polymerization. The lowered polymerization rates could be due to two factors: reduction of potassium acrylates after the neutralization step and reduction of persulfate radicals (S
2O
82−) which are needed for initiating the polymerization reactions. Potassium acrylates are the monomers after the initial neutralization step that polymerize to create a hydrogel with KOH. Reductions of KOH and initiator concentrations result in a slower monomer conversion rate process, which is essential for in situ polymerization. Another factor in the lowering of the polymerization rate is the temperature, where in the experiments, the solutions were chilled to 0 °C. The solutions were chilled because the neutralization reaction of acrylic acid and KOH is exothermic. This exothermic or self-heating predetermined the maximum monomer concentration that could be used in the experiment (acrylic acid could not exceed 25 wt.% of the total solution) as it could lead to violent and rapid self-accelerating polymerization reactions. Lowering the temperature also influenced the final physical structure of the gel, where gels synthesized at lower temperatures had a higher viscosity while the gels polymerized at room temperature had lower viscosity. Higher viscosities are needed for creating a leak-proof battery cell.
The effects of initiator and monomer concentrations on the polymerization rate were further studied by measuring the time to temperature rise and peak temperature obtained in the polymerization process. In these experiments, the potassium acrylate–KOH solutions synthesized after Step 3 were allowed to equilibrate at room temperature to study these parameter effects. For the effect of initiator concentration, polymerization rates were increased when the initiator amount was increased 10 times from its original value, as shown in
Figure 3b. The polymerization was instant for 25 and 36 wt.% KOH concentration, which showed that there were enough S
2O
82− radicals to propagate the reaction. However, at the original initiator amount (1x), the effect of KOH concentration had an impact on the time to initiate the polymerization and the polymerization rate. For 1x initiator amount, the time to initiate the polymerization process for 25 wt.% KOH was >4 times than that of the 36 wt.% KOH. The time to initiate the polymerization process can also be termed as “soaking time” for the solution before the polymerization process. The longer the soaking time or time to initiate polymerization, the better the infiltration of the prepolymer solution will be into the pores of the electrodes. The reduction in the polymerization rate, i.e., reduction in the temperature increase, is also good for in situ polymerization as the gelation would proceed over hours to form a viscous gel with well-developed branches of the polyacrylate chains that contain water and KOH. A higher portion of free water content in these hydrogels is important for hydroxyl diffusivity, which is important for high ionic conductivity and electrochemical mechanisms of both the MnO
2 and Zn electrodes. The reduction in polymerization rate was also seen when the monomer concentration was reduced from the controlled value of 2.22 M of acrylic acid to 1.31 M (initiator was kept at 1x and 36% KOH). These experiments showed that for obtaining longer soaking times during the in situ polymerization process and its eventual gelation, it is important to reduce the amount of initiator, reduce the monomer concentration and vary the KOH concentration to obtain the desired hydrogel. Rheology is also important when developing the right hydrogel, which will be discussed later in the manuscript.
Zn anodes corrode in alkaline electrolytes to release hydrogen (H
2) gas. Moreover, during the charging step, dissolved Zn ions (called zincate, Zn(OH)
42−) electrochemically plate to form metallic Zn (−1.35 V vs. Hg–HgO). However, hydrogen evolution reactions also take place as side reactions that reduce the Coulombic efficiency and increase the loss of active materials from the electrode. These would also happen in polymer hydrogel electrolytes unless additives are included in the solution before polymerization. We first studied the gassing rate of Zn powder in controlled liquid electrolytes of varying concentrations from 15 to 45 wt.%. The gassing rate increased linearly in the controlled electrolytes. To reduce the gassing or corrosion, studies in the past have reported the use of ZnO dissolved in the electrolyte. We tried the same strategy of dissolving various ZnO concentrations from 1 to 5 wt.%, which is its saturation amount, and measured the H
2 gassing rates, as shown in
Figure 3d. The trend was not clear in this case as lower KOH concentrations showed a considerable increase in gassing compared to the control. The reasons are still unclear but it could be attributed to low ZnO solubility in low KOH concentrations which would mean its effect is very minimal; however, it looks like it acts as a catalyst for hydrogen evolution. In higher KOH concentrations such as 36 wt.%, it is very clear that saturating the electrolyte with ZnO reduces the H
2 gassing compared to the control. As 5 wt.% ZnO is the saturation amount in 36 wt.% KOH, it prevents any further self-discharge or corrosion of metallic Zn powder.
We further measured the hydrogen generation of the Zn anodes embedded in the hydrogel electrolyte. We conducted these experiments under a microscope as we were unable to use our traditional gas measuring apparatus because of the gelled (viscous) nature of the electrolyte. These experiments were conducted under controlled temperature and pressure. Our initial observation with the controlled electrolytes containing no additives was that H
2 bubbles would form on the surface of the Zn anode in the gelled electrolyte and rise through the viscous electrolyte. Therefore, we measured H
2 bubbles per minute as a metric as this was easier to do with the naked eye and monitor it. We measured the bubble activity after 2 h of the first gelation step with Zn anodes embedded in it and after 2 days. The various additives tried in this experiment are shown in
Figure 3e. Teflon and carboxymethyl cellulose were tried because of their fibrous nature and Teflon’s hydrophobic nature that would allow H
2 gas to pass through the gel easily. However, these additives acted as a catalyst for H
2 generation, and the bubble generation rate was still unusually high after 2 days. We tried ZnO and indium hydroxide as other additives and found that these two additives individually succeeded in reducing the corrosion rate of the anodes even in gelled electrolyte. The reduction was considerable even for the controlled sample, as shown in
Figure 3e; therefore, we decided on including saturated ZnO and indium hydroxide as combined additives in the solution during the gelation process.
The physical robustness of these gels is important to create a leak-proof cell. Leak-proof cells or batteries are desired for transportation purposes as it reduces safety concerns. Department of Transportation classifies a “nonhazardous” cell or battery as one that is nonspillable or leak-proof, which means that on cell cracking there should not be any flow of electrolyte. Liquid electrolyte cells fail this test. Gelled electrolytes can pass these tests as they are “robust” in nature or viscous enough that they do not flow. Crosslinkers are used in polymerization synthesis to increase the strength of polymers. MBA is a crosslinker used in free radical polymerization synthesis [
28,
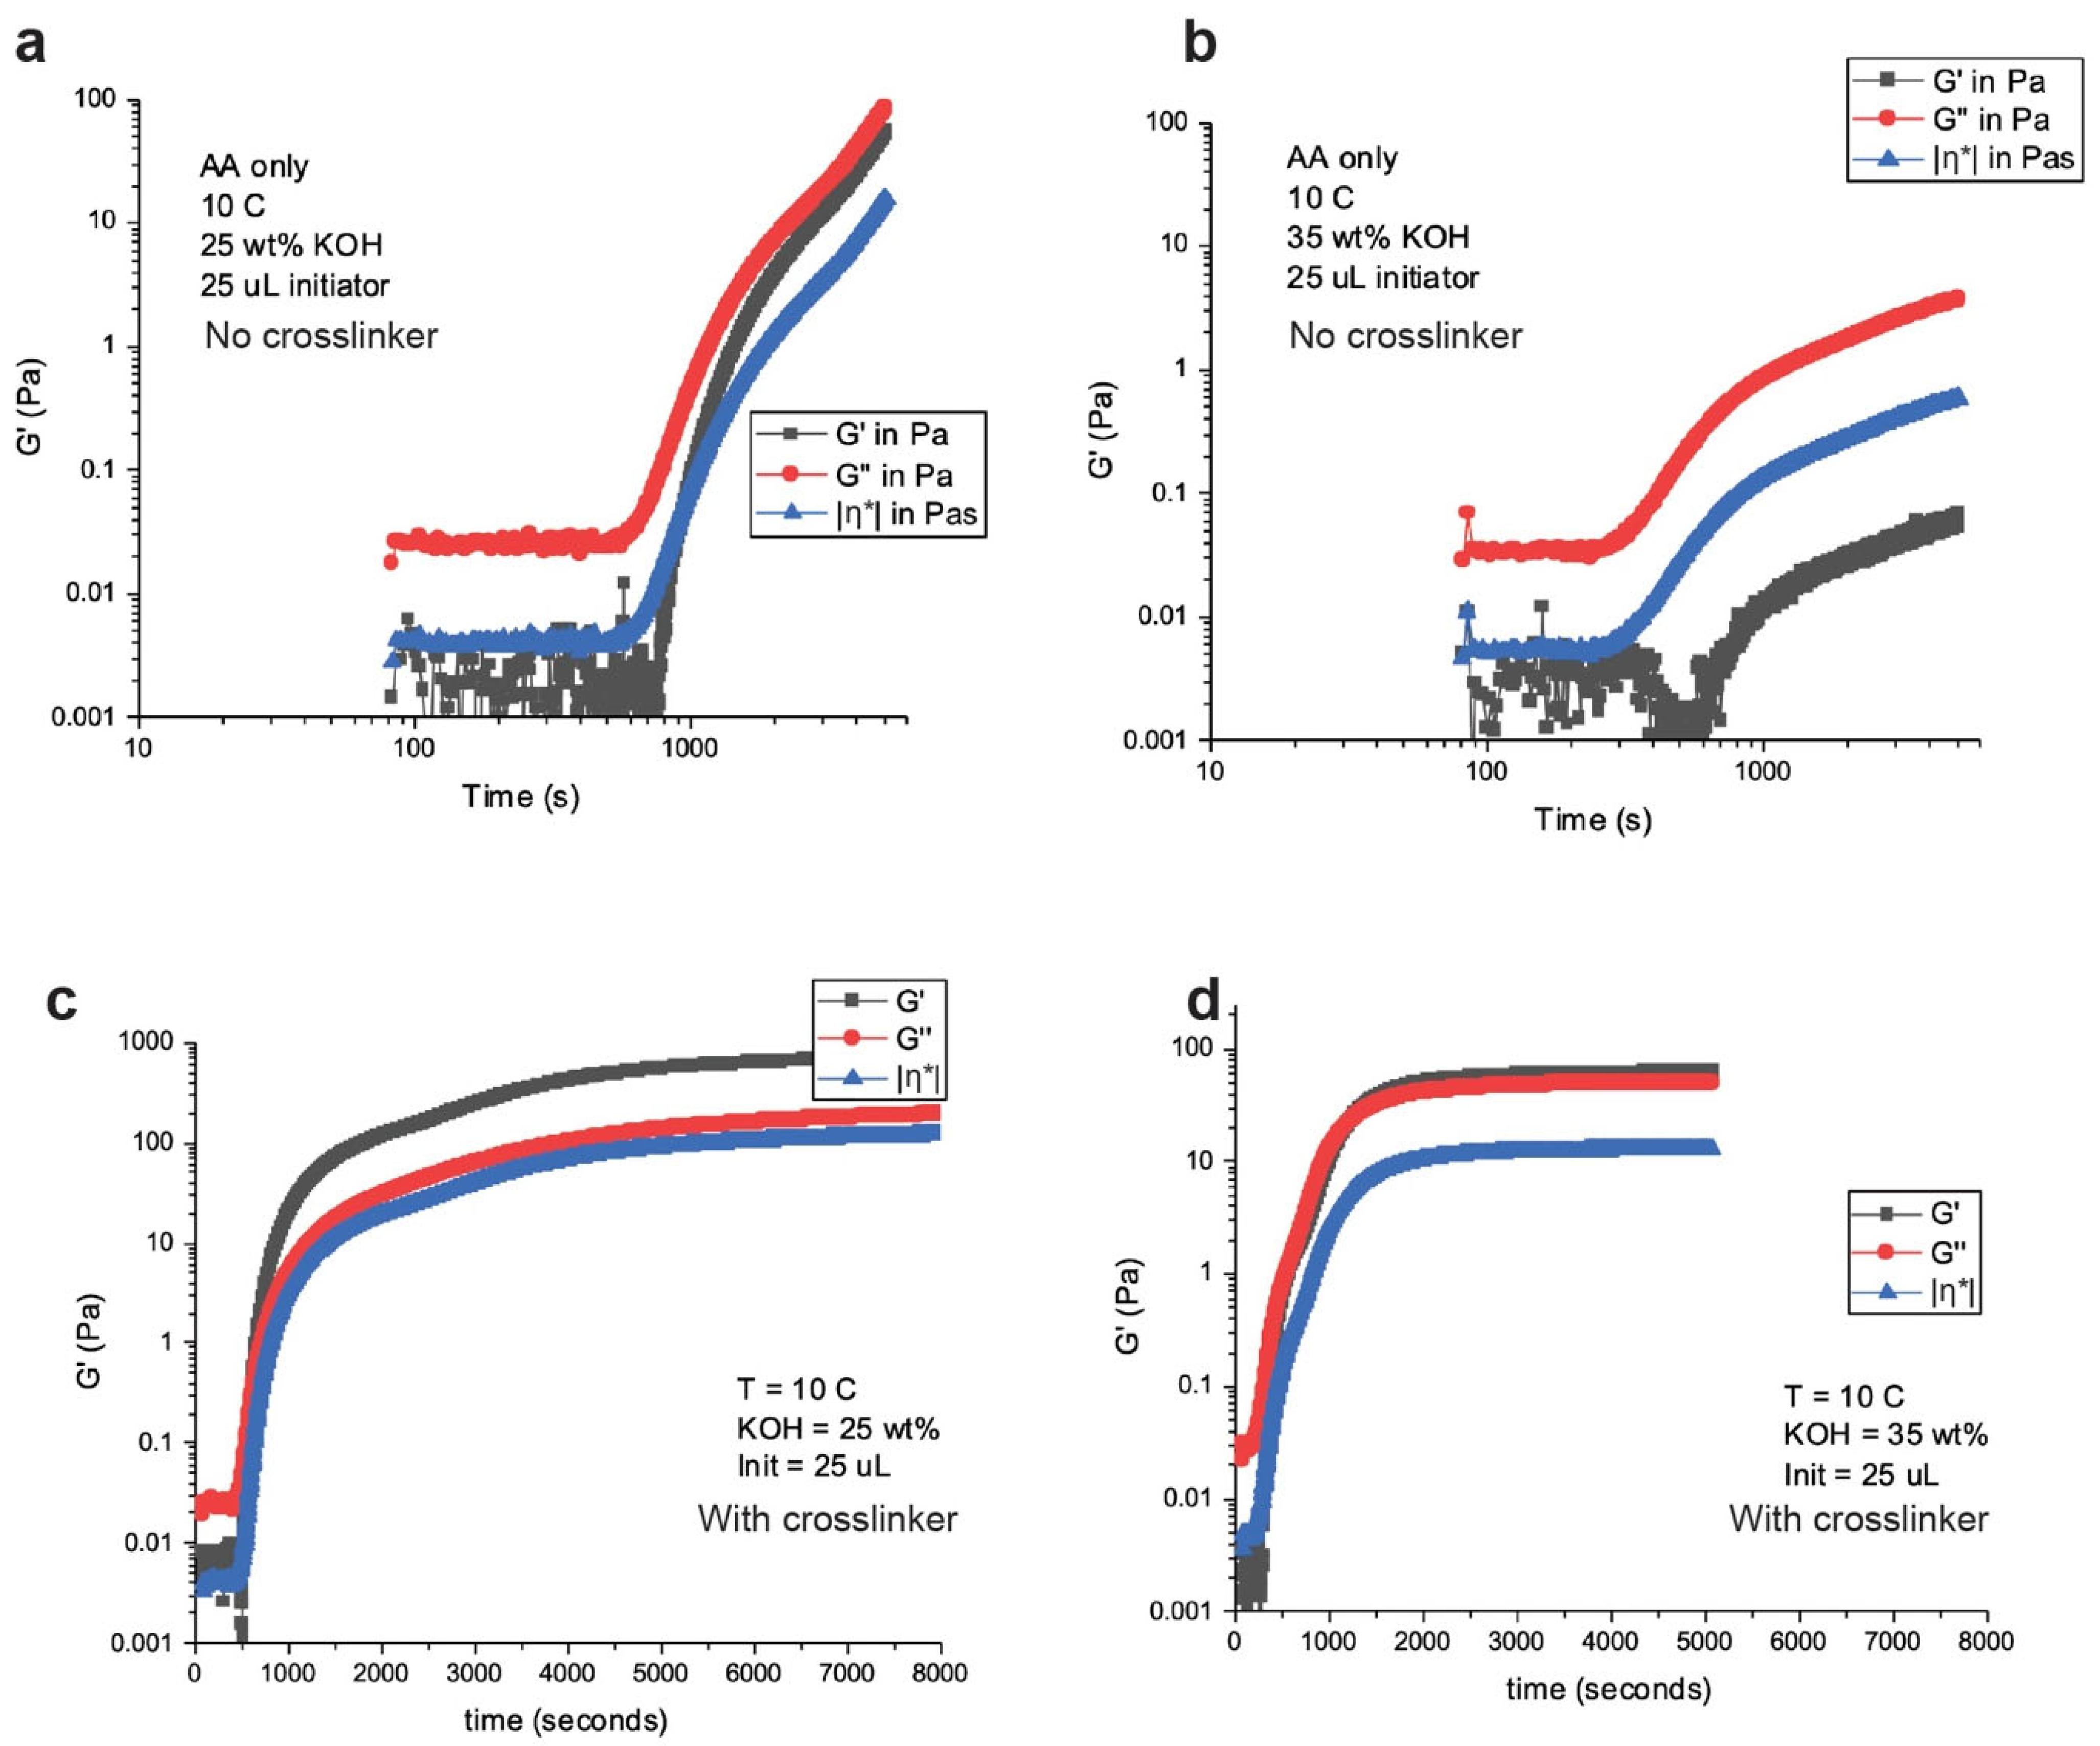
29]. We also tried this crosslinker, and in our initial observations, we found consistent results with gels without crosslinker when testing for delaying the initiation time to polymerization and reducing the polymerization rate. The crosslinker does not affect the polymerization kinetics. We measured the rheological properties of crosslinked and non-crosslinked gels at 25 and 35 wt.% KOH concentrations. These results are shown in
Figure 4.
The gelation map in
Figure 4 shows the elastic (G’) and viscoelastic (G’’) modulus behavior of non-crosslinked and crosslinked gels. The –η*– is the complex viscosity of the gels. The transition from liquid to solid is signified by the crossover of the G’ and G’’, where the polymers are truly described as “gels”. The non-crosslinked gels in
Figure 4a,b cannot be described as true “gels”; however, they are very viscous fluids still showing hydrogel behavior. The crosslinked gels in
Figure 4c,d have G’ and G’’ crossover signifying they are “gels”. Another behavior noticed from the non-crosslinked and crosslinked gels are the “strength” of the gels, where the higher KOH concentrations are “weaker” gels compared to the lower KOH concentrations. The viscosity of the crosslinked 25 wt.% KOH gel was 722 Pa while the 35 wt.% KOH gel was 64 Pa. Stronger or more viscous gels may initially signify a positive attribute; however, in our gas generation studies, we found that stronger gels, especially crosslinked gels, trapped H
2 bubbles which lead to swelling of the hydrogels and build-up of pressure.
Electrochemical characteristics of non-crosslinked and crosslinked gels were also studied. The electrochemical work was based on efficient Zn plating. The MnO
2 in the 1e
− range is proton intercalation, while the Zn discharges and charges its 2e
− capacity through dissolution–precipitation reactions. Dissolution–precipitation reactions depend on free water content and the efficient movement of zincate ions. If zincate ion movement is impeded or dissolution of Zn ions is impeded, then the active material utilization from the Zn anode would be curtailed, which would impact battery performance. We studied the gel ionic conductivity and Zn plating characteristics in non-crosslinked and crosslinked gels, as shown in
Figure 5.
The ionic conductivity of the non-crosslinked and crosslinked gels was in the same range, as shown in
Figure 5a. These conductivities matched that of liquid electrolyte. The ionic conductivity of these gels is the highest reported in the literature compared to other electrolyte systems such as acidic and neutral-based. This meant that hydroxyl transport in these gels was not impeded and the electrochemical performance of a Zn–MnO
2 was possible. The crosslinked gels had a minor drop in conductivity which could be because of rigid domains formed within the hydrogel by crosslinked bonds.
The electrochemical performance of a Zn anode was tested in these hydrogels because of Zn’s dissolution–precipitation behavior. An electrochemical cell was constructed where the hydrogels contained ZnO dissolved in it. A copper current collector was used as the working electrode and sintered nickel as the counter electrode. The working electrode was controlled and monitored using a mercury–mercury oxide (Hg–HgO) reference electrode. The aim of the experiment was to test the plating behavior of Zn from the hydrogels (non-crosslinked and crosslinked) onto the metallic current collector. The electrolyte contained 2 Ah of capacity and the experiment was based on cycled 10% of it. The first step in the experiment was to apply a constant voltage at −1.4 V from OCV to plate Zn from the hydrogels (see
Figure 5b). On achieving the charge capacity, the anode was discharged until −1 V to measure the Coulombic efficiency.
The charge and discharge characteristics shown in
Figure 5b–d indicate the considerable reduction in Zn ion mobility in the crosslinked hydrogels. Zn movement is severely hampered, which affects the plating of metallic Zn. This is indicated by the current decay behavior in
Figure 5c. The current reaches its most minimum value for the crosslinked gels while the non-crosslinked gels sustain a constant higher plating current. The Coulombic efficiency of the crosslinked gels never crosses 40%, indicating limited Zn-ion diffusion and side reactions dominating the coulombs on charge. The crosslinked hydrogels developed trapped H
2 bubbles which eventually swelled.
Considering the reaction rate study, gassing behavior, rheological behavior and electrochemical plating and discharge performance of Zn anodes, we concluded a non-crosslinked hydrogel formed with low initiator and monomer concentration with 36 wt.% KOH as the final concentration was the best for our in situ polymerization process and further battery performance study. The high KOH concentration also helps to dissolve more ZnO and indium hydroxide (In(OH)3) as corrosion inhibitors. From this point in the manuscript, all the hydrogels are non-crosslinked containing 37 ± 1 wt.% KOH as the final concentration and ZnO and In(OH)3 dissolved in it.
3.2. Electrochemical Performance of Zn–MnO2 in In Situ Polymerized Gels
The electroanalytical and battery performance of the Zn–MnO2 cells containing the optimized hydrogel electrolyte was tested and compared to similar cells containing liquid electrolyte (control cells). Cell construction and method of filling are written in the experimental section.
Cyclic voltammetry tests were first conducted to understand the redox reactions of Zn and MnO
2 electrodes in hydrogel electrolyte and its comparison to liquid electrolytes. The cells were scanned at 0.01 mV/s between 1.75 V and 1 V to obtain detailed peaks during the reduction and oxidation reactions. In the liquid electrolytes, well-defined reduction and oxidation peaks are seen in the first cycle, as shown in
Figure 6a. Each of these well-defined peaks is characterized according to its respective reactions. Since there is no capacity limit in cyclic voltammetry tests, the MnO
2 electrode reacts at a greater extent in its first electron region. Mn experiences dissolution of its Mn
3+ ions in the reduction step when >50% of its 1e
− capacity is accessed [
30]. Beyond 79% of its 1e
− capacity, a large portion of the Mn
3+ ions undergo side reactions to form inactive spinel structures such as hausmannite (Mn
3O
4) [
31]. Zn ion mobility is also very high in 36 wt.% KOH solutions. Zn forms dissolved zincate ions (Zn(OH)
42−) during discharge which precipitate to form ZnO. However, these dissolved Zn
2+ ions also migrate to the cathode side to poison or undergo side reactions with Mn
3+ ions to form another inactive spinel called hetaerolite (ZnMn
2O
4). These reactions are marked in
Figure 6a, where the “hump” or the second reduction peak in the first is characterized. The ease of accessibility or high utilization of the electrode active materials in high liquid KOH concentrations leads to buildup of spinel structures in subsequent cycles and leads to capacity loss, which is seen by the reduction in peak area. Comparing the same scanning rates for an identical cell made with in situ polymerized hydrogel electrolyte (
Figure 6b), there is no peak that signifies the reduction of Mn
3+ to Mn
2+ or the interaction of Zn
2+ with Mn
3+. The peak area for the hydrogel-containing cell also appears to reduce slightly in subsequent cycles compared to its liquid counterpart. This signifies better retention in capacity. Capacity retention of these cells was calculated, as shown in
Figure 6c, where the superior retention of the hydrogel-containing cell is a clear advantage to the control liquid cell. The better capacity retention in hydrogel electrolyte can be attributed to a few reasons such as reduced Mn
3+ dissolution and reduced loss or migration of dissolved zincate ions from the Zn anode. These points will be discussed later in the manuscript.
Electrochemical impedance spectroscopy (EIS) was also done to understand better the evolution of solution and charge transfer resistance with cycling. These results are shown in
Figure 7. At open-circuit voltage (OCV), the EIS spectra of a cell containing liquid KOH are better compared to those of a cell containing hydrogel in terms of its solution resistance and charge transfer resistance (semicircle), as shown in
Figure 7a. This could be due to longer soaking times available for a cell containing liquid electrolyte where there is much better interfacial contact with the electroactive materials and KOH. This is also seen after five discharge cycles where the solution resistance is higher for the hydrogel-containing cell. There is no difference in capacity retention between these cells, but it is an indication that in much later cycles these resistances can build up to affect the capacity retention, especially at much higher utilization of the electrode active materials. We solved this problem by making another cell which was presoaked with liquid KOH for 12 h and decanted before the gelling procedure. After gelation of a presoaked cell, the EIS spectra are very similar to those of a cell containing liquid electrolyte at OCV and after five discharge cycles, as shown in
Figure 7a,b. After noticing this effect, we presoaked our cells with liquid electrolyte before gelation. A way of eliminating this presoaking step is by increasing the initiation time to gelation to >10 h, which was possible with potassium acrylate as the monomer starting point.
The cycling performance of Zn–MnO
2 cells containing liquid or hydrogel electrolyte was also compared, as shown in
Figure 8. The cells were cycled at 10% utilization or depth of discharge (DOD) of the MnO
2 1e
− capacity (308 mAh/g) at C/2 (C = 30.8 mAh/g). The voltage ranges used were 1.65 V as the end of charge and 1 V as the end of discharge. The capacity retentions for the cells in liquid and hydrogel electrolyte were the same, as shown in
Figure 8a. This was good as it showed that the hydrogel electrolyte did not impact cycling performance. The Coulombic efficiency of these cells was near 100%, while the energy efficiency was >80% until 130 cycles, as shown in
Figure 8b. This showed that the hydrogels did not affect the nominal or average charge and discharge voltage during cycling. The charge and discharge curves for the first three cycles are shown in
Figure 8c,d. The hydrogel-containing cell has a lower charge voltage than the liquid-containing cell, indicating a lower resistance to charge the cell. This advantageous characteristic is clearly seen in
Figure 8e when comparing the minimum voltage fade for both the cells. The hydrogel-containing cell has a higher minimum voltage compared to its liquid counterpart, indicating its efficient charge transfer during cycling.
The hydrogel-containing Zn–MnO
2 cell clearly showed advantages during cycling. These advantages were also noticeable on visual inspection of the cell. Zn anodes undergo a phenomenon called “shape change” where they dissolve and replate or precipitate in different regions of the electrode, leading to considerable active material redistribution. This can lead to the formation of stray Zn particles that are not connected to the metallic current collector. This was easily seen in the cells containing liquid 36 wt.% KOH, as shown in
Figure 9a. The creation of these stray Zn particles is a loss of active material and thus a loss of capacity which is seen in our cycling cells. These stray Zn particles are also seen to form dendritic structures on the edges of the electrodes and on the separator, as shown in
Figure 9a. These can also cause Coulombic inefficiencies by directing some of the coulombs on charge to side reactions and thus inefficient plating of Zn. These problems were not observed in the cells containing hydrogel electrolyte, as shown in
Figure 9b. There was no stray Zn formation or formation of any dendritic Zn structures. The hydrogel electrolyte seemed to control shape change, a longstanding problem in metal anode batteries.
To understand the hydrogel’s effect on deterring Zn shape change, we constructed small cells that could be cycled under an optical microscope. Cell construction and electrode architecture details are written in the experimental section. A Zn anode was cycled and observed in operando under the microscope, as shown in
Figure 10. The cell contained hydrogel electrolyte encapsulating the Zn anode. The cell was cycled to obtain the maximum capacity of the Zn anode in hydrogel electrolyte while its electrode and particle changes were observed under the microscope. The numbers on the images represent the regions on the voltage–time curves where the images were taken. The video of this cell is also shown in
Supplementary Video S1. During the first discharge (regions 1 to 3), the metallic Zn powder was seen to transition to ZnO (white powder appearance in region 3). The total Zn utilization in this discharge was >60% of its 2e
− capacity (820 mAh/g). This is remarkable utilization for a metallic anode in hydrogel electrolyte because the hydrogel reduces the diffusion of zincate ions, which could be expected to promote precipitation of ZnO and passivation of the electrode. Instead, despite ZnO precipitation, we observe high utilization and excellent reversibility, discussed below. The Zn utilization or overdischarge of Zn anodes could be curtailed because of limited electrolyte in the cell or reduced free water content in the gels, an advantage that we exploited and describe later in the manuscript.
On charge, from region 4 to region 5, the ZnO particles were reduced to form metallic Zn. The metallic Zn particles look to form domains within the hydrogel network which are tightly compressed. The hydrogel’s advantageous characteristic of blocking shape change was seen from regions 5 to 8, where at the end of discharge (regions 7 and 8), the ZnO particles looked to be encapsulated within the hydrogel network as well. The transition from region 8 to region 9 showed that the ZnO particles converted reversibly back to metallic Zn in the same regions. The hydrogel encapsulating the Zn particles is shown in region 10. The hydrogels can be viewed as a local reaction space where it preserves the charge and discharge end-products of conversion metal anodes such as Zn. At the end of discharge 3, the Zn utilization was >50% of its 2e− capacity (820 mAh/g), which is very high.
3.3. Testing of Hydrogel-Containing Cells That Are Commercially Sized
The microscope experiments showed the shape change limiting characteristic of the hydrogel electrolytes, and the promising cycling results motivated the next series of experiments, i.e., testing the hydrogels in commercially sized prismatic and cylindrical cells. First, we created a baseline performance of the prismatic cells in liquid 36 wt.% KOH. The total 1e
− capacity of the commercially made prismatic cells equated to 95 Ah. The cells were nameplated at 20% utilization (19 Ah). The cells were cycled at C/4 (C = 19 Ah) between 1.75 V and 1 V. The battery performance of this control cell is shown in
Figure 11. The initial cycles showed that the cells charged and discharged coulombically at 100% (
Figure 11a,c). However, in later cycles, the end of charge voltage slopes downwards with the end of discharge voltage, as shown in
Figure 11b. This trend is a clear indication of a short being developed in the cell. Localized shorts in the cell direct the coulombs on charge to side reactions rather than to the active materials, which creates a cumulative coulomb deficit. At some point, this deficit impacts the discharge capacity.
This impact on the discharge capacity was seen on cycle 100 where there is rapid capacity degradation. Dissection of this cell (
Figure 11d) showed that there was a considerable build-up of stray Zn that created these localized shorts which eventually led to the failure of the control (liquid) cell. In a liquid cell, this can be mitigated, and cycle life can further be increased by reducing the electrolyte concentration to 25 wt.% and using calcium hydroxide membranes [
32].
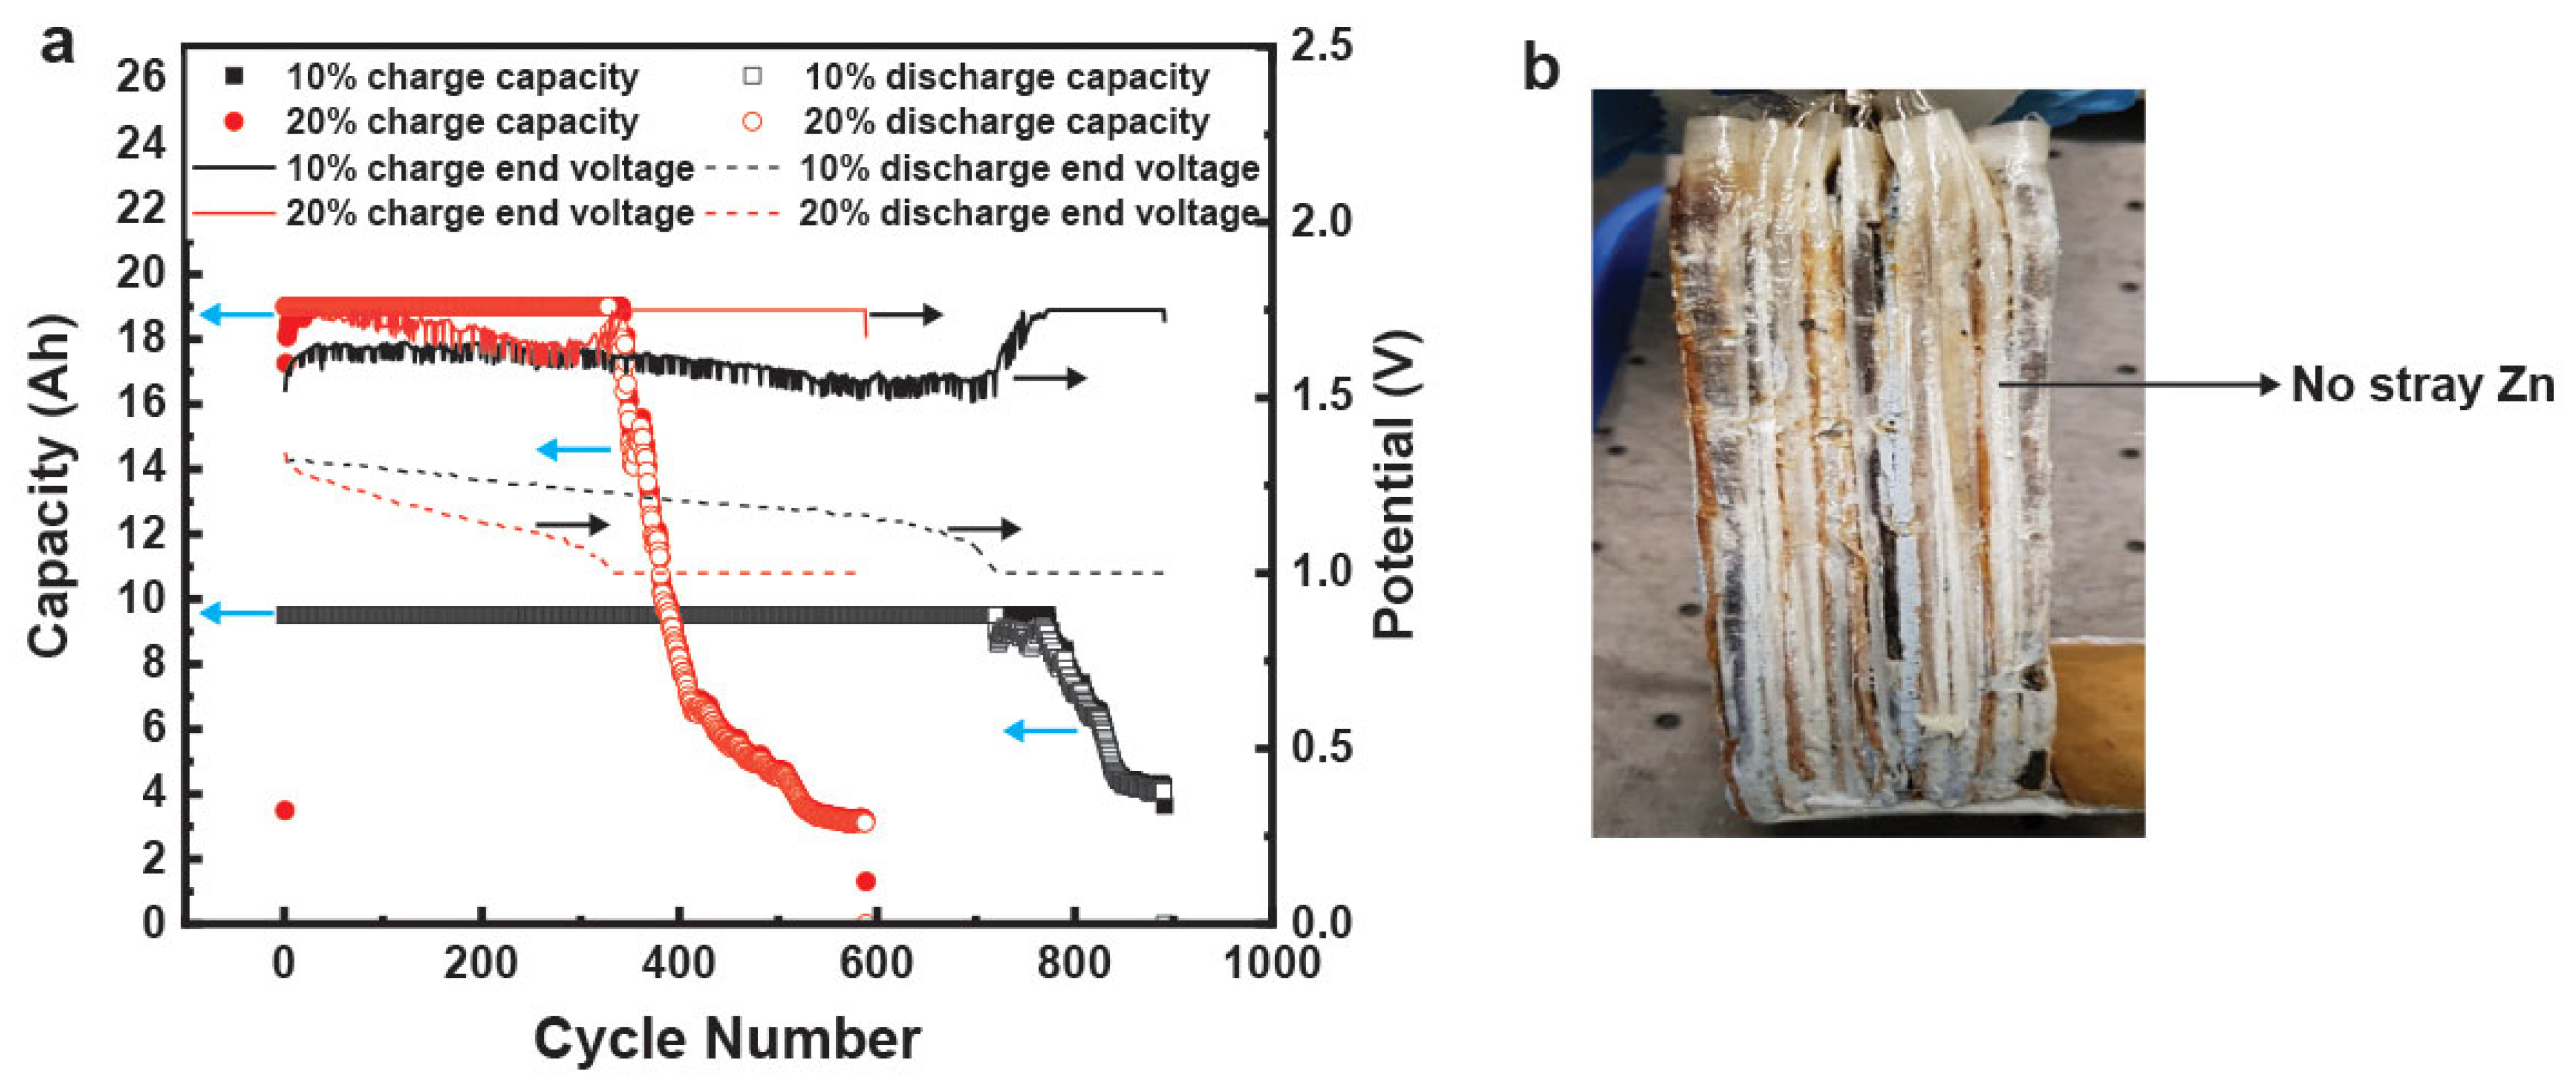
The analogous hydrogel-containing commercial prismatic cells were cycled to the same protocol as the control liquid cell. One cell was cycled at 10% utilization (9.5 Ah) and the other was cycled at 20% utilization (19 Ah). These hydrogel-containing cells obtained 100% DOD for numerous cycles, as shown in
Figure 12a. The 9.5 Ah cell had 100% retention of capacity for >700 cycles while the 19 Ah cell had 100% capacity retention for >300 cycles, as shown in
Figure 12a. The 19 Ah hydrogel-containing cell had a 3 times better cycle life compared to its liquid counterpart. This is the first such demonstration of a low-maintenance nonspillable Zn–MnO
2 rechargeable aqueous battery. The dissection of these cells (
Figure 12b) indicated that a possible reason for the considerable increase in cycle life was the reduction of stray Zn particles that lead to shorts and reduction in active material utilization.
Commercially made cylindrical cells containing hydrogel electrolyte were also tested. The cylindrical cells are nameplated at 70 Ah which equates to 20% utilization of MnO
2 1e
− capacity. Two cylindrical cells were tested with hydrogels formed using the in situ polymerization process. These cells were also cycled at C/4 (C = 70 Ah) between 1.75 V and 1 V. The results are shown in
Figure 13. The two cylindrical cells had remarkable consistency in their performance. The voltage curves overlapped, as shown in
Figure 13a. The maximum and minimum voltage fades were also consistent with each other, as shown in
Figure 13b. The capacity retention of these cells was also 100%, as shown in
Figure 13c. These cells are still cycling at the time of this writing and have crossed >120 cycles. The use of cylindrical cells allows for better compression and increasing the capacity of the cell or battery module, which eventually relates to system performance. The use of hydrogel electrolytes showed that these cells can be cycled reliably.
3.4. Overdischarge Protection and Commercial Applications of Hydrogel-Containing Zn–MnO2 Cells and Batteries
A major motivation for the current work was the development of nonspillable low-maintenance Zn–MnO2 cells that can be deployed in the field. Safety during system operation is important; however, safety during transportation is also important, and these hydrogel electrolytes help us satisfy the DOT requirements. From an application standpoint, we will discuss the use of these hydrogel-filled cells in a solar microgrid operation. However, there is also an important discussion point related to the operation of the cells in solar microgrids, uninterruptible power sources (UPSs), frequency regulation and other applications where overutilization of the cells can lead to side reactions that affect system energy and lifetime costs. A battery management system (BMS) is usually required to prevent the overcharge or the overdischarge of the cells and allow battery balancing. BMS can be expensive depending on the cell chemistry and add substantially to the system’s cost. If safety can be inbuilt from the chemistry side of the battery, it can lead to considerable benefits such as reducing system design complexity and costs.
We tested our hydrogels’ capacity to prevent overdischarge of Zn–MnO
2 cells. Traditional Zn–MnO
2 cells operated in the 1e
− range have a strict end of discharge voltage of 1 V. Crossing this 1 V discharge limit in a liquid-containing cell can lead to deleterious side reactions that affect cell rechargeability. As previously discussed, Mn
3+ and Zn
2+ ions can react together to form spinel compounds that are inactive and lead to rapid capacity deterioration. An example of this rapid capacity fade is shown in
Figure 14a. Control commercial cells of Zn–MnO
2 were overdischarged beyond 1 V. The total capacity achieved in this overdischarge was 130 Ah, which is considerable compared to the nameplate capacity (19 Ah) and theoretical 1e
− capacity (95 Ah). This meant that the cell accessed the second electron capacity, which is based on dissolution–precipitation of Mn ions. The uncontrollable nature of Mn ions in the second electron range and low voltage capacity is a main reason for curtailing the end of discharge of the 1e
− cell to 1 V. The Mn ions form [Mn–OH] octahedral complexes that react with each other and Zn ions to form spinels that cannot be recharged. This loss of rechargeability leads to immediate failure of the cell, as shown in
Figure 14a,b.
We tested the same protocol on a hydrogel-containing commercial Zn–MnO
2 cell and compared the overdischarge performance (
Figure 14a). The hydrogel cell had no second electron reactions of MnO
2 below 1 V and Zn ion interaction with the Mn below 1 V. The hydrogel was suppressing the dissolution of Mn and Zn ions that could lead to the formation of the inactive spinels. We postulate that this could be related to the free water content available in the hydrogels that allows for these reactions. The Zn anode utilizes a large portion of its theoretical capacity in liquid KOH, which leads to the dissolution of the active material to form zincate ions and then leads to the buildup of stray Zn in successive charge–discharge cycles. However, the same anode in hydrogel can be prevented from overdischarge by limiting the solubility of Zn in the hydrogels. The blocking of the Zn anodes’ overdischarge in turn prevents further discharge of even the cathodes and thus eliminates any deleterious side reactions. This can be done multiple times, as shown in
Figure 14a,b, where continuously overdischarging to 0 V has no serious consequence on the capacity fade of the cell. Approximately 47% of the 95 Ah is obtained stably for 10 cycles, after which it experiences minor fade. This fade is due to the high utilization of the MnO
2 and Zn anode beyond the stated 20% of 1e
− of MnO
2.
Thus, we have shown an important benefit of these hydrogels, where we can tune the properties to impart safety protections chemically which has not been shown before.
From an application standpoint, we simulated the use of the hydrogel-containing cells in solar or photovoltaic off-grid applications. The solar off-grid application protocol is defined by the International Electrotechnical Commission (IEC) 61427-1, where it tests the batteries for use with photovoltaic energy systems that are used as constant, variable or intermittent energy to power equipment such as housing appliances (refrigerators, lighting) and pumps. For many communities or islands there is no access to the grid, so developing these systems with rechargeable batteries is a way to grant accessibility to power.
The IEC solar off-grid protocol is a demanding test protocol that subjects the cells or batteries to different states of charge at 40 °C and daily cycling. The different states of charge relate to the seasonal conditions or periods of time where there is no solar irradiation, and the battery system is required to supply energy for several days. For example, low solar irradiation is experienced during winters while high solar irradiation is experienced during summers. When there is low solar irradiation, the battery is operated at low state-of-charge (SOC) and when there is high solar irradiation the battery is operated at high state-of-charge. The IEC solar off-grid protocol specifically tests the cycling endurance of battery systems in photovoltaic applications and charge retention of the battery system after finishing one cycling loop (winter and summer cycles). A plot explaining the protocol is shown in
Figure 15.
As explained in
Figure 15, Phase A represents the winter cycling loop or low SOC, while Phase B represents the summer cycling loop or high SOC. The first step in Phase A is to discharge the battery 90% of its nameplate capacity at C/10 (where C is the nameplate capacity) to bring the battery to its low SOC. The battery is cycled in this low SOC 49 times in Phase A with a 3% overcharge in every recharge cycle. After finishing Phase A, the battery is recharged completely before proceeding into Phase B cycling. Phase B cycling is repeated 100 times until a total of 150 cycles is reached which concludes 1 year of solar cycling. Before Phase A is repeated, a residual capacity determination test is conducted to measure the percentage capacity retention of the battery with respect to its nameplated capacity. This is done at C/10 until the end of discharge voltage is reached. If >80% of the nameplate capacity is achieved, then the next year of solar cycling is started with the battery restarting at Phase A. If <80% of the nameplate capacity is achieved, then the testing is terminated. The aim for any battery manufacturer is to obtain maximum solar cycles. For example, 5 years of solar cycling would equate to 750 cycles or 10 years of solar cycling would equate to 1500 cycles at low and high SOC. Commercially available lead–acid (Pb–acid) batteries achieve at least 5 years in this protocol depending on the type of Pb–acid batteries used. Valve-regulated Pb–acid batteries can achieve >5 years but are very expensive, while flooded Pb–acid batteries are known to fail earlier.
For our Zn–MnO
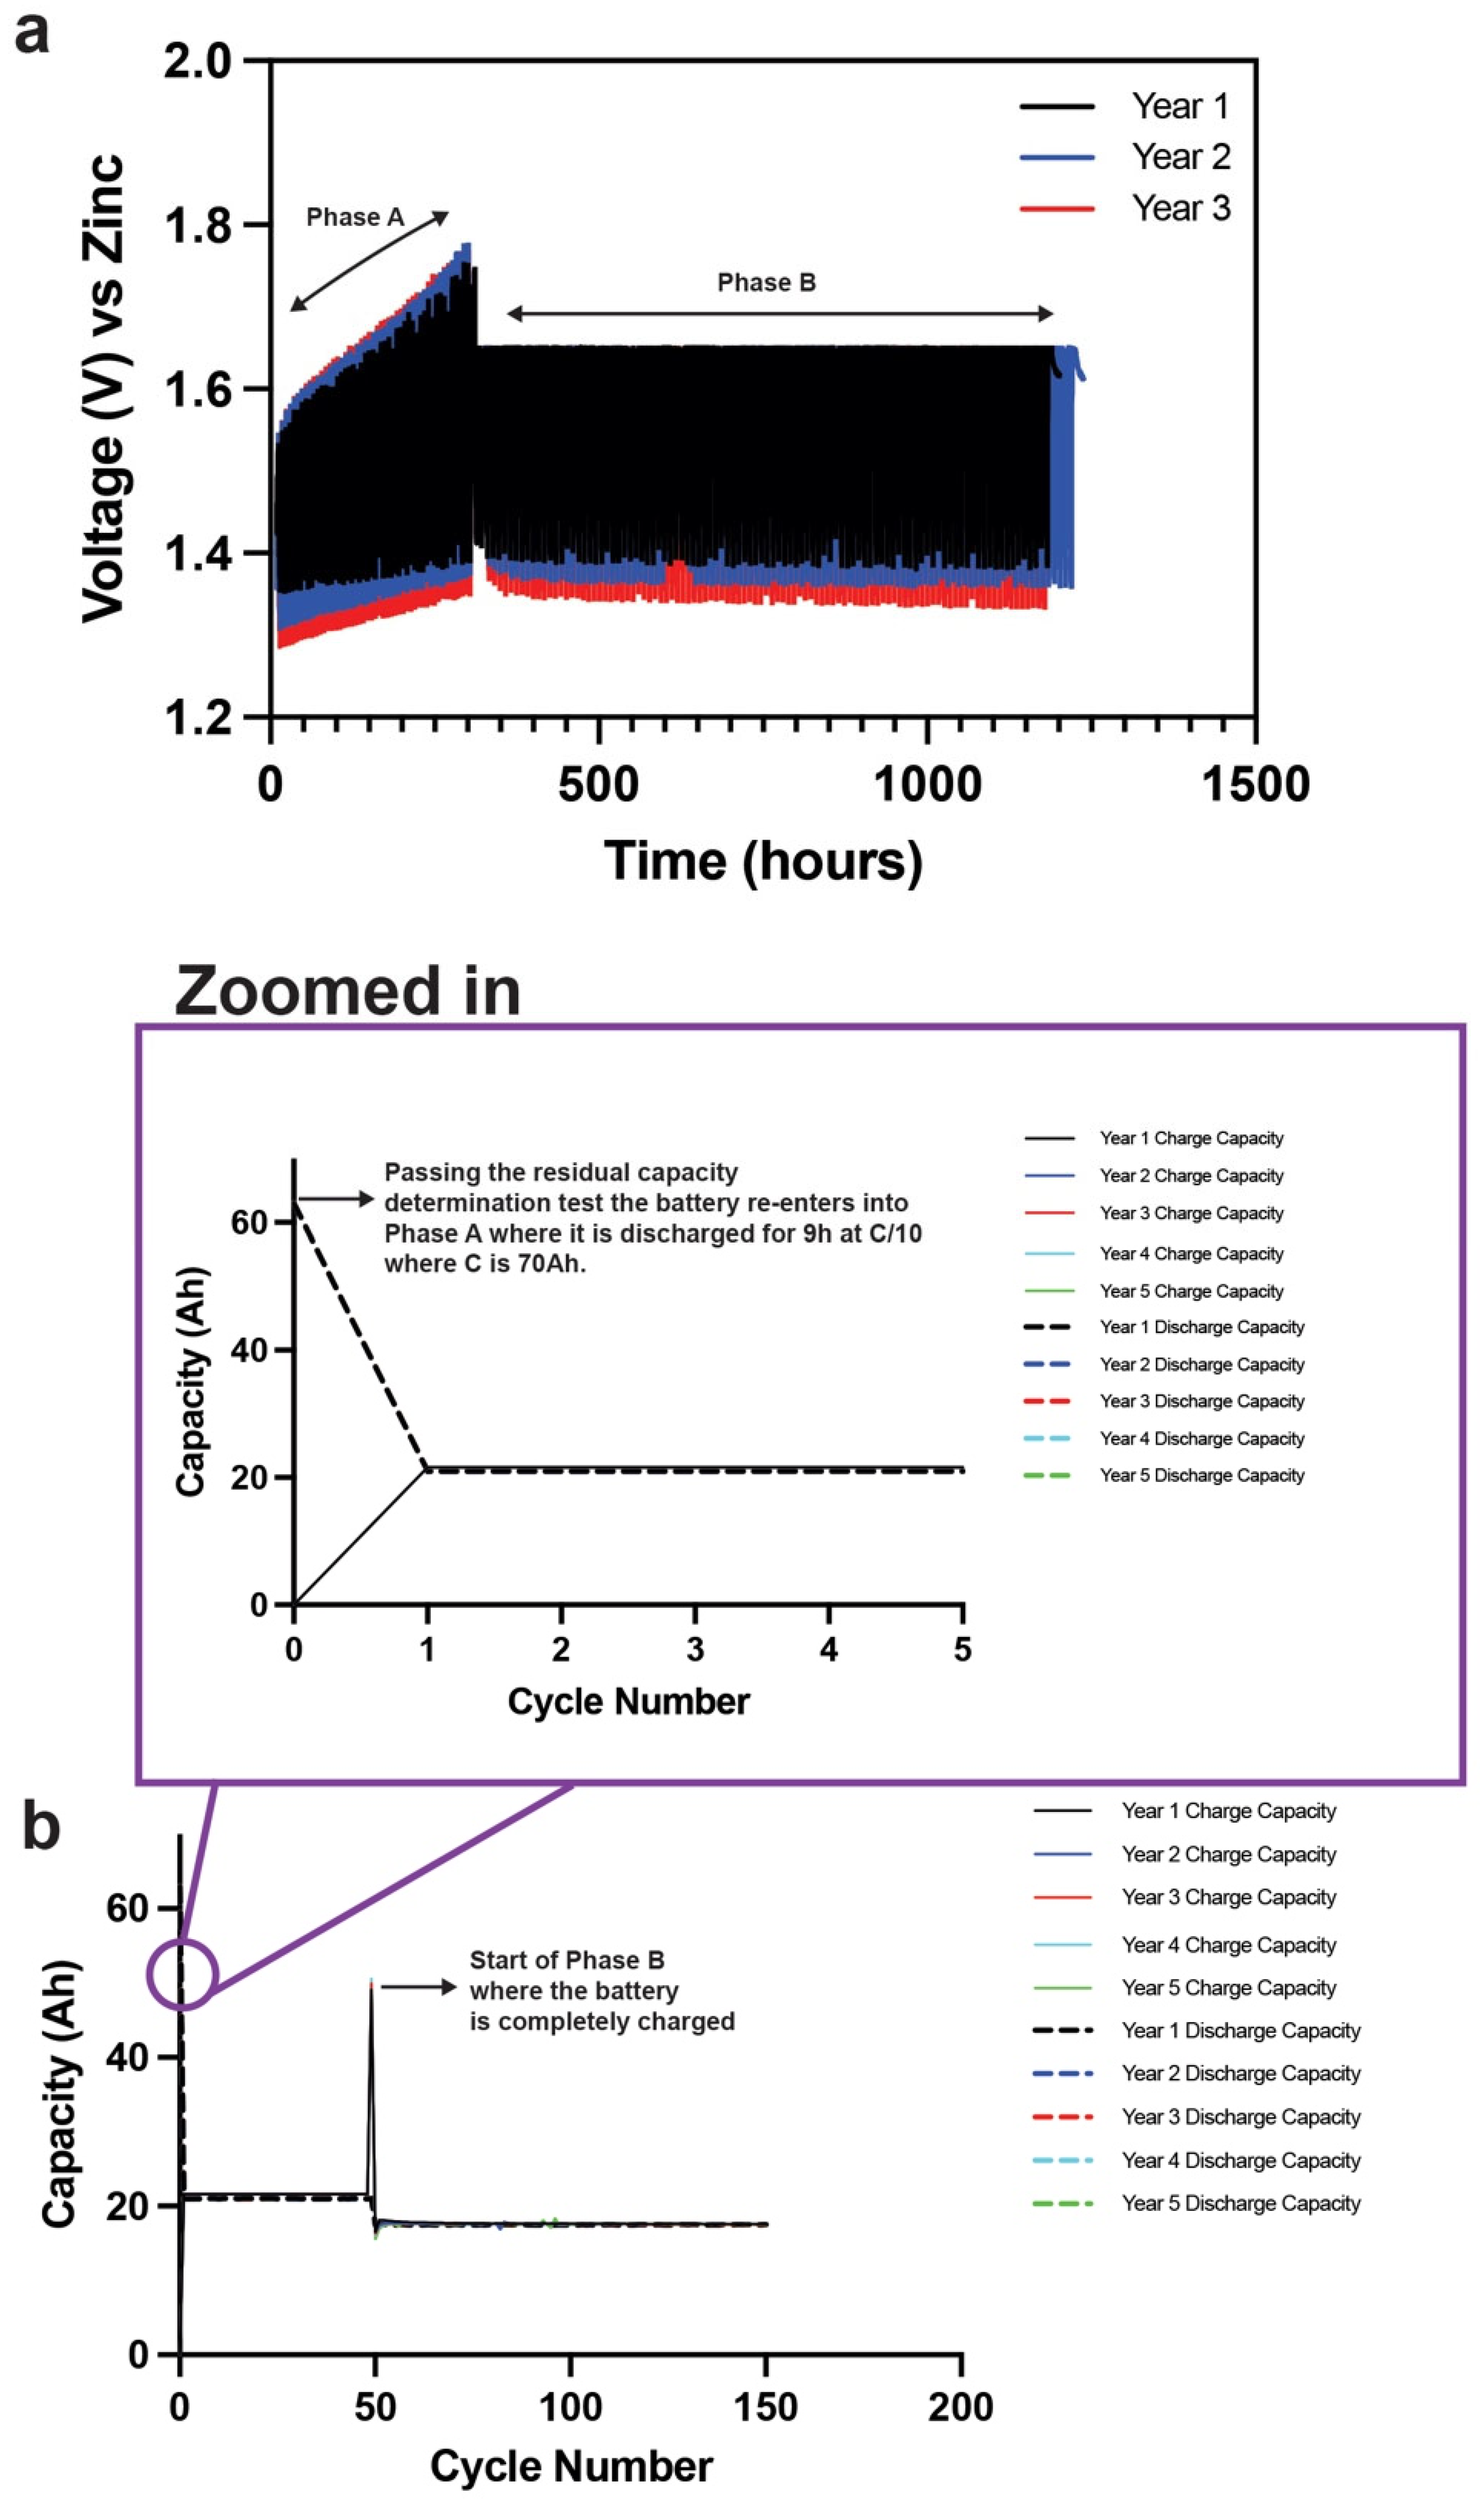
2 cells, in Phase A the end of charge and discharge voltages were 1.75 V and 1 V. This meant that the voltage would “walk” up the SOC curve during the 3 h recharged cycles until it hit 1.75 V by the 50th cycle. The end of charge voltage was then reduced to 1.65 V for Phase B to see if the required capacity could be injected into the battery at a lower voltage. The end of discharge voltage in Phase B was kept at 1 V. The nameplate was decided by the form factor used. For example, the cylindrical cells are nameplated at 70 Ah, while the prismatic cells are nameplated at 19 Ah. We cycled an individual cylindrical cell nameplated at 70 Ah filled with in situ polymerized hydrogel electrolyte under the IEC solar off-grid protocol, as shown in
Figure 16. The hydrogel cylindrical cell has passed 5 years of solar cycling which equates to 750 cycles through Phase A and Phase B. The cell has entered its sixth year and still cycling well. The voltage–time curves are shown in
Figure 16a, where the curves are remarkably consistent through numerous cycles of low and high SOC. The cell passed the residual capacity determination test after every year. Every year’s initial 9 h C/10 discharge at the start of Phase A is shown in the zoomed-in image in
Figure 16b. The cell discharged 63 Ah of the 70 Ah nameplate capacity to enter its low SOC and walk up the SOC curve at the end of Phase A. The cell was completely charged before entering Phase B, as shown in
Figure 16b. The cell passed through 750 cycles of different SOCs, which showed the robustness of the hydrogel electrolyte in the cylindrical cells.
The promising results of the commercially designed prismatic and cylindrical cells motivated our next experiment on system design and testing the hydrogel-containing cells in series and parallel. This is part of UEP strategy for a power assurance system for home power backup, where we are designing cube systems that can be combined into multiple cube containers to tailor the system energy and power according to the customer’s needs. We designed a 12 V system with 72 prismatic cells (nameplated at 19 Ah), where nine modules were connected in series and each module contained eight prismatic cells connected in parallel. Photographs of the module and system build are shown in
Figure 17a. The system was again tested according to the IEC solar off-grid protocol through Phase A and Phase B cycling regimes. The system was nameplated at 2 kWh based on ~19 Ah per cell. To track the replicability of the system curves, we made a single cell and an 8-cell module connected in parallel and compared its cycling curves to that of the system, as shown in
Figure 17b. The cycling curves were remarkably replicable for a single cell, eight-cell module in parallel and a 2 kWh system in both Phase A and Phase B cycling regimes.
We also monitored each module’s voltage during the system cycling using an Orion BMS. The individual module voltages and the overall system voltage are shown in
Figure 17c. From right to left, the module cell voltages matched those of the system when comparing the first step in Phase A, i.e., the 9 h C/10 discharge; a representative cycle of Phase A; and a representative cycle of Phase B. The hydrogel-containing prismatic cells showed very consistent performance even in the constant voltage steps of Phase B. In control liquid cells, we have found that the constant voltage step results in earlier failure of Zn–MnO
2 cells because of stray Zn formation that results in shorts and other side reactions that are an effect of the reducing float current. These problems were not seen in the cells containing hydrogel electrolyte. The system has gone through 2 years of cycling and has entered its third year.


 ,
, 