
Noninvasive Detection, Tracking, and Characterization of Aerogel Implants Using Diagnostic Ultrasound


 , ,
, ,  ,
,
Abstract
:
1. Introduction
2. Materials and Methods
2.1. Aerogel Selection and Sample Preparation
2.2. Evaluation of Physical Properties
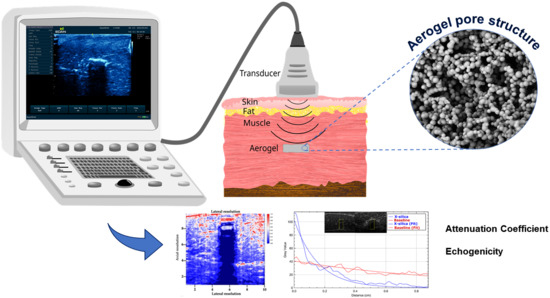
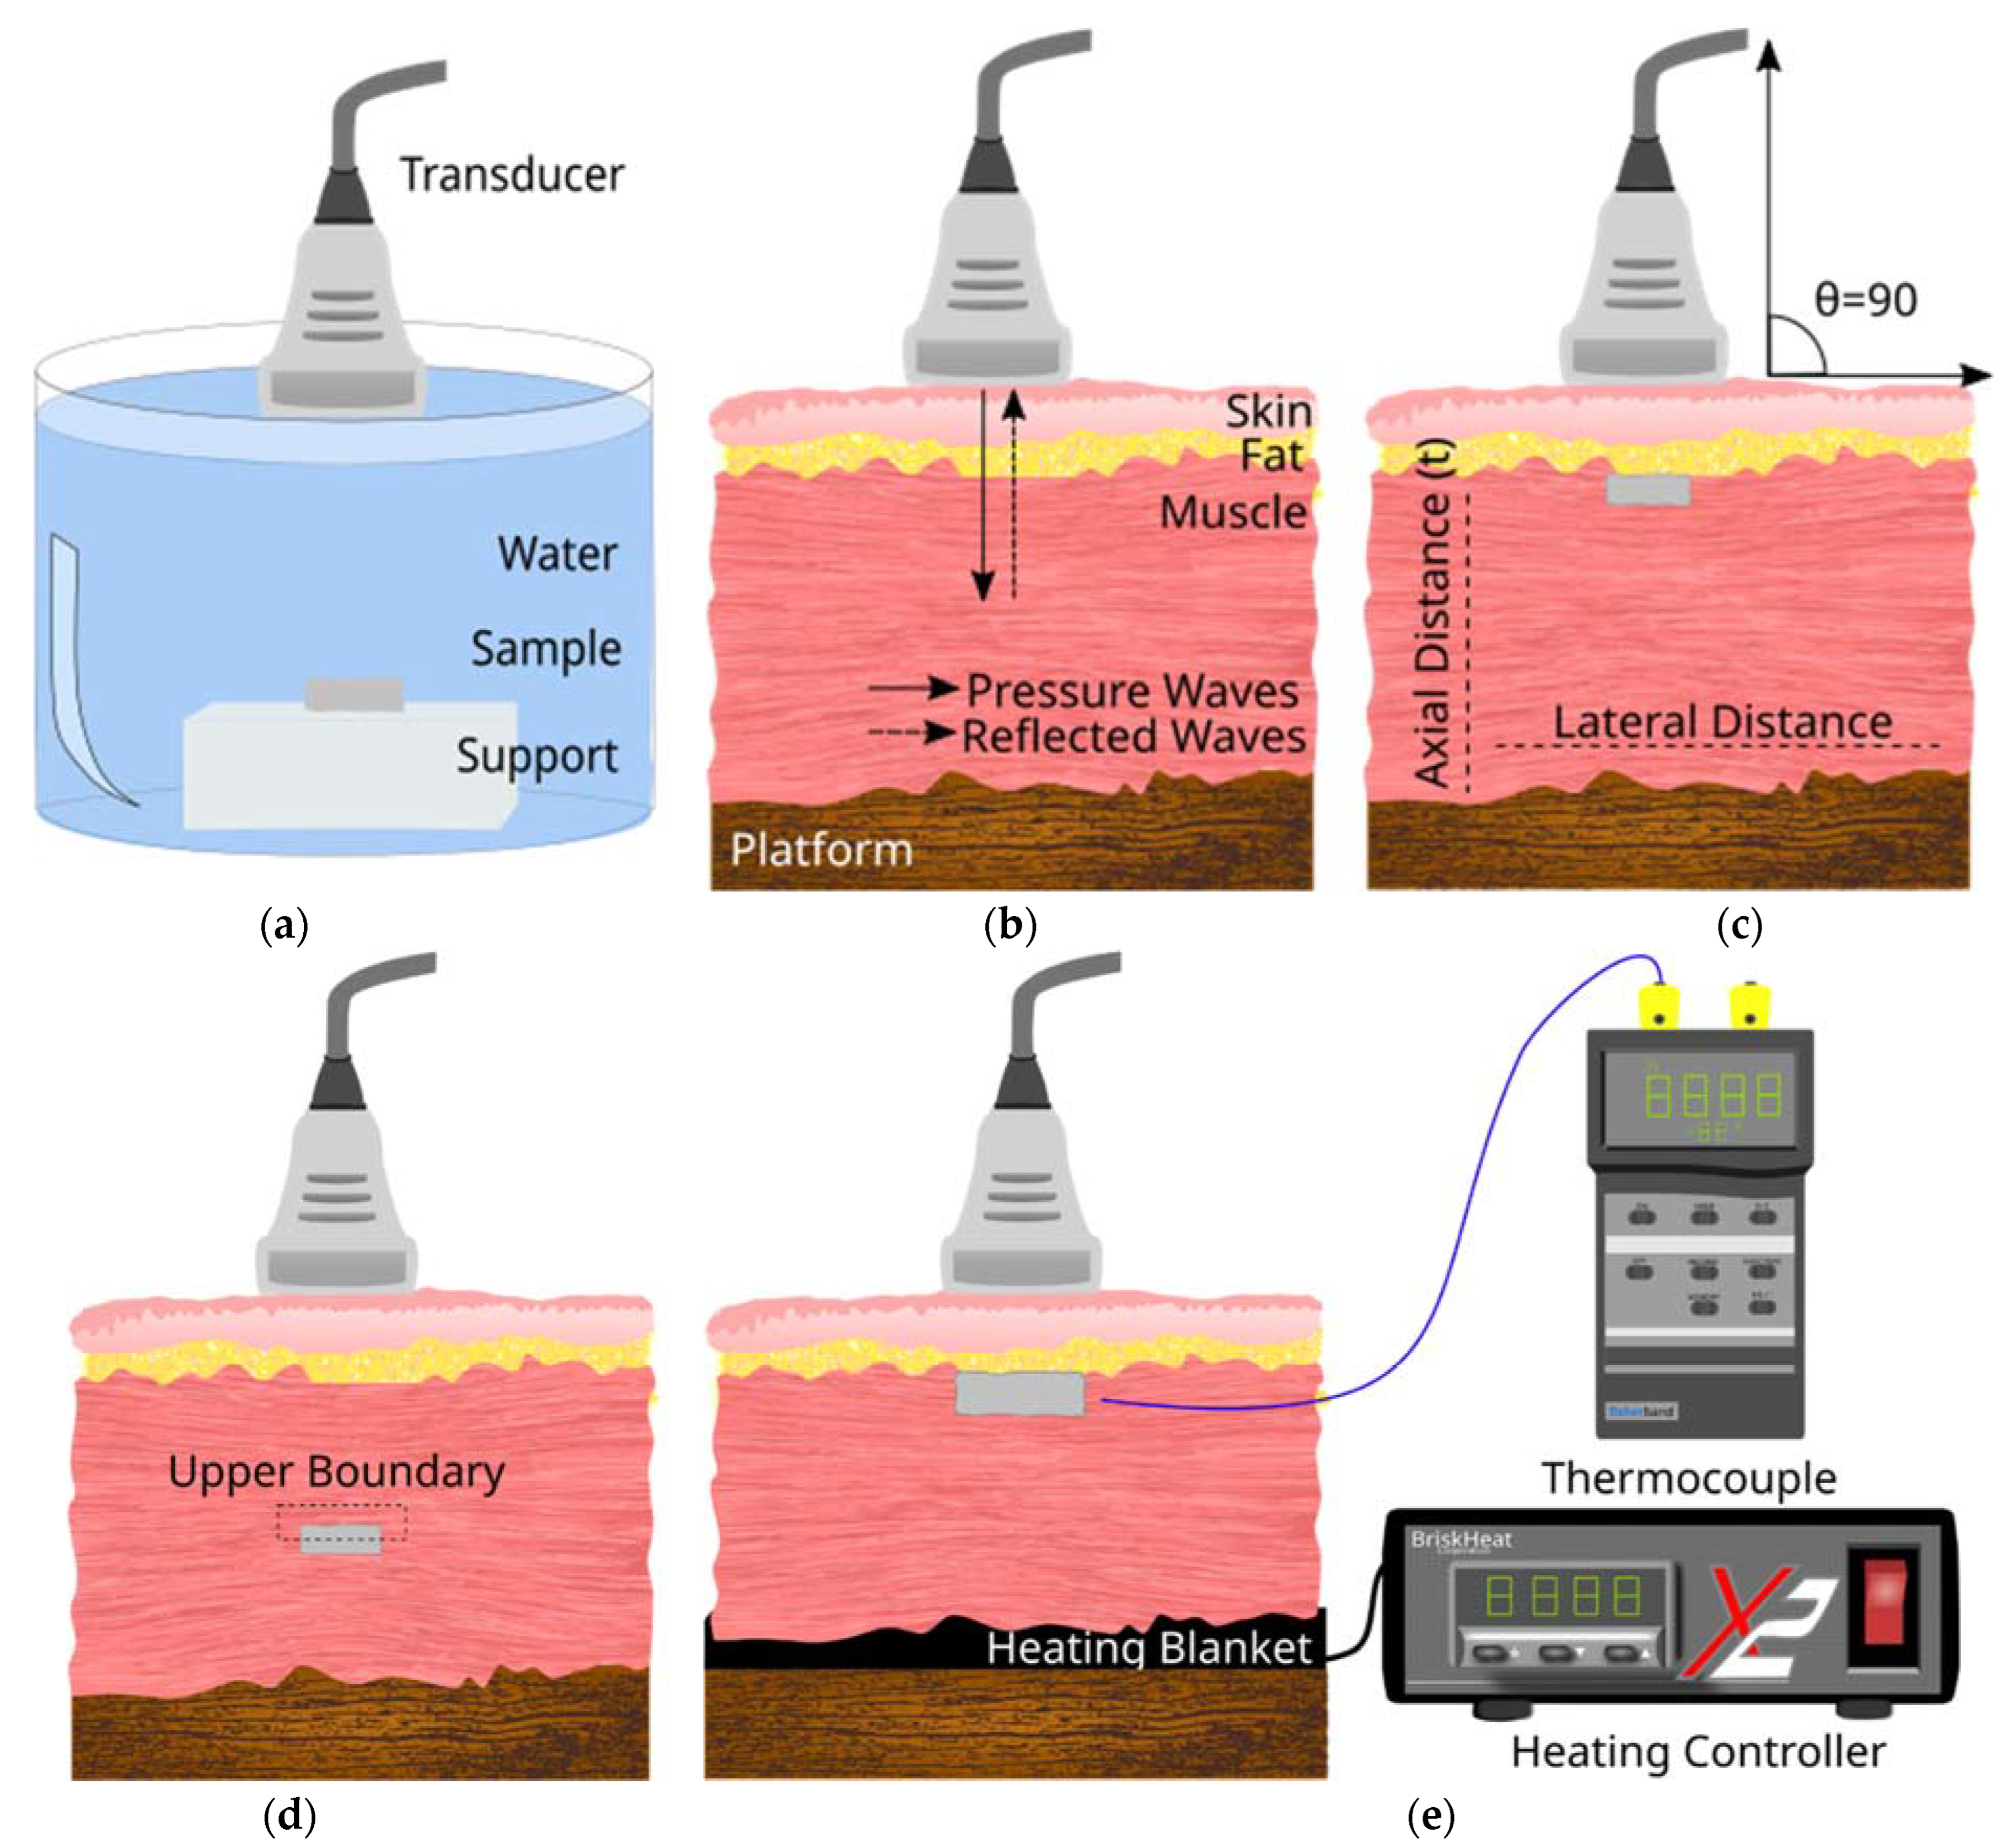
2.3. Experimental Setup for Ultrasound Image Acquisition
2.4. Image Processing and Analysis
2.5. Attenuation Calculation
2.6. Echogenicity
3. Results
3.1. Aerogel Characterisation Results
3.2. Correlation between Acoustic Impedance (Z), Young’s Modulus, (Y) and Speed (v)
3.3. B-Mode Images
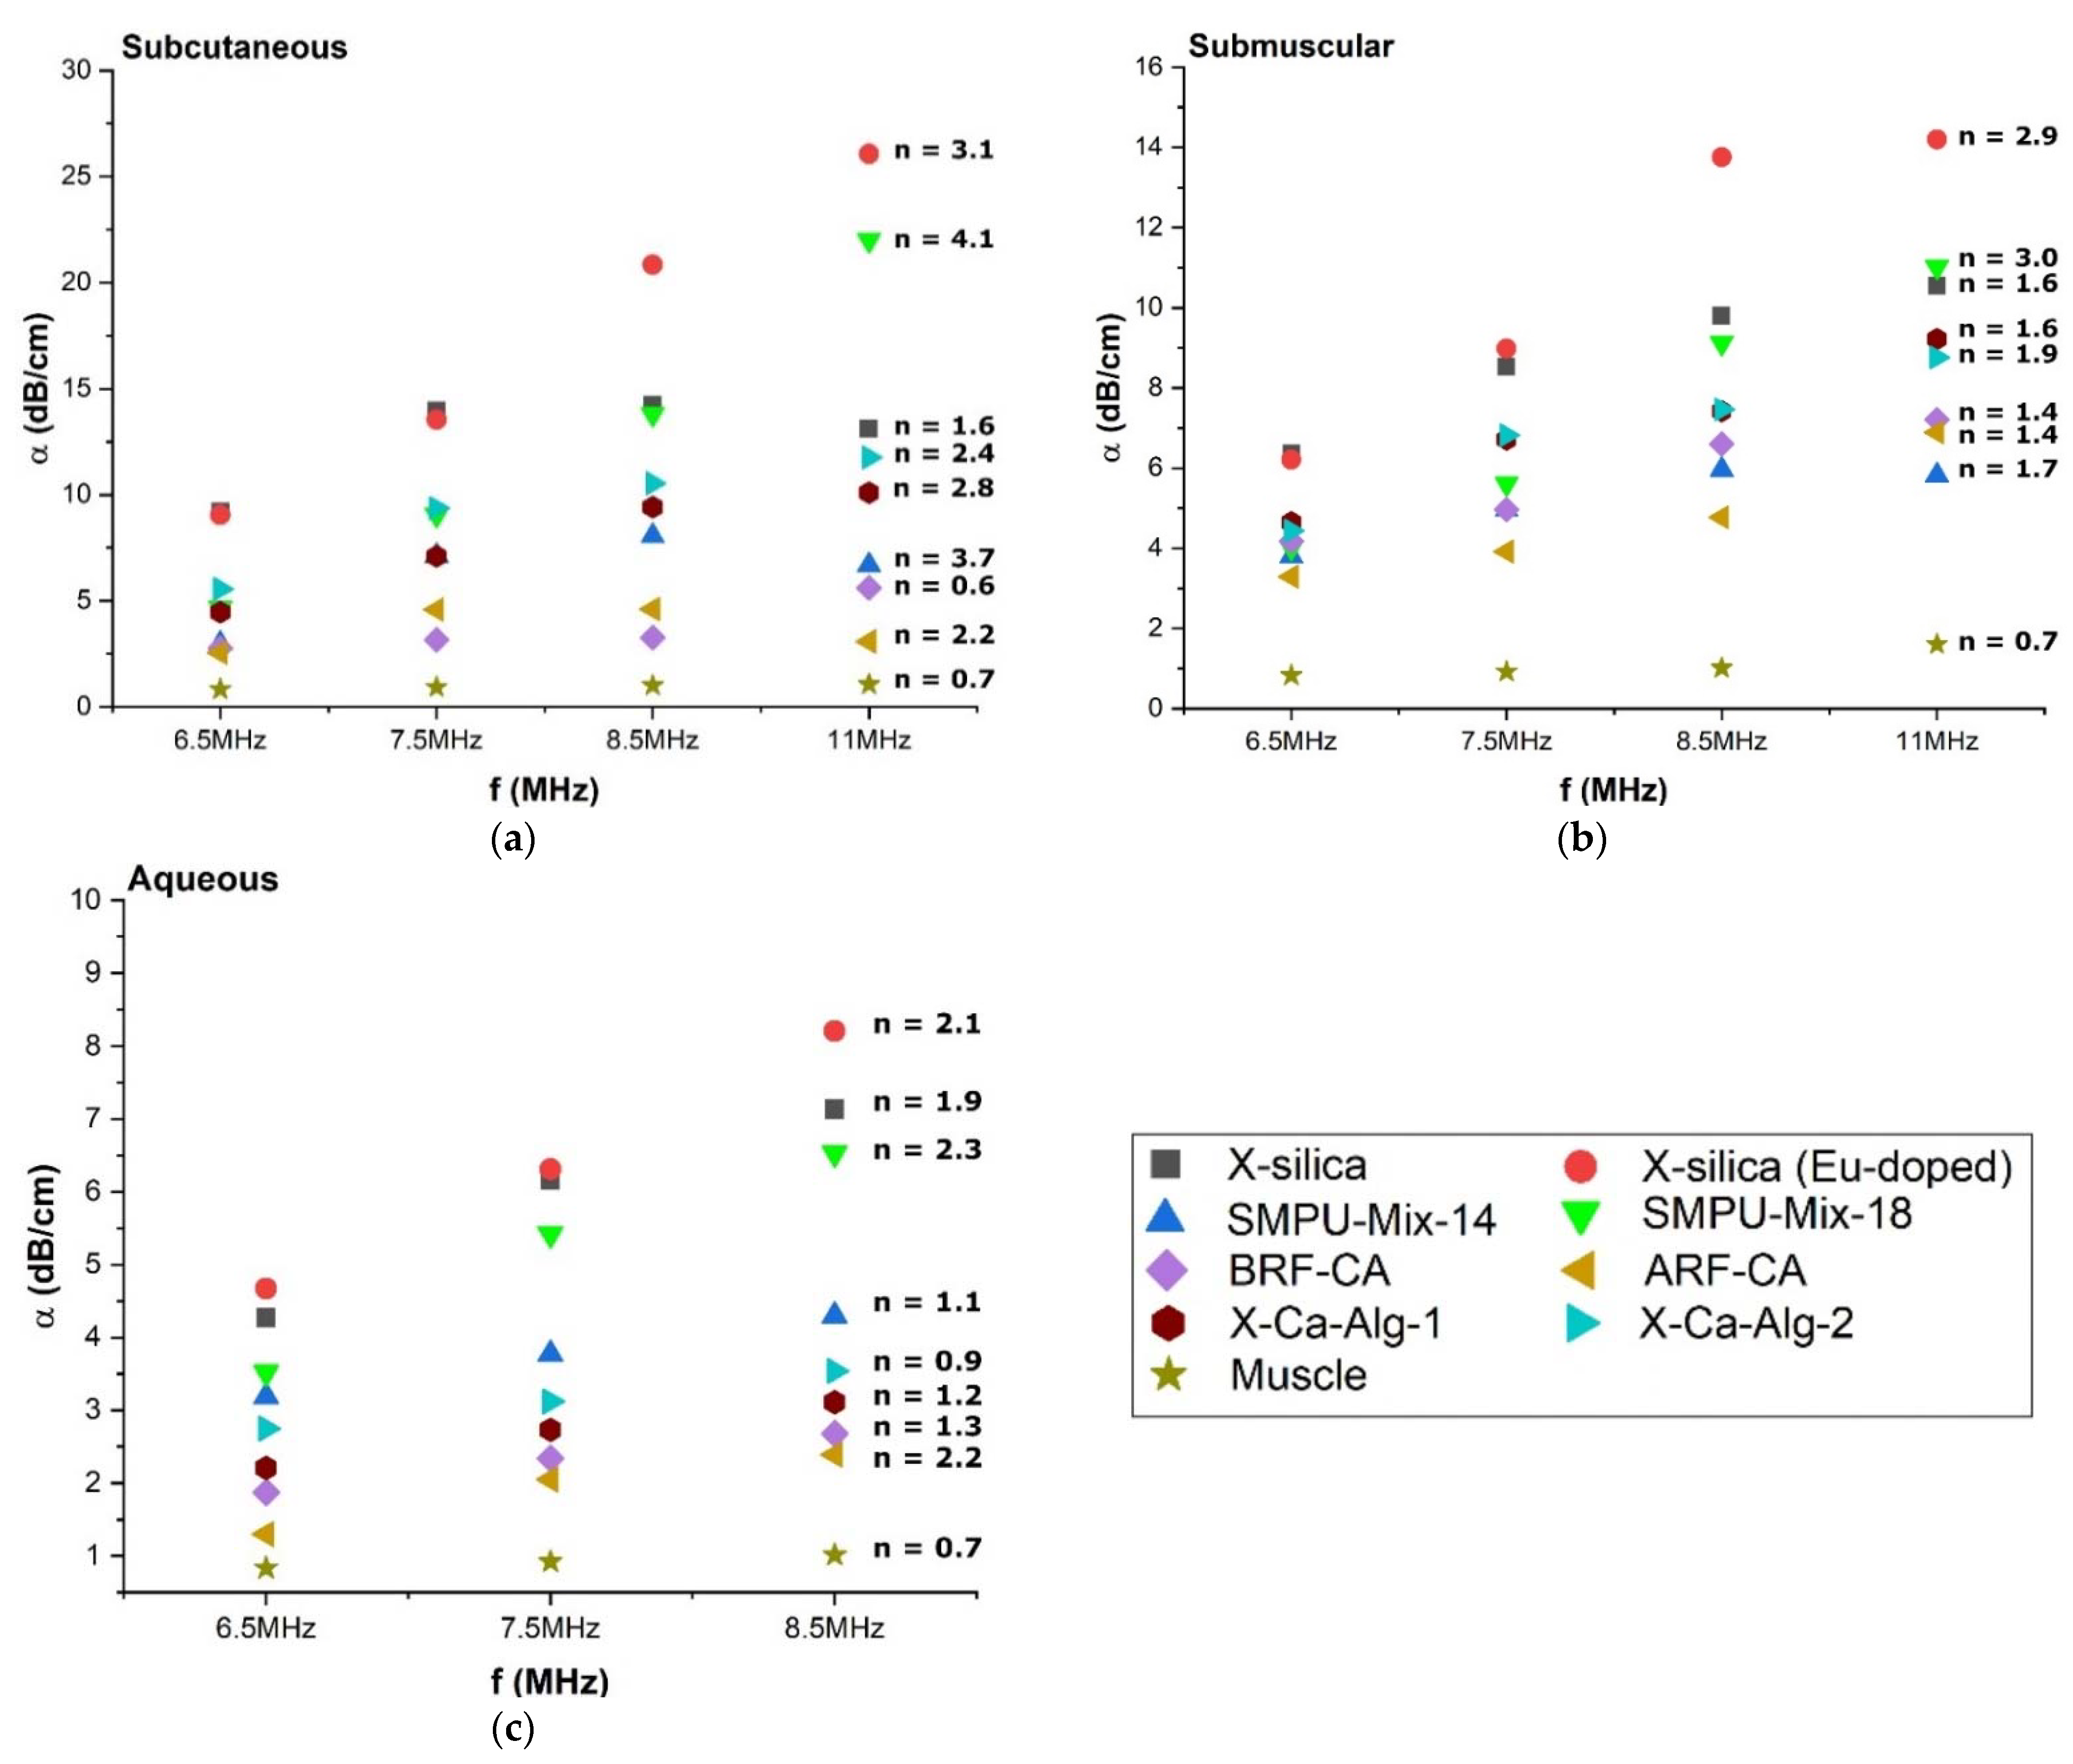
3.4. Attenuation Coefficient (α) of Aerogel Implants
3.4.1. Effect of Environments on Attenuation Coefficient (α)
3.4.2. Attenuation Coefficient (α) Dependency on Scan Frequency
3.4.3. Effect of Temperature on Attenuation Coefficient (α)
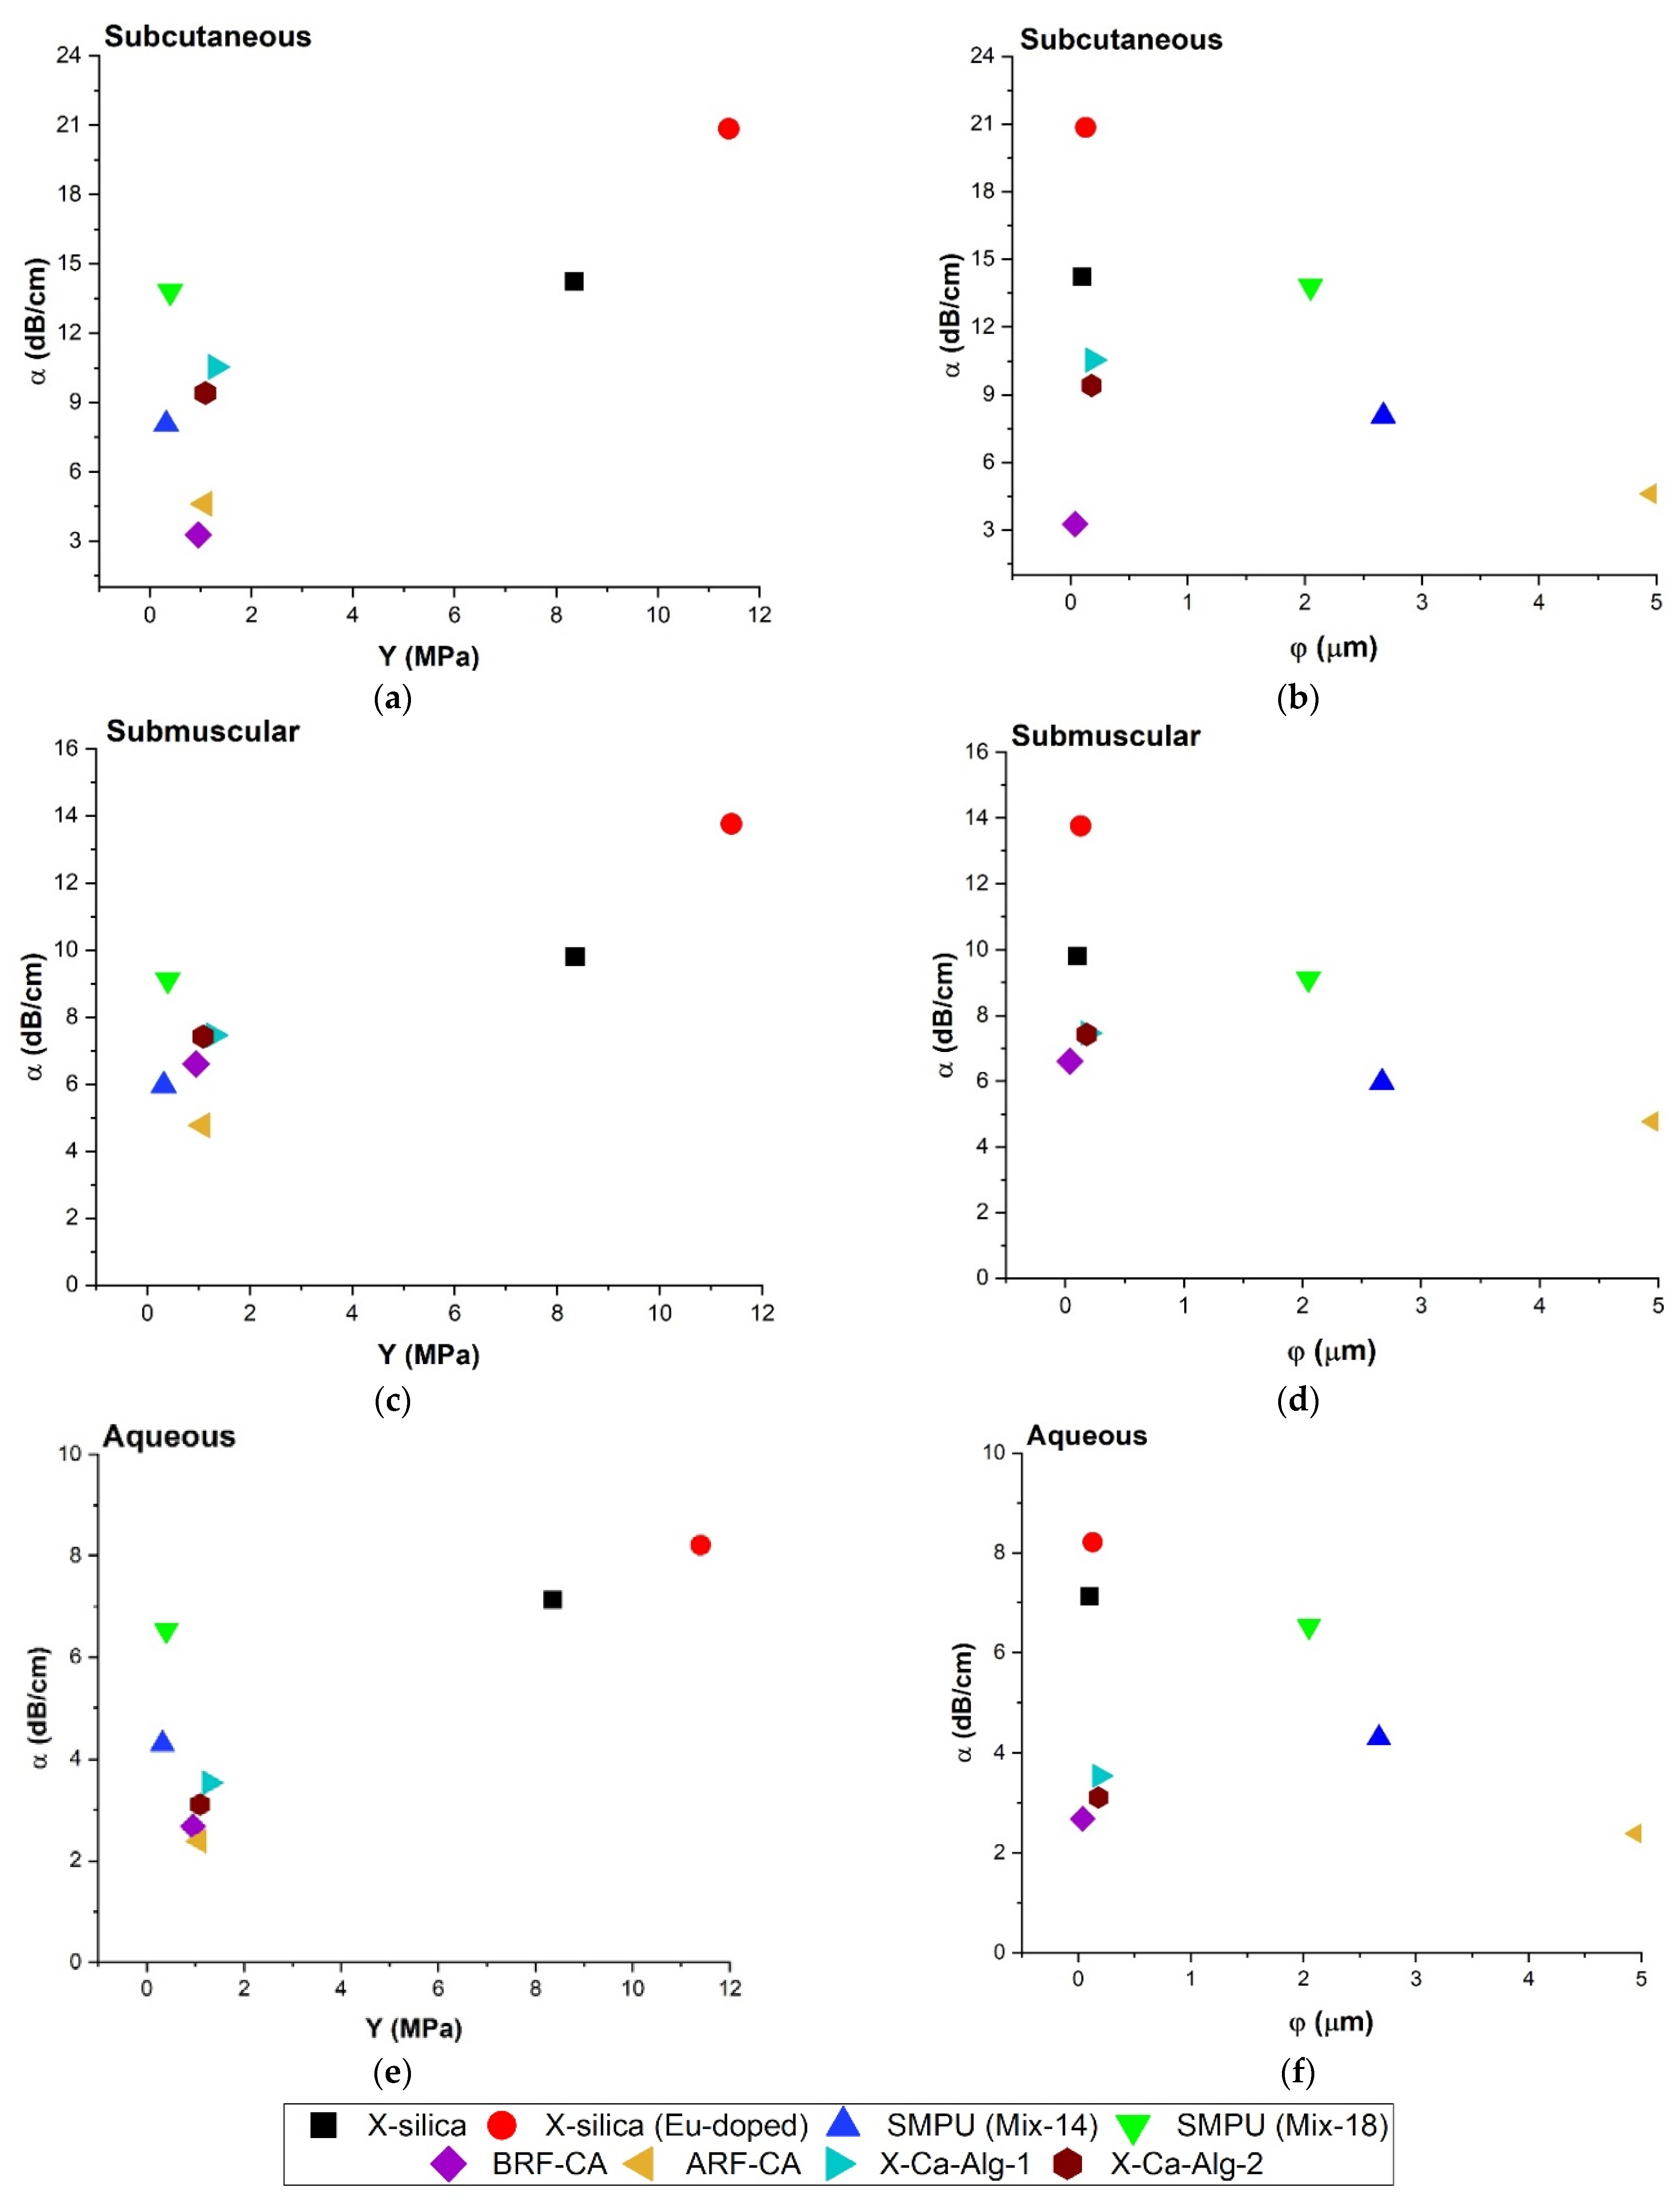
3.4.4. Relationship between Attenuation Coefficient (α), Young’s Modulus (Y), and Pore Diameter (φ)
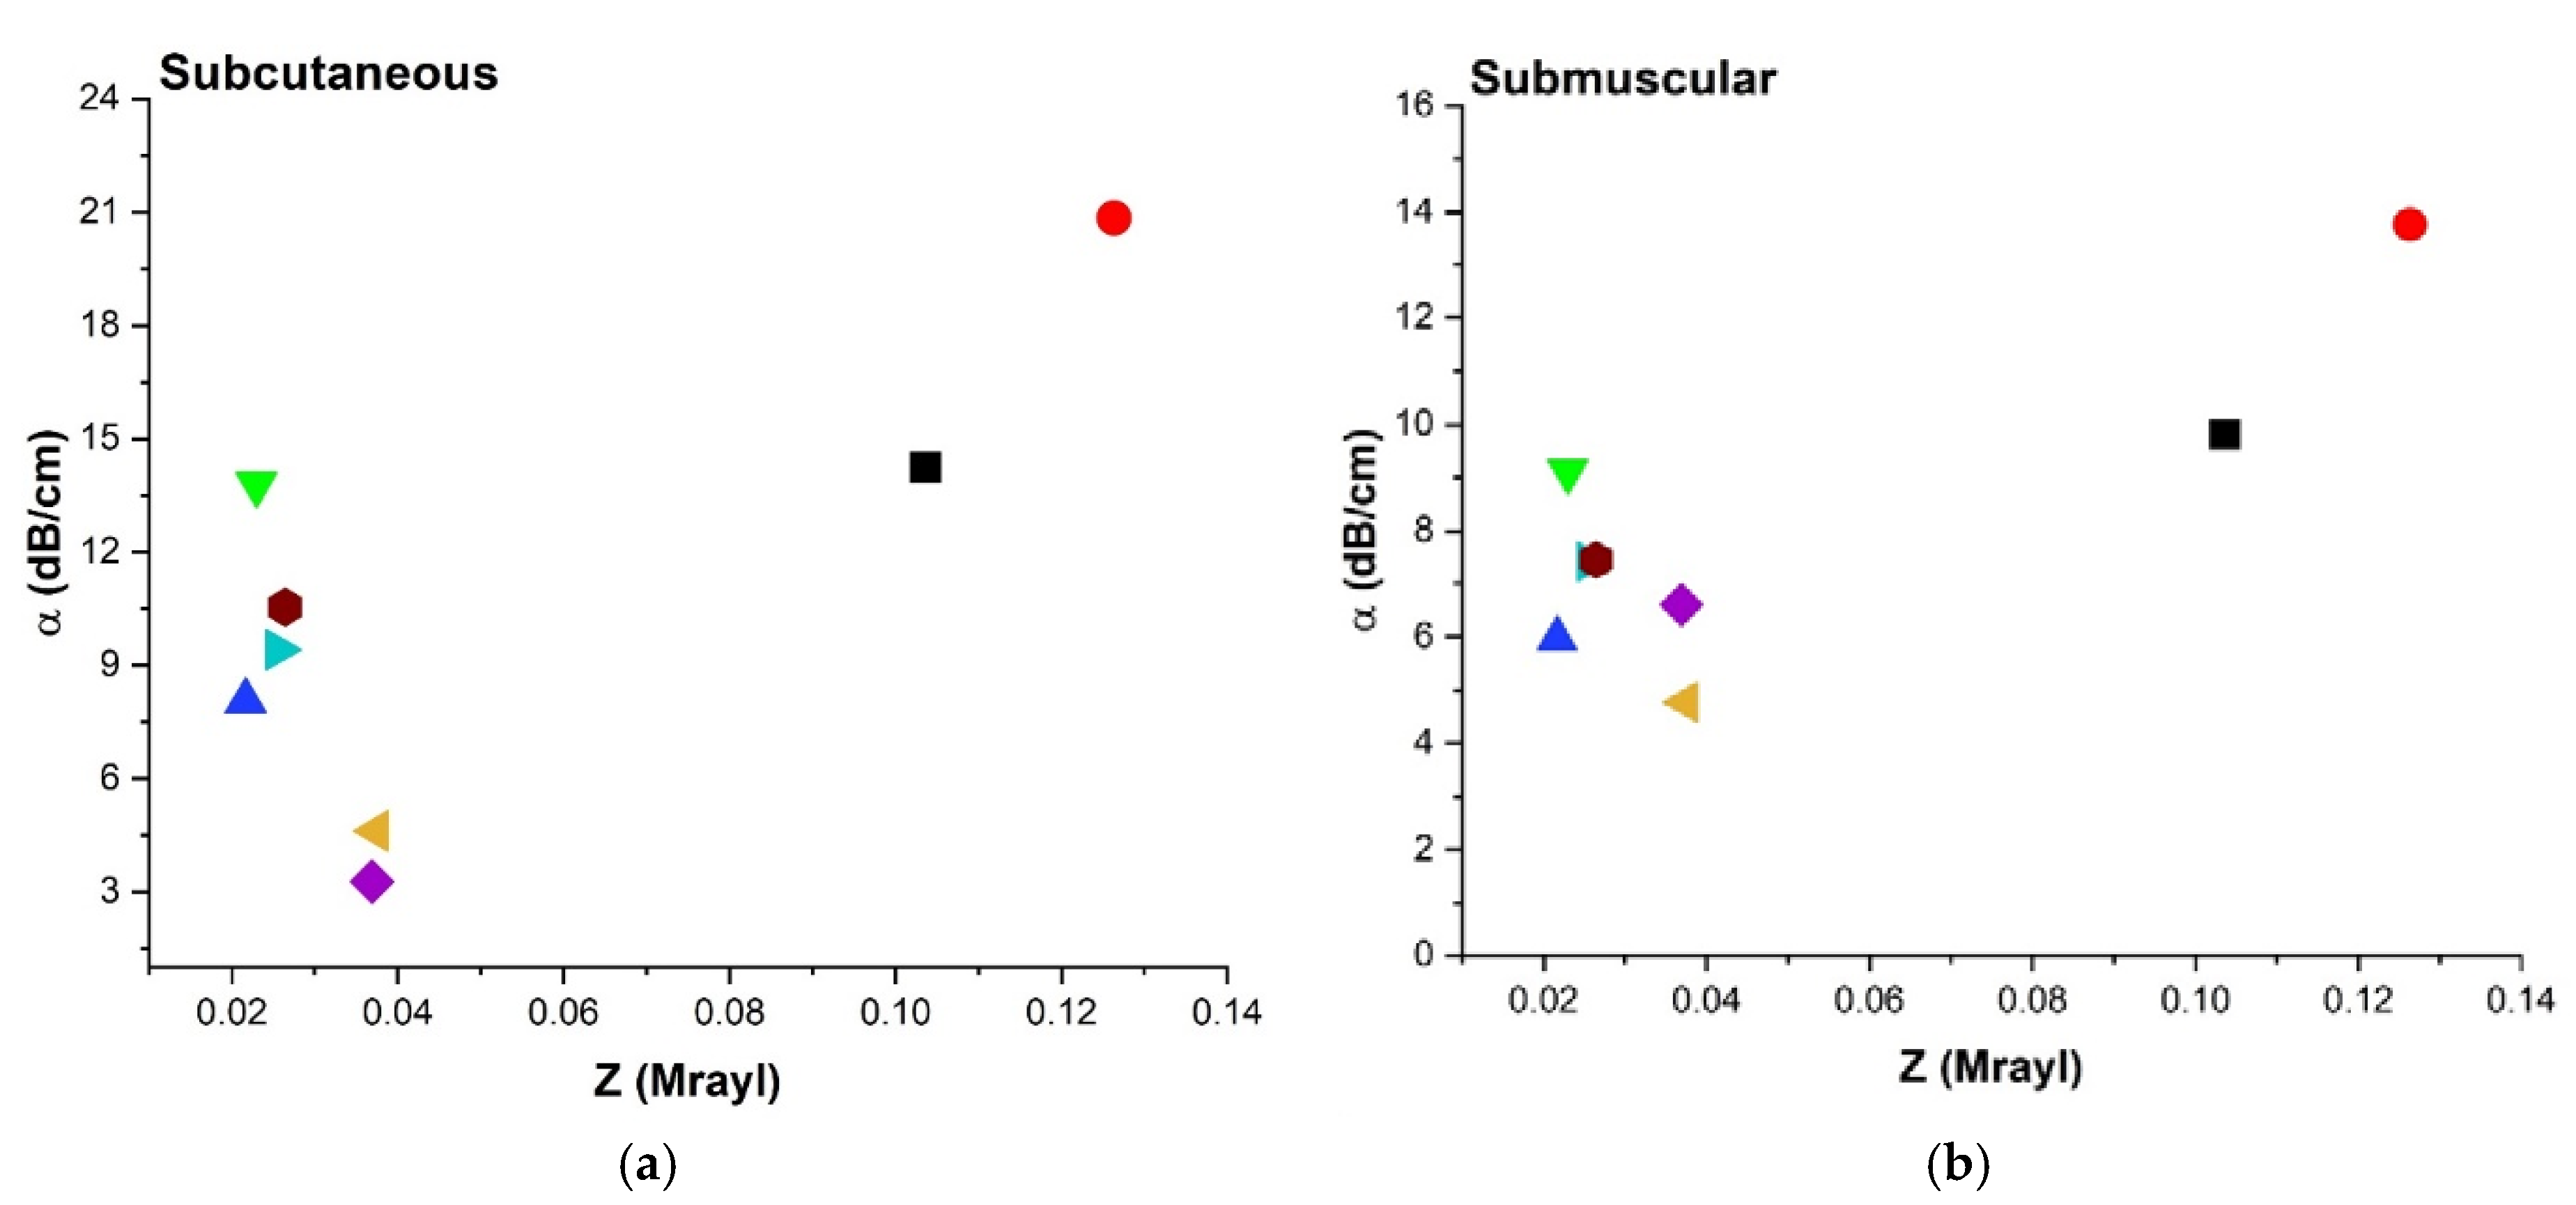
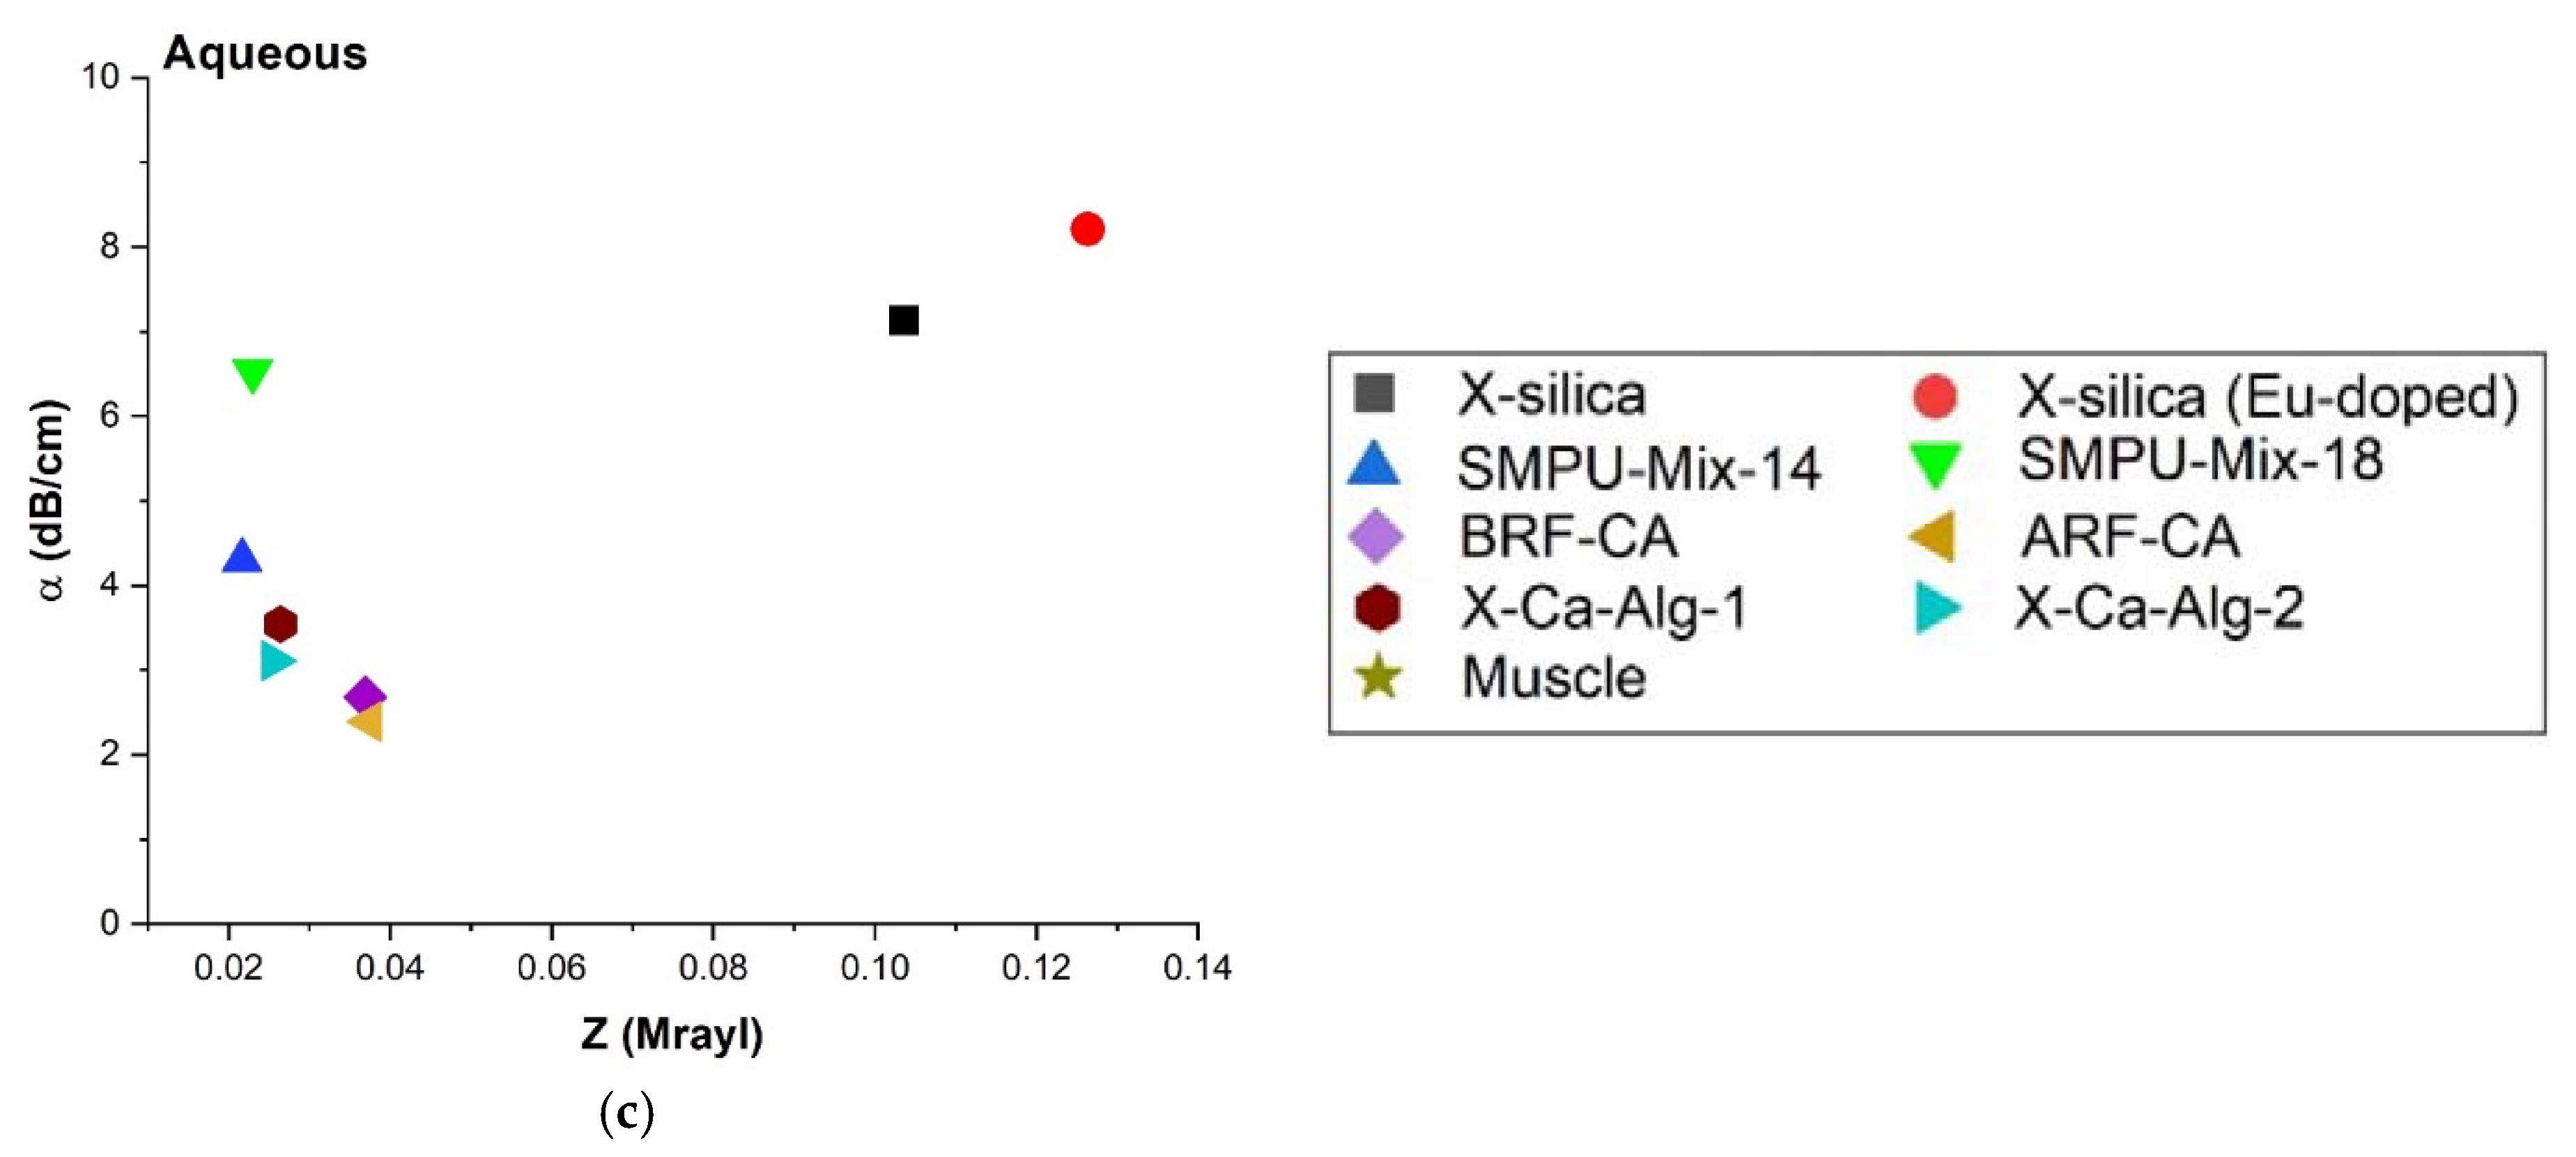
3.4.5. Acoustic Impedance (Z) and Attenuation Coefficient (α)
3.5. Echogenicity
4. Discussion
4.1. Ultrasonography and Aerogel Dimensional Analyis
4.2. Wave Propagation in Aerogels
4.3. Attenuation Coefficient (α) of Aerogels
4.3.1. Attenuation Coefficient (α) Comparison at Different Frequencies
4.3.2. Effect of Temperature on Attenuation Coefficient (α)
4.3.3. Attenuation Coefficient (α), Pore Diameter (φ) and Young’s Modulus (Y)
4.3.4. Attenuation Coefficient (α), Impedance
4.4. Echogenicity
5. Conclusions
Author Contributions
Funding
Institutional Review Board Statement
Informed Consent Statement
Data Availability Statement
Conflicts of Interest
References
- Naumova, A.V.; Modo, M.; Moore, A.; Murry, C.E.; Frank, J.A. Clinical Imaging in Regenerative Medicine. Nat. Biotechnol. 2015, 32, 804–818. [Google Scholar] [CrossRef] [PubMed] [Green Version]
- Berry, D.B.; Englund, E.K.; Chen, S.; Frank, L.R.; Ward, S.R. Medical Imaging of Tissue Engineering and regenerative medicine constructus. Biomater. Sci. 2021, 9, 301–314. [Google Scholar] [CrossRef] [PubMed]
- Solorio, L.; Babin, B.M.; Patel, R.B.; Mach, J.; Exner, A.A. Noninvasive Characterization of In situ Forming Implants Using Diagnostic Ultrasound. J. Control. Release 2010, 143, 186–190. [Google Scholar] [CrossRef] [PubMed] [Green Version]
- Ashokkumbar, M. The characterization of acoustic cavitation bubbles–An overview. Ultrason. Sonochem. 2011, 18, 864–872. [Google Scholar] [CrossRef]
- Maulik, D. Biological safety of diagnostic sonography. In Doppler Ultrasound in Obstetrics and Gynecology; Springer: Berlin, Germany, 2005; pp. 9–111. [Google Scholar] [CrossRef]
- Hendee, W.R.; Ritenour, R. Ultrasound waves. In Medical Imaging Physics; Wiley-Liss: New York, NY, USA, 2003; pp. 304–316. [Google Scholar]
- Carovac, A.; Smajlovic, F.; Junuzovic, D. Application of Ultrasond in Medicine. Acta Inform. Med. 2011, 19, 168–171. [Google Scholar] [CrossRef] [Green Version]
- Shore, D.; Woods, M.O.; Miles, C.A. Attenuation of ultrasound in post rigor bovine skeletal muscle. Ultrasonics 1986, 24, 81–87. [Google Scholar] [CrossRef]
- Nielsen, P.K.; Jensen, B.R.; Darvan, T.; Jorgensen, K.; Bakke, M. Quantitative ultrasound image analysis of the supraspinatus muscle. Clin. Biomech. 2000, 15, S13–S16. [Google Scholar] [CrossRef]
- Marotti, J.; Heger, S.; Tinschet, J.; Trotamano, P.; Chuembou, F.; Radermacher, K.; Wolfart, S. Recent advances of ultrasound imaging in dentistry—A review of the literature. Oral Maxillofac. Radiol. 2013, 115, 819–832. [Google Scholar] [CrossRef]
- Ferreira-Gonçalves, T.; Constantin, C.; Neagu, M.; Reis, C.P.; Sabri, F.; Simón-Vázquez, R. Safety and efficacy assessment of aerogels for biomedical applications. Biomed. Pharmacother. 2021, 144, 112356. [Google Scholar] [CrossRef]
- Garcia-Gonzalez, C.A.; Alnaief, M.; Smirnova, I. Polysaccharide-based aerogels-Promising biodegradable carriers for drug delivery systems. Carbohydr. Polym. 2011, 86, 1425–1438. [Google Scholar] [CrossRef]
- García-González, C.A.; Budtova, T.; Durães, L.; Erkey, C.; del Gaudio, P.; Gurikov, P.; Koebel, M.; Liebner, F.; Neagu, M.; Smirnova, I. An Opinion Paper on Aerogels for Biomedical andEnvironmental Applications. Molecules 2019, 24, 1815. [Google Scholar] [CrossRef] [PubMed] [Green Version]
- Sabri, F.; Sebelik, M.E.; Meacham, R.; Boughter, J.D., Jr.; Challis, M.J.; Leventis, N. In Vivo Ultrasonic Detection of Polyurea Crosslinked Silica Aerogel Implants. PLoS ONE 2013, 8, e66348. [Google Scholar] [CrossRef] [PubMed] [Green Version]
- Sabri, F.; Cole, J.A.; Scarbrough, M.C.; Leventis, N. Investigation of Polyurea-Crosslinked Silica Aerogels as a Neuronal Scaffold: A Pilot Study. PLoS ONE 2012, 7, e33242. [Google Scholar] [CrossRef] [PubMed] [Green Version]
- Sabri, F.; Boughter, J.D., Jr.; Gerth, D.; Skalli, O.; Phung, T.-C.N.; Tamula, G.-R.M.; Leventis, N. Histological Evaluation of the Biocompatibility of Polyurea Crosslinked Silica Aerogel Implants in a Rat Model: A Pilot Study. PLoS ONE 2012, 7, e50686. [Google Scholar] [CrossRef] [Green Version]
- Sabri, F.; Gerth, D.; Tamula, G.-R.M.; Phung, T.-C.N.; Lynch, K.J.; Boughter, J.D., Jr. Novel Technique for Repair of Severed Peripheral Nerves in Rats Using Polyurea Crosslinked Silica Aerogel Scaffold. J. Investig. Surg. 2014, 27, 294–303. [Google Scholar] [CrossRef]
- Lynch, K.J.; Skalli, O.; Sabri, F. Growing Neural PC-12 Cell on Crosslinked Silica Aerogels Increases Neurite Extension in the Presence of an Electric Field. J. Funct. Mater. 2018, 9, 30. [Google Scholar] [CrossRef] [Green Version]
- Lynch, K.J.; Skalli, O.; Sabri, F. Investigation of surface topography and stiffness on adhesion and neurites extension of PC12 cells on crisslinked silica aerogel substrates. PLoS ONE 2017, 12, e185978. [Google Scholar] [CrossRef] [Green Version]
- Yin, W.; Rubenstein, D.A. Biomedical Applications of Aerogels. In Aerogels Handbook; Springer: New York, NY, USA, 2011; pp. 683–694. [Google Scholar]
- Yin, W.; Subramaniam, V.M.; Jarrett, E.; Staggs, S.; Leventis, N.; Lu, H.; Rubenstein, D.A. Biocompatibility of surfactant-templated polyurea–nanoencapsulated macroporous silica aerogels with plasma platelets and endothelial cells. J. Biomed. Mater. Res. Part A 2009, 92, 1431–1439. [Google Scholar] [CrossRef]
- Dong, S.; Zhang, Y.; Wan, J.; Cui, R.; Yu, X.; Zhao, G.; Lin, K. A novel multifunctional carbon aerogel-coated platfrom for osteosarcoma therapy and enhanced bone regeneration. J. Mater. Chem. B 2020, 8, 368–379. [Google Scholar] [CrossRef]
- Goimil, L.; Santos-Rosales, V.; Delgado, A.; Evora, C.; Reyes, R.; Lozano-Perez, A.A.; Aznar-Cervantes, S.D.; Cenis, J.L.; Gomez-Amoza, J.L.; Concheiro, A.; et al. scCO2-foamed silk fibroin aerogel/poly(ε-caprolactone) scaffolds containing dexamethasone for bone regeneration. J. CO2 Util. 2019, 31, 51–64. [Google Scholar] [CrossRef]
- Aegerter, M.A.; Leventis, N.; Koebel, M.M. Aerogels Handbook; Springer: New York, NY, USA, 2011. [Google Scholar]
- Sala, M.R.; Chandrasekaran, S.; Skalli, O.; Worsley, M.; Sabri, F. Enhanced neurite outgrowth on electrically conductive carbon aerogel substrates in the presence of an external electric field. Soft Matter 2021, 17, 4489–4495. [Google Scholar] [CrossRef] [PubMed]
- Sala, M.R.; Lynch, K.J.; Chandrasekaran, S.; Skalli, O.; Worsley, M.; Sabri, F. PC-12 cells adhesion and differentiation on carbon aerogel scaffolds. MRS Commun. 2018, 8, 1426–1432. [Google Scholar] [CrossRef]
- Sala, M.R.; Peng, C.; Skalli, O.; Sabri, F. Tunable neuronal scaffold biomaterials through plasmonic photo-patterning of aerogels. MRS Commun. 2019, 9, 1249–1255. [Google Scholar] [CrossRef]
- Sala, M.R.; Skalli, O.; Leventis, N.; Sabri, F. Nerve Response to Superelastic Shape Memory Polyurethane Aerogels. Polymers 2020, 12, 2995. [Google Scholar] [CrossRef] [PubMed]
- Mandal, C.; Donthula, S.; Far, H.M.; Saeed, A.M.; Sotiriou-Leventis, C.; Leventis, N. Transparent, Mechanically Strong, Thermally Insulating Cross-linked Silica Aerogels for Energy-efficient Windows. J. Sol-Gel Sci. Technol. 2019, 92, 84–100. [Google Scholar] [CrossRef]
- Leventis, N. Three Dimensional Core-Shell Superstructures: Mechanically Strong Aerogels. Acc. Chem. Res. 2007, 40, 874–884. [Google Scholar] [CrossRef]
- Donthula, S.; Mandal, C.; Schisler, J.; Leventis, T.; Meador, M.A.B.; Sotiriou-Leventis, C.; Leventis, N. Nanostructure-Dependent Marcus-Type Correlation of the Shape. Appl. Mater. Interfaces 2018, 10, 23321–23334. [Google Scholar] [CrossRef]
- Chandrasekaran, S.; Campbell, P.G.; Baumann, T.F.; Worsley, M.A. Carbon aerogel evolution: Allotrope, graphene-inspired, and 3D-printed aerogels. J. Mater. Res. 2017, 32, 4166–4185. [Google Scholar] [CrossRef] [Green Version]
- Worsley, M.A.; Baumann, T.F. Carbon Aerogels. In Hanbook of Sol-Gel Science and Technology; Springer International Publishing: New York, NY, USA, 2016. [Google Scholar]
- Paraskevopoulou, P.; Smirnova, I.; Athamneh, T.; Papastergiou, M.; Chriti, D.; Mali, G.; Cendak, T.; Raptopoulos, G.; Gurikov, P. Polyurea-crosslinked biopolymer aerogel beads. RSC Adv. 2020, 10, 40843–40852. [Google Scholar] [CrossRef]
- Paraskevopoulou, P.; Smirnova, I.; Athamneh, T.; Papastergiou, M.; Chriti, D.; Mali, G.; Cendak, T.; Chatzichristidi, M.; Raptopoulous, G.; Gurikov, P. Mechanically Strong Polyurea/Polyurethane-Cross-Linked AlginateAerogels. ACS Appl. Polym. Mater. 2020, 2, 1974–1988. [Google Scholar] [CrossRef]
- Allison, S.W.; Baker, E.S.; Lynch, K.J.; Sabri, F. In Vivo X-Ray Imaging of Phosphor-Doped PDMS and Phosphor-Doped Aerogel Biomaterials. Int. J. Polym. Mater. Polym. Biomater. 2015, 64, 823–830. [Google Scholar] [CrossRef]
- Allison, S.W.; Baker, E.S.; Lynch, K.J.; Sabri, F. In vivo X-Ray excited optical luminescence from phosphor-doped aerogel and Sylgard 184 composites. Radiat. Phys. Chem. 2017, 135, 88–93. [Google Scholar] [CrossRef]
- Donthula, S.; Mandal, C.; Leventis, T.; Schisler, J.; Saeed, A.M.; Sotiriou-Leventis, C.; Leventis, N. Shape-Memory Poly(isocyanurate-urethane) (PIR-PUR) Aerogels for Deployable Panels and Biomimetic Applications. Chem. Mater. 2017, 29, 4461–4477. [Google Scholar] [CrossRef]
- Malakooti, S.; ud Doulah, A.B.M.S.; Ren, Y.; Kulkarni, V.N.; Soni, R.U.; Edlabadkar, V.A.; Zhang, R.; Vivod, S.L.; Sotiriou-Leventis, C.; Leventis, N.; et al. Meta-Aerogels: Auxetic Shape-memory Polyurethane Aerogels. ACS Appl. Polym. Mater. 2021, 3, 5727–5738. [Google Scholar] [CrossRef]
- Smith, N.S.; Andrew, W. Introduction to Medical Imaging; Cambridge University Press: Cambridge, UK, 2010. [Google Scholar]
- Cobbold, C.R.S. Foundations of Biomedical Ultrasound; Oxford University Press: Oxford, UK, 2007. [Google Scholar]
- Yousefian, O.; Karbalaeisadegh, Y.; Muller, M. Modeling ultrasound attenuation in porous structures with mono-disperse random pore distributions using the independent scattering approximation: A 2D simulation study. Phys. Med. Biol. 2019, 64, 155013. [Google Scholar] [CrossRef] [PubMed]
- Gross, J.; Fricke, J.; Hrubesh, L.W. Sound propagation in SiO2 aerogels. J. Acoust. Soc. Am. 1992, 91, 2004–2006. [Google Scholar] [CrossRef]
- Tada, T.; Iijima, H.; Kobayashi, N.; Yoshida, M.; Nishimura, T.; Kumada, T.; Kondo, R.; Yano, H.; Kage, M.; Nakano, C.; et al. Usefulness of Attenuation Imaging with an Ultrasound Scanner for the Evaluation of Hepatic Steatosis. Ultrasound Med. Biol. 2019, 45, 2679–2687. [Google Scholar] [CrossRef]
- Damianou, C.A.; Sanghvi, N.T.; Fry, F.J.; Maass-Moreno, R. Dependence of Ultrasonic Attenuation and Absorption in Dog Soft Tissues on Temperature and Thermal Dose. 1997. Available online: http://asadl.org/terms (accessed on 2 September 2021).
- Ghoshal, G.; Luchies, A.C.; Blue, J.P.; Oelze, M.L. Temperature dependent ultrasonic characterization of biological media. J. Acoust. Soc. Am. 2011, 130, 2203–2211. [Google Scholar] [CrossRef] [Green Version]
- Shishitani, T.; Yoshizawa, S.; Umemura, S.-I. Change in acoustic impedance and sound speed of excised chicken breast muscle by high-intensityfocused ultrasound HIFU-exposure. In Nano-Biomedical Engineering 2012; Imperial College Press: London, UK, 2012; pp. 317–324. [Google Scholar] [CrossRef]


| Aerogel Type | Material Type | References | Symbols |
|---|---|---|---|
| 1. Crosslinked Silica | Polyurea-Crosslinked Silica Aerogel (X-silica aerogels) | [14,15,16,17,18,19,29,30] |  |
| 2. Phosphor doped X-silica | X-silica-La2O2S:Eu 10% doped | [36,37] |  |
| 3. Shape Memory Polyurethane (SMPU) | SMPU Mix-14 TEG 1 mol/mol | [31,38,39] |  |
| SMPU Mix-18 DEG 0.25 mol/mol, TEG 0.5 mol/mol, TTEG 0.25 mol/mol |  | ||
| 4. Carbon Aerogel (CA) | Acid-catalyzed Resorcinol Formaldehyde CA (ARF-CA) | [32,33] |  |
| Base-catalyzed Resorcinol Formaldehyde CA (BRF-CA) |  | ||
| 5. Polyurea-crosslinked calcium alginate (X-Ca-Alginate) | X-Ca-Alg-1 | [34,35] |  |
| X-Ca-Alg-2 |  |
| Equation | Parameters | References | |
|---|---|---|---|
| Y = Stress/Strain | (1) | Young’s modulus (Y): | [40] |
| Z = ρ √Y/ρ = ρv | (2a) | Acoustic Impedance (Z): | |
| v = √Y/ρ | (2b) | Speed of sound (v): | |
| I(t) = Io exp(−αt) | (3a) | Change in US intensity: | |
| α = αοfn | (3b) | Attenuation (α): | [41] |
| Echogenicity (E): | |||
| ΔE = [(MPIROI-3 − MPIROI-1)/MPIROI-1] × 100 | (4a) | At implant area: | |
| ΔE = [(MPIROI-4 − MPIROI-2)/MPIROI-2] × 100 | (4b) | At posterior shadowing: | |
| α = (γs¤)/2 | (5a) | Attenuation (α): | [42] |
| γ = 4ϑ#/(πφ2) | (5b) | Pore-density (γ*): | |
| [(ZTissue-ZAerogel)/ZTissue] × 100 | (6) | Impedance mismatch: | |
| Change in Pixel Intensity in ROI (%) | Classification |
|---|---|
| ~0% | Isoechoic |
| >1% | Hyperechoic |
| <−1% | Hypoechoic |
| ~−100% | Anechoic |
| Aerogels | Y (Mpa) | Density ρ (kg/m3) | Speed v (m/s) | Z (Mrayl) | Pore Diameter φ (µm) |
|---|---|---|---|---|---|
| X-silica | 8.35 ± 2.68 | 729.48 | 80.58 | 0.104 | 0.1 ± 0.012 |
| X-silica-La2O2S:Eu | 11.40 ± 2.20 | 939.20 | 90.21 | 0.126 | 0.13 ± 0.01 |
| X-Ca-Alg-1 | 1.3 ± 0.2 | 88.76 | 48.80 | 0.026 | 0.19 ± 0.01 |
| X-Ca-Alg-2 | 1.09 ± 0.02 | 150.49 | 42.48 | 0.026 | 0.18 ± 0.01 |
| BRF-CA | 0.95 ± 0.10 | 883.06 | 25.74 | 0.038 | 0.04 ± 0.001 |
| ARF-CA | 0.91 ± 0.09 | 826.62 | 28.83 | 0.040 | 5.00 ± 0.17 |
| SMPU-Mix-18 | 0.40 ± 0.07 | 672.07 | 17.41 | 0.025 | 2.05 ± 0.19 |
| SMPU-Mix-14 | 0.32 ± 0.07 | 637.01 | 14.75 | 0.022 | 2.67 ± 0.16 |
| Aerogel Type | US Image | Normalized Intensity Map | 3D Intensity Map | |
|---|---|---|---|---|
| 1 | Muscle | 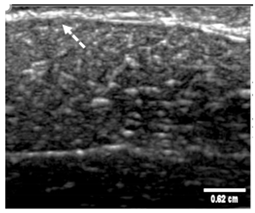 | 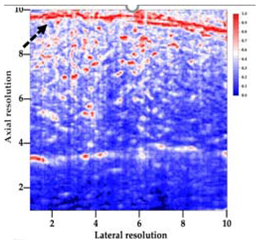 |  |
| 2 | X-silica |  | 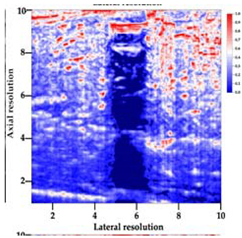 |  |
| 3 | X-silica-La2O2S:Eu | 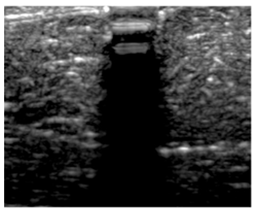 | 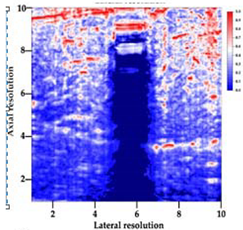 |  |
| 4 | SMPU-Mix-14 | 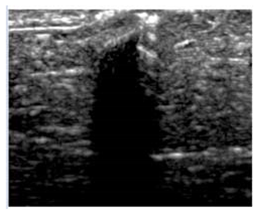 |  |  |
| 5 | SMPU-Mix-18 |  | 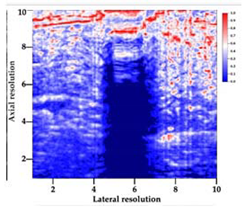 | 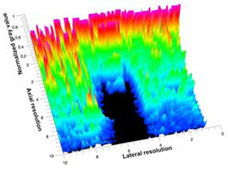 |
| 6 | BRF-CA | 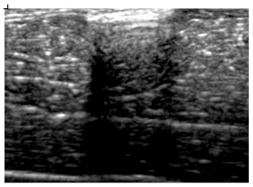 | 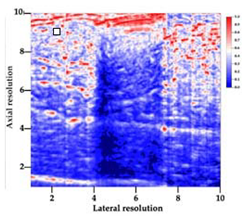 | 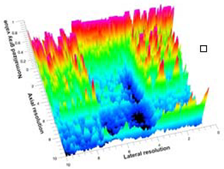 |
| 7 | ARF-CA |  | 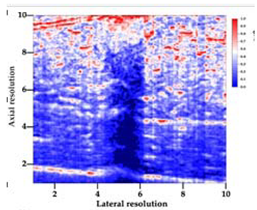 | 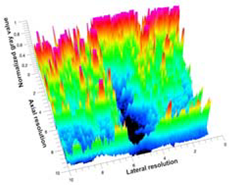 |
| 8 | X-Ca-Alg-2 | 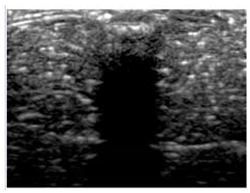 | 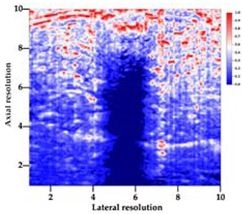 | 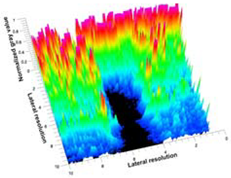 |
| 9 | X-Ca-Alg-1 | 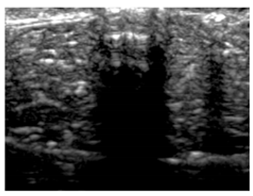 | 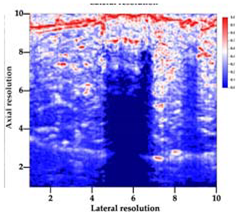 |  |
| Aerogel | Aq Attenuation α (dB/cm) | SM Attenuation α (dB/cm) | SC Attenuation α (dB/cm) |
|---|---|---|---|
| X-silica-La2O2S:Eu | 8.21 ± 0.14 | 13.76 ± 1.15 | 20.84 ± 0.14 |
| X-silica | 7.13 ± 0.15 | 9.80 ± 0.38 | 14.24 ± 0.98 |
| SMPU-Mix-18 | 6.53 ± 0.01 | 9.12 ± 0.17 | 13.80 ± 0.07 |
| SMPU-Mix-14 | 4.30 ± 0.88 | 5.96 ± 0.55 | 8.06 ± 0.70 |
| X-Ca-Alg-2 | 3.54 ± 0.09 | 7.46 ± 0.39 | 10.54 ± 0.08 |
| X-Ca-Alg-1 | 3.11 ± 0.12 | 7.42 ± 0.21 | 9.41 ± 0.35 |
| BRF-CA | 2.68 ± 0.35 | 6.60 ± 0.67 | 4.61 ± 0.16 |
| ARF-CA | 2.39 ± 0.44 | 4.77 ± 0.46 | 3.27 ± 0.05 |
| Aerogel Type | Imaging Frequency (MHz) | Optimal Frequency (MHz) | Echogenicity | Image Characteristics | Impedance Mismatch (%) | |
|---|---|---|---|---|---|---|
| Subcutaneous | Submuscular | |||||
| X-silica | 6.5–13.4 | 13.4 MHz | Hypoechoic | Least Hyperechoic | Distinct linear boundary | 92.03 |
| X-silica-La2O2S:Eu | 6.5–13.4 | 13.4 MHz | Hypoechoic | Least Hyperechoic | Distinct linear boundary | 90.28 |
| SMPU-Mix-14 | 6.5–13.4 | 11 MHz | Hyperechoic | Moderately Hyperechoic | Irregular boundary | 98.33 |
| SMPU-Mix-18 | 6.5–13.4 | 11 MHz | Hyperechoic | Moderately Hyperechoic | Irregular boundary | 98.23 |
| BRF-CA | 6.5–13.4 | 13.4 MHz | Hyperechoic | Hyperechoic | Waterfall appearance | 97.16 |
| ARF-CA | 6.5–13.4 | 13.4 MHz | Hyperechoic | Hyperechoic | Waterfall appearance | 97.12 |
| X-Ca-Alg-2 | 6.5–13.4 | 11 MHz | Isoechoic | Strongly Hyperechoic | Irregular boundary | 98.03 |
| X-Ca-Alg-1 | 6.5–13.4 | 11 MHz | Isoechoic | Strongly Hyperechoic | Irregular boundary | 97.97 |
Publisher’s Note: MDPI stays neutral with regard to jurisdictional claims in published maps and institutional affiliations. |
© 2022 by the authors. Licensee MDPI, Basel, Switzerland. This article is an open access article distributed under the terms and conditions of the Creative Commons Attribution (CC BY) license (https://creativecommons.org/licenses/by/4.0/).
Share and Cite
Ghimire, S.; Sala, M.R.; Chandrasekaran, S.; Raptopoulos, G.; Worsley, M.; Paraskevopoulou, P.; Leventis, N.; Sabri, F. Noninvasive Detection, Tracking, and Characterization of Aerogel Implants Using Diagnostic Ultrasound. Polymers 2022, 14, 722. https://doi.org/10.3390/polym14040722
Ghimire S, Sala MR, Chandrasekaran S, Raptopoulos G, Worsley M, Paraskevopoulou P, Leventis N, Sabri F. Noninvasive Detection, Tracking, and Characterization of Aerogel Implants Using Diagnostic Ultrasound. Polymers. 2022; 14(4):722. https://doi.org/10.3390/polym14040722
Chicago/Turabian StyleGhimire, Sagar, Martina Rodriguez Sala, Swetha Chandrasekaran, Grigorios Raptopoulos, Marcus Worsley, Patrina Paraskevopoulou, Nicholas Leventis, and Firouzeh Sabri. 2022. "Noninvasive Detection, Tracking, and Characterization of Aerogel Implants Using Diagnostic Ultrasound" Polymers 14, no. 4: 722. https://doi.org/10.3390/polym14040722