
Effect of Antioxidants on Thermo-Oxidative Stability and Aging of Bio-Based PA56T and Fast Characterization of Anti-Oxidation Performance


Abstract
:1. Introduction
2. Experimental
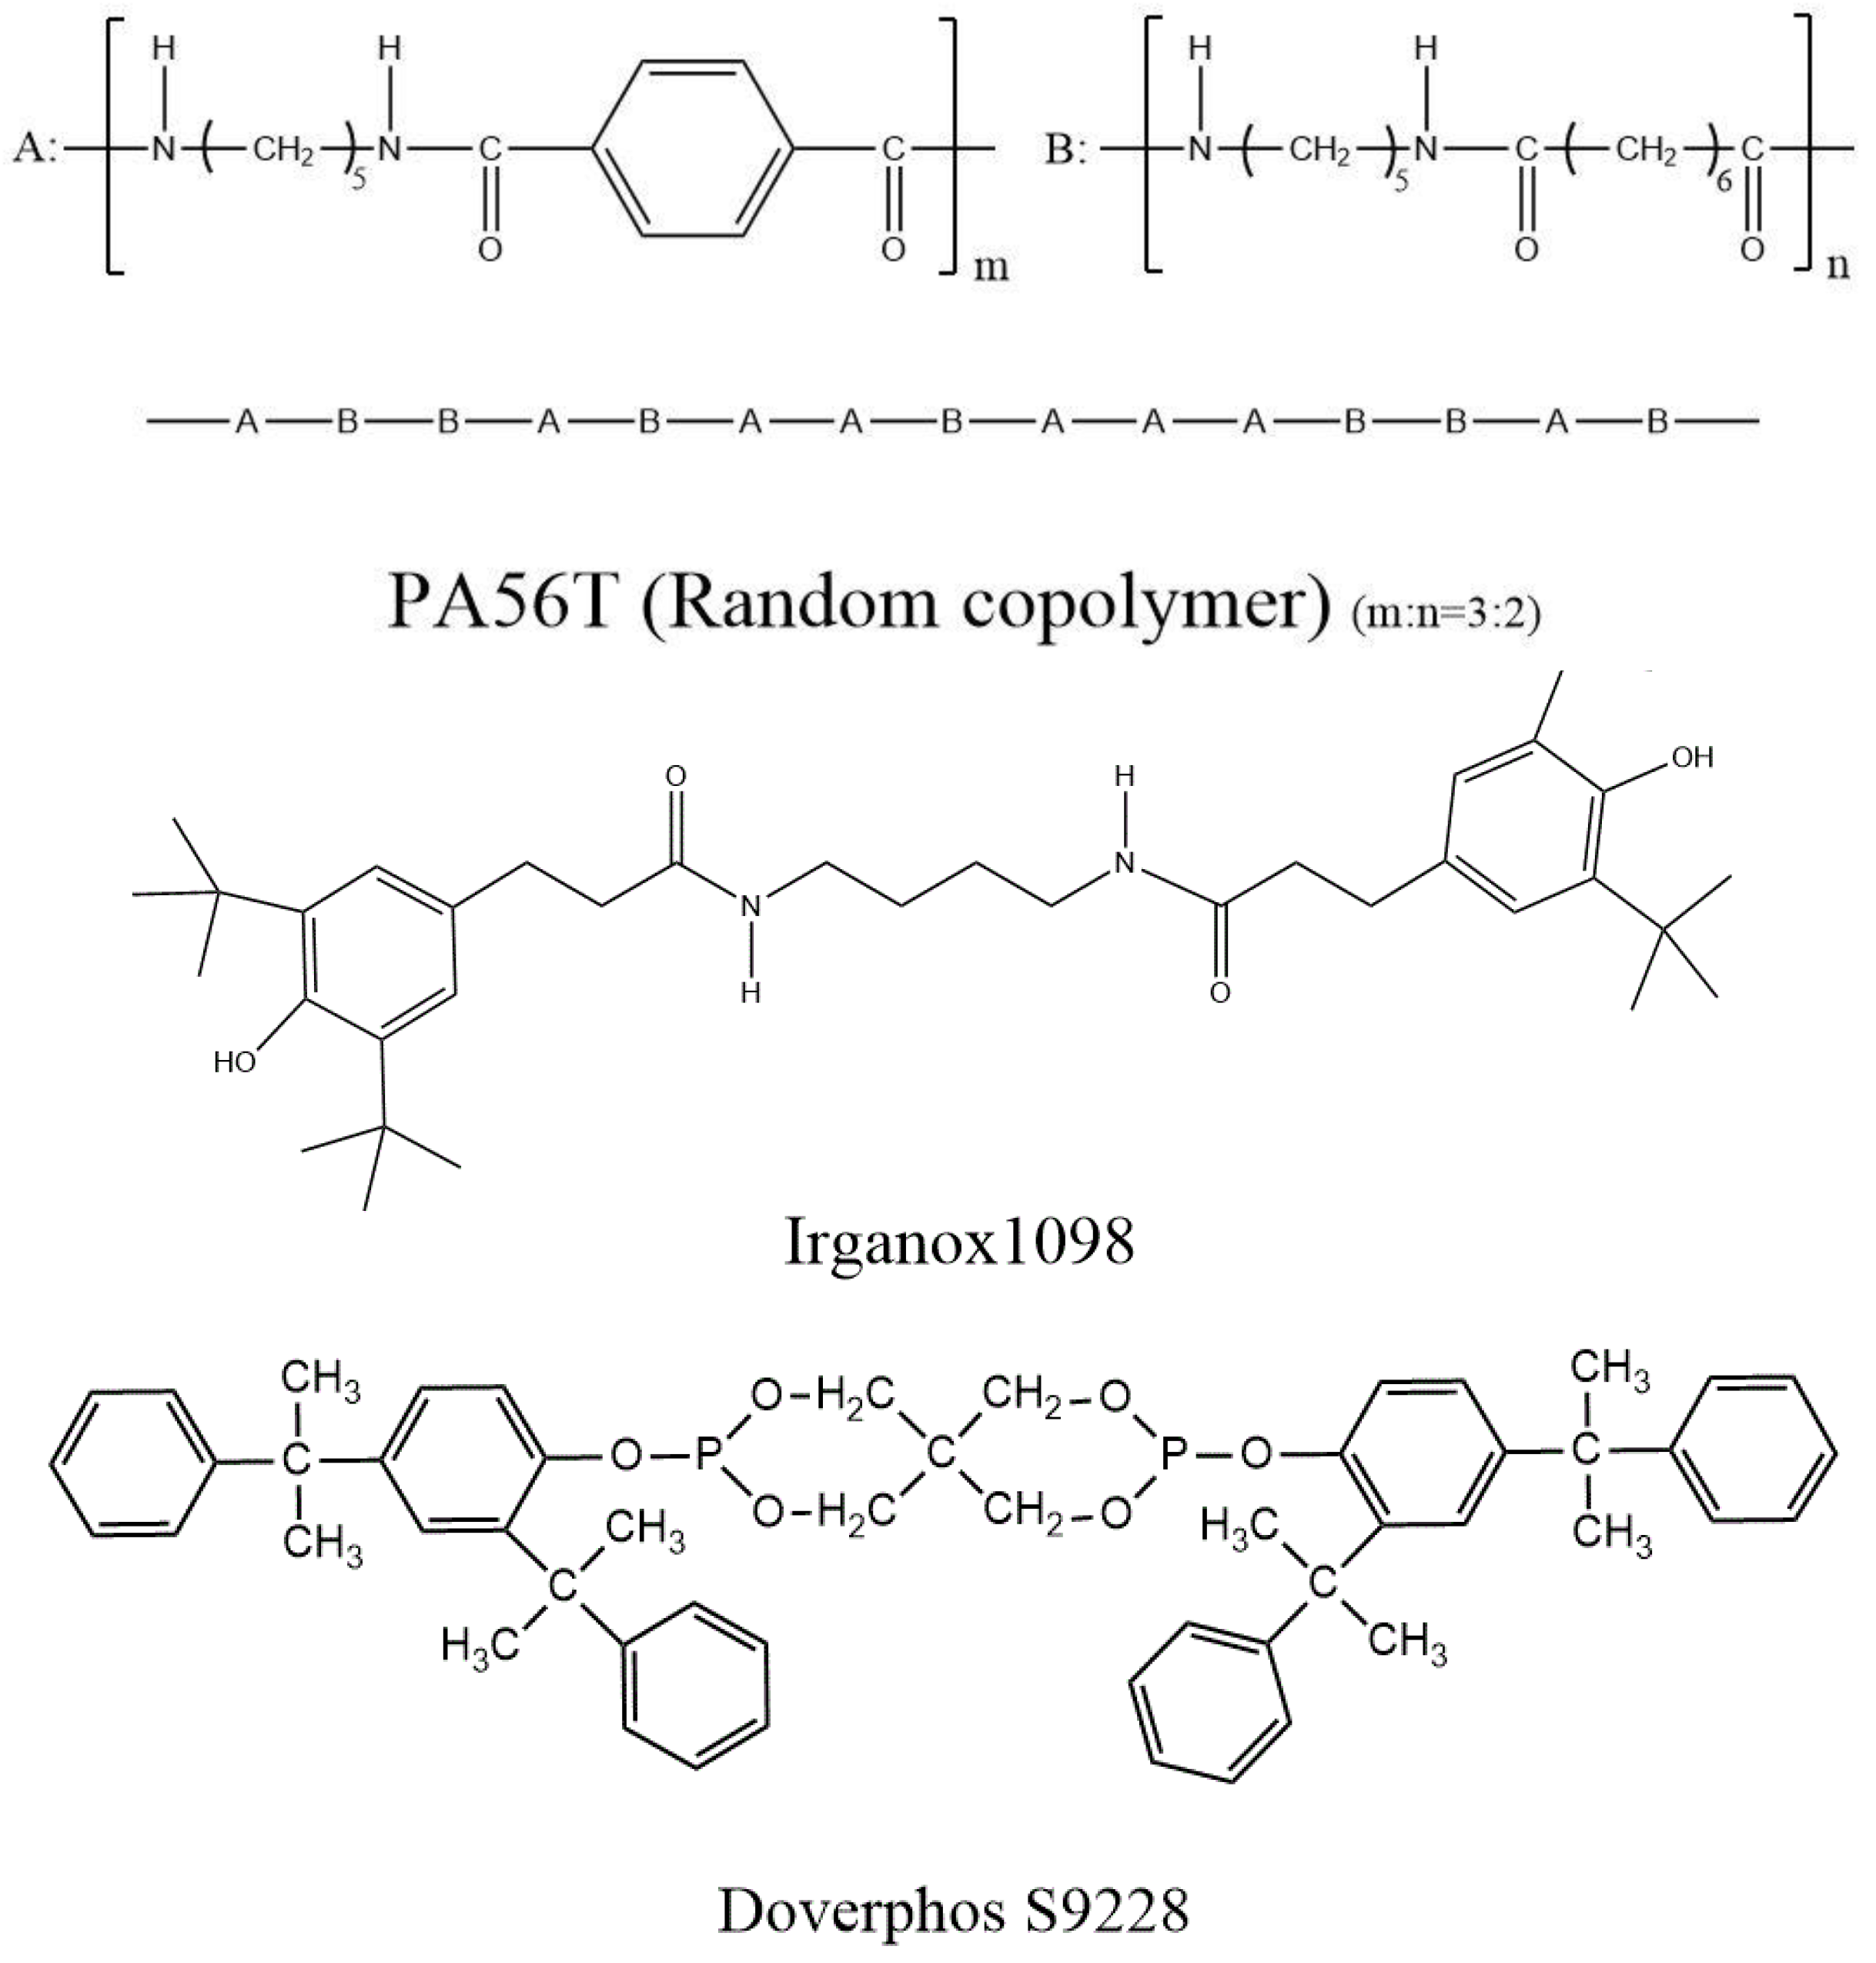
2.1. Materials
2.2. Preparation of PA56T Samples
2.3. Aging
2.4. Characterization
2.4.1. Rotational Rheometer
2.4.2. Fourier Transform Infrared Spectroscopy
2.4.3. Yellow Index (YI)
2.4.4. Crystallization Analysis
2.4.5. Mechanical Properties
2.4.6. Microscopy Investigation
2.4.7. Dynamic Thermo-Mechanical Analysis (DMA)
3. Results and Discussion
3.1. Rotational Rheometer Analysis
3.2. XRD Analysis
3.3. Groups and Yellow Index Analysis
3.4. Mechanical Properties
3.5. Microscopy Investigation
3.6. Dynamic Thermo-Mechanical Analysis (DMA)
4. Conclusions
Author Contributions
Funding
Institutional Review Board Statement
Informed Consent Statement
Data Availability Statement
Acknowledgments
Conflicts of Interest
References
- Francisco, D.L.; Paiva, L.B.; Aldeia, W. Advances in polyamide nanocomposites: A review. Polym. Compos. 2019, 40, 851–870. [Google Scholar] [CrossRef]
- Alaerts, L.; Augustinus, M.; Van Acker, K. Impact of Bio-Based Plastics on Current Recycling of Plastics. Sustainability 2018, 10, 1487. [Google Scholar] [CrossRef] [Green Version]
- Battegazzore, D.; Salvetti, O.; Frache, A.; Peduto, N.; De Sio, A.; Marino, F. Thermo-mechanical properties enhancement of bio-polyamides (PA1010 and PA610) by using rice husk ash and nanoclay. Compos. Part A Appl. Sci. Manuf. 2016, 81, 193–201. [Google Scholar] [CrossRef]
- Wang, Y.; Kang, H.; Guo, Y.; Guo, Y.; Liu, R.; Hao, X.; Qiao, R.; Yan, J. The structures and properties of bio-based polyamide 56 fibers prepared by high-peed spinning. J. Appl. Polym. Sci. 2020, 137, 49344. [Google Scholar] [CrossRef]
- Do, C.H.; Pearce, E.M.; Bulkin, B.J.; Reimschuessel, H.K. FT-IR spectroscopic study on the photo a-nd photooxidative degradation of nylons. J. Polym. Sci. Pol. Chem. 1987, 25, 2301–2321. [Google Scholar] [CrossRef]
- Wang, W.Z.; Wang, X.W.; Li, R.X.; Liu, B.; Wang, E.; Zhang, Y. Environment-friendly synthesis of lo-ng chain semiaromatic polyamides with high heat resistance. J. Appl. Polym. Sci. 2009, 114, 2036–2042. [Google Scholar] [CrossRef]
- Qi, M.; Zheng, L.; Li, C.; Xiao, Y.; Liu, J.; Wu, S.; Zhang, B. The yellowing mechanism of polyesteramide based on poly- ethylene terephthalate and polyamide 6. J. Appl. Polym. Sci. 2021, 138, 49986. [Google Scholar] [CrossRef]
- Thomason, J.L. Structure-property relationships in glass-rein-forced polyamide, part 3: Effects of hydrolysis ageing on the dimensional stability and performance of short g-lass-fiber-reinforced polyamide 66. Polym. Compos. 2007, 28, 344–354. [Google Scholar] [CrossRef] [Green Version]
- Thomason, J.L.; Ali, J.Z.; Anderson, J. The thermo-mechanical performance of glass-fi-bre reinforced polyamide 66 during glycolwater hydrolysis conditioning. Compos. Part A Appl. Sci. Manuf. 2010, 41, 820–826. [Google Scholar] [CrossRef] [Green Version]
- Zuo, X.L.; Shao, H.J.; Huang, A.R.; Hao, Z.; Guo, J. Effect of thermaloxidative aging on long glass fiber reinforced PA6 Composites. Synth. Resin Plast. 2013, 30, 66–70. [Google Scholar]
- Liang, H.X.; Zhang, D.H.; Zhang, Y.X.; Zhenwei, M.; Huilin, Y. Study on thermal oxidative aging of toughening polyamide and applied to automobile. Eng. Plast. Appl. 2009, 37, 71–74. [Google Scholar]
- Richaud, E.; Diogo, O.; Fayolle, B.; Verdu, J.; Guilment, J.; Fernagut, F. Review: Auto-oxidation of aliphatic polyamides. Polym. Degrad. Stabil. 2013, 98, 1929–1939. [Google Scholar] [CrossRef] [Green Version]
- Forsstrom, D.; Terselius, B. Thermo oxidative stability of polyamide 6 films I: Mech-anical and chemical characterisation. Polym. Degrad. Stabil. 2000, 67, 69–78. [Google Scholar] [CrossRef]
- PEriksson, P.A.; Boydell, P.; Eriksson, K.; Månson, J.A.; Albertsson, A.C. Effect of thermaloxidative aging on mechanical, chemical, and thermal properties of recycled polyamide 66. J. Appl. Polym. Sci. 1997, 65, 1619–1630. [Google Scholar] [CrossRef]
- Li, R.F.; Hu, X.Z. Study on discoloration mechanism of polyamide 6 during thermo-oxidative degradation. Polym. Degrad. Stabil. 1998, 62, 523–528. [Google Scholar] [CrossRef]
- He, Y.; Chen, S.; Zheng, Q.; Chen, Y. Thermal stability and yellowing of polyamide finished with a compound anti-thermal-yellowing agent. J. Text. Inst. 2015, 106, 1263–1269. [Google Scholar] [CrossRef]
- Subiman, G.; Khastgir, D.; Anil, K.B.; Mukunda, P.G. Thermal degradation and ageing of segmented polyamides. Polym. Degrad. Stabil. 2000, 67, 427–436. [Google Scholar]
- Geretschlaeger, K.J.; Wallner, G.M. Aging characteristics of glass fiber-reinforced polyamide in hot water and air. Polym. Compos. 2018, 39, 997–1005. [Google Scholar] [CrossRef]
- Qian, Z.J.; Wu, G.F.; Yang, B.; Luo, Z.F.; Nie, X. Rapid evaluation of thermal oxygen stabilizer for nylon by torque rheometer. Guangdong Chem. Ind. 2017, 44, 36–38. [Google Scholar]
- Mulliez, M.A.; Schilling, C.; Grupp, T.M. Influence of Irradiation Temperature on Oxidative and Network Properties of X-Ray Cross-Linked Vitamin E Stabilized UHMWPE for Hip Arthroplasty. BioMed. Res. Int. 2020, 3, 2568428. [Google Scholar] [CrossRef]
- Segovia, F.; Hidalgo, G.; Villasante, J.; Ramis, X.; Almajano, M.P. Avocado Seed: A Comparative Study of Antioxidant Content and Capacity in Protecting Oil Models from Oxidation. Molecules 2018, 23, 2421. [Google Scholar] [CrossRef] [PubMed] [Green Version]
- Catalina, F.; Peinado, C.; Allen, N.S.; Corrales, T. Chemiluminescence of polyethylene: The comparative antioxidant effectiveness of phenolic stabilizers in low-density polyethylene. J. Polym. Sci. Pol. Chem. 2002, 40, 3312–3326. [Google Scholar] [CrossRef]
- Li, C.; Wang, J.; Ning, M.; Zhang, H. Synthesis and antioxidant activities in polyolefin of dendritic antioxidants with hindered phenolic groups and tertiary amine. J. Appl. Polym. Sci. 2012, 124, 4127–4135. [Google Scholar] [CrossRef]
- Rosa, D.S.; Sarti, J.; Mei, L.; Silveira, S. A study of parameters interfering in oxidative induction time (OIT) results obtained by differential scanning calorimetry in polyolefin. Polym. Test. 2000, 19, 523–531. [Google Scholar] [CrossRef]
- Suchocki, C.; Molak, R. Rheological Properties of Polyamide: Experimental Studies and Constitutive Modeling. Chin. J. Polym. Sci. 2019, 37, 178–188. [Google Scholar] [CrossRef]
- Kim, H.; Oh, K.; Seo, Y. Rheological and Mechanical Properties of a Novel Polyamide 6 Synthesized by Anionic Polymerization of ε-caprolactam in a Twin-Screw Extruder. Polymer 2019, 177, 196–201. [Google Scholar] [CrossRef]
- Samanta, S.R. Intrinsic viscosity and molecular weight measurement of nylon 66 polymers. J. Appl. Polym. Sci. 1992, 45, 1635–1640. [Google Scholar] [CrossRef]
- Bergeret, A.; Pires, I.; Foulc, M.P.; Abadie, B.; Ferry, L.; Crespy, A. The hygrothermal behaviour of glass-fibre-reinforced thermoplastic composites: A prediction of the composite lifetime. Polym. Test. 2001, 20, 753–763. [Google Scholar] [CrossRef]
- Verdu, A. Oxyluminescence of polyamide 12. Polym. Degrad. Stabil. 1994, 44, 335–341. [Google Scholar]
- Forsstrom, D.; Reitberger, T.; Terselius, B. Thermo-oxidative stability of polyamide 6 films: II. Chemiluminescence techniques. Polym. Degrad. Stabil. 2000, 67, 255–261. [Google Scholar] [CrossRef]
- Meng, Q.; Gu, Y.; Luo, L.; Wang, S.; Li, M.; Zhang, Z. Annealing effect on crystalline structure and mechanical properties in long glass fiber reinforced polyamide 66. J. Appl. Polym. Sci. 2017, 134, 44832. [Google Scholar] [CrossRef]
- Wang, Y.; Kang, H.L.; Wang, R.; Liu, R.G.; Hao, X.M. Crystallization of polyamide 56/polyamide 66 blends: Non-isothermal crystallization kinetics. J. Appl. Polym. Sci. 2018, 135, 46409. [Google Scholar] [CrossRef]
- Lake, W.B.; Kalakkunnath, S.; Kalika, D.S. Crystallization, melting, and rheology of reactive polyamide blends. J. Appl. Polym. Sci. 2004, 94, 1245–1252. [Google Scholar] [CrossRef]
- Julie, C.; Ramkumaar, G.R.; Azhagiri, S.; Gunasekaran, S. FTIR and Thermal Studies on Nylon-66 and 30% Glass Fibre Reinforced Nylon-66. E J. Chem. 2019, 6, 23–33. [Google Scholar]
- Okamba-Diogo, O.; Fernagut, F.; Guilment, J.; Pery, F.; Fayolle, B.; Richaud, E. Thermal stabilization of polyamide 11 by phenolic antioxidants. Polym. Degrad. Stabil. 2020, 179, 109206. [Google Scholar] [CrossRef]
- Schwetlick, K.; König, T.; Rüger, C.; Pionteck, J.; Habicher, W.D. Chain-breaking antioxidant activity of phosphite esters. Polym. Degrad. Stabil. 1986, 15, 97–108. [Google Scholar] [CrossRef]
- Deng, H.L.; Yi, J.J.; Guo, J.C. Thermal Oxidative Ageing Performance of Glass Fiber Reinforced Pa66 with Different Antioxidant Systems. Eng. Plast. Appl. 2020, 48, 106–111. [Google Scholar]
- Garbuglio, C.; Ajroldi, G.; Casiraghi, T.; Vittadini, G. Relationships between mechanical properties and relaxation processes in polymers. Nylon 6. J. Appl. Polym. Sci. 1971, 15, 2487–2512. [Google Scholar] [CrossRef]
- Panaitescu, I.; Koch, T.; Archodoulaki, V.M. Accelerated aging of a glass fiber/polyurethane composite for automotive applications. Polym. Test. 2019, 74, 245–256. [Google Scholar] [CrossRef]
- Eselini, N.; Tirkes, S.; Akar, A.O.; Tayfun, U. Production and characterization of poly (lactic acid)-based biocomposites filled with basalt fiber and flax fiber hybrid. J. Elastom. Plast. 2019, 52, 701–716. [Google Scholar] [CrossRef]
- Shu, Y.; Ye, L.; Yang, T. Study on the long-term thermal-oxidative aging behavior of polyamide 6. J. Appl. Polym. Sci. 2008, 110, 945–957. [Google Scholar] [CrossRef]
- Song, H.S.; Zhou, D.F.; Guo, J.B. Thermal-oxidative aging effects on the properties of long glass fiber reinforced polyamide 10T composites. Polym. Compos. 2018, 39, 2117–2125. [Google Scholar] [CrossRef]


| Sample | PA56T (wt%) | Glass Fiber (wt%) | 1098(wt%) | S9228 (wt%) | SH3386 (wt%) |
|---|---|---|---|---|---|
| 1 | 67.0 | 33.0 | 0 | 0 | 0 |
| 2 | 66.2 | 33.0 | 0.8 | 0 | 0 |
| 3 | 66.2 | 33.0 | 0 | 0.8 | 0 |
| 4 | 66.2 | 33.0 | 0 | 0 | 0.8 |
| 5 | 66.2 | 33.0 | 0.5 | 0.3 | 0 |
| 6 | 66.2 | 33.0 | 0.5 | 0 | 0.3 |
| Sample | Apparent Viscosity (Pa·s) | Time of Reaching the Valley (min) | Peak-Valley Value (Pa·s) | Time to Reach the Summit (min) | Peak Value (Pa·s) |
|---|---|---|---|---|---|
| 1 | 5855 | 0.8 | 5493 | 2.1 | 193,100 |
| 2 | 6770 | 1.7 | 6070 | 10.5 | 182,000 |
| 3 | 19,933 | 1.8 | 11,500 | 7.9 | 92,700 |
| 4 | 4750 | 1.2 | 4610 | 8.6 | 86,900 |
| 5 | 21,500 | 2.8 | 10,400 | 11.7 | 47,900 |
| 6 | 5133 | 1.7 | 4833 | 9.5 | 61,390 |
| Sample | Half-Height (°) | Peak (°) | Grain Size (nm) |
|---|---|---|---|
| 1 | 5.53 | 21.58 | 1.44 |
| 2 | 7.52 | 21.32 | 1.06 |
| 3 | 7.50 | 21.64 | 1.06 |
| 4 | 6.00 | 21.64 | 1.33 |
| 5 | 7.48 | 21.56 | 1.06 |
| 6 | 6.18 | 21.74 | 1.29 |
Publisher’s Note: MDPI stays neutral with regard to jurisdictional claims in published maps and institutional affiliations. |
© 2022 by the authors. Licensee MDPI, Basel, Switzerland. This article is an open access article distributed under the terms and conditions of the Creative Commons Attribution (CC BY) license (https://creativecommons.org/licenses/by/4.0/).
Share and Cite
Xu, Q.; Guan, B.; Guo, W.; Liu, X. Effect of Antioxidants on Thermo-Oxidative Stability and Aging of Bio-Based PA56T and Fast Characterization of Anti-Oxidation Performance. Polymers 2022, 14, 1280. https://doi.org/10.3390/polym14071280
Xu Q, Guan B, Guo W, Liu X. Effect of Antioxidants on Thermo-Oxidative Stability and Aging of Bio-Based PA56T and Fast Characterization of Anti-Oxidation Performance. Polymers. 2022; 14(7):1280. https://doi.org/10.3390/polym14071280
Chicago/Turabian StyleXu, Qiang, Bing Guan, Weihong Guo, and Xiucai Liu. 2022. "Effect of Antioxidants on Thermo-Oxidative Stability and Aging of Bio-Based PA56T and Fast Characterization of Anti-Oxidation Performance" Polymers 14, no. 7: 1280. https://doi.org/10.3390/polym14071280