
Sensitivity Analysis of Various Geometries of PCD and Cemented Tungsten Carbide Cutting Tools during the Milling of GFRP Composite

 ,
, 
 ,
,
Abstract
:
1. Introduction
2. Methodology
2.1. General Process
- Phase 1: Tests at the fresh state of the cutting tools and selection of the best tools.
- Phase 2: Wear of the best cutting tools at the company under industrial conditions.
- Phase 3: Tests at the worn state of the cutting tools and comparison with the fresh state.
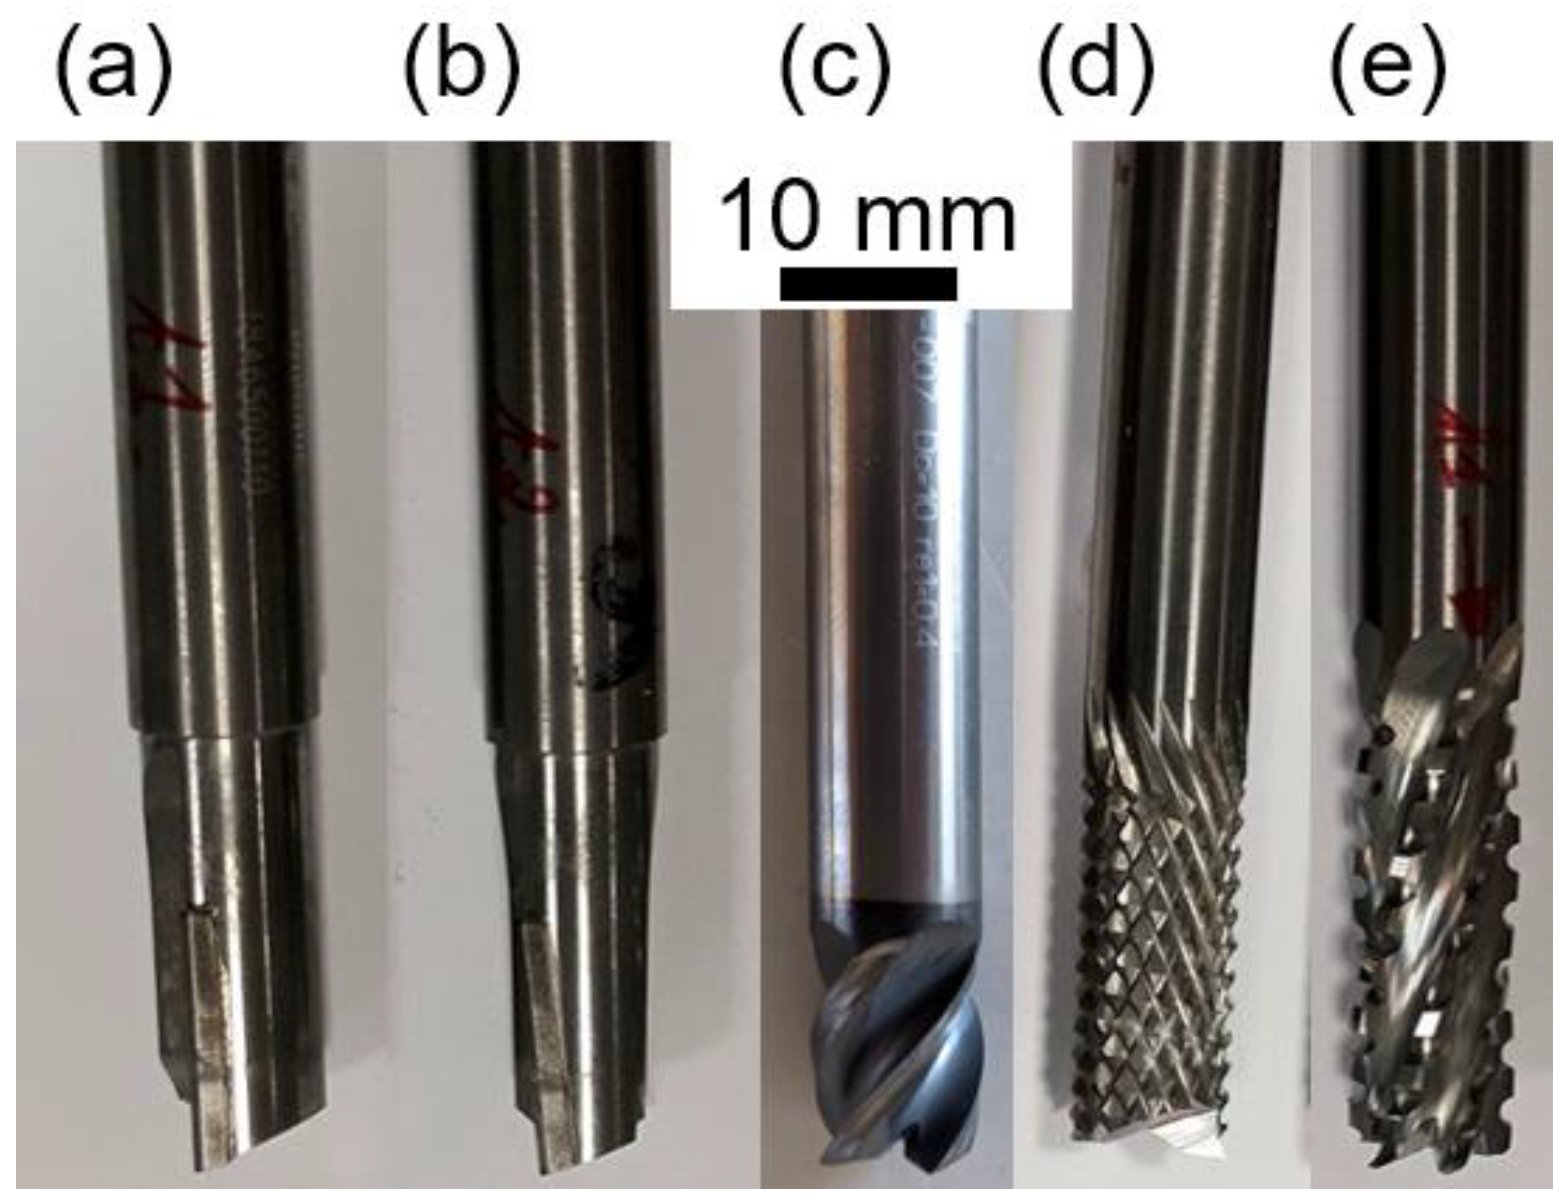
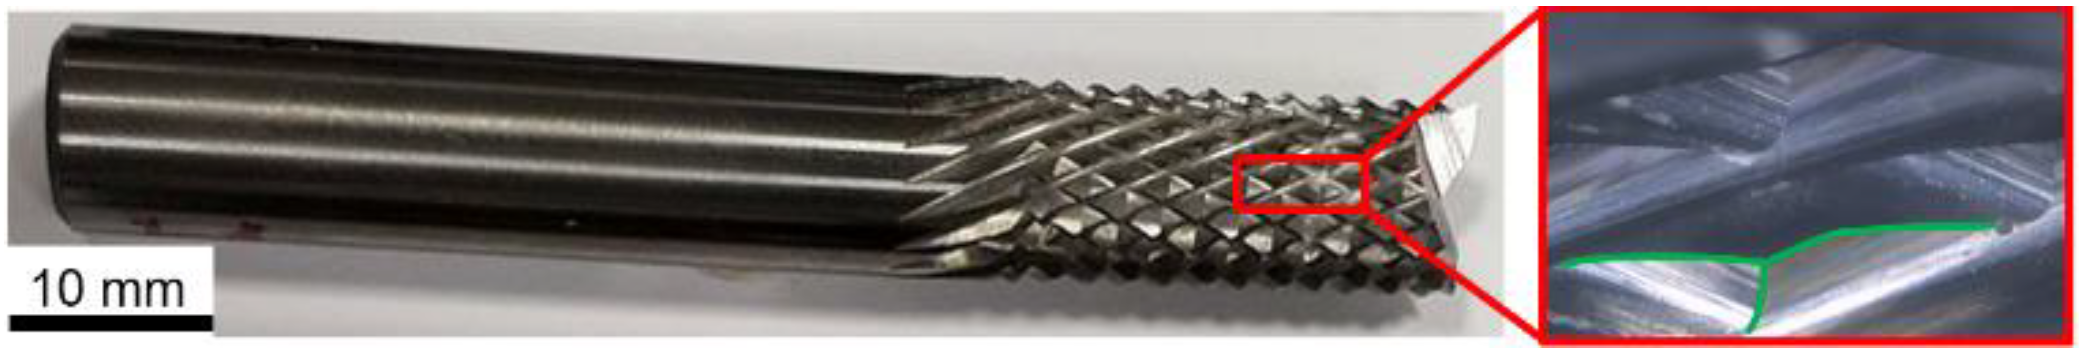
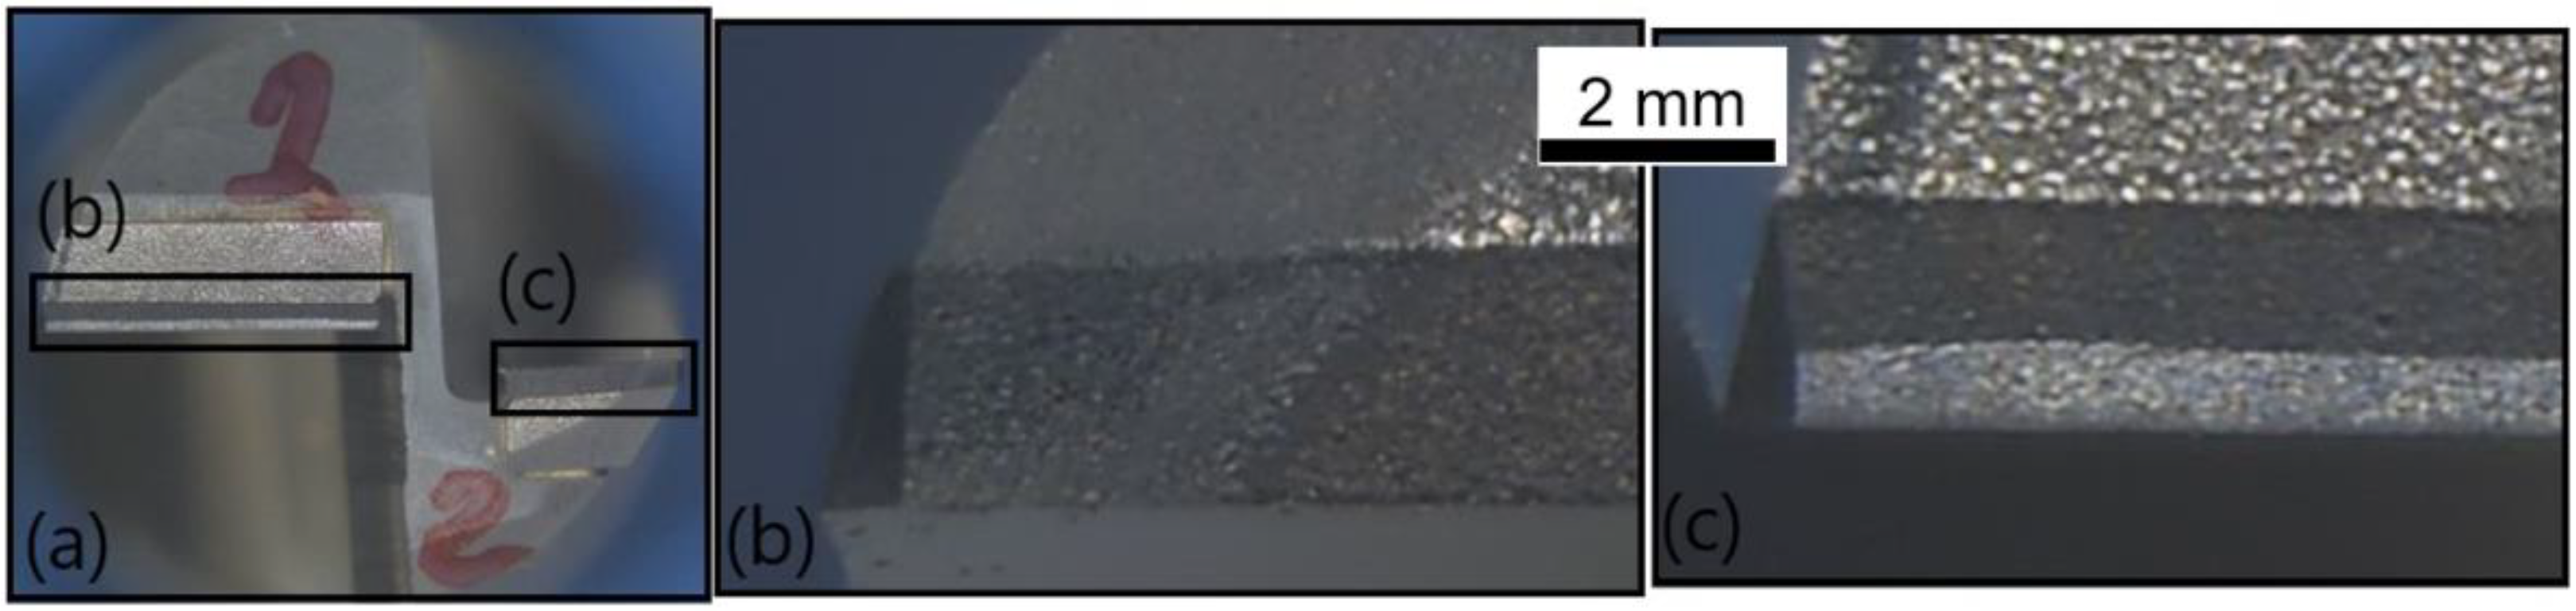
- T1: Cemented carbide burr tool.
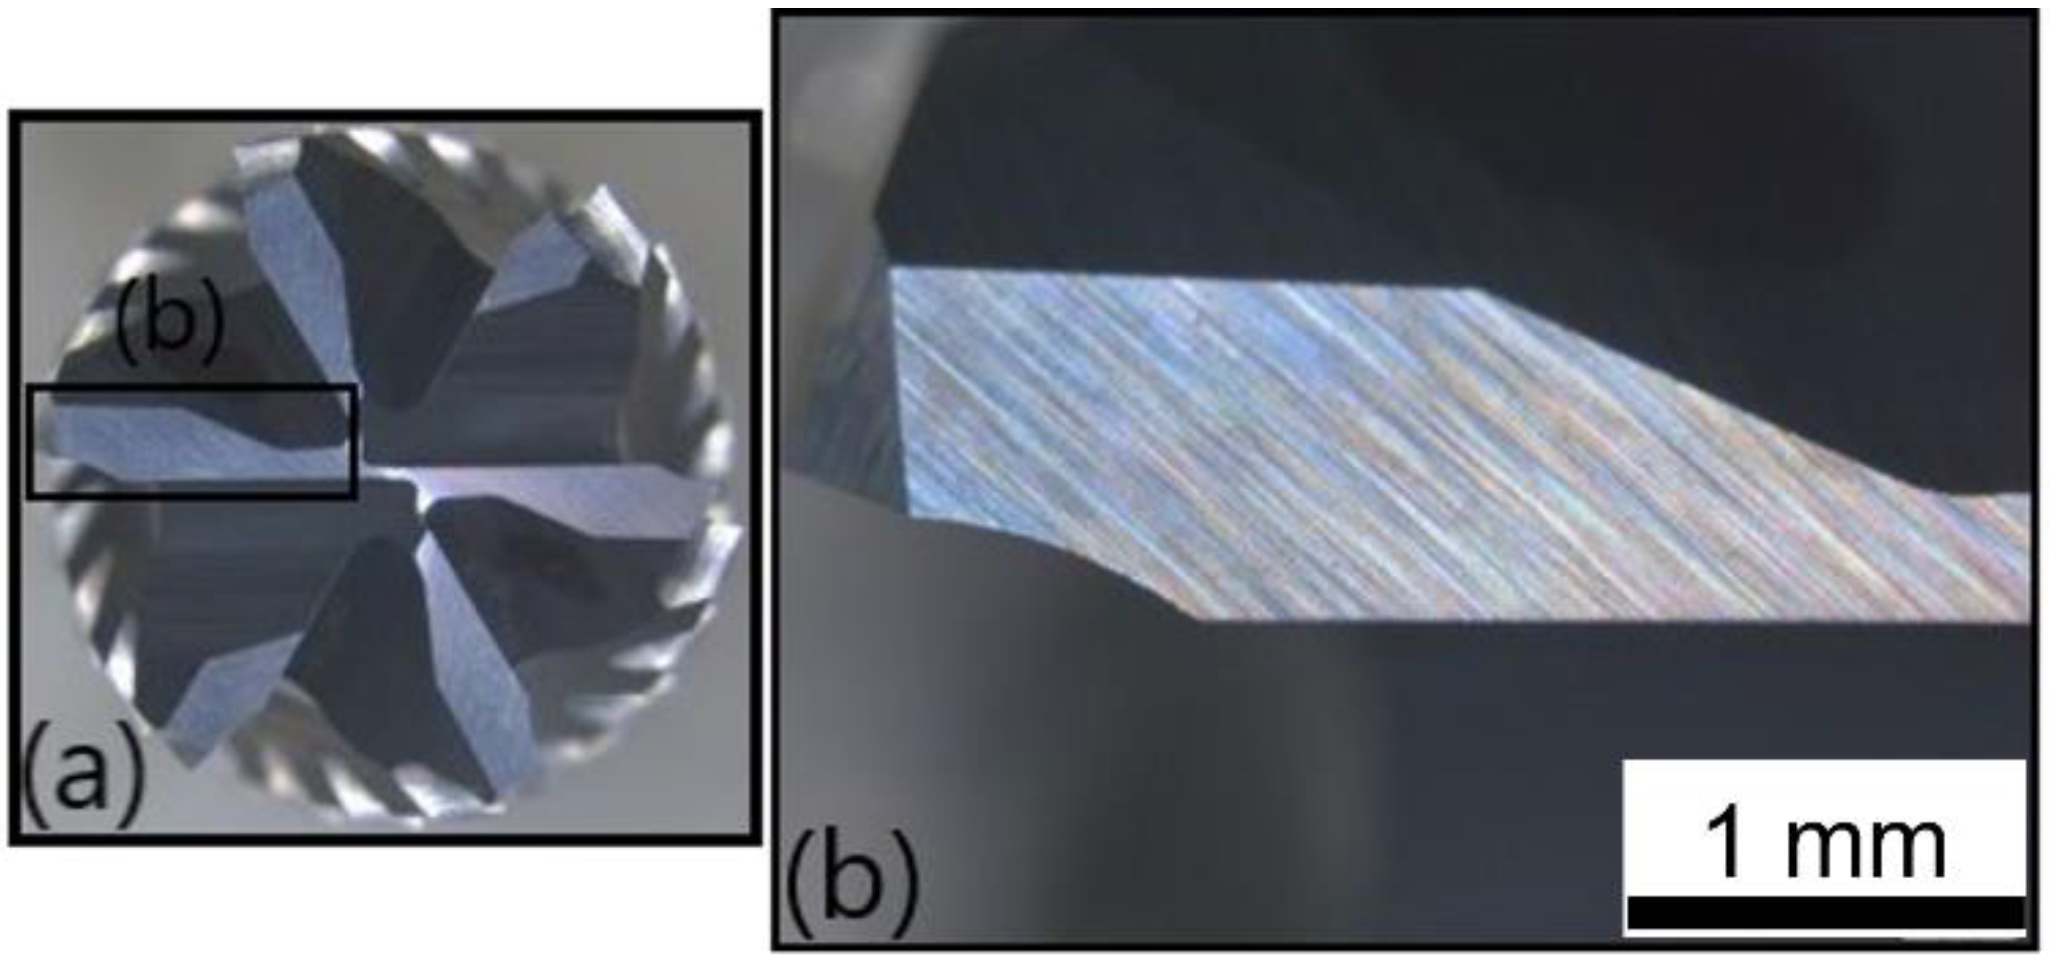
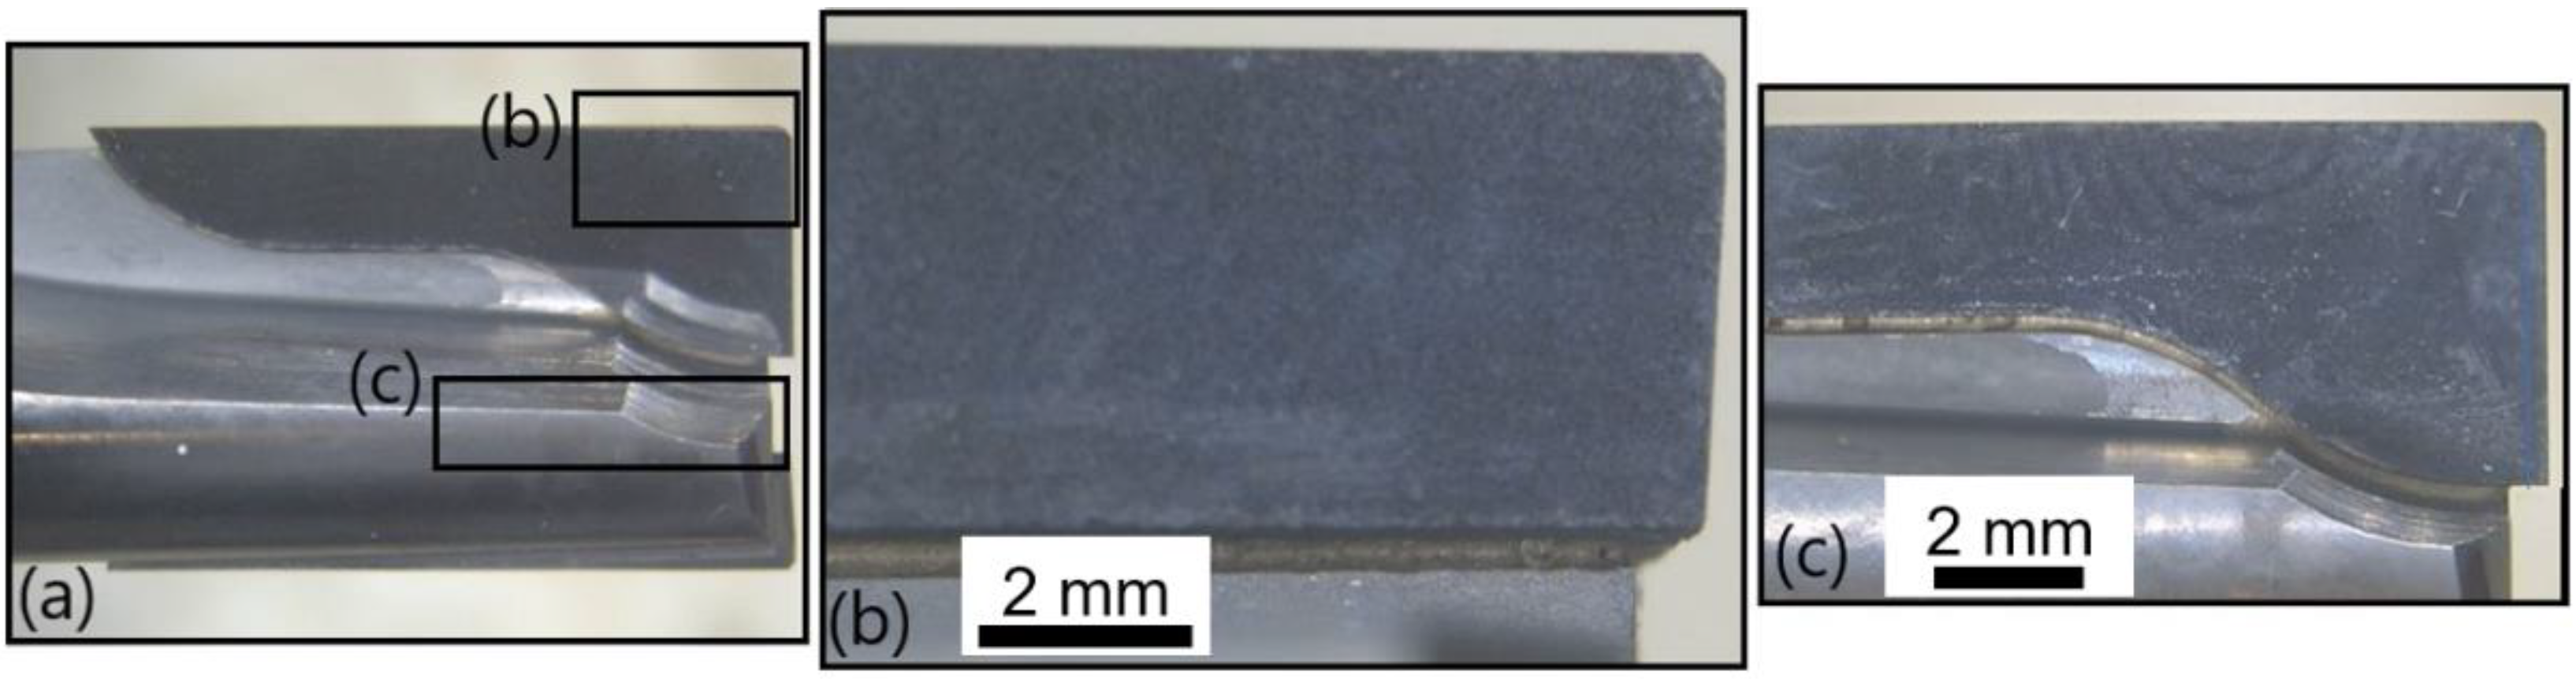
- T2: Cemented carbide satcut tool with six end-mill teeth from which six flutes go down the tool axis.
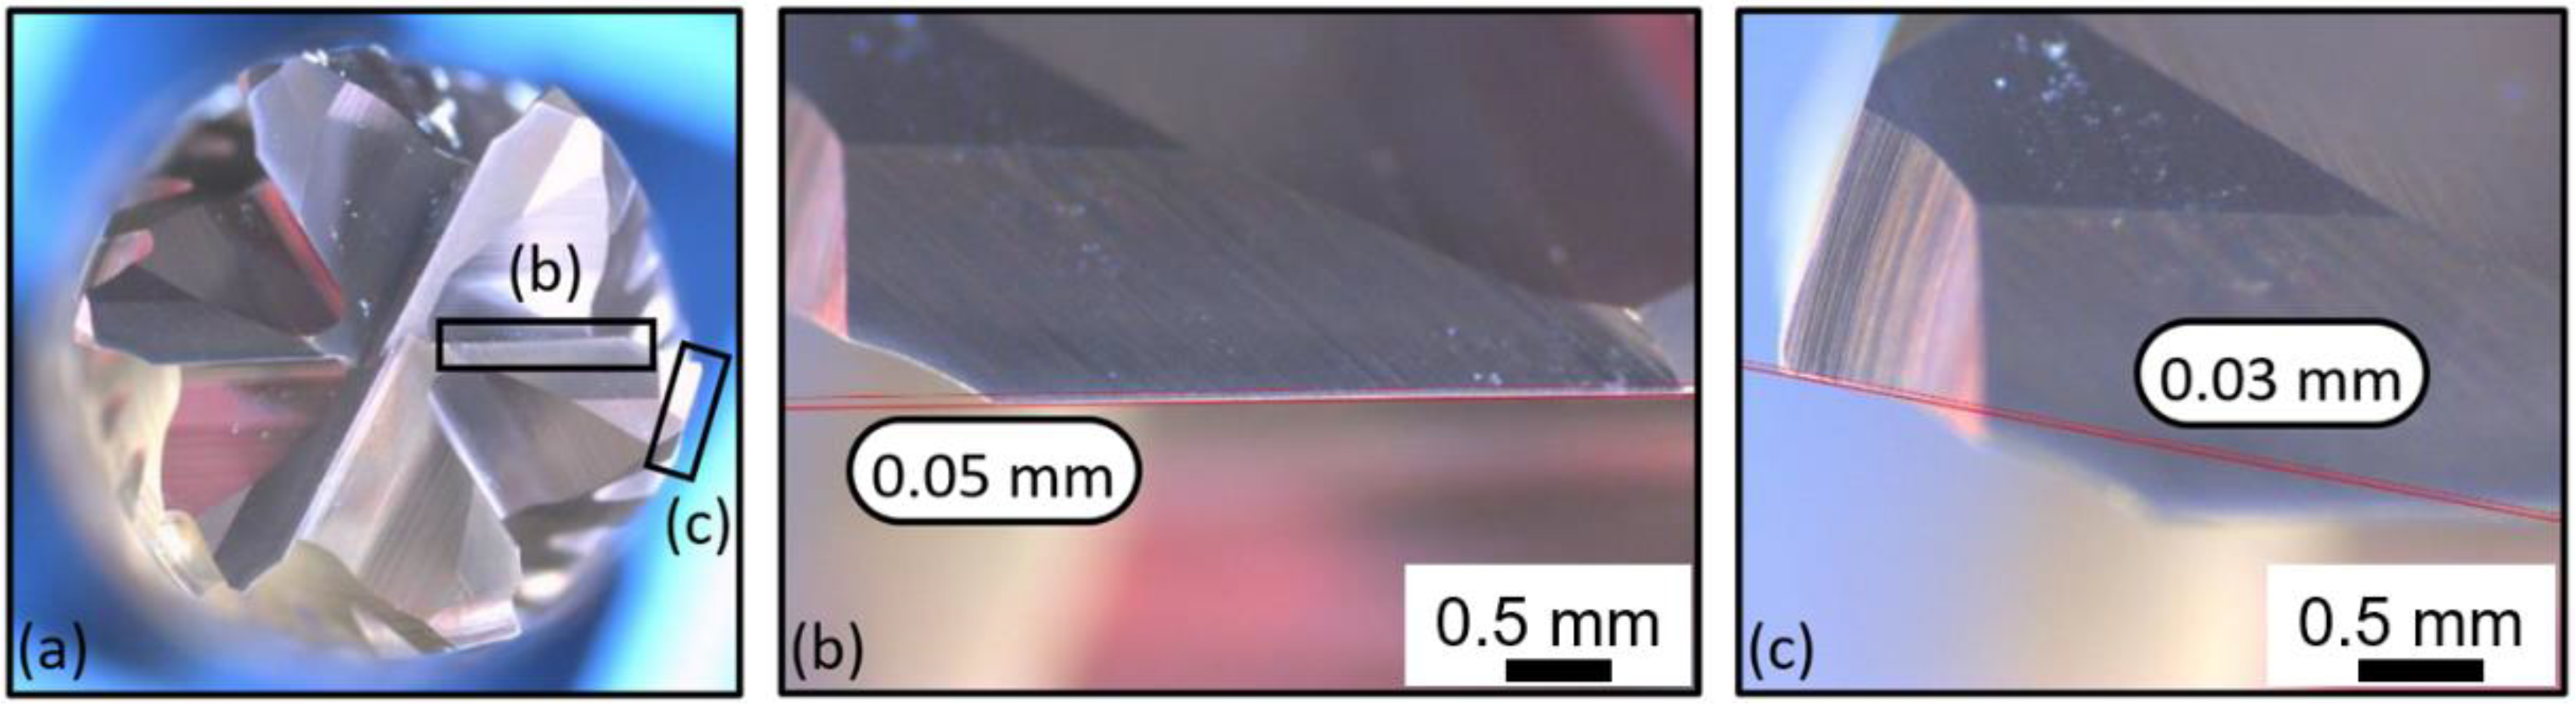
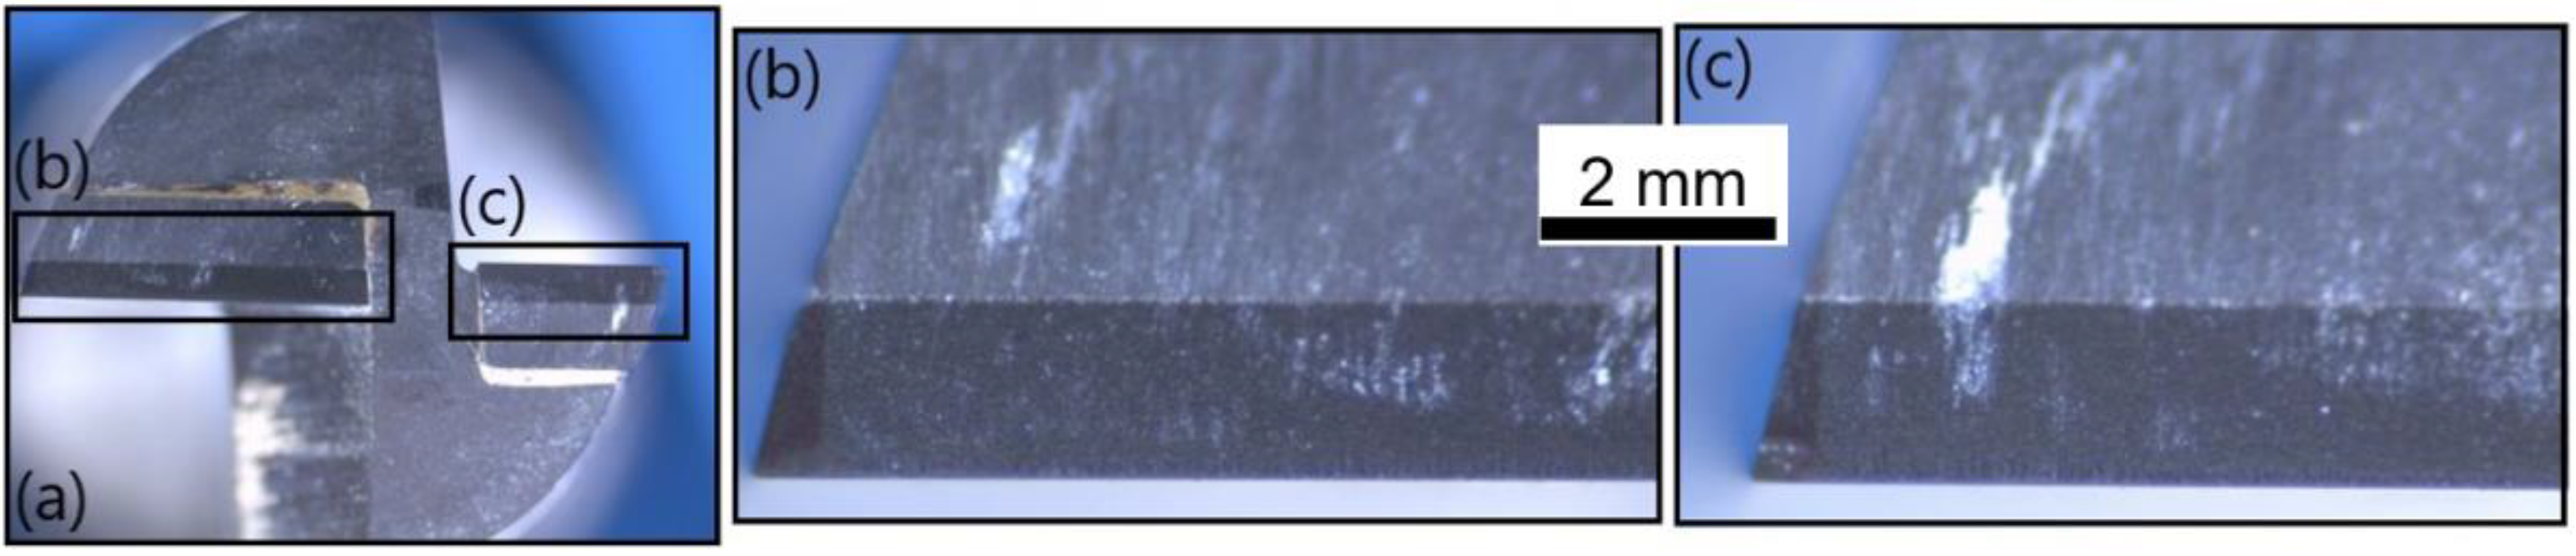
- T3: PCD tool with a slight inclination of the straight secondary cutting edges.
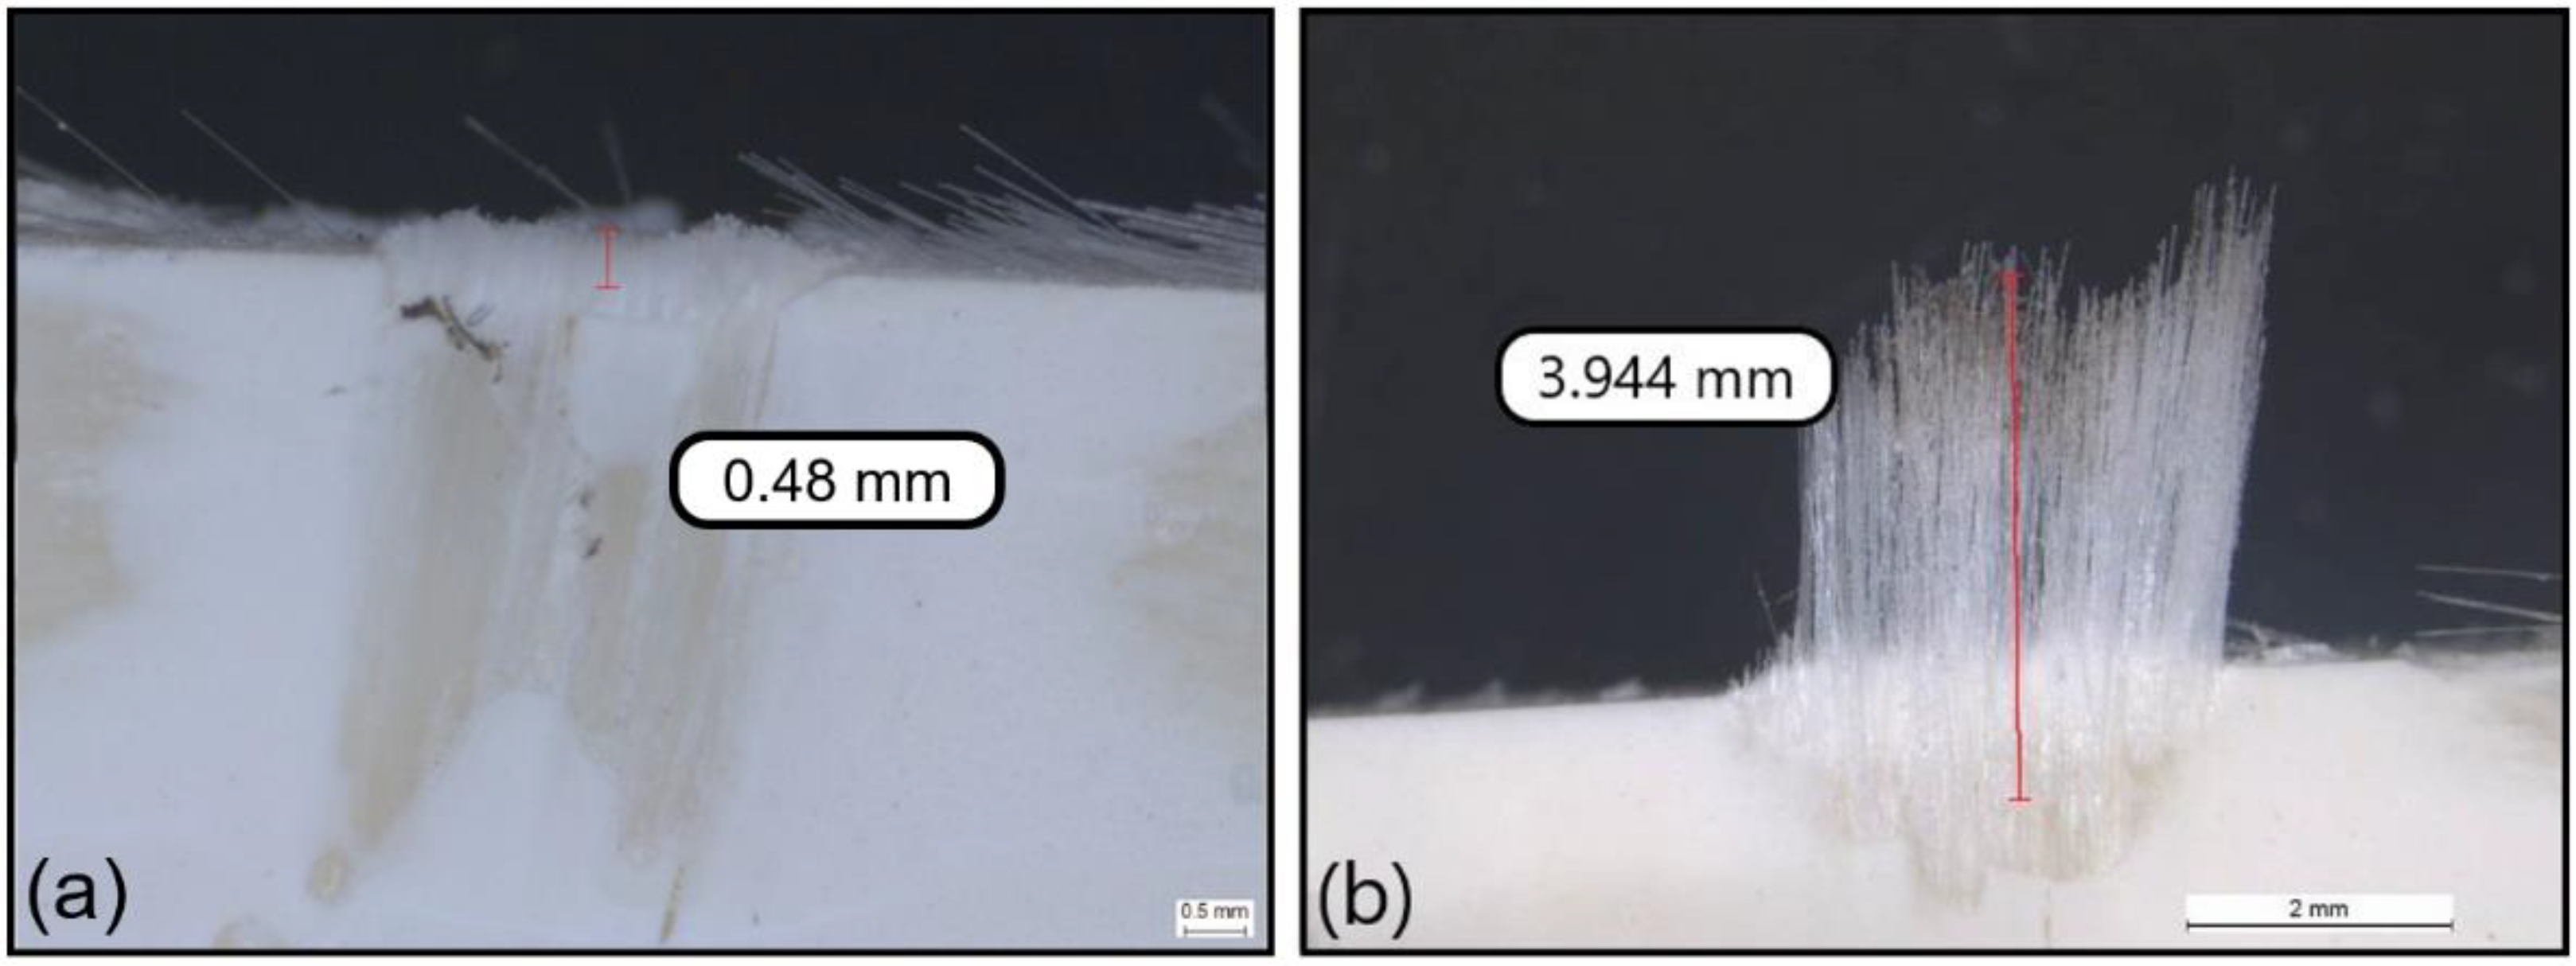
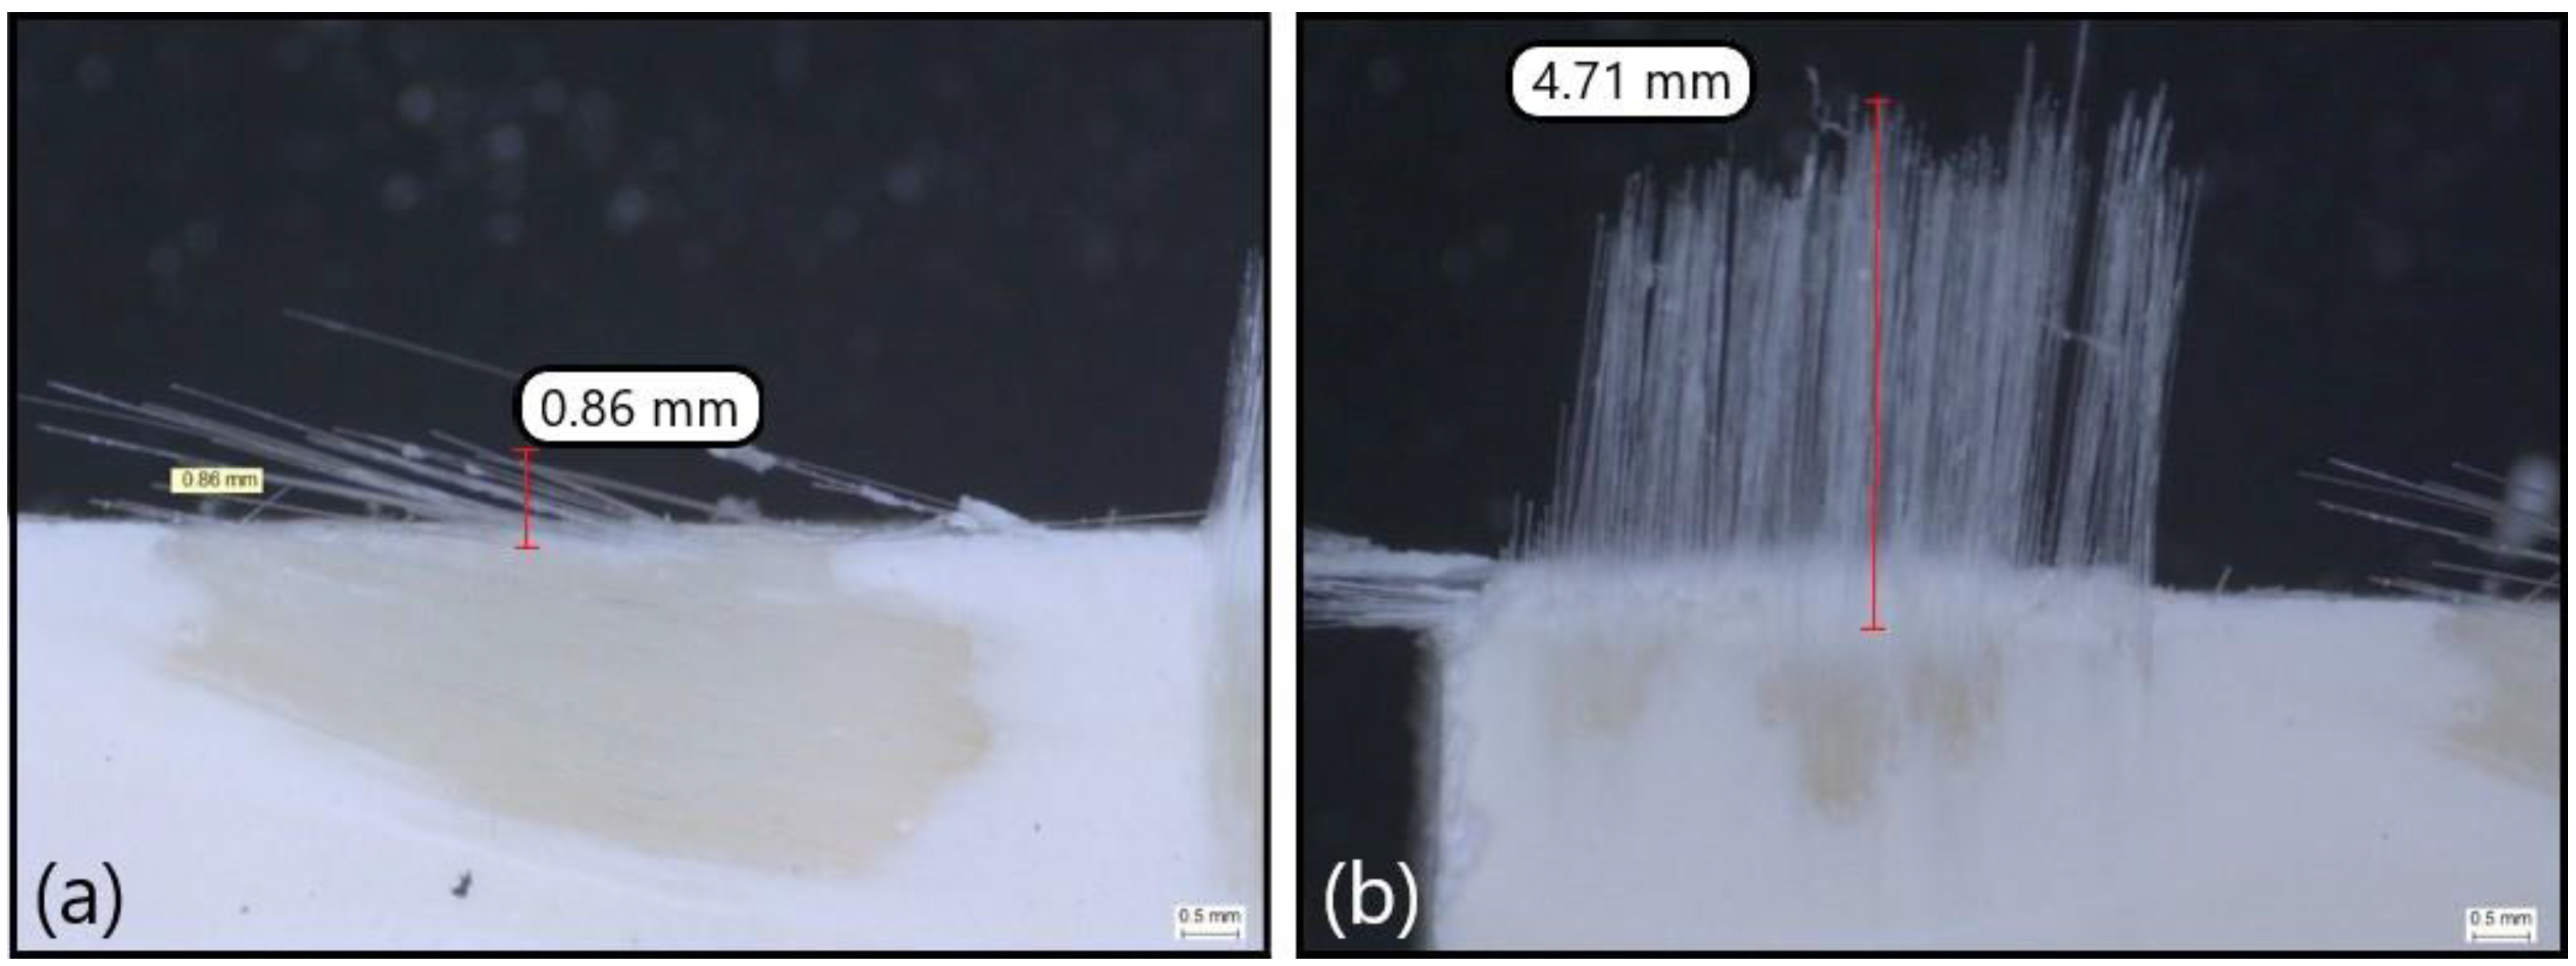
2.2. Delamination
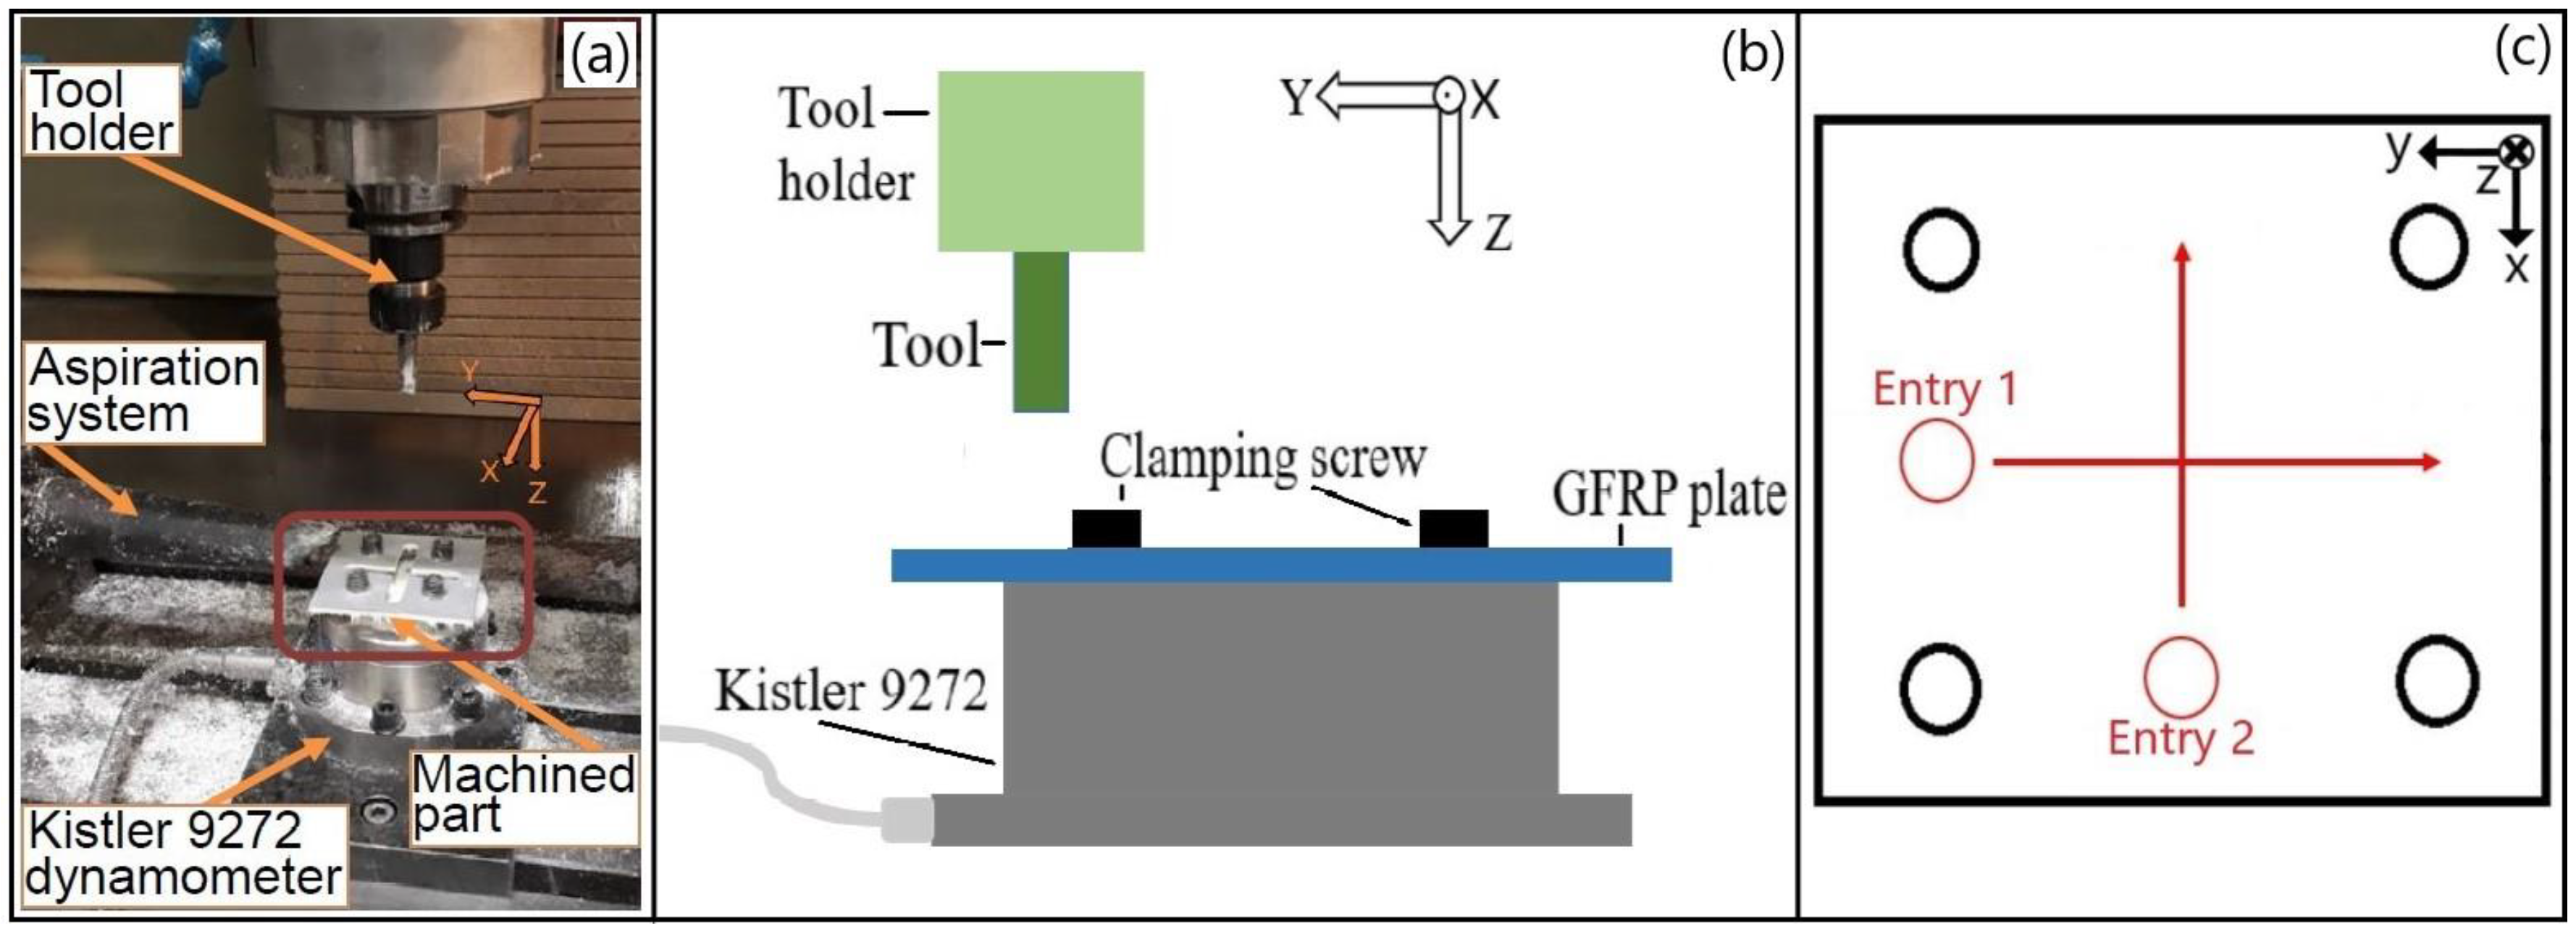
2.3. Cutting Forces
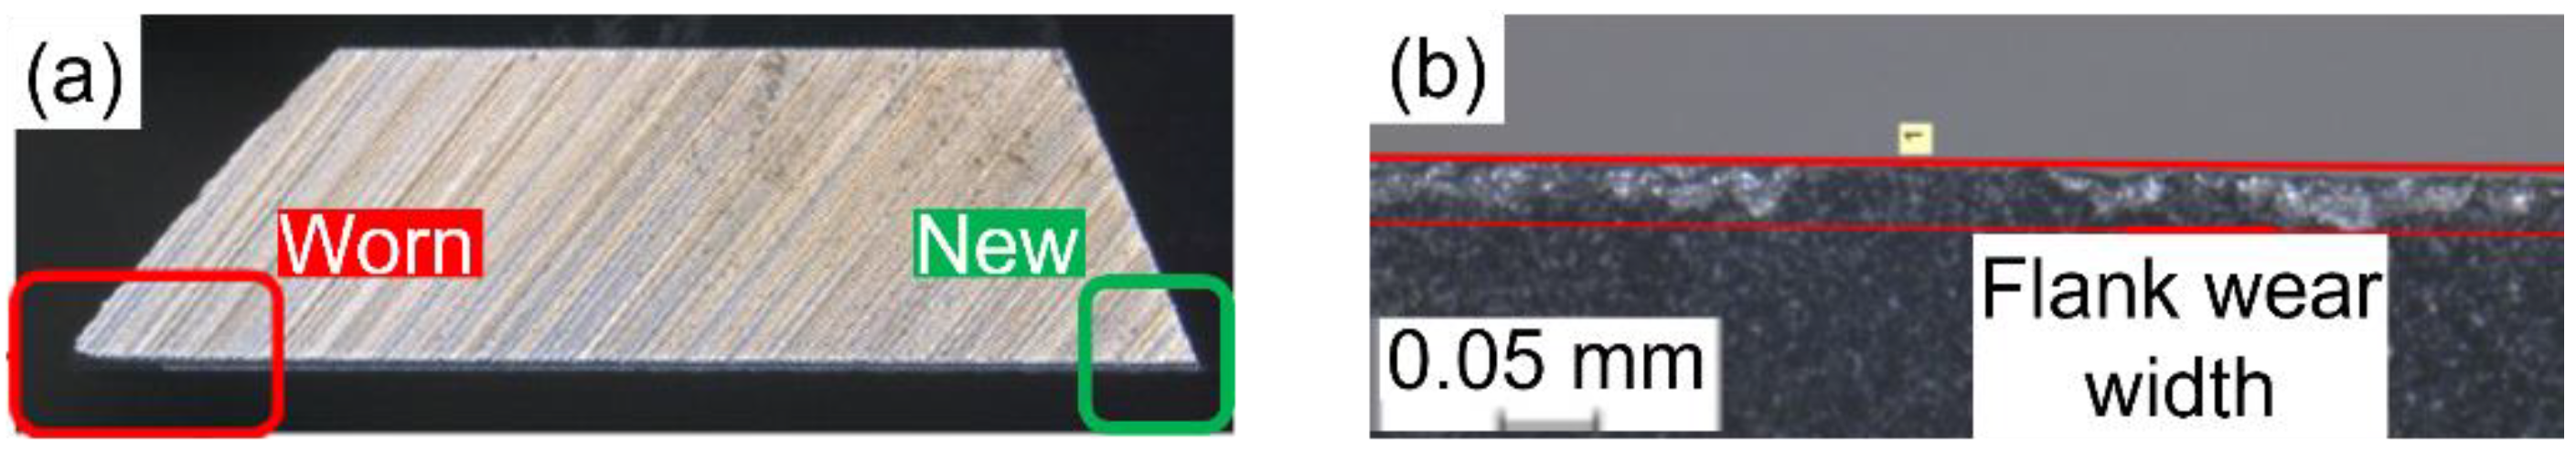
2.4. Tool Life
3. Experimental Results
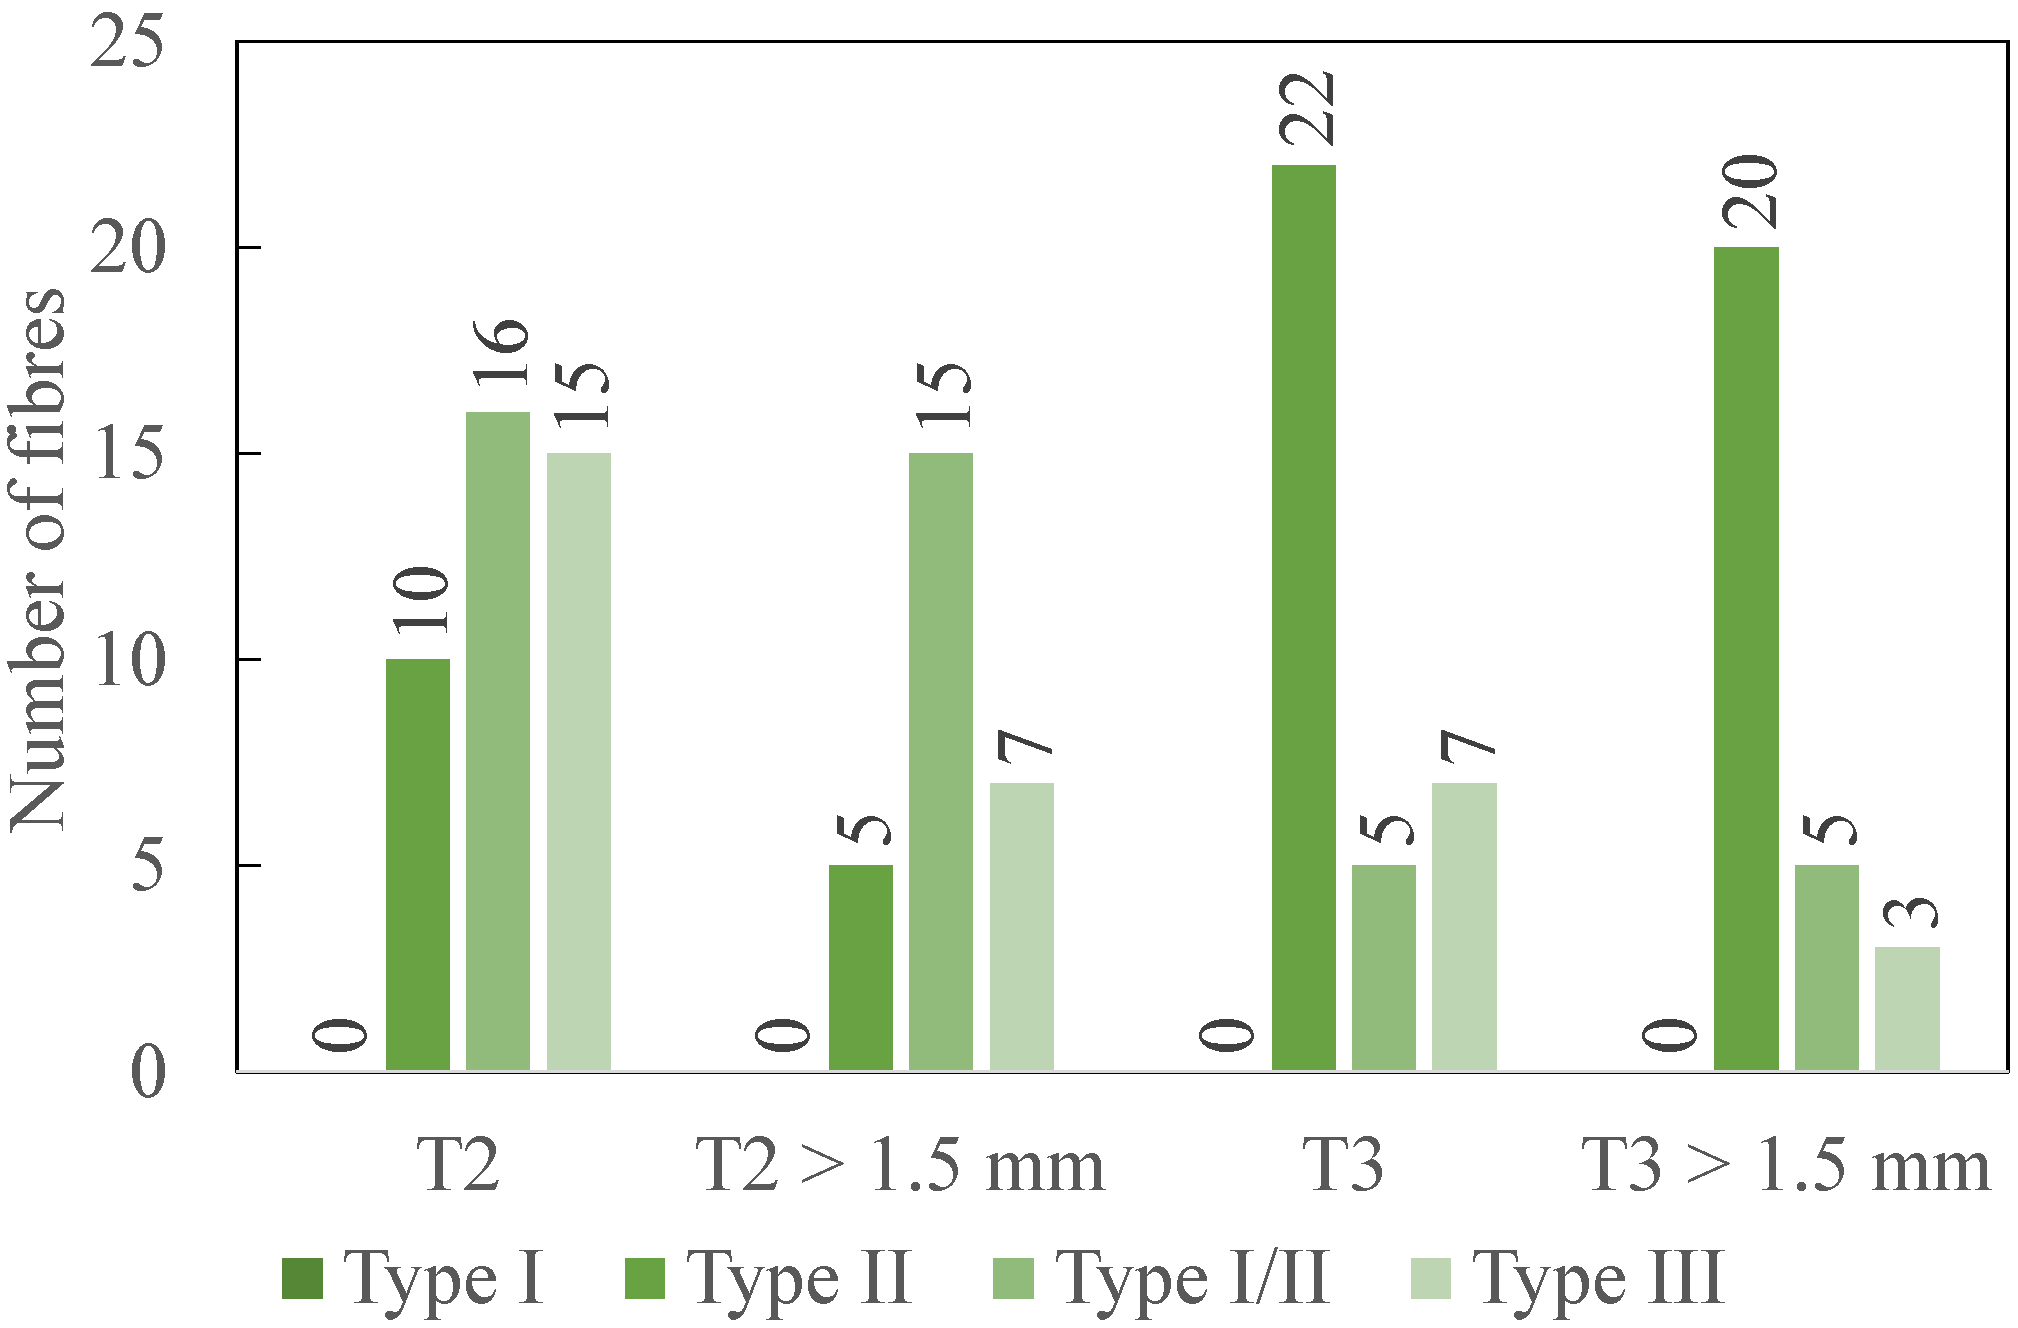
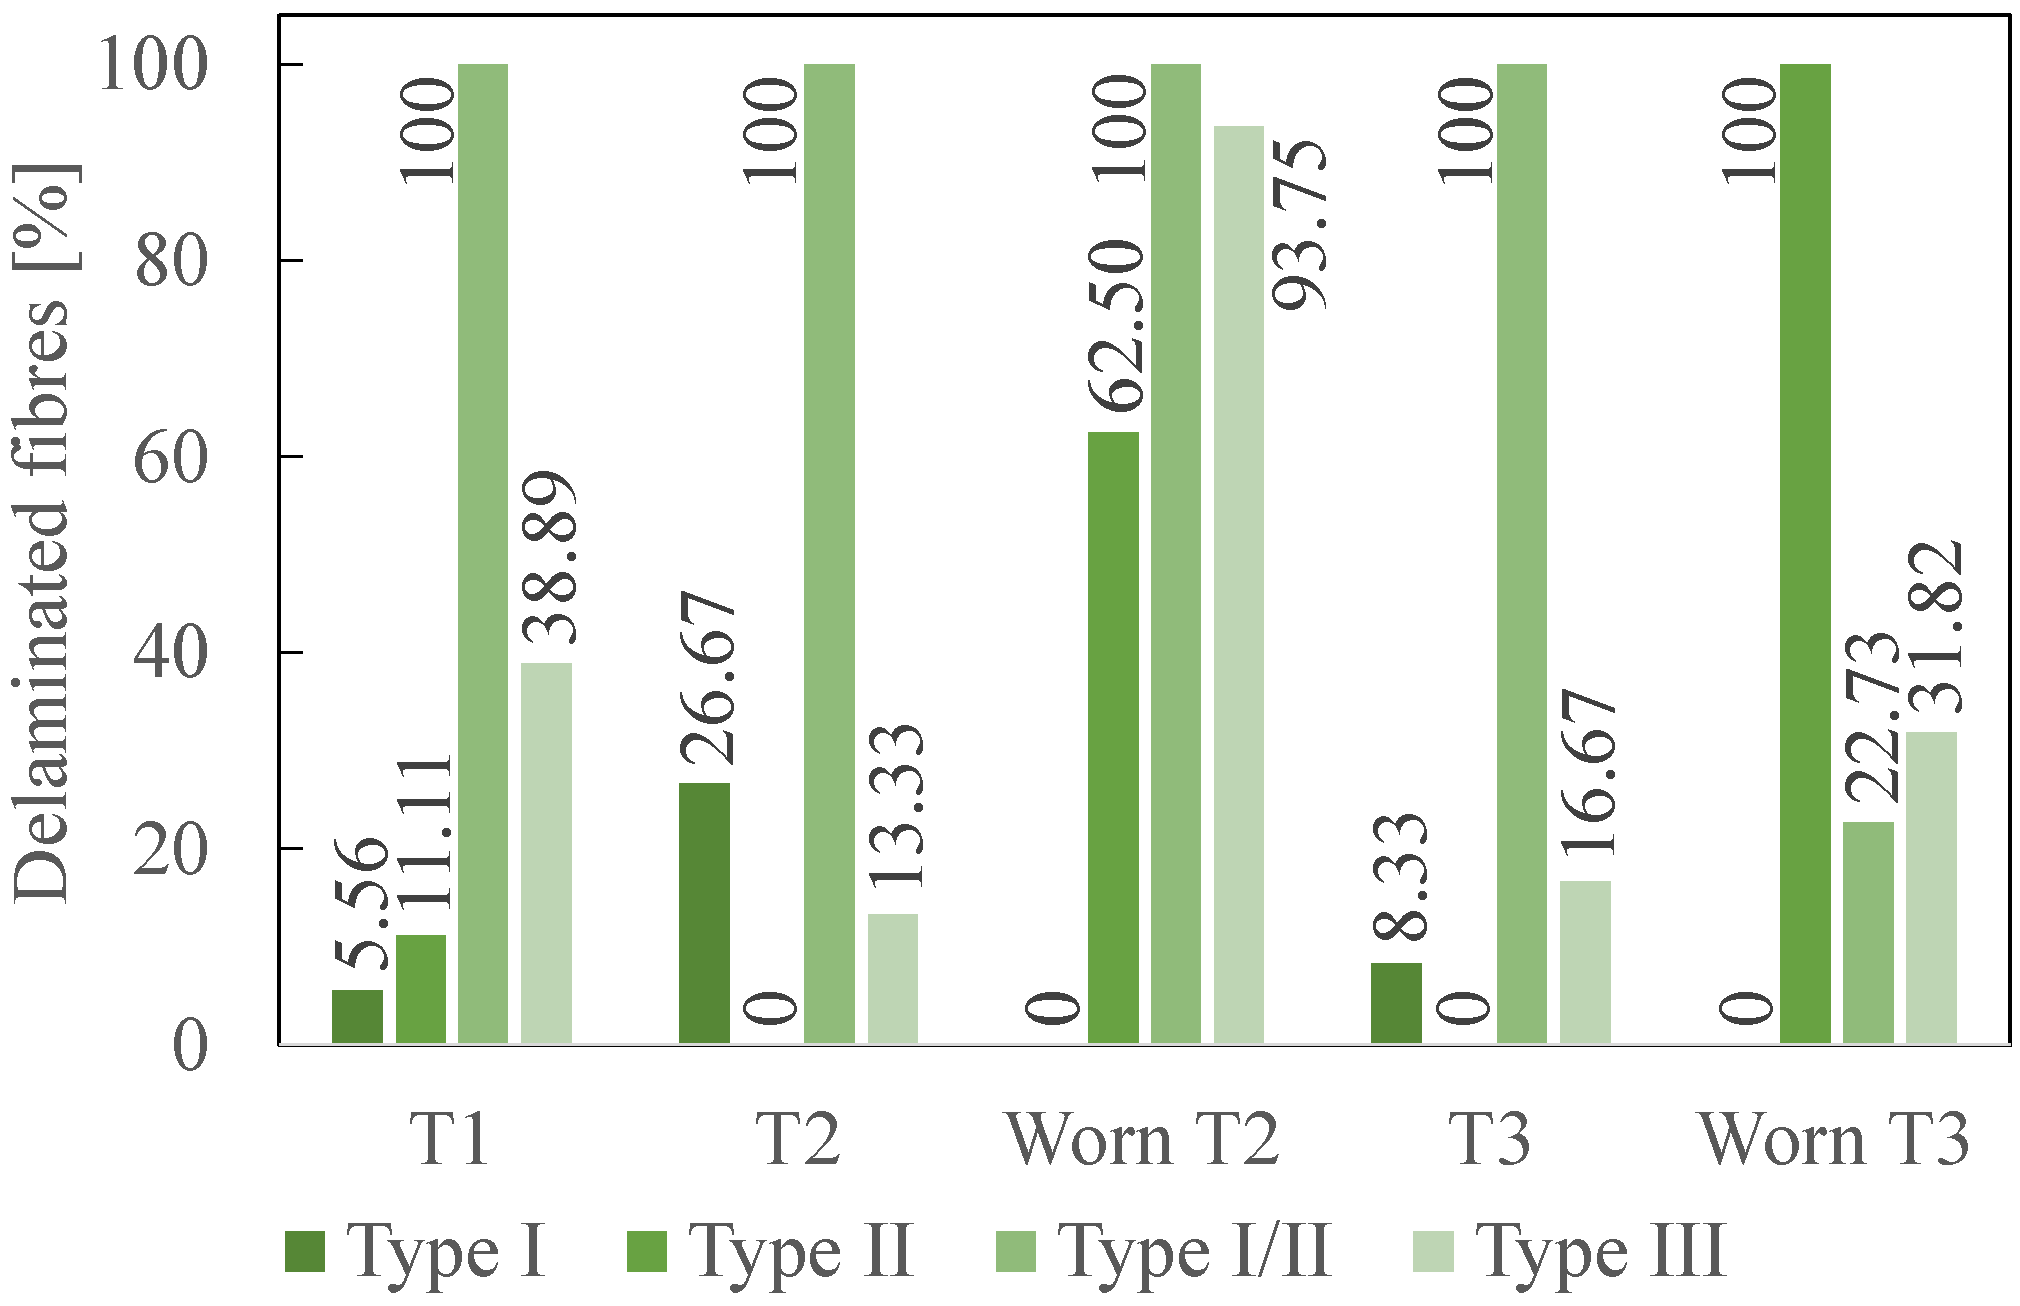
3.1. Delamination
3.1.1. Fresh State
3.1.2. Worn State
3.1.3. Comparison of the Fresh and Worn States
3.2. Cutting Forces
3.3. Tool Life
3.3.1. T2: Cemented Tungsten Carbide Cutting Tool
3.3.2. T3: PCD Cutting Tool
4. Discussion
4.1. Delamination
4.2. Cutting Forces
4.3. Analysis of the Link between the Tool Wear and the Lifespan of the Cutting Tools Regarding Their Materials
5. Conclusions
- At the fresh state, the straight flute PCD tool (T3) provides the shortest and the lowest number of delaminated fibres at the fresh state and, therefore, the best results when compared to cemented carbide tools (burr tool, T1, and satcut geometry, T2).
- At the worn state, the total number of delaminated fibres increases for both PCD and T2 cemented carbide tools. However, the PCD tool still generates less delamination.
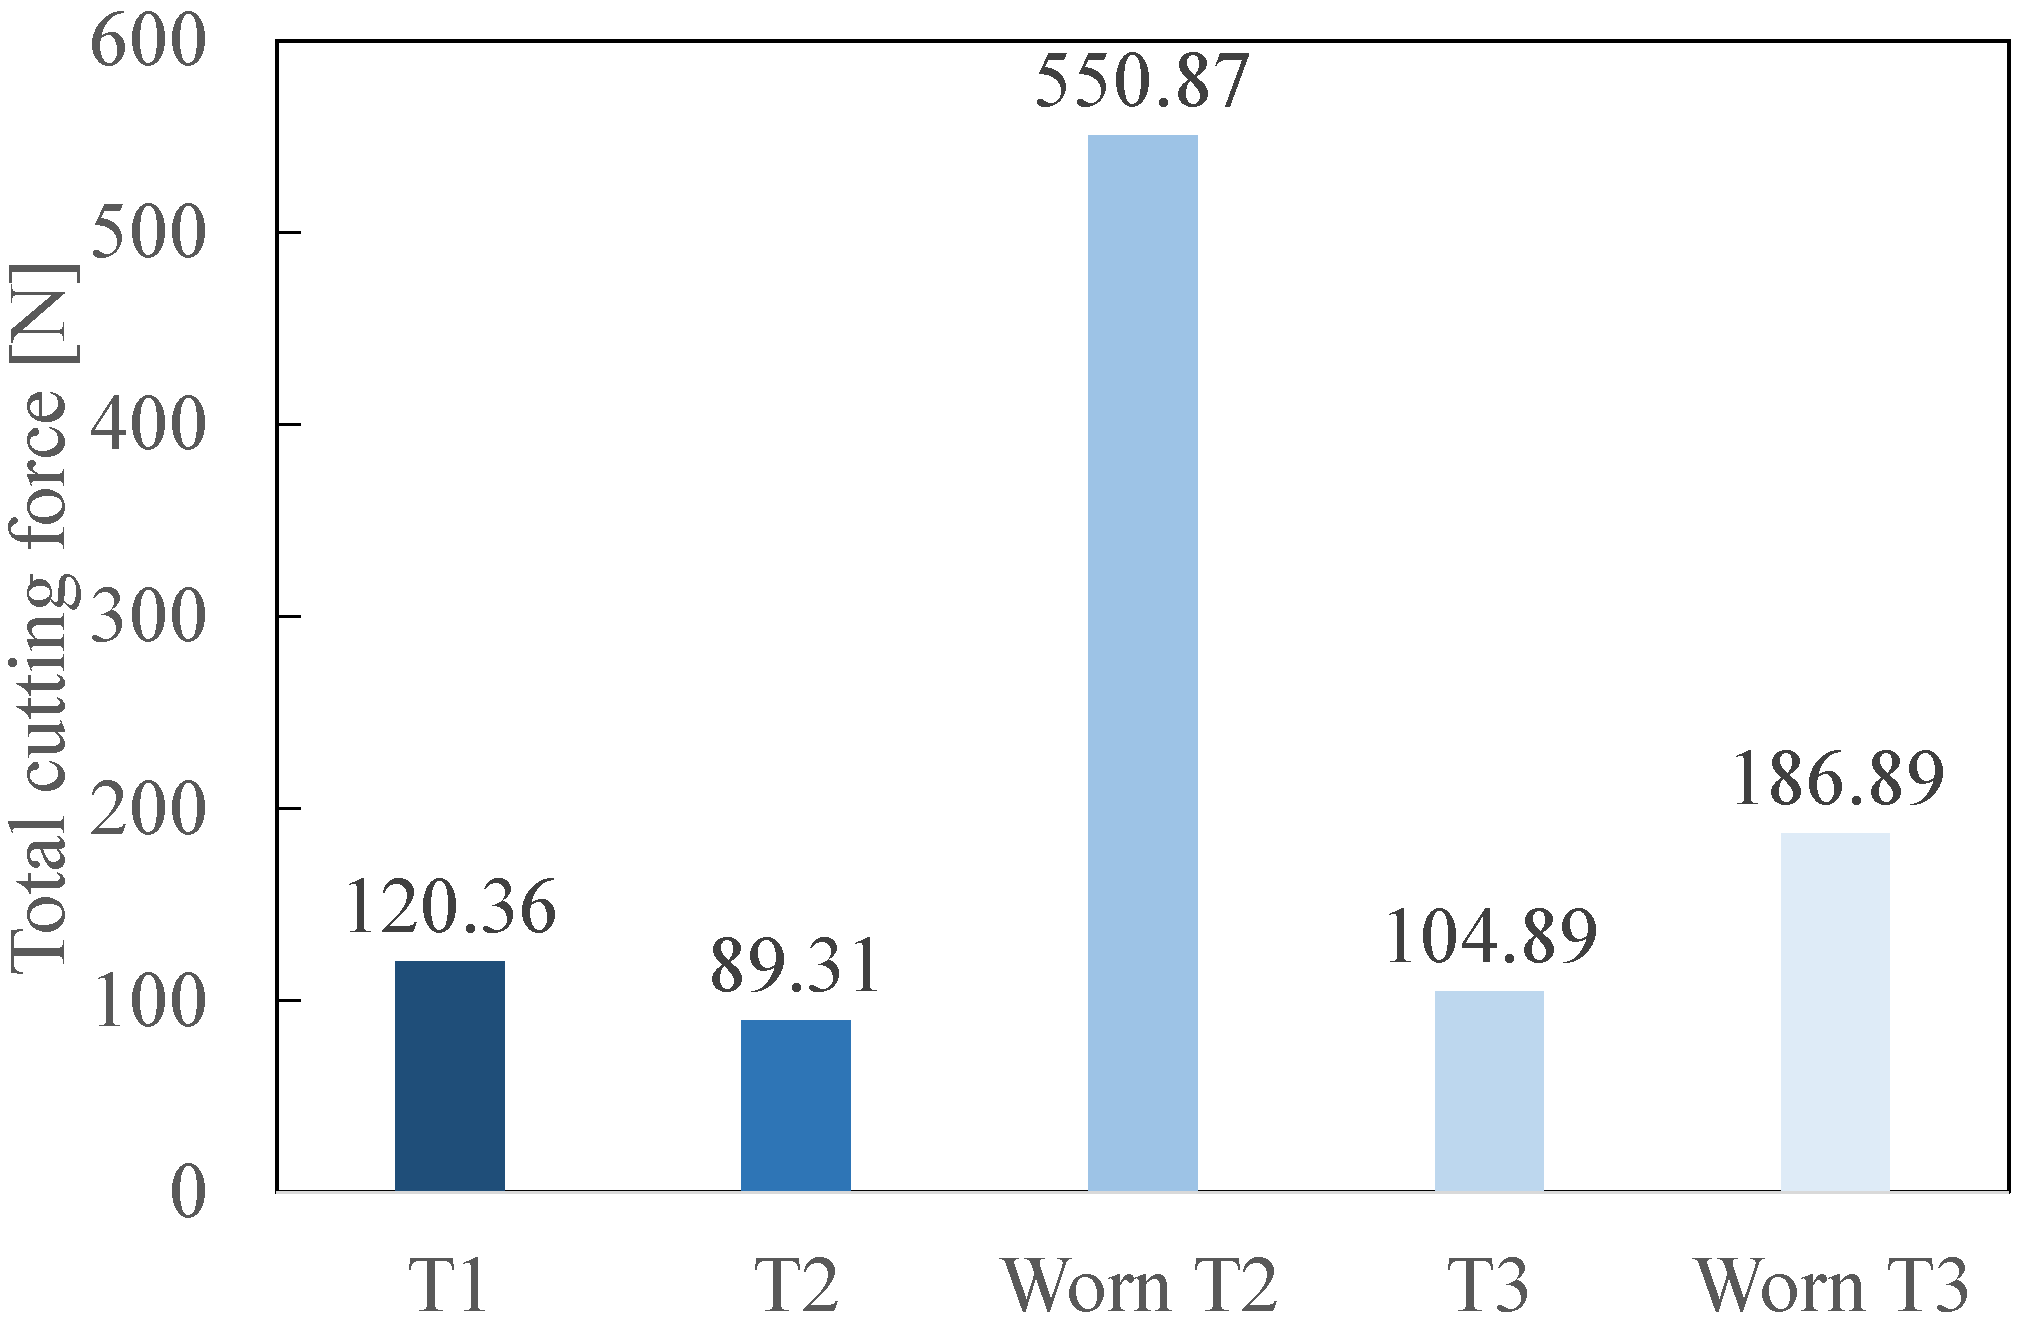
- The total cutting force is the lowest for the cemented carbide tool with more teeth (T2) than the PCD tool (T3) and finally the cemented carbide tool with the same number of teeth as the PCD tool (T1). Wear leads to an increase of the cutting force. The increase for the PCD tool is, however, far smaller than for the T2 cemented carbide tool. The performance of the worn PCD tool is therefore the best thanks to a lower flank wear.
- The higher resistance to wear and the ability to be ground allows T3 (PCD) to machine a length three times longer than T2 (cemented carbide). Therefore, even if T3 is more expensive than T2, the cost per meter of T3 is 68% less expensive than for T3.
Author Contributions
Funding
Data Availability Statement
Acknowledgments
Conflicts of Interest
References
- Rajak, D.K.; Pagar, D.D.; Kumar, R.; Pruncu, C.I. Recent Progress of Reinforcement Materials: A Comprehensive Overview of Composite Materials. J. Mater. Res. Technol. 2019, 8, 6354–6374. [Google Scholar] [CrossRef]
- Clyne, T.W.; Hull, D. An Introduction to Composite Materials. Available online: https://www.cambridge.org/highereducation/books/an-introduction-to-composite-materials/402C0AAFF04754C676E22D2B1F9080DB (accessed on 3 March 2022).
- Bai, J. Advanced Fibre-Reinforced Polymer (FRP) Composites for Structural Applications; Woodhead Publishing Limited: Cambridge, UK, 2013; ISBN 978-0-85709-418-6. [Google Scholar]
- Sheikh-Ahmad, J.Y. Machining of Polymer Composites; Springer: Boston, MA, USA, 2009; ISBN 978-0-387-35539-9. [Google Scholar]
- Witten, E.; Mather, V.; Sauer, M.; Kühnel, M. Composites Market Report 2018: Market developments, trends, outlooks and challenges; Carbon Composites: Frankfurt, Germany, 2018. [Google Scholar]
- Panneerselvam, T.; Raghuraman, S.; Kandavel, T.K.; Mahalingam, K. Evaluation and Analysis of Delamination during Drilling on Sisal-Glass Fibres Reinforced Polymer. Meas. J. Int. Meas. Confed. 2020, 154, 107462. [Google Scholar] [CrossRef]
- Geier, N.; Davim, J.P.; Szalay, T. Advanced Cutting Tools and Technologies for Drilling Carbon Fibre Reinforced Polymer (CFRP) Composites: A Review. Compos. Part A Appl. Sci. Manuf. 2019, 125, 105552. [Google Scholar] [CrossRef]
- Cepero-Mejías, F.; Curiel-Sosa, J.L.; Blázquez, A.; Yu, T.T.; Kerrigan, K.; Phadnis, V.A. Review of Recent Developments and Induced Damage Assessment in the Modelling of the Machining of Long Fibre Reinforced Polymer Composites. Compos. Struct. 2020, 240, 112006. [Google Scholar] [CrossRef]
- Bayraktar, Ş.; Turgut, Y. Determination of Delamination in Drilling of Carbon Fiber Reinforced Carbon Matrix Composites/Al 6013-T651 Stacks. Measurement 2020, 154, 107493. [Google Scholar] [CrossRef]
- Prashanth, I.S.N.V.R.; Ravi Shankar, D.V.; Manzoor Hussain, M.; Chandra Mouli, B. Critical Analysis in Milling of GFRP Composites by Various End Mill Tools. Mater. Today Proc. 2018, 5, 14607–14617. [Google Scholar] [CrossRef]
- Sheikh-Ahmad, J.Y.; Dhuttargaon, M.; Cheraghi, H. New Tool Life Criterion for Delamination Free Milling of CFRP. Int. J. Adv. Manuf. Technol. 2017, 92, 2131–2143. [Google Scholar] [CrossRef]
- Colligan, K.; Ramulu, M. The Effect of Edge Trimming on Composite Surface Plies. Manuf. Rev. 1992, 5, 274–283. [Google Scholar]
- Geng, D.; Liu, Y.; Shao, Z.; Lu, Z.; Cai, J.; Li, X.; Jiang, X.; Zhang, D. Delamination Formation, Evaluation and Suppression during Drilling of Composite Laminates: A Review. Compos. Struct. 2019, 216, 168–186. [Google Scholar] [CrossRef]
- Geng, D.; Liu, Y.; Shao, Z.; Zhang, M.; Jiang, X.; Zhang, D. Delamination Formation and Suppression during Rotary Ultrasonic Elliptical Machining of CFRP. Compos. Part B Eng. 2020, 183, 107698. [Google Scholar] [CrossRef]
- Davim, J.P. Machining Composite Materials; John Wiley & Sons, Ltd.: Hoboken, NJ, USA, 2009; ISBN 978-1-84821-170-4. [Google Scholar]
- Hintze, W.; Brügmann, F. Influence of Curved Workpiece Contours on Delamination During End Milling of FRP. Procedia CIRP 2017, 62, 62–67. [Google Scholar] [CrossRef]
- Janardhan, P.; Sheikh-Ahmad, J.; Cheraghi, H. Edge Trimming of CFRP with Diamond Interlocking Tools. In Proceedings of the Aerospace Manufacturing and Automated Fastening Conference and Exhibition, Toulouse, France, 11 September 2006. [Google Scholar]


| vc (m/min) | vf (mm/min) | Total Cutting Distance (mm) |
|---|---|---|
| 502 | 420 | 120 per coupon |
| Dimension (mm) | Composition | Fibre Orientation | Density of Reinforcement (g/m2) |
|---|---|---|---|
| 90 × 90 × 4 | 76% resin–24% reinforcement (22% glass) | (0°/90°) | 800 |
| T1 | T2 | T3 | |
|---|---|---|---|
| Material | Cemented tungsten carbide (uncoated) | Cemented tungsten carbide (uncoated) | PCD |
| Diameter (mm) | 10 | 10 | 10 |
| Number of end-mill teeth | 2 | 6 | 2 |
| Peripheral tooth shape | Pyramidal | Trapezoidal | Straight edge inclined |
| Illustration |  |  |  |
| T2 | T3 | |
|---|---|---|
| Cutting distance (m) | 235 | 729 |
| Fresh | Worn | |||||
| Total Cutting Force (N) | # Delaminated Fibres | Total Cutting Force (N) | # Delaminated Fibres | |||
| T2 | 89.31 | 21 | 550.87 | 41 | ||
| T3 | 104.89 | 15 | 186.89 | 34 | ||
| Life and Costs | Results | |||||
| Tool Cost (%) | Tool Life (%) | Resharpening Cost (Tool Cost %) | # Resharpening Operations | Tool Life (%) | Tool Cost per Meter (%/m) | |
| T2 | 100 | 100 | 0 | 0 | 100 | 100 |
| T3 | 259 | 310 | 82 | 10 | 3410 | 32 |
Publisher’s Note: MDPI stays neutral with regard to jurisdictional claims in published maps and institutional affiliations. |
© 2022 by the authors. Licensee MDPI, Basel, Switzerland. This article is an open access article distributed under the terms and conditions of the Creative Commons Attribution (CC BY) license (https://creativecommons.org/licenses/by/4.0/).
Share and Cite
Ducobu, F.; Mélice, E.; Rivière-Lorphèvre, E.; Beuscart, T.; Aizpuru, O.; Granjon, A.; Flores, P.; Soriano, D.; Cuesta, M.; Arrazola, P.-J. Sensitivity Analysis of Various Geometries of PCD and Cemented Tungsten Carbide Cutting Tools during the Milling of GFRP Composite. Polymers 2022, 14, 1524. https://doi.org/10.3390/polym14081524
Ducobu F, Mélice E, Rivière-Lorphèvre E, Beuscart T, Aizpuru O, Granjon A, Flores P, Soriano D, Cuesta M, Arrazola P-J. Sensitivity Analysis of Various Geometries of PCD and Cemented Tungsten Carbide Cutting Tools during the Milling of GFRP Composite. Polymers. 2022; 14(8):1524. https://doi.org/10.3390/polym14081524
Chicago/Turabian StyleDucobu, François, Eloïse Mélice, Edouard Rivière-Lorphèvre, Thomas Beuscart, Oihan Aizpuru, Aurélie Granjon, Paulo Flores, Denis Soriano, Mikel Cuesta, and Pedro-Jose Arrazola. 2022. "Sensitivity Analysis of Various Geometries of PCD and Cemented Tungsten Carbide Cutting Tools during the Milling of GFRP Composite" Polymers 14, no. 8: 1524. https://doi.org/10.3390/polym14081524
APA StyleDucobu, F., Mélice, E., Rivière-Lorphèvre, E., Beuscart, T., Aizpuru, O., Granjon, A., Flores, P., Soriano, D., Cuesta, M., & Arrazola, P.-J. (2022). Sensitivity Analysis of Various Geometries of PCD and Cemented Tungsten Carbide Cutting Tools during the Milling of GFRP Composite. Polymers, 14(8), 1524. https://doi.org/10.3390/polym14081524