
A New Methodology Based on Cell-Wall Hole Analysis for the Structure-Acoustic Absorption Correlation on Polyurethane Foams


Abstract
:
1. Introduction
2. Materials and Methods
2.1. Materials
2.2. Fabrication Procedure
2.3. Foams Characterization
2.3.1. Density
2.3.2. Open Cell Content
2.3.3. Acoustic Properties
2.3.4. Cellular Structure Analysis
3. Results and Discussion
3.1. Foam Properties
3.2. Cellular Structure Characterization
3.3. Acoustic Properties
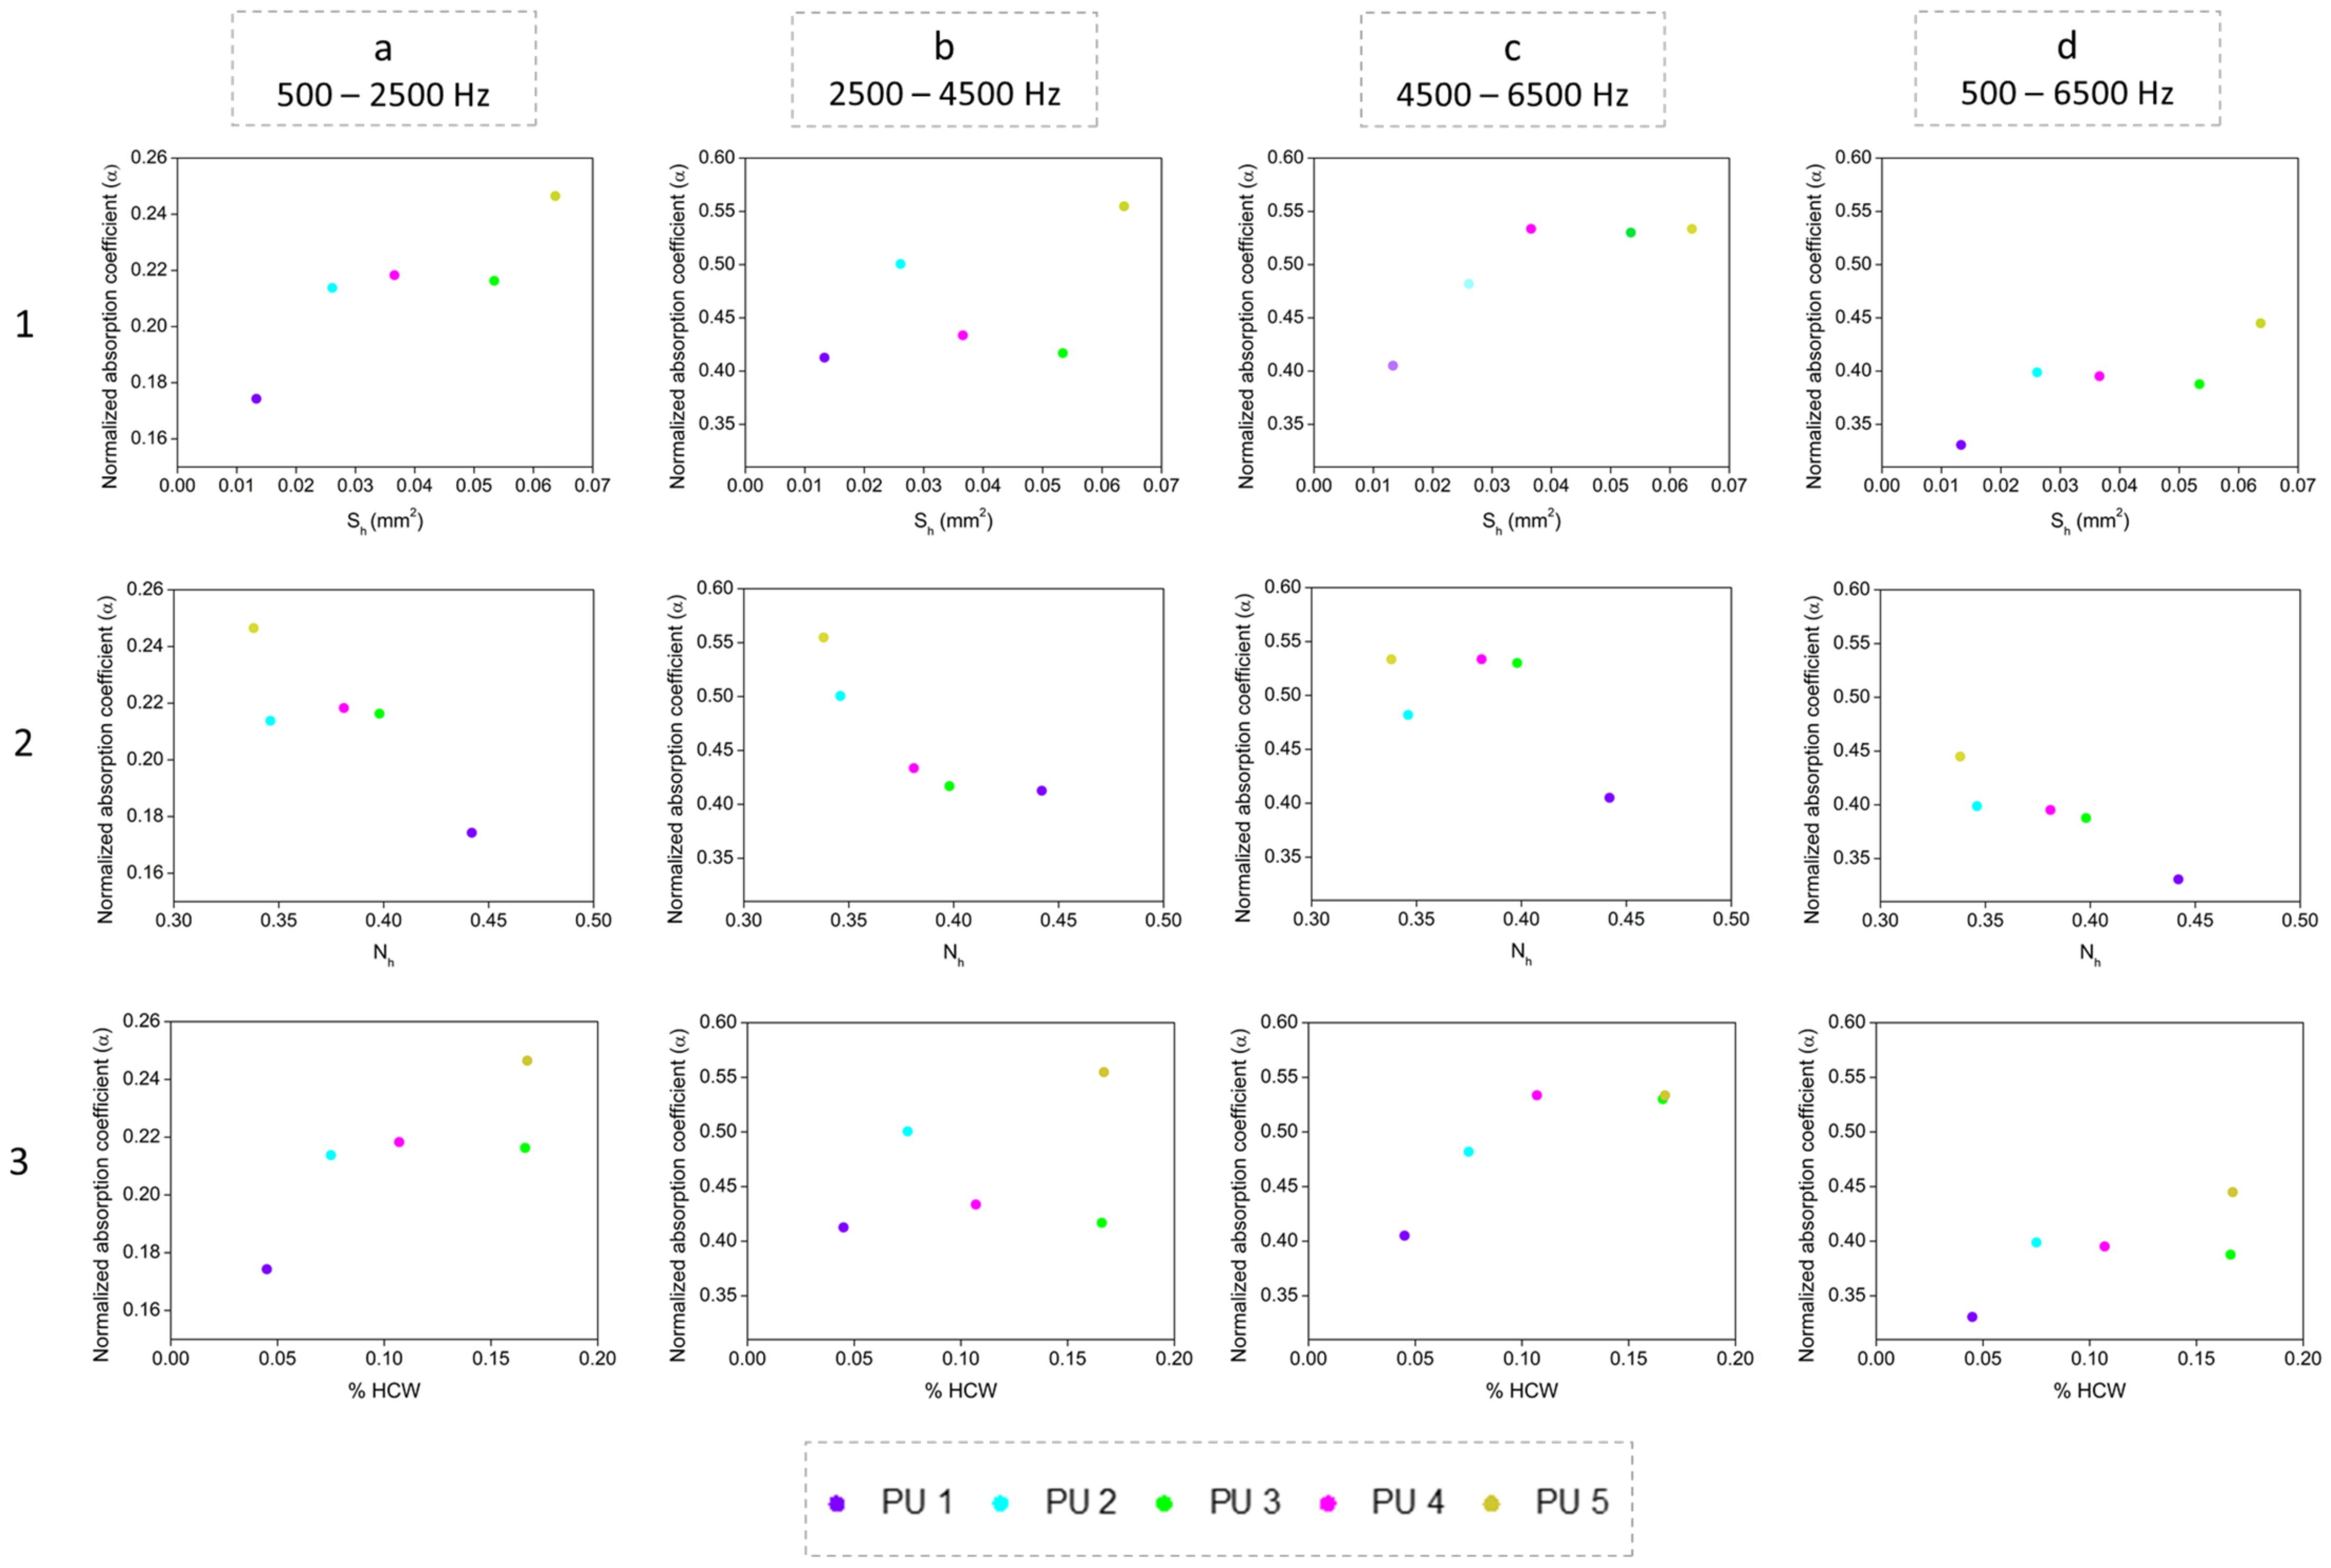
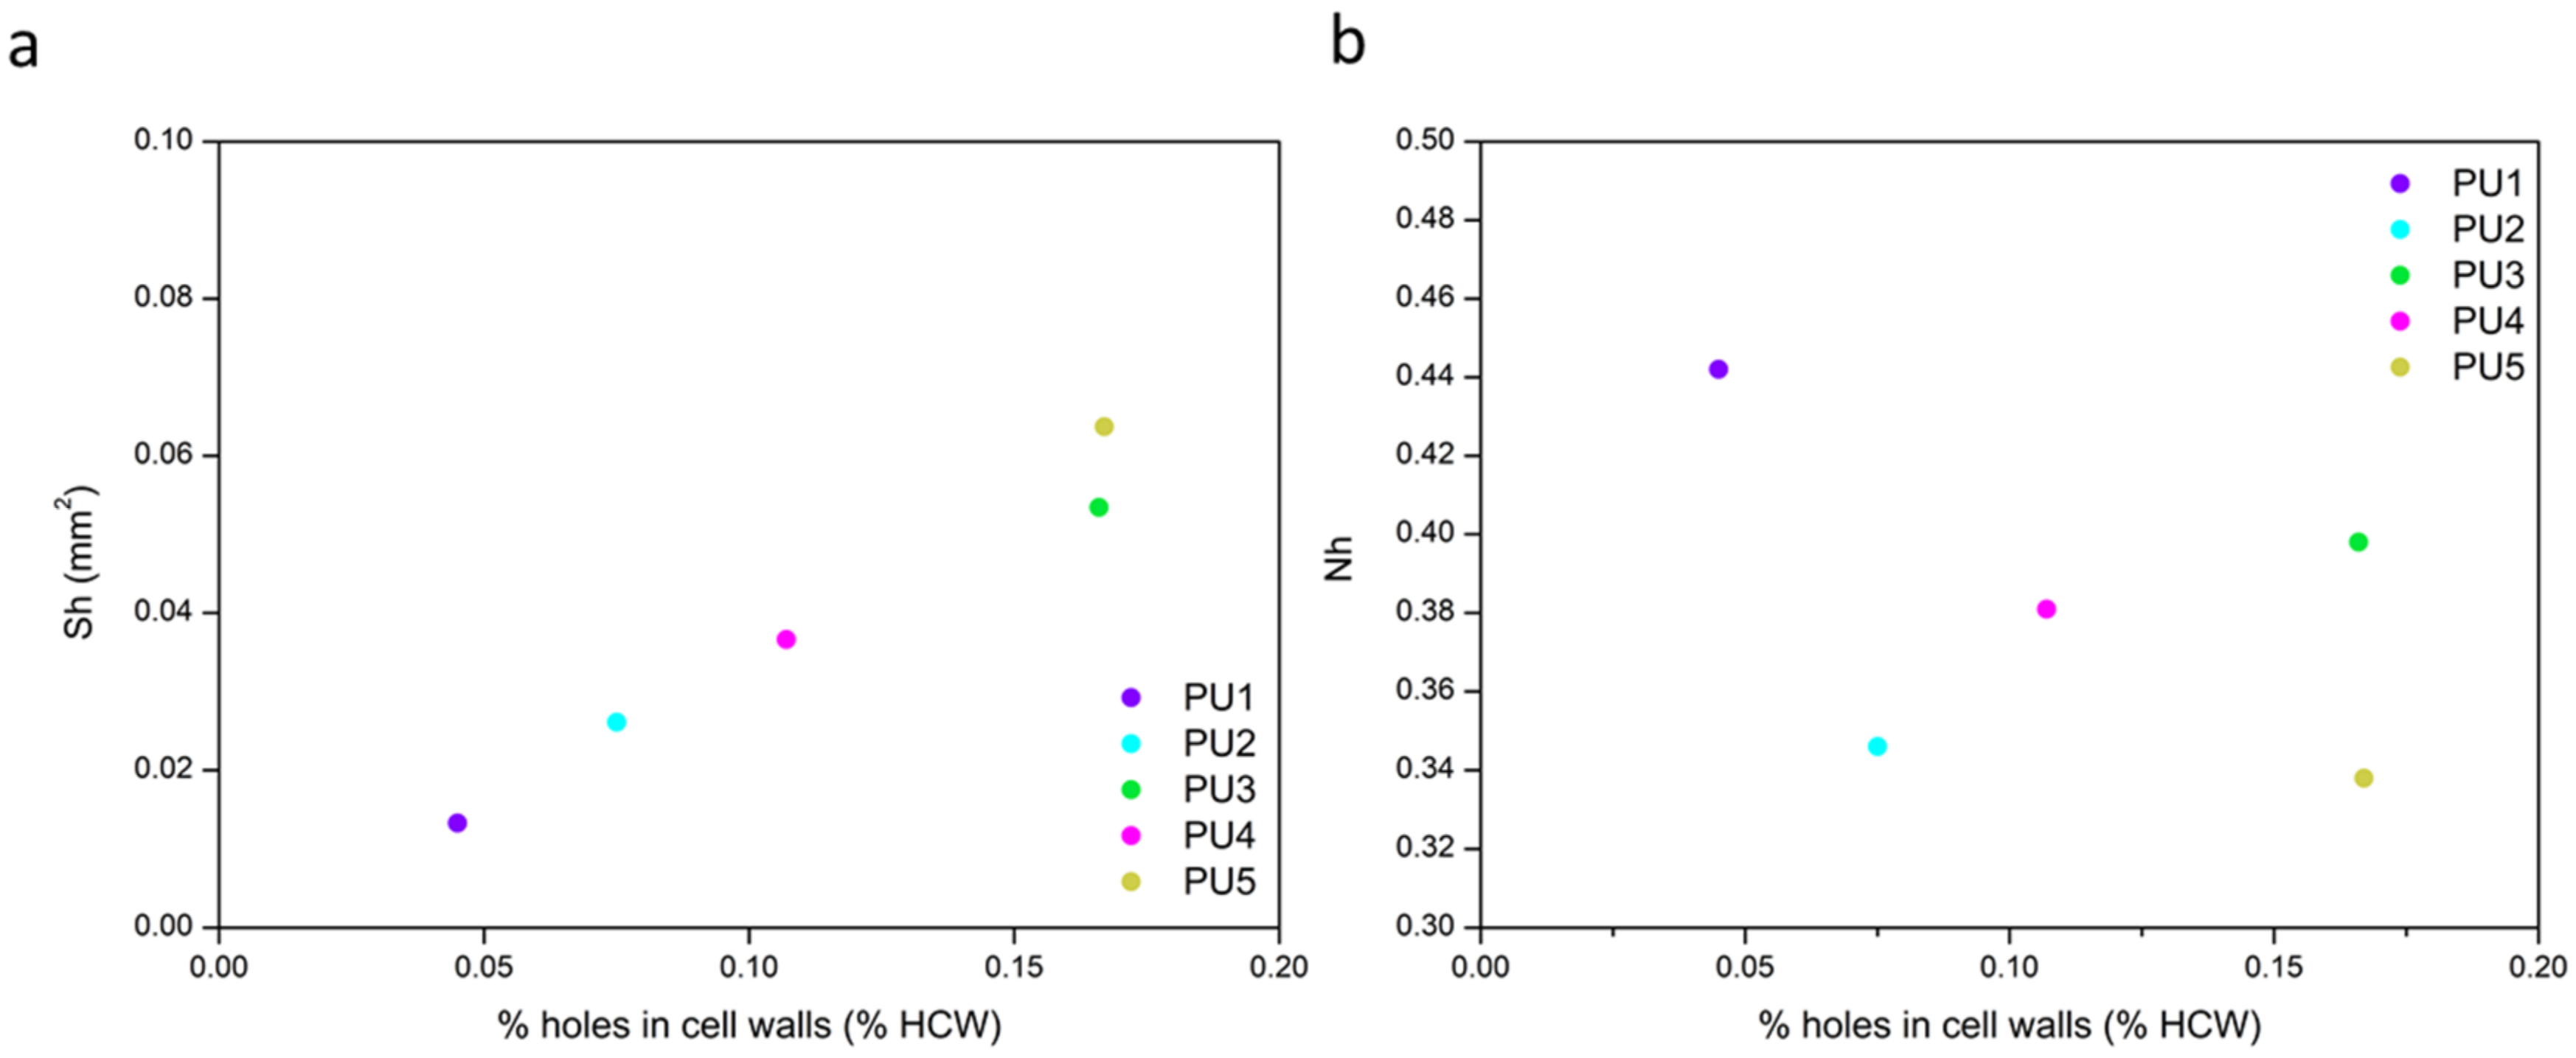
3.4. Relationship between Cellular Structure and Sound Absorption
4. Conclusions
Author Contributions
Funding
Institutional Review Board Statement
Informed Consent Statement
Data Availability Statement
Conflicts of Interest
References
- Directive 2002/49/ec of the European Parliament and of the Council of 25 June 2002 relating to the assessment and management of environmental noise. Off. J. Eur. Communities 2002, 189, 12–25.
- Cao, L.; Fu, Q.; Si, Y.; Ding, B.; Yu, J. Porous materials for sound absorption. Compos. Commun. 2018, 10, 25–35. [Google Scholar] [CrossRef]
- Hoang, M.T.; Bonnet, G.; Luu, H.T.; Perrot, C. Linear elastic properties derivation from microstructures representative of transport parameters. J. Acoust. Soc. Am. 2014, 135, 3172–3185. [Google Scholar] [CrossRef] [PubMed]
- Sagartzazu, X.; Hervella-Nieto, L.; Pagalday, J.M. Review in Sound Absorbing Materials. Arch. Comput. Methods Eng. 2008, 15, 311–342. [Google Scholar] [CrossRef]
- Kim, J.S.; Kim, J.H. Sound absorption behavior of flexible polyurethane foams including high molecular-weight copolymer polyol. Polym. Adv. Technol. 2018, 29, 852–859. [Google Scholar]
- Sung, G.; Kim, S.K.; Kim, J.W.; Kim, J.H. Effect of isocyanate molecular structures in fabricating flexible polyurethane foams on sound absorption behavior. Polym. Test. 2016, 53, 156–164. [Google Scholar] [CrossRef]
- Gwon, J.G.; Kim, S.K.; Kim, J.H. Sound absorption behavior of flexible polyurethane foams with distinct cellular structures. Quat. Int. 2015, 387, 132. [Google Scholar] [CrossRef]
- Zhu, W.; Chen, S.; Wang, Y.; Zhu, T.; Jiang, Y. Sound absorption behavior of polyurethane foam composites with different ethylene propylene diene monomer particles. Arch. Acoust. 2018, 43, 403–411. [Google Scholar]
- Hajizadeh, R.; Khavanin, A.; Barmar, M.; Jafari, A.J.; Dehghan, S.F. Improving the sound absorption properties of flexible polyurethane (PU) foam using nanofibers and nanoparticles. Sound Vib. 2019, 53, 207–222. [Google Scholar] [CrossRef]
- Verdejo, R.; Stämpfli, R.; Alvarez-Lainez, M.; Mourad, S.; Rodriguez-Perez, M.A.; Brühwiler, P.A.; Shaffer, M. Enhanced acoustic damping in flexible polyurethane foams filled with carbon nanotubes. Compos. Sci. Technol. 2009, 69, 1564–1569. [Google Scholar] [CrossRef]
- Seddeq, H.S. Factors Influencing Acoustic Performance of Sound Absorptive Materials. Aust. J. Basic Appl. Sci. 2009, 3, 4610–4617. [Google Scholar]
- Vašina, M.; Hružík, L.; Bureček, A.; Mahdal, M.; Monková, K.; Monka, P.P. A study of factors influencing sound absorption properties of porous materials. Manuf. Technol. 2019, 19, 156–160. [Google Scholar] [CrossRef]
- Yasunaga, K.; Neff, R.A.; Zhang, X.D.; Macosko, C.W. Study of cell opening in flexible polyurethane foam. J. Cell. Plast. 1996, 32, 427–447. [Google Scholar] [CrossRef]
- Zhang, C.; Li, J.; Hu, Z.; Zhu, F.; Huang, Y. Correlation between the acoustic and porous cell morphology of polyurethane foam: Effect of interconnected porosity. Mater. Des. 2012, 41, 319–325. [Google Scholar] [CrossRef]
- Basirjafari, S. Morphological investigation of carbon nanotube reinforced polyurethane foam to analyse its acoustical and non-acoustical properties. Micro Nano Lett. 2021, 16, 157–163. [Google Scholar] [CrossRef]
- Mester, E.; Pecsmány, D.; Jálics, K.; Filep, Á.; Varga, M.; Gráczer, K.; Viskolcz, B.; Fiser, B. Exploring the Potential to Repurpose Flexible Moulded Polyurethane Foams as Acoustic Insulators. Polymers 2022, 14, 163. [Google Scholar] [CrossRef]
- Olcay, H.; Kocak, E.D. The mechanical, thermal and sound absorption properties of flexible polyurethane foam composites reinforced with artichoke stem waste fibers. J. Ind. Text. 2020, 1528083720934193. [Google Scholar] [CrossRef]
- Imai, Y.; Asano, T. Studies of acoustical absorption of flexible polyurethane foam. J. Appl. Polym. Sci. 1982, 27, 183–195. [Google Scholar] [CrossRef]
- Kim, J.M.; Kim, D.H.; Kim, J.; Lee, J.W.; Kim, W.N. Effect of graphene on the sound damping properties of flexible polyurethane foams. Macromol. Res. 2017, 25, 190–196. [Google Scholar] [CrossRef]
- Abdollahi Baghban, S.; Khorasani, M.; Mir Mohamad Sadeghi, G. Soundproofing flexible polyurethane foams: Effect of chemical structure of chain extenders on micro-phase separation and acoustic damping. J. Cell. Plast. 2020, 56, 167–185. [Google Scholar] [CrossRef]
- Baghban, S.A.; Khorasani, M.; Sadeghi, G.M.M. Soundproofing performance of flexible polyurethane foams as a fractal object. J. Polym. Res. 2020, 27, 28–30. [Google Scholar] [CrossRef]
- Lopez-Gonzalez, E.; Muñoz-Pascual, S.; Saiz-Arroyo, C.; Rodriguez-Perez, M.A. Crosslinked ethylene butyl acrylate copolymer foams with different cellular structure interconnectivity and tortuosity: Microstructure and physical properties. J. Appl. Polym. Sci. 2019, 136, 48161. [Google Scholar] [CrossRef]
- Rodriguez-Perez, M.A.; Álvarez-Láinez, M.; De Saja, J.A. Microstructure and Physical Properties of Open-Cell Polyolefin Foams. J. Appl. Polym. Sci. 2009, 114, 1176–1186. [Google Scholar] [CrossRef]
- ASTM D1622-08; Standard Test Method for Apparent Density of Rigid Cellular Plastics. ASTM International: West Conshohocken, PA, USA, 2008.
- ASTM D6226-10; Standard Test Method for Open Cell Content of Rigid Cellular Plastics. ASTM International: West Conshohocken, PA, USA, 2010.
- ASTM E1050-10; Standard Test Method for Impedance and Absorption of Acoustical Materials Using A Tube, Two Microphones and a Digital Frequency Analysis System. ASTM International: West Conshohocken, PA, USA, 2010.
- Pinto, J.; Solórzano, E.; Perez, M.A.R.; De Saja, J.A. Characterization of the cellular structure based on user-interactive image analysis procedures. J. Cell. Plast. 2013, 49, 555–575. [Google Scholar] [CrossRef]
- Dawson, J.R.; Shortall, J.B. The microstructure of rigid polyurethane foams. J. Mater. Sci. 1982, 17, 220–224. [Google Scholar] [CrossRef]
- Chen, S.; Jiang, Y.; Chen, J.; Wang, D. The Effects of Various Additive Components on the Sound Absorption Performances of Polyurethane Foams. Adv. Mater. Sci. Eng. 2015, 2015, 317561. [Google Scholar] [CrossRef] [Green Version]
- Berardi, U.; Iannace, G. Acoustic characterization of natural fibers for sound absorption applications. Build. Environ. 2015, 94, 840–852. [Google Scholar] [CrossRef]
- Park, J.H.; Minn, K.S.; Lee, H.R.; Yang, S.H.; Bin Yu, C.; Pak, S.Y.; Oh, C.S.; Song, Y.S.; Kang, Y.J.; Youn, J.R. Cell openness manipulation of low density polyurethane foam for efficient sound absorption. J. Sound Vib. 2017, 406, 224–236. [Google Scholar] [CrossRef]
- Akindoyo, J.O.; Beg, M.D.H.; Ghazali, S.; Islam, M.R.; Jeyaratnam, N.; Yuvaraj, A.R. Polyurethane types, synthesis and applications—A review. RSC Adv. 2016, 6, 114453–114482. [Google Scholar] [CrossRef] [Green Version]
- Szycher, M. Szycher’s Handbook of Polyurethanes, 2nd ed.; Nature: Boca Raton, FL, USA; CRC Press: Boca Raton, FL, USA, 2012. [Google Scholar]
- Doutres, O.; Atalla, N.; Dong, K. Effect of the microstructure closed pore content on the acoustic behavior of polyurethane foams. J. Appl. Phys. 2011, 110, 064901. [Google Scholar] [CrossRef]


| Sample | Density (ρ) (kg/m3) | Relative Density (ρr) | Open Cell Content (%) |
|---|---|---|---|
| PU1 | 27.74 | 0.024 | 91.02 |
| PU2 | 27.58 | 0.024 | 81.94 |
| PU3 | 27.37 | 0.024 | 81.34 |
| PU4 | 27.14 | 0.023 | 84.41 |
| PU5 | 27.05 | 0.023 | 85.88 |
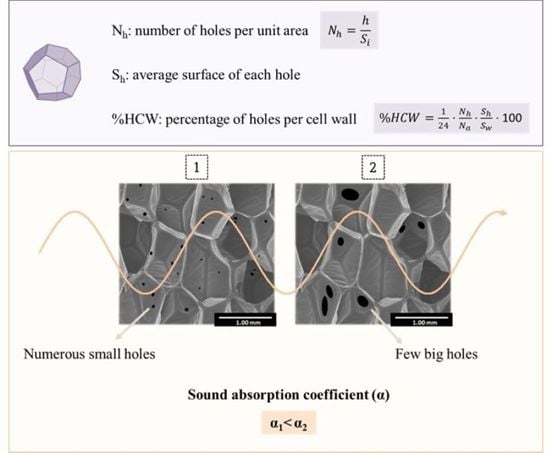
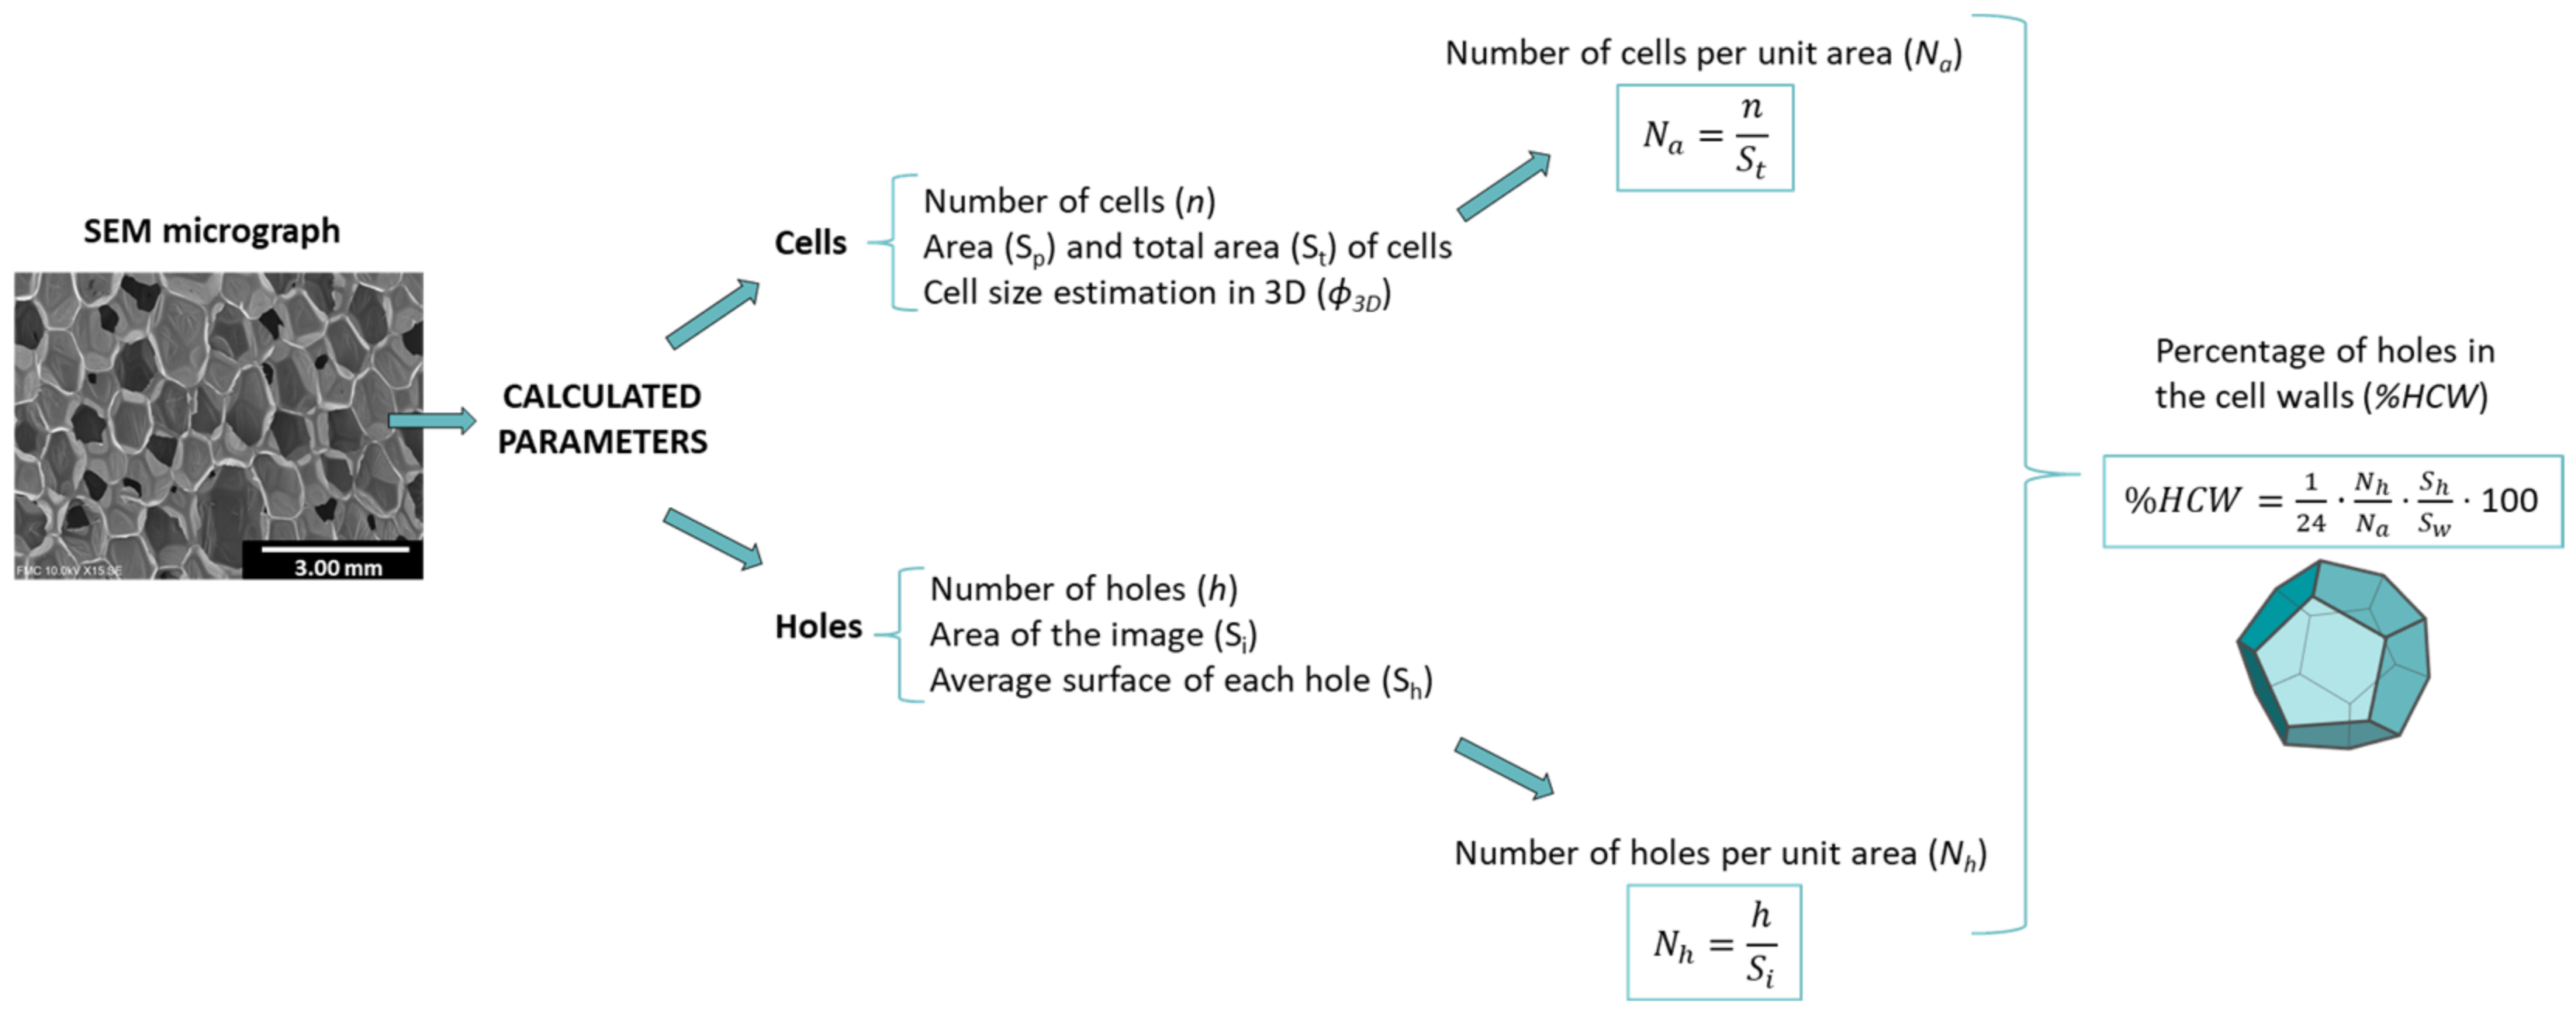
| Sample | Surface Holes (Sh) (mm2) | Nh (mm−2) | %HCW |
|---|---|---|---|
| PU1 | 1.33 × 10⁻² | 0.44 | 0.045 |
| PU2 | 2.61 × 10⁻² | 0.35 | 0.075 |
| PU3 | 5.34 × 10⁻² | 0.40 | 0.166 |
| PU4 | 3.66 × 10⁻² | 0.38 | 0.107 |
| PU5 | 6.37 × 10⁻² | 0.34 | 0.167 |
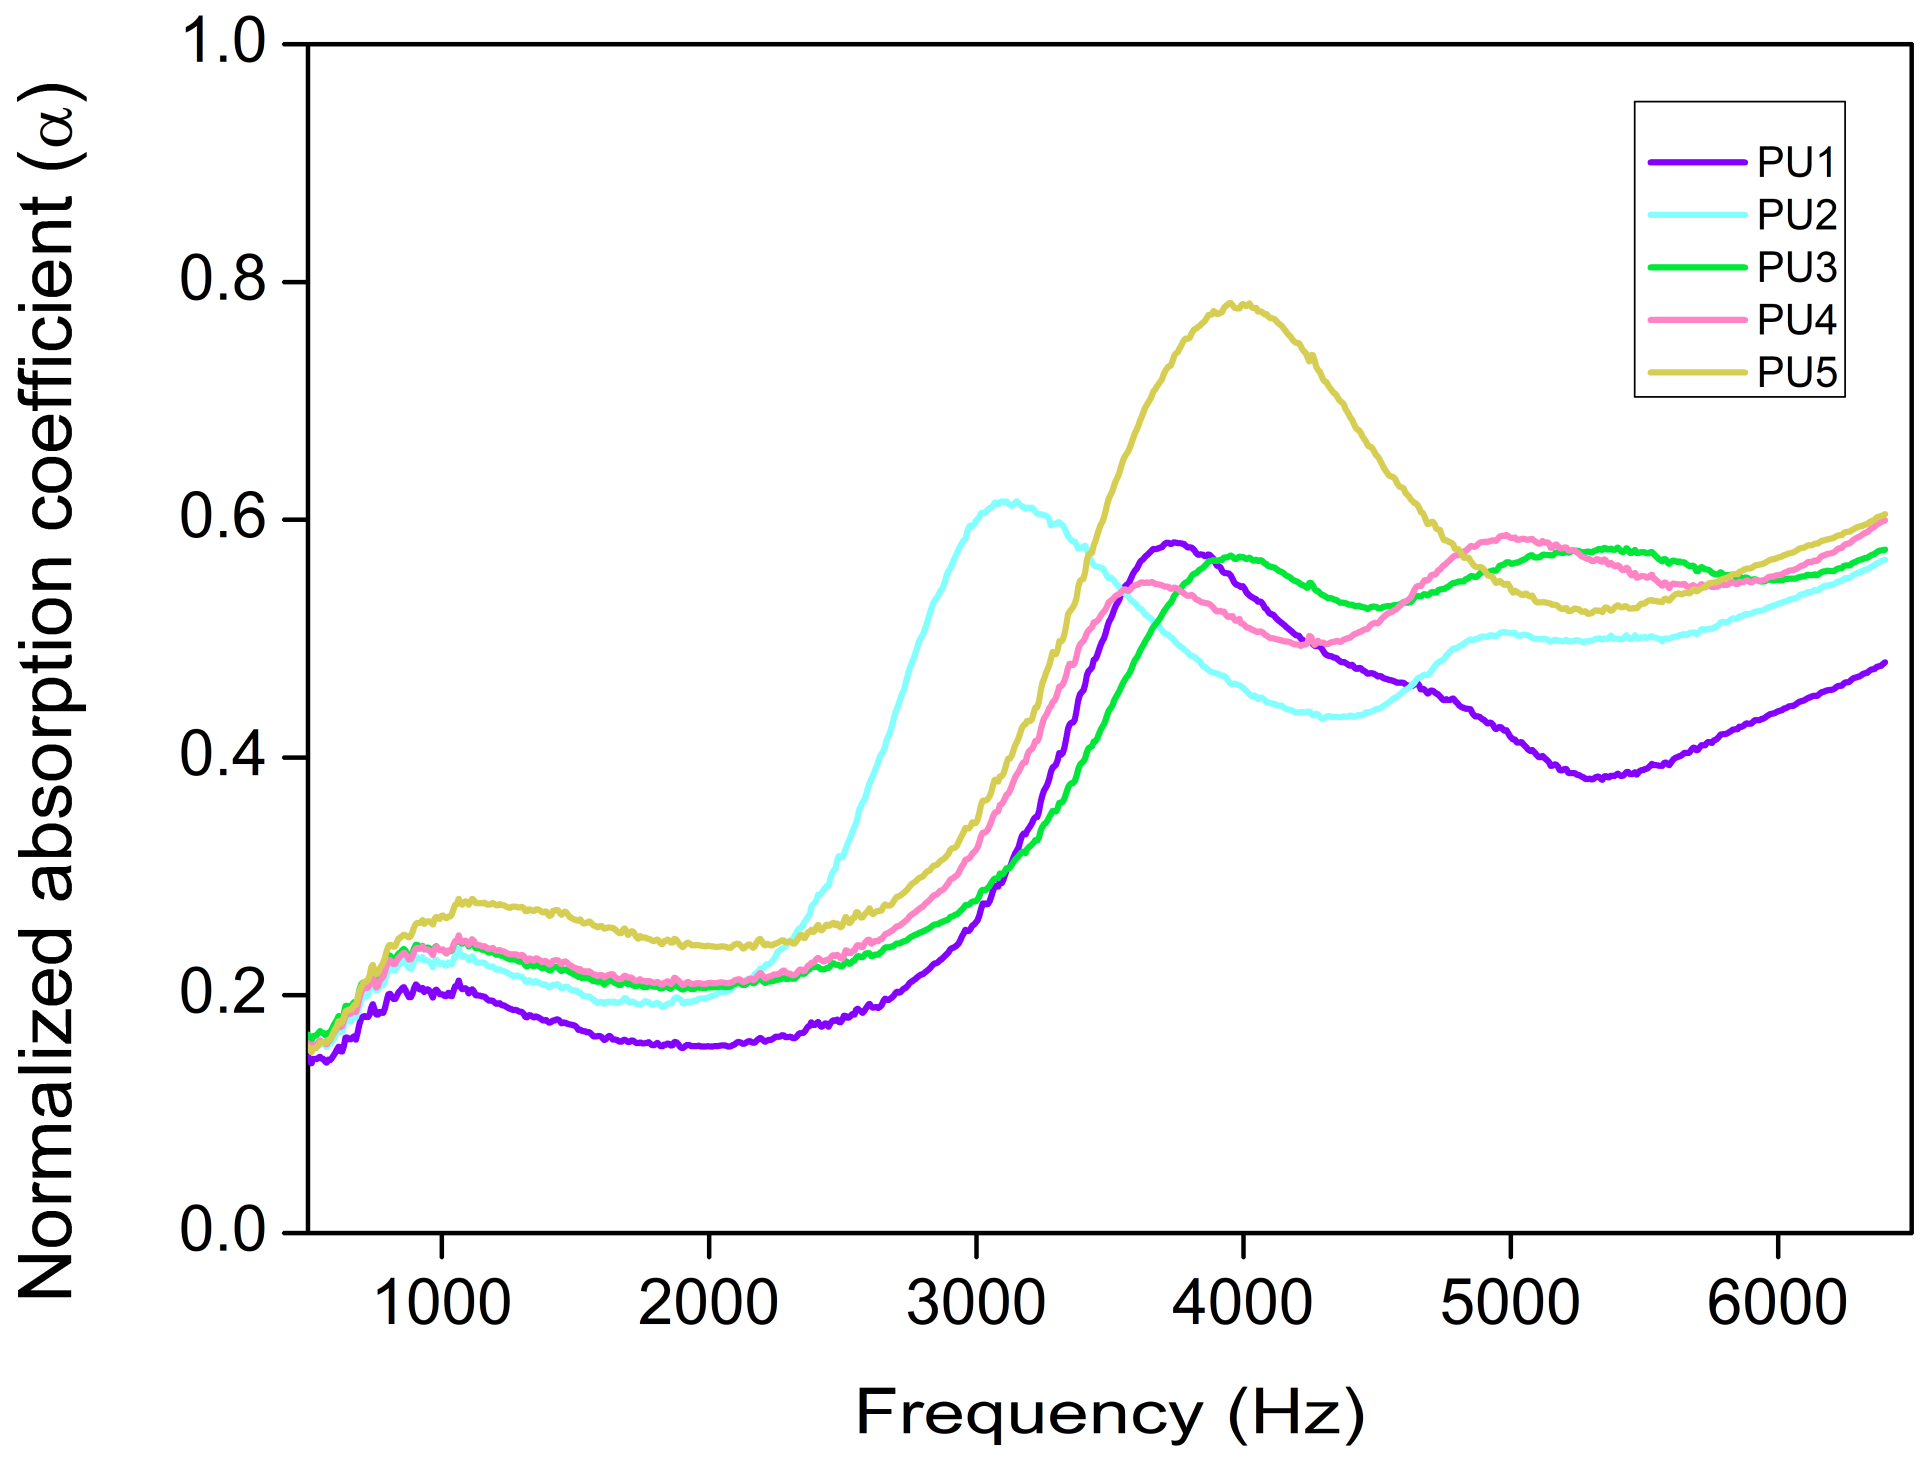
| Sample | α500–2500 Hz | α2500–4500 Hz | α4500–6500 Hz | α500–6500 Hz |
|---|---|---|---|---|
| PU1 | 0.1743 | 0.4127 | 0.4051 | 0.3307 |
| PU2 | 0.2138 | 0.5006 | 0.4819 | 0.3988 |
| PU3 | 0.2163 | 0.4169 | 0.5301 | 0.3877 |
| PU4 | 0.2183 | 0.4336 | 0.5336 | 0.3952 |
| PU5 | 0.2465 | 0.5548 | 0.5335 | 0.4449 |
Publisher’s Note: MDPI stays neutral with regard to jurisdictional claims in published maps and institutional affiliations. |
© 2022 by the authors. Licensee MDPI, Basel, Switzerland. This article is an open access article distributed under the terms and conditions of the Creative Commons Attribution (CC BY) license (https://creativecommons.org/licenses/by/4.0/).
Share and Cite
Merillas, B.; Villafañe, F.; Rodríguez-Pérez, M.Á. A New Methodology Based on Cell-Wall Hole Analysis for the Structure-Acoustic Absorption Correlation on Polyurethane Foams. Polymers 2022, 14, 1807. https://doi.org/10.3390/polym14091807
Merillas B, Villafañe F, Rodríguez-Pérez MÁ. A New Methodology Based on Cell-Wall Hole Analysis for the Structure-Acoustic Absorption Correlation on Polyurethane Foams. Polymers. 2022; 14(9):1807. https://doi.org/10.3390/polym14091807
Chicago/Turabian StyleMerillas, Beatriz, Fernando Villafañe, and Miguel Ángel Rodríguez-Pérez. 2022. "A New Methodology Based on Cell-Wall Hole Analysis for the Structure-Acoustic Absorption Correlation on Polyurethane Foams" Polymers 14, no. 9: 1807. https://doi.org/10.3390/polym14091807